
Abstract
The switch between automated and manual driving modes is currently an inevitable topic for automated vehicles. Understanding how long it takes drivers to stabilize physically and cognitively after the driving mode switch is important to maintain driving safety. Given that little attention has been paid to drivers’ stabilization time after the driving mode switch, this study focuses on drivers’ cognitive load and visual attention and aims to investigate drivers’ stabilization time after the driving mode switch. Twenty-eight participants drove in a high-fidelity driving simulator where they experienced mode switching from manual to automated and from automated to manual. Reaction time to the detection response task and on-road fixation durations were measured throughout the experiment to assess drivers’ cognitive load and visual attention. Results revealed that it took drivers 10 to 15 s to stabilize their cognitive load after taking over the manual control of the simulated vehicle, and 5 to 10 s to stabilize after relinquishing manual driving to the automated system. These findings indicate that drivers’ cognitive load and visual attention will fluctuate after driving mode switches and a buffer time should be provided to ensure driving safety. By exploring drivers’ cognitive load and visual attention after driving mode switches, this study offers valuable insights into the design of automated driving systems and helps to improve road safety. In developing automated driving systems, efforts should be made to identify an appropriate time window for drivers to perform stable driving performance and improve their in-vehicle experience.
In the last decade, automated driving has received tremendous attention in both academia and industry given its potential to improve road safety, enhance driving experience, and optimize transportation efficiency ( 1 ). The market has also witnessed the rapid development of autonomous vehicles, with the global autonomous car market projected to grow from USD 2.30 billion in 2024 to USD 38.78 billion by 2032 ( 2 ). According to the Society of Automotive Engineers, driving automation is classified into six levels ranging from level 0 (no automation) to level 5 (full automation) ( 3 ). Nowadays, level 2 driving automation systems are mainstream in the automotive industry. In level 2 driving automation, the system can control the vehicles’ longitudinal and lateral behavior, but drivers are still required to monitor the vehicle continuously and resume manual control whenever necessary. Many automobile manufacturers have become increasingly interested in developing higher levels of driving automation and plan to release them in the near future ( 4 ).
The transition from level 2 to level 3 is significant. In level 3, the automated system is able to perform all driving tasks, while drivers need to be prepared to regain control of the vehicle only when the system issues a take-over request (TOR) ( 5 ). Although much effort has been put into deploying and commercializing level 3 driving automation, safety concerns are still a major issue ( 6 ). This issue mainly centers around the driving mode switch, the process where the driver and automated driving system alternately control the vehicle, especially when switching from automated to manual driving mode, where drivers must take over vehicle control following a period in which they were not engaged in the driving task ( 7 ).
The switch from automated to manual driving is key for safety. One major issue in this takeover process is how long in advance the driver needs to be notified before the driving mode switch is initiated, which is called takeover request lead time (TORlt). TORlt refers to the time interval between the system issuing the TOR and the moment when a critical event occurs. To identify the TORlt some studies measured the time from the TOR to the time the drivers’ hands first touch the steering wheel or their feet touch the pedals. TORlt was estimated to be approximately 7 s ( 8 ). However, researchers note that the physical take-over response time is not reflective of the drivers’ ability to safely take over control of the vehicle ( 9 ). A successful switch does not end when the driver physically takes over control of the vehicle—drivers may indeed require additional time to fully perceive and understand traffic situations before making an adequate driving response to any road hazards ( 10 , 11 ). A crucial but understudied issue for the driving mode switch is the stabilization time, which represents the time it takes drivers to regain full control and exhibit consistent, safe driving performance following the driving mode switch ( 12 ). It can be measured by the time it takes drivers to recover their baseline state or performance level. Only a few studies investigated the stabilization time after switching from automated to manual driving mode, and different measures were employed to determine this.
Melnicuk et al. ( 10 ) aimed to determine stabilization times by examining drivers’ physiological state and driving performance following a switch of vehicle control. They measured lane position and drivers’ heart rate and found it took between 22 and 30 s to stabilize after switching from automated to manual driving. Gruden et al. ( 12 ) also used driving performance (e.g., speed, deceleration) and physiological measurements (e.g., heart rate, pupil diameter) to investigate the time required for drivers to stabilize after the switch to automated mode. Their findings showed that stabilization time varies depending on the measurement being considered. While the stabilization time was between 8 and 10 s when looking at the driver’s driving performance, it was more than 10 s when relying on the driver’s physiological measurements. Kim et al. ( 13 ) measured self-reported stabilization time after the automated-to-manual transition. In their study, drivers had to say “stable” aloud when they considered they had safely regained manual control of the vehicle. A mean stabilization time of 11.5 s was found in their study. One study conducted on commercial motor vehicles used driving performance (e.g., acceleration, deceleration, and headway) as a measure of stabilization. Their results indicated that commercial drivers needed around 20 s to regain control of the vehicle ( 14 ).
Based on the limited studies, stabilization time varies greatly with different measurements. It should also be noted that most related studies have narrowly focused on stabilization of driving-related performance or physiological indicators, while cognitive stabilization has largely been neglected. A previous study indicates that cognitive rather than motor processes determine take-over time and driving performance ( 15 ). It is well-established that cognitive functioning has a large impact on driving performance and safety. For example, higher cognitive load has been shown to reduce takeover readiness and impair driving performance ( 16 ). Another study also suggested that both cognitive and visual loads affect driving performance after the takeover ( 17 ). Although previous studies indicated the significant impact of cognitive load and visual attention on driving performance and road safety ( 17 – 19 ), the time drivers need to stabilize their cognitive state after the driving mode switch is still unclear.
Moreover, almost all previous studies have focused exclusively on switching from automated to manual driving mode. Understanding the stabilization time required to toggle an automated driving system is important in scenarios such as engaging the automated mode prior to joining a vehicle group, such as a vehicle platoon ( 20 ). To our knowledge, only one study examined drivers’ reaction time when transitioning from manual to automated driving mode and found that it took drivers 2.8 to 23.8 s to relinquish the automated system ( 21 ). However, that study did not investigate drivers’ performance after mode switching.
Therefore, our study aims to investigate how long it takes drivers to stabilize after the driving mode switch, with a focus on drivers’ cognitive load and visual attention. To measure drivers’ cognitive load, the International Organization for Standardization (ISO) detection response task (DRT) was used. It is a standardized tool for measuring changes in cognitive load and has been widely adopted in driving research ( 22 , 23 ). Visual attention and eye movements are linked in most instances ( 24 ). In driving research, eye movement recording has been considered an appropriate research method to represent drivers’ visual attention ( 25 ). Following previous studies, drivers’ on-road fixation durations were captured by an eye tracker to represent their visual attention ( 26 – 28 ).
The effect of automated driving mode on drivers’ cognitive load has been widely studied, but findings remain inconsistent. Some studies showed a lower cognitive load and impaired visual attention toward the forward roadway in automated driving compared with manual driving ( 29 , 30 ), while other studies found opposite patterns ( 31 ). No significant differences were also revealed in some research ( 32 , 33 ). In this study, drivers’ cognitive load and visual attention were compared between different driving modes to provide further understanding of the effect of driving mode on drivers’ cognitive load. The temporal effect on drivers’ cognitive load and visual attention was also analyzed.
The objectives of the current study are therefore threefold. We aim to investigate:
the effect of driving mode and time on drivers’ cognitive load and visual attention;
how long it takes drivers to stabilize cognitive load and visual attention after switching from automated to manual driving mode;
how long it takes drivers to stabilize cognitive load and visual attention after switching from manual to automated driving mode.
Method
Participants
Twenty-eight participants (16 male and 12 female) were recruited from the University of Windsor student population by email, flyers, and word of mouth. Their average age was 24.5 years old (SD = 3.97) and ranged from 18 to 34 years. Participants’ driving experience ranged from 1 to 11 years, with an average driving experience of 6.04 years (SD = 3.31). Eligible participants had to have normal or corrected-to-normal vision and hearing, hold a valid G2 Ontario driving license or equivalent, and be fluent in English. Participants received a 20$ Amazon gift card for their participation in the experiment. The study was reviewed and approved by the University of Windsor’s Research Ethics Board (REB #24-037).
Experiment Design
A within-subject design with two independent factors—driving mode (2 levels: manual driving and automated driving) and time (3 levels: 1, 2, and 3)—was adopted in this study. Each participant drove a simulated vehicle, and the driving mode switched between manual and automated driving approximately every 3.5 km. The order of drives was counterbalanced across participants so that fourteen participants started in manual mode and fourteen started in automated mode. Each participant experienced five switches. In total, three manual driving sections and three automated driving sections were designed. Figure 1 illustrates the experiment design. Dependent measures included detection response task reaction time (DRT RT) and on-road fixation durations, both of which were continuously recorded during the experiment.
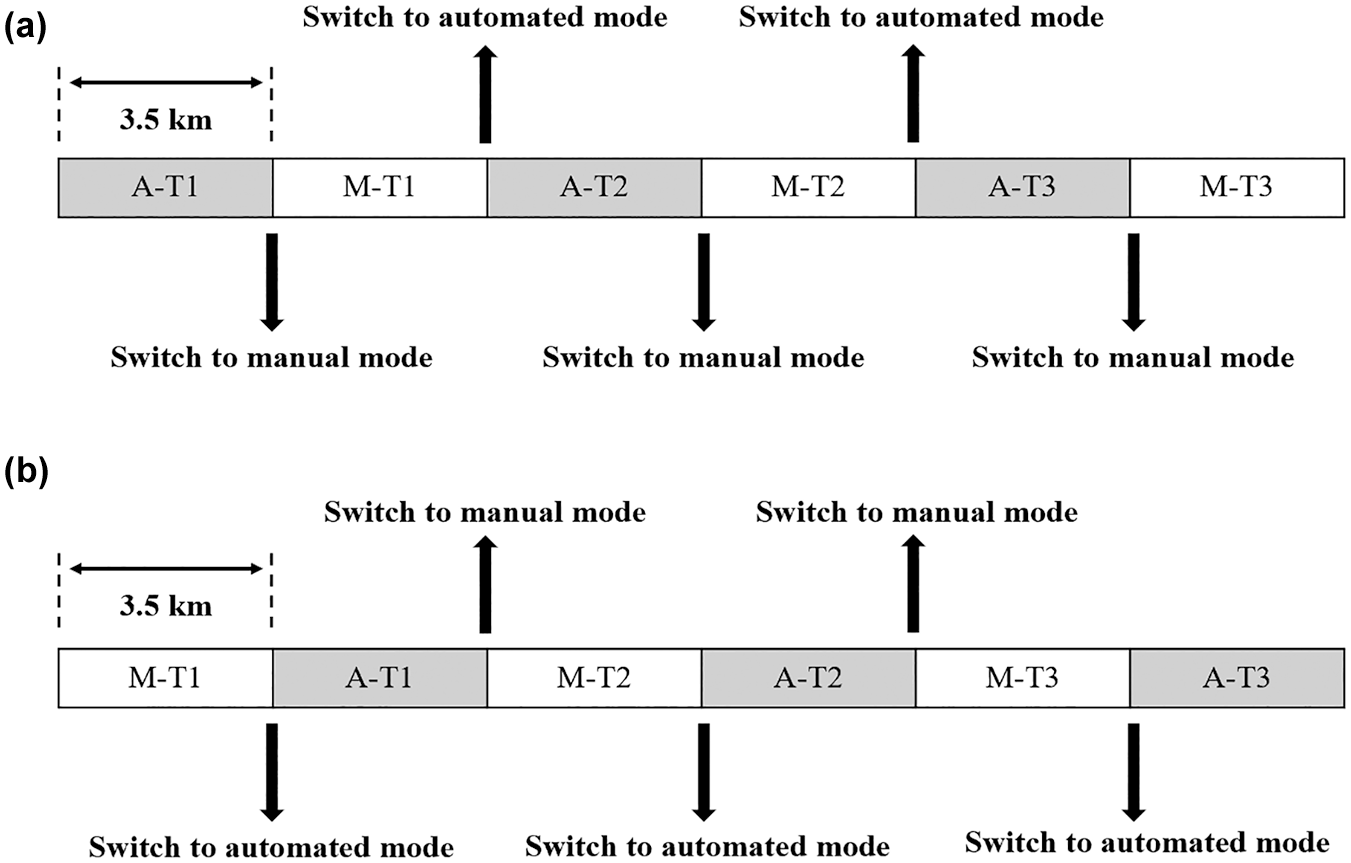
14 participants began in automated driving mode (a) and 14 participants began in manual driving mode (b). The grey blocks represent automated driving, and the white blocks represent manual driving.
Material
Driving Simulator
The driving simulator used in this study consisted of three 45-in. Samsung TV monitors, a Logitech G29 steering wheel with an average diameter of 265 mm and 900°rotation, three pedals for the accelerator, brake, and clutch respectively, and an adjustable car seat. The simulated driving scenario was developed using DReye VR software ( 34 ), which is built atop Carla, an open-source driving simulator for autonomous driving, and Unreal Engine. The scenario was transmitted to the three monitors for display. The three screen displays were connected allowing a 180-degree realistic horizontal view of the environment and driving experience from the driver’s viewpoint.
A 3-km ring highway scenario with three to four lanes was developed (see Figure 2). Twenty vehicles were randomly deployed on the road to enhance the realism of the scenario, and there were no objects requiring participant responses. The transition between manual and automated driving modes occurred approximately every 3.5 km at different locations (see Figure 2). After each switch, participants had to drive around the entire ring before the next switch occurred. Following similar research ( 35 , 36 ), two distinct audio signals, “takeover control” and “switching to automated mode”, were implemented to cue switching from automation to manual driving and from manual driving to automation. On activation, the audio signal would repeat three times, with a total duration of 3 s.
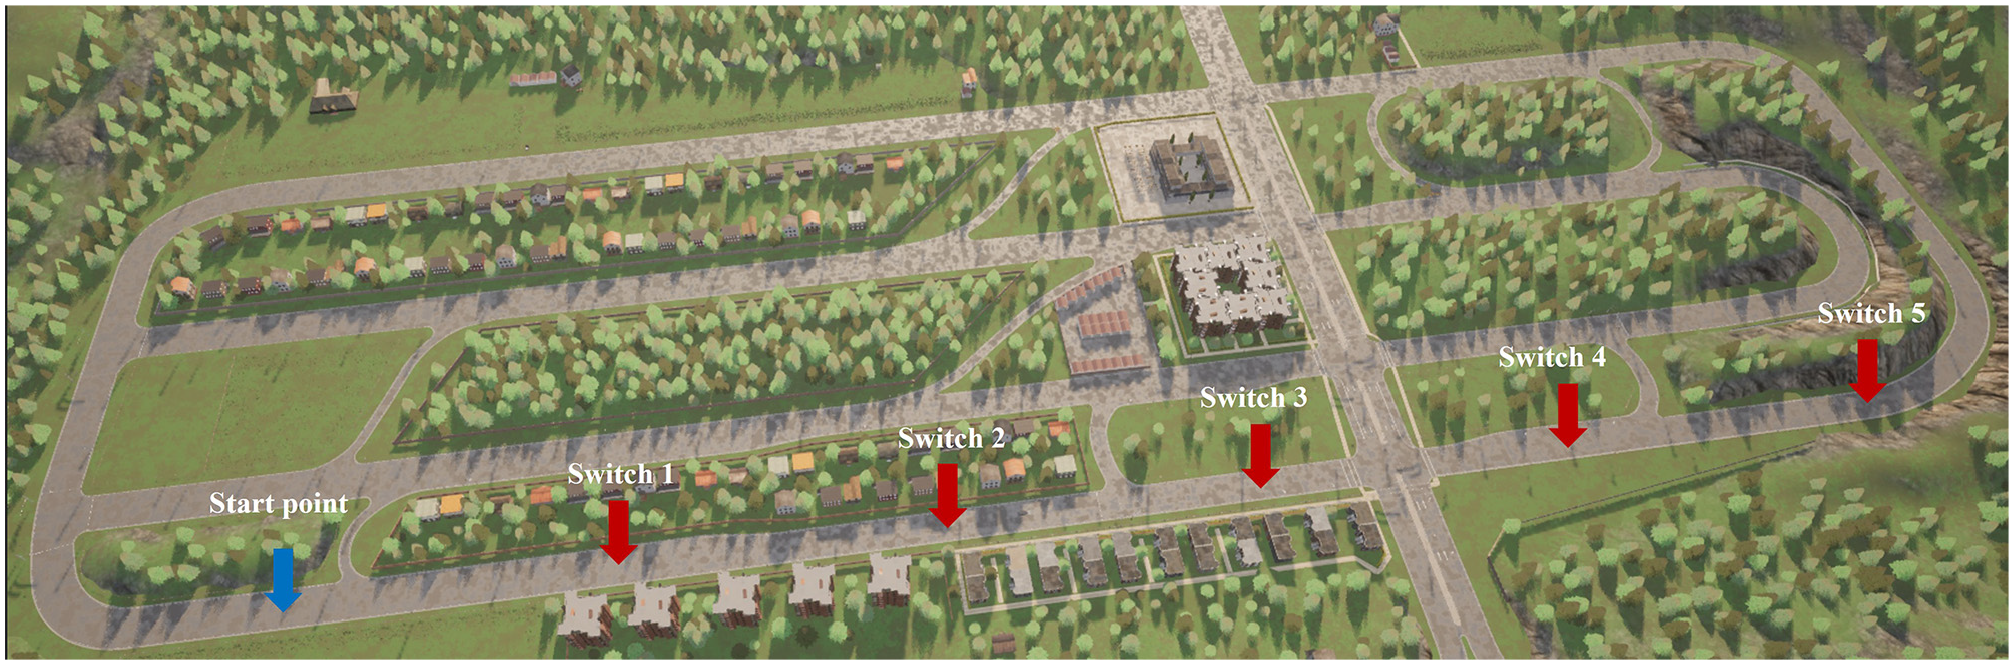
The blue arrow marks the starting point. The red arrows indicate the locations of each transition.
DRT
The vibrotactile version of the DRT developed by Red Scientific Ltd (Salt Lake City, UT, USA) was used in this study. A vibrotactile motor was placed on the inside elbow area of the participant’s left arm, and a micro switch was attached to the left index. In line with ISO ( 37 ), a vibration was emitted quasi-randomly every 3 to 5 s. Participants were required to respond to the vibrotactile stimuli by pressing the micro switch as soon and as accurately as possible.
Eye Tracker
The Pupil Labs wearable eye-tracker (Pupil Labs GmbH, Berlin, Germany) was used to record participants’ visual behavior. The eye-tracker contains three cameras: two eye cameras (one for each eye with a 120 Hz sampling rate), and one world camera recording from participants’ perspective. Following the guidelines of ISO 15007 ( 38 ) and the instructions provided by Pupil Labs, a series of procedures were implemented to optimize data quality. Before data collection, eye cameras were checked to ensure that participants’ pupils were detected and tracked robustly. The single-marker calibration was conducted and the accuracy and precision reported by Pupil Capture (v3.1.16) software were used to evaluate calibration accuracy. As an important behavior in eye movement, fixation durations were captured as the metric for visual attention ( 26 ). Pupil Capture (v.3.1.16) was used for the data recording, and Pupil Player (v. 3.1.16) was used for the data extraction.
Procedures
On arrival at the lab, participants were asked to sign the consent form and fill out the demographic questionnaire. After debriefing the study subjects and explaining what they would do in the following experiment, they took a seat in the driving simulator and were equipped with DRT devices. In the DRT practice phase, participants were instructed to respond to the DRT vibrotactile stimuli as soon and as accurately as possible by pressing the micro switch. They were given 1 min to practice and familiarize themselves with the task. Participants were then instructed to perform eye-tracker calibration by slowly moving their heads while maintaining their gaze on the center of the marker displayed on the front screen. They were asked afterward to look at a particular object to verify that the eye tracker identified the fixation precisely. Calibration was repeated as needed until the eye tracker achieved sufficient accuracy for capturing participants’ eye movements.
After calibration, participants were introduced to the driving simulator including how to use the steering wheel, brake, and gas pedal. The ego-vehicle (the vehicle controlled by the participant) was designed to start in the third lane and participants were instructed not to change lanes during the entire drive. Drivers were instructed to maintain a speed of approximately 70 km/h in manual mode and the same speed was set for automated mode. Participants were told to drive straight and keep the speed at around 70 km/h in manual driving mode, and overtaking was allowed if a vehicle obstructed their path. In automated driving mode, participants were instructed that they did not need to drive the vehicle or monitor the road, but they were required to respond to the takeover request and regain control of the vehicle immediately. They were told to notify the research assistant if they felt any discomfort during the experiment. Participants then practiced driving the simulator, experiencing two types of driving mode switches within one loop. If they still did not understand the task, they were allowed to practice more until they became familiar with the simulator and understood how to switch between the two driving modes. The practice scenario was identical to the actual experiment, except that the transition between two driving modes occurred after a shorter distance. This design allowed participants to experience both types of transition within a single loop.
Once everything was in place, the actual experiment and data collection began. Participants completed 6 loops in approximately 15 min and experienced 5 switches, either from manual to automated driving mode or from automated to manual driving mode. In total, three manual driving sections and three automated driving sections were conducted. At the end of the 6 loops, participants were debriefed and compensated for their time.
Data Processing
DRT
The time between the onset of the vibrotactile stimulus and the moment participants press down the micro switch was considered as the DRT RT (reaction time; in milliseconds), which was recorded and further analyzed. Following the ISO guidelines ( 37 ), responses below 100 ms or exceeding 2,500 ms were excluded as outliers. RS Companion software was used to collect participant response data, subsequently exporting them as Comma-separated values (CSV) files. One participant was excluded by equipment issues, leaving 27 participants for the cognitive load analysis.
On-Road Fixation Durations
Fixation durations indicate the visual attention directed to a certain area ( 26 , 39 ). In this study, the forward roadway was identified as the area of interest (AOI). Fixation data were extracted using Pupil Lab Player v3.5.1 software. A fixation was defined as a cluster of points that remained within a maximum dispersion of 1°( 40 ) for a minimum duration of 150 ms ( 41 , 42 ). Only the data with a confidence level above 80% were included in the analysis. In this study, on-road fixation durations were calculated as the mean duration of fixations on the forward roadway. Three participants were excluded by equipment issues, leaving 25 participants for the visual attention analysis.
Data Analyses
For objective 1, average DRT RT and on-road fixation durations in each driving section were calculated. Analysis of variance (ANOVA) was used to compare the differences in participants’ DRT RT and on-road fixation durations across two factors: driving mode (two levels: manual and automation) and time (three levels: 1, 2, and 3) ( 43 ). As the most commonly reported effect size estimate for ANOVA, partial η2 and its confidence interval were reported to indicate the magnitude of the effect ( 44 ).
For objective 2, the 30-s section after each automated-to-manual switch was extracted ( 45 ) and split into six 5-s time windows, then the average value of each time window was calculated ( 12 ). The entire segment of each manual driving section was extracted and combined to form a reference group, representing participants’ baseline behavior in manual driving mode ( 12 ).
The dataset here consists of repeated measures with a hierarchical structure. The time window serves as the first level, and each individual serves as the second level. Since the observations in this hierarchical dataset are correlated, the effective number of observations is lower than the total number of observations. The multilevel model (MLM) was developed to tackle these issues. By allowing for residual components at each level, it can recognize the existence of data hierarchies ( 46 ). Therefore, MLM was used to investigate the main effect of time on participants’ cognitive load and visual attention ( 47 ). The mean value in the reference group was included with the time window set to 1, and the six time windows after the switch were coded as 2 to 7, which together constitute the factor time window (7 levels). Planned contrast test was used to assess the differences between the reference group and each time window after the switch. To mitigate type I error inflation caused by multiple comparisons, the Bonferroni correction was used to adjust the p-value ( 48 ). We considered the effect of switching diminished and participants stabilized in the given time window if no differences were observed between the reference group and that time window, as well as the following time windows.
In this study, a two-level MLM was fitted for each of the dependent variables with participants on the second level and observation in each time window on the first level. Time windows were entered as the fixed factor to investigate the relationship between time and dependent variables. Participants were included as a random effect to account for individual differences. The likelihood ratio was used as the indicator of model fit. To evaluate the fit of different models, likelihood ratio tests were performed to compare the model with the fixed factor against the intercept-only model ( 49 ). These tests produced a Chi-squared statistic and examined the main effect of the fixed factor. Considering a dependent variable (Ysi) for the ith observation for the sth participant, the equation for the model can be written as:

where β0 and β1 were the intercept and the slope of the fixed factor, and S0s was the random intercept. Our model fit significantly improved after we added a random intercept, which also proved that our data is suitable for the MLM ( 43 ), then planned contrasts were conducted to investigate the difference between each time window and the reference group.
Similar analyses as the ones adopted for objective 2 were performed for objective 3. In particular, 30 s-sections after each manual-to-automated switch was extracted. The entire segment of each automated driving section was extracted and combined to form a reference group, representing participants’ baseline behavior in automated driving mode. Data analyses were conducted using RStudio (version 4.3.1).
Results
Effect of Driving Mode and Time on Drivers’ Cognitive Load and Visual Attention
Figure 3 shows the average DRT RT and on-road fixation durations in different driving modes and times. The effects of driving mode (manual and automation), time (1, 2, and 3), and their interaction on DRT RT and on-road fixation durations were examined respectively.
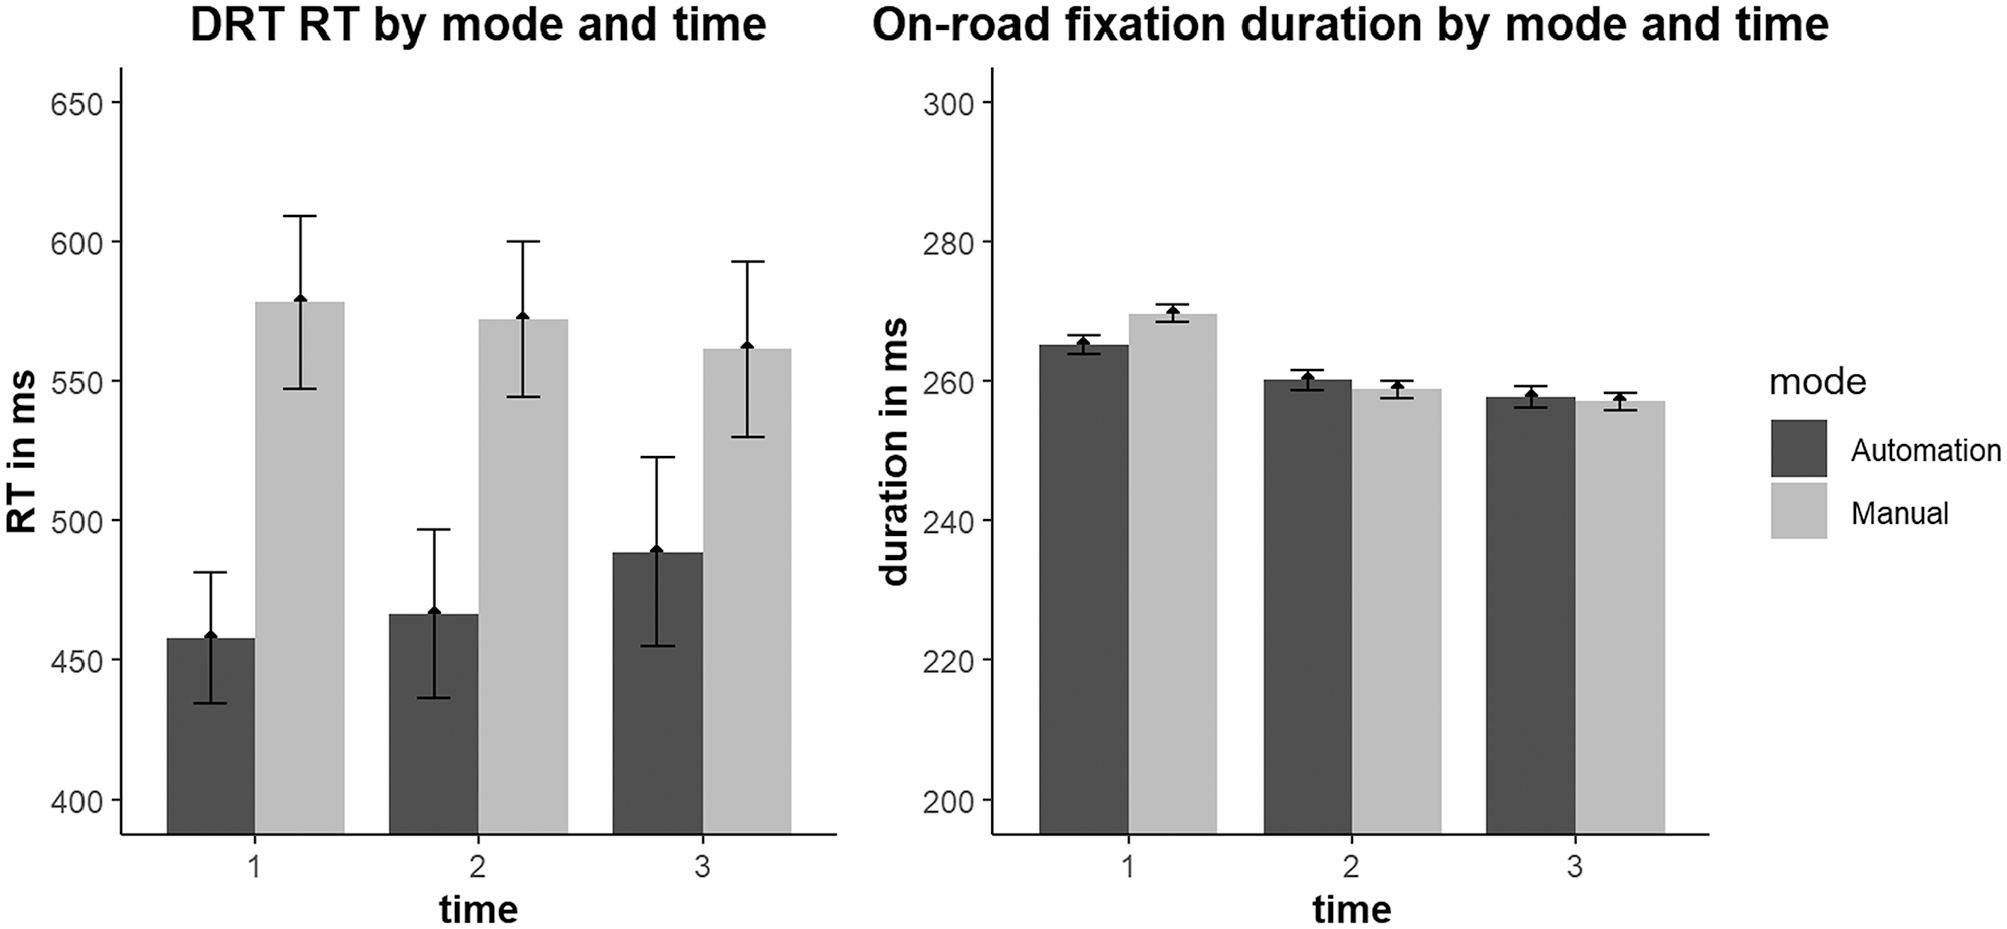
Detection response task reaction time (DRT RT) and on-road fixation durations across time (1, 2, and 3) and driving modes (manual and automation).
DRT RT
Significant differences were found between the two driving modes: F (1,156) = 16.74, p < 0.001, partial η2 = 0.10, CI = [0.04,1.00], with participants showing slower reaction time in manual driving mode compared with automated driving. The results did not reveal a significant effect of time: F (2,156) = 0.03, p = 0.969, partial η2 = 0.00, CI = [0.00,1.00], nor an interaction effect between mode and time: F (2,156) = 0.33, p = 0.715, partial η2 = 0.00, CI = [0.00,1.00].
On-Road Fixation Durations
The results indicated no significant main effect of driving mode: F (1,135) = 0.01, p = 0.922, partial η2 = 0.00, CI = [0.00,1.00], or time: F (2,135) = 0.65, p = 0.526, partial η2 = 0.00, CI = [0.00,1.00]. The effect of interaction between mode and time was also not significant: F (2,135) = 0.29, p = 0.745, partial η2 = 0.00, CI = [0.00,1.00].
The results suggested that compared with manual driving, drivers showed significantly lower cognitive load in automated driving mode, while drivers’ visual attention did not change significantly between manual and automated driving modes. Both cognitive load and visual attention did not change with time.
Stabilization Time after Switching from Automated to Manual Driving Mode
DRT RT
The average DRT RT across six time windows after each automated-to-manual switch can be visualized in Figure 4. The full model was compared with the model with intercept only, and the likelihood ratio test found a significant main effect of the time window, χ2(6) = 19.65, p = 0.003, partial η2 = 0.12, CI = [0.02, 1.00], indicating a significant difference in DRT RT among these time windows. Table 1 presents the results comparing DRT RT in the reference group and each time window after the switch.
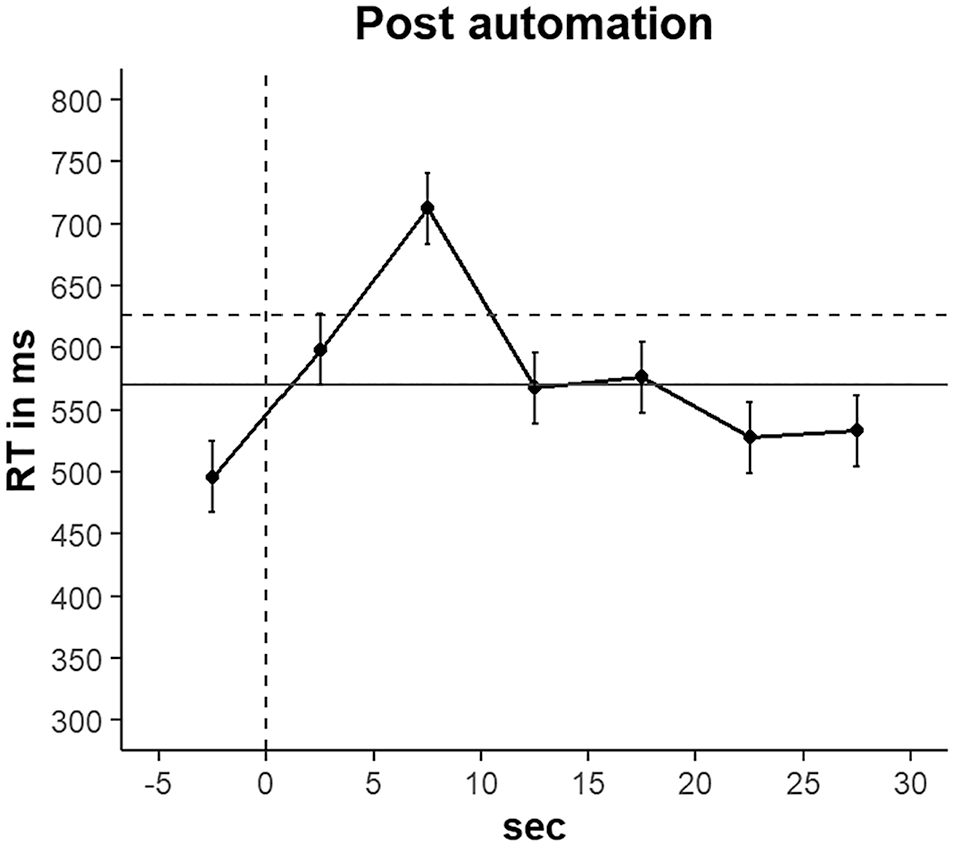
The detection response task reaction time (DRT RT) is distributed into 5-s intervals relative to the cessation of automated driving. In this case, the reference group refers to all the manual driving sections. The solid horizontal line represents the average DRT RT in the reference group, and the dotted horizontal line represents its corresponding 95% upper confidence interval. The vertical dotted line marked the switching point. The dot on the left of the vertical dotted line represents the average DRT RT of the 5 s before the switch.
Planned Contrasts on DRT RT after Switching to Manual Driving
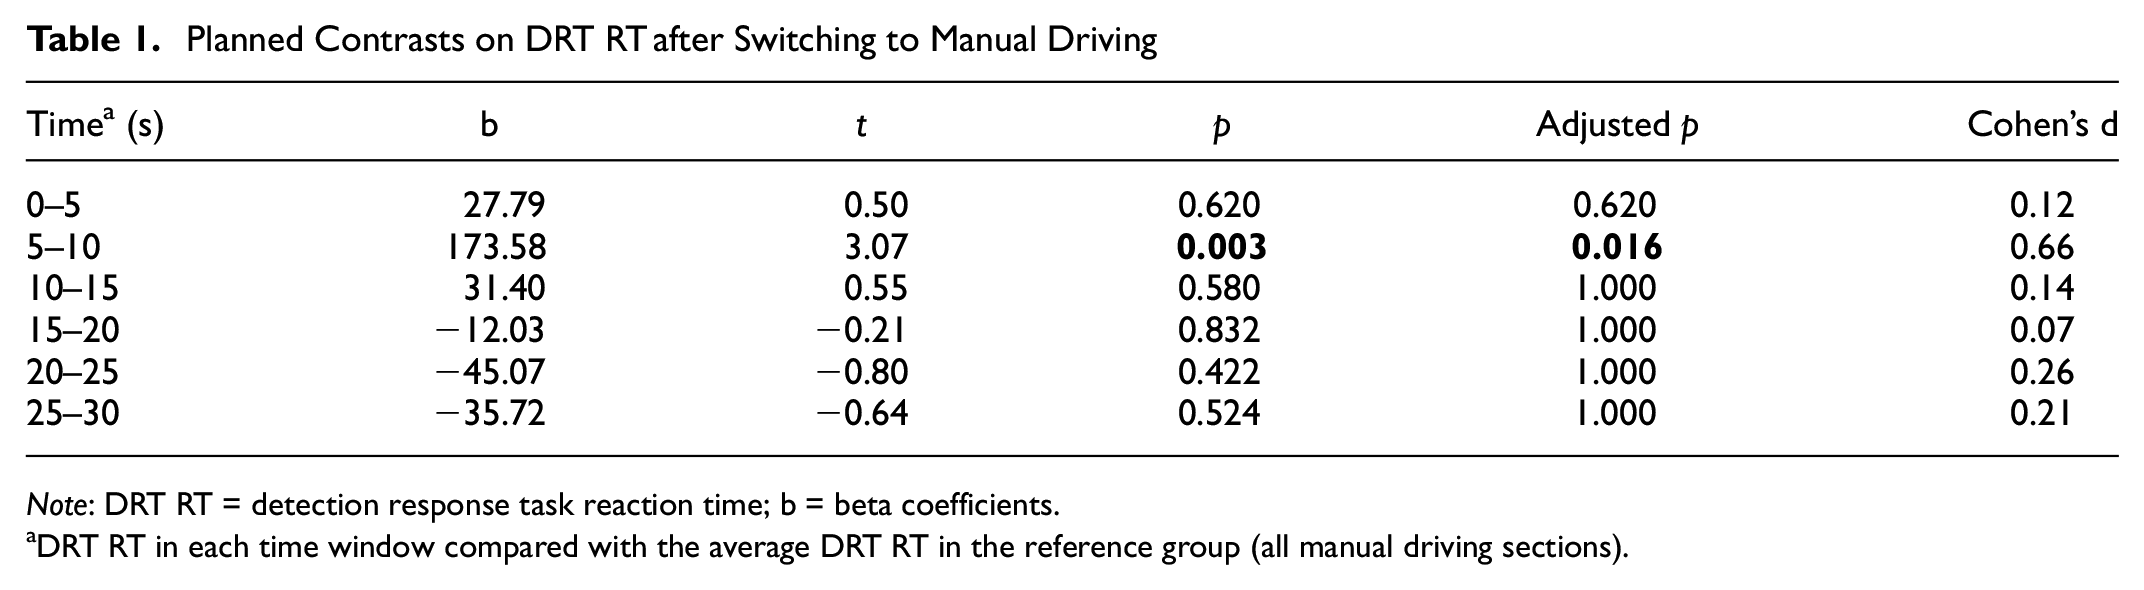
Note: DRT RT = detection response task reaction time; b = beta coefficients.
DRT RT in each time window compared with the average DRT RT in the reference group (all manual driving sections).
The results revealed that it took drivers 10 to 15 s to stabilize their cognitive load to a normal level after switching from automated to manual driving mode.
On-Road Fixation Durations
The average on-road fixation durations across six time windows after each automated-to-manual switch can be visualized in Figure 5. The likelihood ratio test between the model with the time window as the fixed factor and the model with intercept only found a significant main effect of the time window, χ2(6) = 16.27, p = 0.012, partial η2 = 0.12, CI = [0.01,1.00], indicating significant differences exist in on-road fixation durations among these time windows. Table 2 presents the planned contrast results that compare on-road fixation durations in the reference group and each time window after the switch.
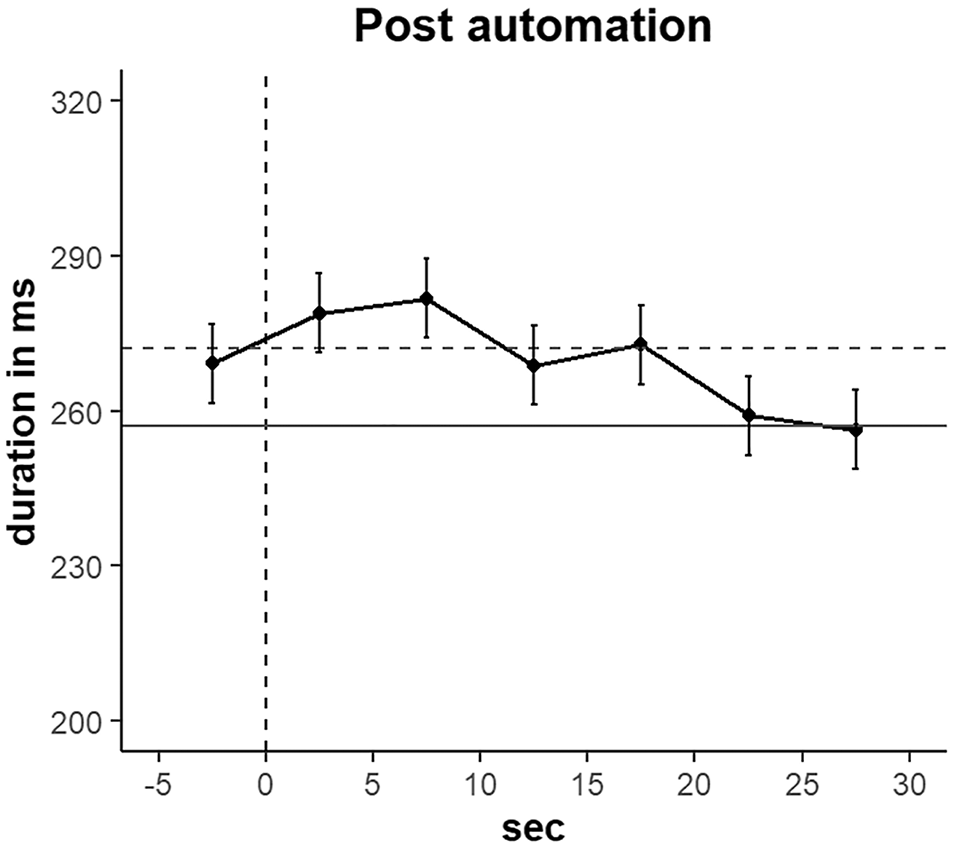
The fixation durations are distributed into 5-s intervals relative to the cessation of automated driving. In this case, the reference group refers to all the manual driving sections. The solid horizontal line represents the average on-road fixation durations in the reference group, and the dotted horizontal line represents its corresponding 95% upper confidence interval. The vertical dotted line marked the switching point. The dot on the left of the vertical dotted line represents the average on-road fixation durations of the 5 s before the switch.
Planned Contrasts on On-Road Fixation Durations after Switching to Manual Driving
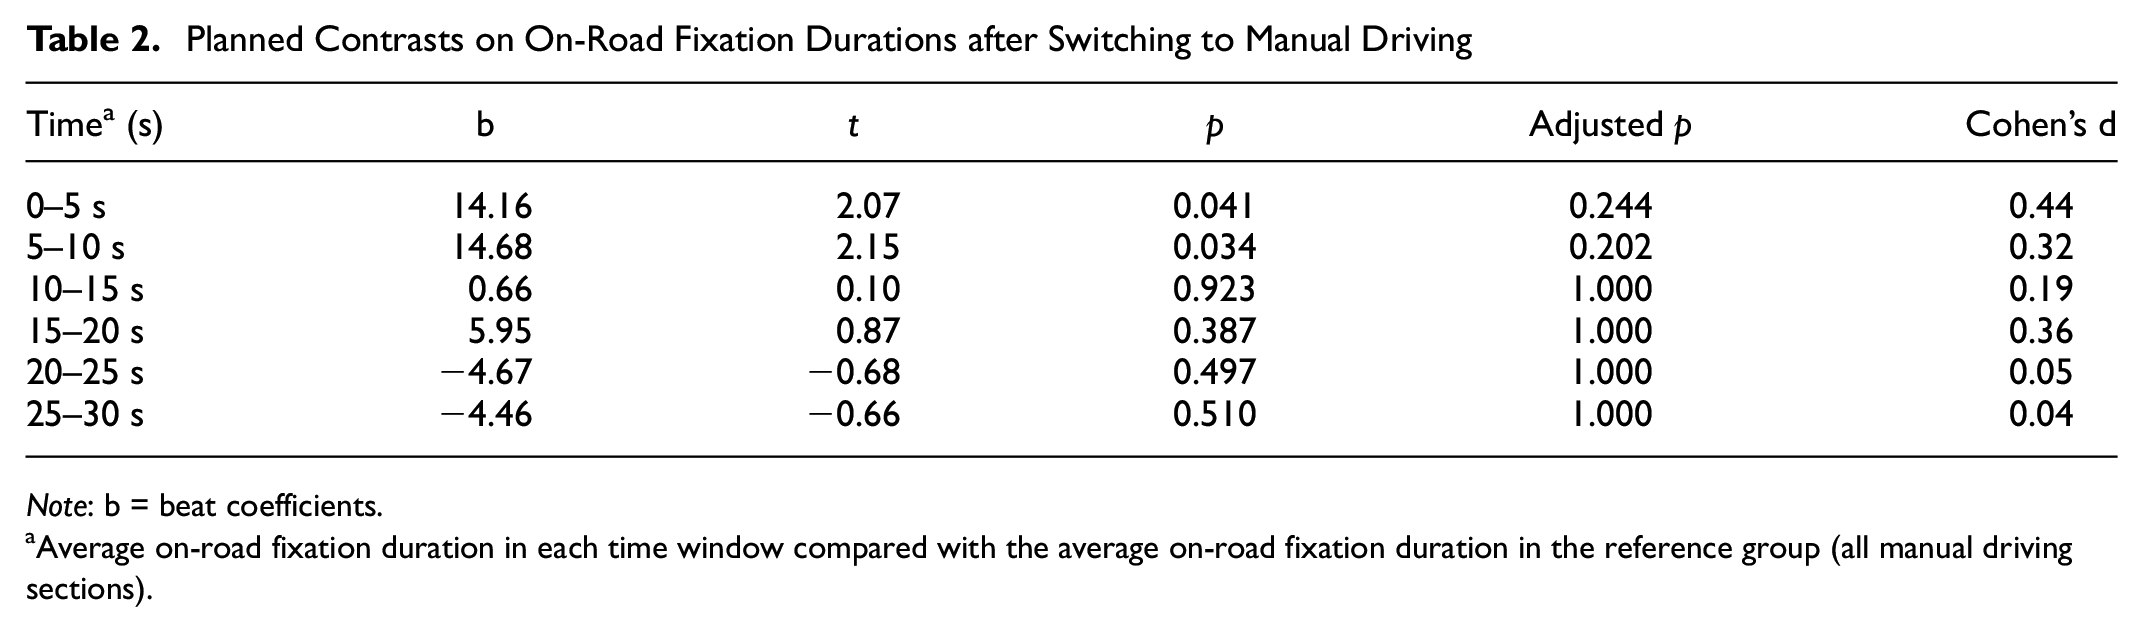
Note: b = beat coefficients.
Average on-road fixation duration in each time window compared with the average on-road fixation duration in the reference group (all manual driving sections).
Although the planned contrast results demonstrated that drivers’ on-road fixation duration did not fluctuate significantly after switching to manual driving, Figure 5 showed drivers’ on-road fixation duration increased in 10 s after automation cessation, then gradually decreased, which is similar to the DRT RT changing trend after automation.
These results indicated that drivers’ cognitive load tends to fluctuate after switching to manual driving, then stabilize at around 10 to 15 s.
Stabilization Time after Switching from Manual to Automated Driving Mode
DRT RT
The average DRT RT across six time windows after each manual-to-automated switch can be visualized in Figure 6. A significant main effect of time window was found, χ2(6) = 45.01, p < 0.001, partial η2 = 0.24, indicating a significant difference in DRT RT among these time windows. Table 3 presents the results comparing DRT RT in the reference group and 5-s time windows after the switch.
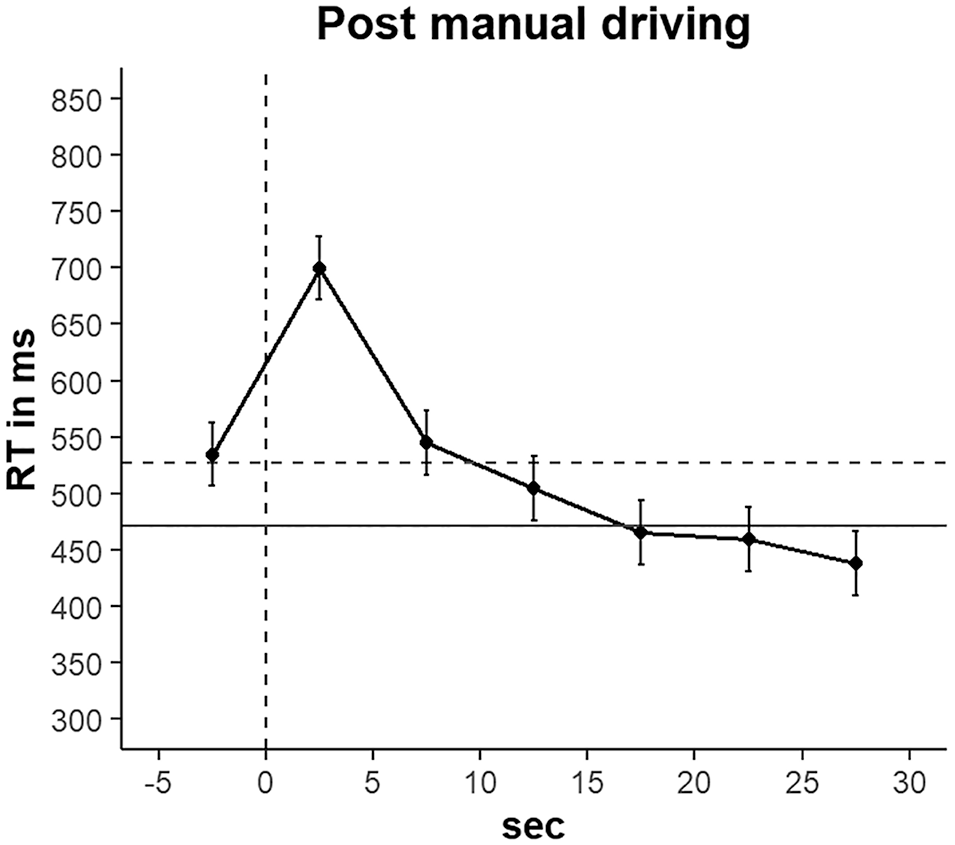
The detection response task reaction time (DRT RT) is distributed into 5-s intervals relative to the cessation of manual driving. In this case, the reference group refers to all the automated driving sections. The solid horizontal line represents the average DRT RT in the reference group, and the dotted horizontal line represents its corresponding 95% upper confidence interval. The vertical dotted line marked the switching point. The dot on the left of the vertical dotted line represents the average DRT RT of the 5 s before the switch.
Planned Contrasts on DRT RT after Switching to Automation
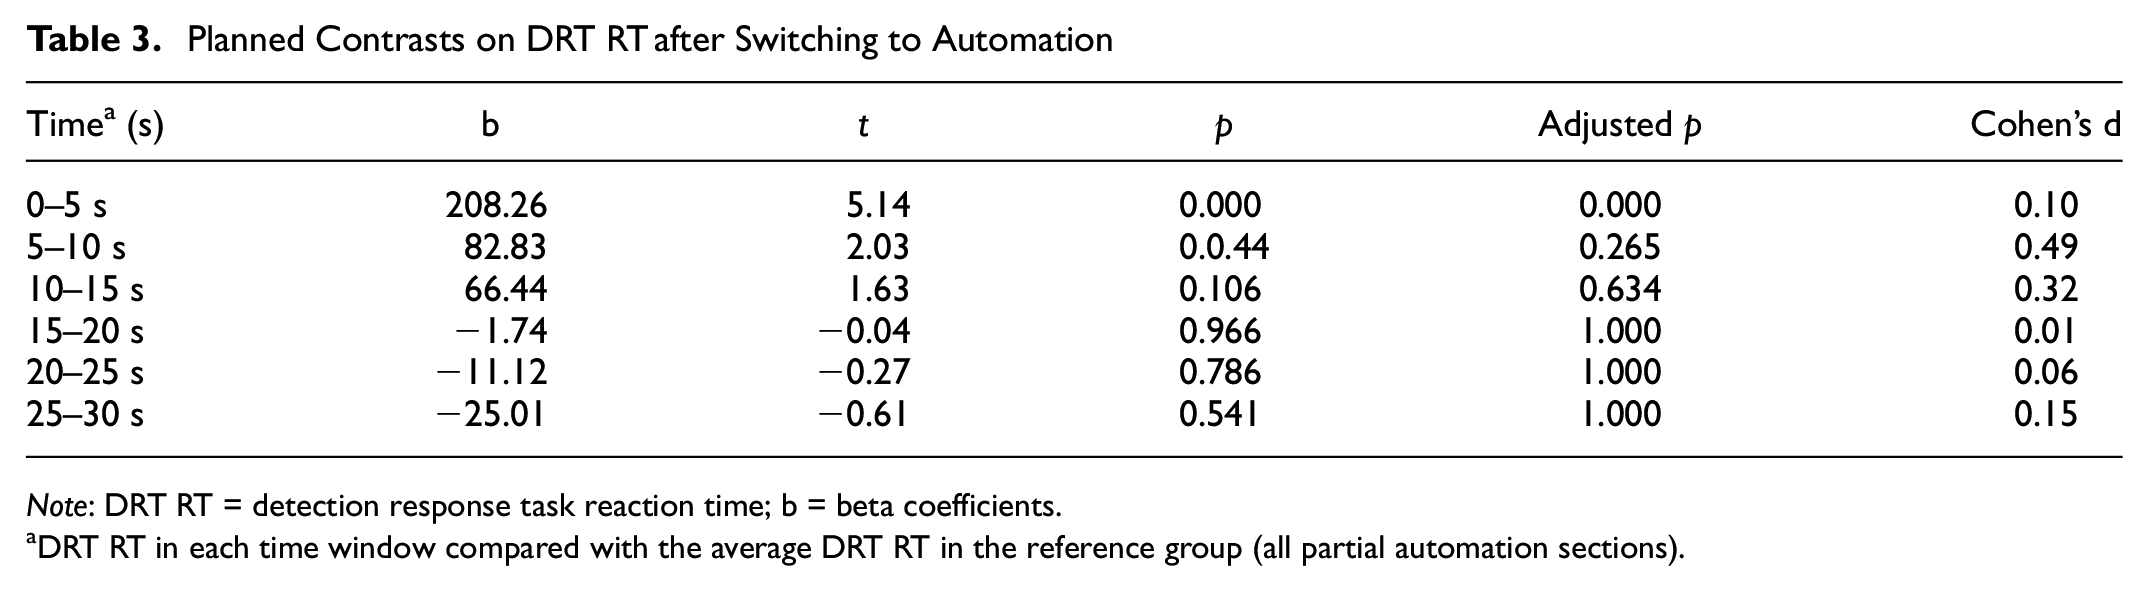
Note: DRT RT = detection response task reaction time; b = beta coefficients.
DRT RT in each time window compared with the average DRT RT in the reference group (all partial automation sections).
The result indicated that switching from manual to automated driving will influence participants’ cognitive load, and participants need 5 to 10 s to recover to their normal cognitive load.
On-Road Fixation Duration
The average DRT RT across six time windows after each manual-to-automated switch can be visualized in Figure 7. The likelihood ratio test between the model with the time window as the fixed factor and the model with intercept only did not find a significant main effect of the time window, χ2(6) = 3.41, p = 0.757, partial η2 = 0.02, CI = [0.00,1.00], indicating no significant differences exist in on-road fixation duration among these time windows. Table 4 presents the planned contrast results that compare on-road fixation duration in the reference group and each time window after the switch.
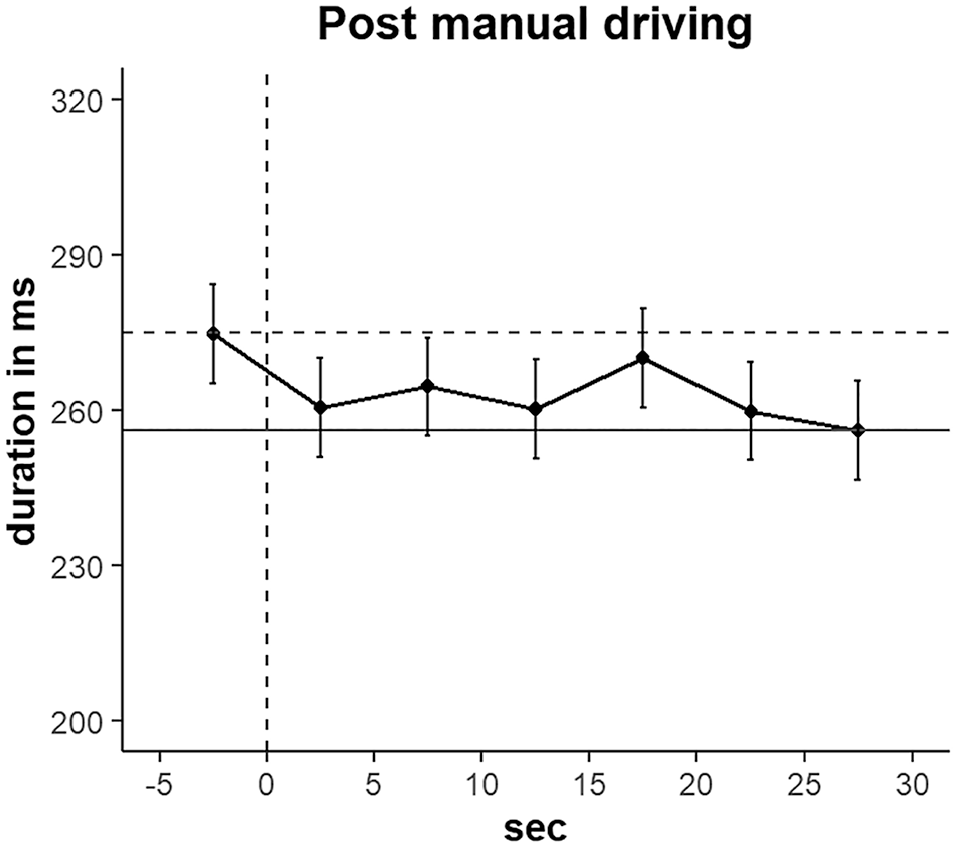
The fixation durations are distributed into 5-s intervals relative to the cessation of manual driving. In this case, the reference group refers to all the automated driving sections. The solid horizontal line represents the average on-road fixation durations in the reference group, and the dotted horizontal line represents its corresponding 95% upper confidence interval. The vertical dotted line marked the switching point. The dot on the left of the vertical dotted line represents the average on-road fixation durations of the 5 s before the switch.
Planned Contrasts on On-Road Fixation Duration after Switching to Automation
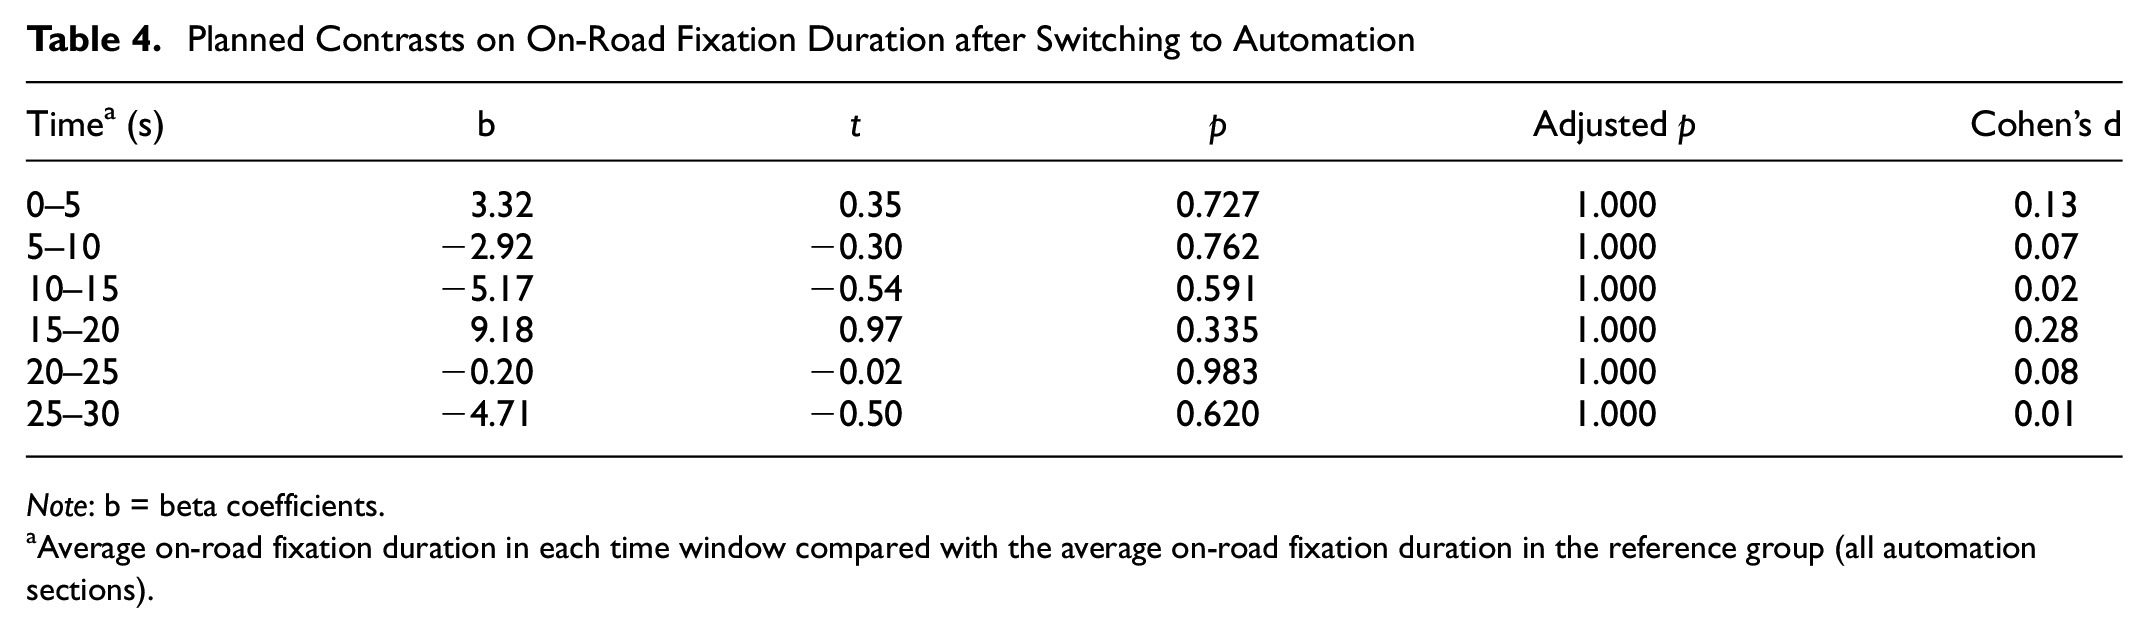
Note: b = beta coefficients.
Average on-road fixation duration in each time window compared with the average on-road fixation duration in the reference group (all automation sections).
The results showed that drivers’ on-road fixation durations did not fluctuate significantly after switching from manual driving to automation.
Discussion
Understanding how long it takes drivers to stabilize after the driving mode switch is essential for developing safe automated driving systems, yet little research has investigated drivers’ stabilization time, especially from the perspective of cognitive load and visual attention. To this end, this study focused on drivers’ cognitive load and visual attention, aiming to determine how much time drivers need to recover to their normal cognitive states after the driving mode switch. Both switching to and from manual driving mode were examined in a simulated driving environment. Drivers’ cognitive load and visual attention in different driving modes and times were also analyzed to provide information on the effects of automated driving mode and time on driver’s cognitive load and visual attention. Drivers’ cognitive load and visual attention were assessed by examining DRT RT and on-road fixation durations respectively.
Drivers’ Stabilization Time after Switching from Automated to Manual Driving Mode
Results showed that participants’ DRT RT increased significantly after switching from automated to manual driving mode, then started decreasing at 5 to 10 s, and back to the average level and stabilized at 10 to 15 s. Although statistical analysis did not reveal a significant change in participants’ on-road fixation durations, a similar trend as DRT RT can be observed in Figure 4. After switching from automated to manual driving mode, participants’ on-road fixation durations increased in the first 7 s, then decreased and gradually stabilized at 10 to 15 s. Almost all previous studies focused on drivers’ stabilization time for driving performance and physiological indicators after the takeover. By using DRT RT and on-road fixation durations to measure drivers’ cognitive load and visual attention, this study provides valuable information on drivers’ cognitive stabilization after switching from automated to manual driving mode.
These findings indicate that after drivers regain control of the vehicle, they might experience a spike in cognitive load as they strive to shift their attention to the driving task and attain the necessary environmental information for executing driving tasks safely and regaining cognitive stability ( 50 , 51 ). A stabilization time of 10 to 15 s for drivers’ cognitive load was found in this study. This buffer time window could be explained by two cognitive processes. First, a switch cost may emerge when shifting from automated to manual driving mode. Switch cost refers to the additional cognitive cost of performing different tasks on successive trials, and it is widely assumed that individuals’ performance gets slower when initiating a different task compared with conducting a repetitive task ( 52 , 53 ). Neuroimaging studies also reveal increased activation in numerous brain regions when individuals prepare to switch tasks and when they perform task-changing ( 54 , 55 ). In this context, drivers assume different roles in automated and manual driving modes. In automated driving mode, drivers take on a passive supervisory role and are relieved of driving tasks. In contrast, in manual mode, drivers must assume multiple responsibilities, including lateral and longitudinal control, as well as interacting with other vehicles and pedestrians in manual driving. As a result, switching from automated to manual driving mode requires additional time and cognitive resources to reorient to the manual driving task ( 56 ).
Second, situation awareness recovery could be another explanation for the fluctuation of cognitive load and visual attention after switching. Situation awareness recovery is defined as the process of restoring situation awareness after it has been diminished ( 57 ). When a takeover request is issued, drivers must acquire the necessary environmental information and recover their situation awareness to drive safely ( 58 ). The process of situation awareness recovery consumes cognitive resources and entails specific cognitive processes, such as working memory and attention distribution ( 59 ), which indicates that this process could have an impact on drivers’ cognitive load and task performance. The results of one study that measured drivers’ behaviors when they had to recover situation awareness after being interrupted revealed increased scanning behavior during the situation awareness recovery process ( 57 ). In this study, after relinquishing automation, drivers need to allocate part of their cognitive resources to acquire information about their surroundings so they can perform driving tasks safely, which leads to a spike in cognitive load after the driving mode switch.
These findings provide insights into TORlt in automated driving vehicles. The mean TORlt used in most previous studies was around 7 s ( 21 ), which is shorter than the 10 to 15 s stabilization time found in this study. It indicates that previously adopted TORlt may not be sufficient to ensure a safe and consistent driving performance after switching to manual driving mode. A longer TORlt is needed for drivers to be both physically and cognitively prepared to resume vehicle control.
Drivers’ Stabilization Time after Switching from Manual to Automated Driving Mode
When switching from manual to automated driving mode, an increase in drivers’ DRT RT was also displayed after mode switches, but started dropping at an earlier stage, and returned to the average level at 5 to 10 s. However, drivers’ on-road fixation durations did not fluctuate much after switching to automated driving. To our knowledge, this is the first study to investigate drivers’ stabilization time after switching from manual to automated driving mode. The results indicate that the relinquishing of manual driving mode has an impact on drivers’ cognitive load, but not on visual attention.
These findings suggest that a switch cost also exists after relinquishing manual driving to the automated system. The underlying reason for the increase in drivers’ cognitive load after switching to automation could be the effect of task set inertia, which is a lingering effect from previous tasks and indicates the impact of the previous task may decay slowly over time causing interference with the efficient performance of other tasks ( 60 ). Although drivers do not need to perform driving tasks after switching to automated driving mode, the high cognitive load from manual driving tasks may not decrease at once. Another potential explanation could be that drivers check the automation system to ensure it is functioning correctly after relinquishing manual driving, which could lead to an increase in their cognitive workload. Additionally, drivers’ on-road fixation duration dropped after switching to automated driving mode, indicating the possibility that their attention shifted from the road to the automation system.
The results prove that not only taking over vehicle control but relinquishing manual driving has an impact on drivers’ cognitive load. Drivers need to be aware that their cognitive load will increase for a few seconds after switching to automated driving mode, and they should avoid engaging in other tasks immediately after activating the automated system.
Effects ff Driving Mode and Time on Drivers’ Cognitive Load and Visual Attention
Drivers’ cognitive load was found to be lower in automated than in manual driving mode, but on-road fixation durations showed no significant differences between the two modes. This result corresponds partly to previous studies, which also suggested lower cognitive load in automated driving ( 30 ). The results showed no time effect on drivers’ cognitive load and visual attention, which may be because of the short driving duration in our experiment. Future studies should conduct longer driving sessions to further explore the time effect on drivers’ cognitive load and visual attention.
Limitations and Future Study
Although this study provides insightful information on the development of automated driving systems, some limitations are worth noting. First, the driving duration was relatively short. This might be the reason why the time effect on drivers’ cognitive load and visual attention was found to be insignificant. Time effect is not the primary objective of this study, but the driving duration may have an impact on drivers’ stabilization time after the switch of driving mode. Future studies could extend the driving duration to investigate if drivers’ stabilization time will vary. Second, visual attention was measured only by on-road fixation durations although it is a commonly used indicator ( 27 , 28 ): future studies are encouraged to use more eye metrics to represent drivers’ visual attention. Third, this study was conducted in a driving simulator. While driving simulators have multiple advantages such as controlled experimental conditions and enhanced safety, they cannot fully replicate real-world driving environments. Further on-road study should be conducted to assess a more accurate stabilization time. Fourth, this study did not measure drivers’ previous experience with automated driving systems, which may influence their behavior and response to takeover requests. Future research should consider drivers’ previous experience with automated driving systems.
Conclusion
The driving mode switch is currently one of the major concerns in automated vehicles. Drivers need to be physically, cognitively, and visually stabilized to drive the vehicle safely and consistently after the driving mode switch. The time window for drivers to stabilize after switching has become a crucial consideration in driving automation systems. Only a few studies investigated drivers’ stabilization time after the driving mode switch and most of them focused on physical and physiological stabilization—cognitive load and visual attention have always been overlooked. This study focused on cognitive load and visual attention and examined drivers’ stabilization time after the driving mode switch. The results showed that the drivers’ stabilization time is 10 to 15 s for switching from automated to manual driving mode, which is longer than the commonly assumed takeover request time ( 21 ). It provides valuable information for the design of the takeover request, indicating drivers might need a longer to be fully prepared for driving. The finding also suggests that drivers will experience an increase in cognitive load after switching from manual to automated driving mode, indicating a 5 to 10 s stabilization time after relinquishing manual driving. Our findings suggest that drivers’ cognitive load will fluctuate significantly after the driving mode switch and strengthen the need to consider stabilization time in the design of automated driving systems to enhance driving safety and improve the driving experience. When switching from automated to manual driving mode, a sufficient time window should be given for drivers to be fully prepared for driving tasks. When switching from manual to automated driving mode, drivers should be aware that they need some time to stabilize and should avoid engaging in other tasks immediately.
Footnotes
Author Contributions
The authors confirm contribution to the paper as follows: study conception and design: F. Biondi, Y. Li; data collection: Y. Li, N. Vasta; analysis and interpretation of results: Y. Li; draft manuscript preparation: Y. Li, F. Biondi, P. Sahoo, N. Vasta. All authors reviewed the results and approved the final version of the manuscript.
Declaration of Conflicting Interests
The author(s) declared the following potential conflicts of interest with respect to the research, authorship, and/or publication of this article: Francesco Biondi is a member of Transportation Research Record's Editorial Board. All other authors declared no potential conflicts of interest with respect to the research, authorship, and/or publication of this article.
Funding
The author(s) disclosed receipt of the following financial support for the research, authorship, and/or publication of this article: The authors received financial support for the research from the Natural Sciences and Engineering Research Council of Canada (NSERC) and the Social Sciences and Humanities Research Council (SSHRC).
Data Accessibility Statement
The data that supports the findings of this study are available from the corresponding author on reasonable request.