
Abstract
Roundabout operating speed estimation is a critical aspect of safe roundabout infrastructure design, yet existing international guidelines for speed evaluation exhibit inconsistencies and limited agreement with actual observed speeds at roundabouts. This study provides a comprehensive evaluation of five existing international guidelines and their implications for roundabout safety. This study focused on the discrepancies between estimated and observed fastest path speeds by conducting Passing–Bablok regression analyses of speed estimates evaluated from guidelines from Australia, the Netherlands, the United Kingdom, the USA, and South Africa, and speeds observed at 29 roundabouts, encompassing both single- and double-lane configurations. This study represents the most extensive comparison between methods used in various countries for fastest path analysis and is the first instance of empirical fastest path speed assessment. A widening of the confidence intervals around regression lines at higher speeds indicated poor agreement between estimated and observed speeds. All minimum observed speeds exceeded estimated design speeds for double-lane roundabouts signaling a failure of current design methodologies to sufficiently reduce speeds. The findings of the study uncover a systematic tendency for international guidelines to underestimate operating speeds lower than 60 km/h and overestimate higher speeds, posing significant safety concerns. This discrepancy not only challenges prevailing assumptions about roundabout safety but also highlights the potential for a false sense of security among designers. By shedding light on these discrepancies, insights are gained to inform more accurate speed estimation methods, thereby contributing to improved design practices and sufficient speed reduction at roundabouts.
Keywords
Modern roundabouts are designed in a manner that promotes reduced conflict points and speeds through an intersection, improving the safety of the intersection. The perception of superior roundabout safety comes from international studies investigating the conversions of traditional intersections to roundabouts ( 1 ). Accurately estimating operating and fastest speeds at different positions within a roundabout (entry, circulating, and exit) forms a critical part of designing these intersections ( 2 – 5 ) as it is necessary to determine if speeds are adequately reduced according to the operational conditions of the roundabout to promote safety. Inaccurate methodologies for estimating the maximum speeds attainable through modern roundabout designs can lead to a false perception of speed reduction and, consequently, safety.
Although roundabouts are considered amongst the safest intersection types, the roundabout design may lead to unsatisfactory safety effect ( 1 ). Road users should be afforded the opportunity to recover through forgiving roadway and intersection design ( 6 ). Slower maneuvering speeds afford a driver a greater opportunity to identify and react to potential conflicts in the roadway. The geometric features of a roundabout are intended to slow all vehicles approaching and maneuvering through the intersection ( 6 , 7 ).
There is no universal consensus on how to estimate maximum speeds and operating speeds traversing a modern roundabout ( 8 ). In the USA, a method involving a series of reverse curves within a roundabout is used to establish the maximum speeds for entry, circulation, and exit locations. The USA guidelines use the general relationship between speed and curve geometry to estimate these speeds ( 9 ). The framework adopted by the Western Cape Government in South Africa follows a similar approach to that of the USA, except that speeds are derived from a table based on the general speed–curve equation ( 10 ). Australia ( 5 ) and the UK ( 4 ) focus primarily on determining entry paths to estimate speed, differing mainly in the distances at which path curves are drawn and the radius over which speed is estimated. Neither Australian nor UK guidelines explicitly outline the calculation method for speeds derived from entry paths ( 4 , 5 ). In the Netherlands, guidelines are provided solely for determining circulation speeds within a roundabout, utilizing a relationship between vehicle path and curve radius ( 2 ). A clear lack of consensus is evident for determining speeds through roundabouts, which also leads to questioning how these estimated speeds compare with actual, observed speeds.
Šurdonja et al. ( 11 ) conducted investigations on the maximum speed–path definition at three single-lane roundabouts in Croatia, focusing on the guidelines from the Netherlands and the USA. The study by Šurdonja et al. ( 11 ) considered the 85th percentile speed on entry, circulating, and on exit to the roundabout and aimed at identifying the basic vehicle movement path elements at which maximum speed is achieved. The Federal Highway Administration (FHWA) methodology provided by the USA guidelines yielded speeds that differed significantly from the measured speeds ( 11 ).
This study conducts a comparative analysis of the fastest safe traversable speeds as determined by international roundabout guidelines and those achieved by a test vehicle navigating the same roundabouts. The guidelines were chosen based on their accessibility and geographical diversity, representing a comprehensive cross-section of roundabout design practices from four different continents. A sample of 29 single- and double-lane roundabouts were investigated with the fastest safe traversable speeds being representative of a prudent driver who is in a hurry in the absence of conflicting traffic. An enhanced understanding of the accuracy of and the relationship between these speeds will afford designers the opportunity to understand the shortcomings of each of the guidelines investigated. It will also highlight the false perception of safety created when applying these methodologies for speed reduction and warrant the consideration of alternative means of estimating speeds during the design phase of a roundabout.
This paper is organized by first evaluating and summarizing the existing methodologies for determining highest safe traversable speeds and entry speeds from Australia, the Netherlands, the UK, the USA, and South Africa. It then compares the outcomes of these methodologies with empirical data gathered by a test vehicle maneuvering through roundabout intersections at the highest safely traversable speeds, providing insight into the accuracy of each method.
Speed Determination at Roundabouts
Fastest Path Determination
Roundabout design speeds are determined along the fastest path and entry path allowed by the proposed geometry of the intersection. The fastest path is the smoothest, straightest possible path for a single vehicle traveling through a roundabout in the absence of other traffic and ignoring all lane markings ( 12 ). In most cases, the fastest path analysis is only applicable to the through movement and left-turn critical movement (in the case of left-hand driving), depending on the alignment of the approaches to the roundabout. The fastest path for the through movement is achieved through a series of reverse curves. The design speed of the roundabout is determined by the smallest possible radius along which the fastest path occurs, usually along the circulatory roadway ( 13 ). It is important to ensure that the radius of the entry path is not significantly larger than the circulatory radius, this ensures speed consistency through the roundabout. Novák et al. ( 1 ) proved that roundabout entry design characteristics have a statistically significant relationship with safety in regard to crash frequency and severity.
The determination of the fastest path is a subjective process that requires a certain amount of personal judgment from a traffic engineer, ultimately leading to a large variability in designs and interpretations. Theoretical fastest paths are drawn over a plan of a roundabout for all approaches to determine the associated speeds during the design process of a roundabout ( 12 ).
The fastest path and entry path of a vehicle are evaluated once the inscribed circle diameter (ICD), circulatory roadway width, and initial geometry of the roundabout have been designed ( 9 ). If the required design speed is found to be higher than the fastest path speed, alterations to the design of the roundabout should be made to reduce operating speeds ( 9 ). Examples of alterations are to increase the size of the central island, offset the approach, reduce entry width, or reduce entry radius. Care should be taken to ensure that these changes do not affect the ability of the roundabout to accommodate the design vehicle ( 14 ).
Country-specific guidelines are used in many countries to evaluate the fastest path for a roundabout design. The following section describes the various methods applied internationally to evaluate the fastest path through a roundabout.
Speeds Traveling through a Roundabout
Achieving appropriate vehicular speeds through a roundabout is the most critical objective of roundabout design because of the impacts that reduced speeds have on safety ( 12 ). An appropriate design reduces the relative speeds between conflicting traffic streams by forcing vehicles to negotiate the intersection along a curved path ( 12 ). In multilane roundabouts, increasing the path curvature of vehicles decreases the relative speeds between entering and circulating vehicles but increases the side friction between adjacent traffic streams within the circulating lanes. Increased side friction can result in more vehicles cutting across lanes and increases the potential for sideswipe crashes. Relatively uniform speeds of all drivers negotiating the roundabout makes it easier for drivers to choose their desired paths in a safe and efficient way ( 12 ). Roundabouts designs should ensure slow and consistent traversing speeds ( 7 ).
Several studies have proven that there is a direct relationship between geometric design that allows high speeds through a roundabout and the frequency of angled crashes, associated with the failure of drivers to give way to those already circulating ( 14 ). The sudden application of brakes also results in an increased frequency of rear-end crashes as drivers have insufficient time to react and stop from high approach speeds ( 14 ). The vehicular volume directly impacts the frequency of crashes, whereas increased vehicular speeds are strongly associated with both greater crash severity and a heightened likelihood of crashes ( 9 ). The main parameters used in the standards to control speeds through a roundabout are the radius of deflection, entry path radius, and the deviation angle ( 14 ).
Speed–Curve Relationship
The layout of roundabouts and the requirement to maneuver through successive reverse curves introduces centripetal forces acting on vehicles toward the centers of these reverse curves ( 15 ). Equation 1 illustrates the basic equation for maximum speed through a curve, derived from the laws of mechanics to calculate the maximum speed that can be achieved while moving through a simple curve in highway design. Equation 1 indicates that the maximum speed that can be achieved around a curve (V) is a function of the radius of the curve (R), the superelevation rate (e) and the side friction factor (f). The side friction factor itself is a function of vehicle speed (v), gradient of the road (g), the vehicle type, and its tires, according to Equation 2.

Typical comfortable side friction values range from below 0.15 for speeds higher than 70 km/h to 0.4 for speeds as low as 15 km/h ( 15 ). Kordani et al. ( 16 ) investigated new formulas for determining the side friction factors for various vehicles. Equation 2 illustrates the side friction factor model developed for a Mercedes E-Class sedan.

Speed prediction on simple highway curves is typically modeled with an emphasis on gradual changes in speed as vehicles negotiate the curve. Roundabouts require sharper curves and involve more complex interactions between geometry and driver. While general principles of speed prediction apply to both roundabouts and simple curves, roundabout navigation is further influenced by factors such as deceleration, acceleration, gap acceptance, and the interaction between entering and circulating traffic streams. These differences present unique challenges in predicting and managing speeds through roundabouts as compared with other curvilinear road geometries.
Existing International Models for Fastest Path Evaluation
Existing international guidelines for the determination of speeds through a roundabout focus on the fastest path along which a vehicle can travel through a roundabout and/or the entry path of a vehicle. These guidelines all assume that the path of a vehicle through a roundabout consists of multiple curves, even for the “straight through” movement ( 17 ). The guidelines covered share common typical distances from road centerlines and curbs, denoted as D1 for a 1 m distance and D2 for a 1.5 m distance, in the respective figures.
In most cases, engineers draw the fastest path of the roundabout using rules set out by the specific guideline. The estimated radius of the vehicle path is then used to evaluate the speed that vehicles can achieve through the roundabout. For each guideline that is described in this paper, a figure has been prepared to describe the procedure. Common characteristics are indicated with the same nomenclature.
Australia
Australian guidelines emphasize entry path radius and provide procedures to construct the entry path ( 5 ). Construction procedures for the entry paths differ for single-lane roundabouts and double-lane roundabouts (with vehicles staying in one lane or cutting across lanes) ( 14 ).
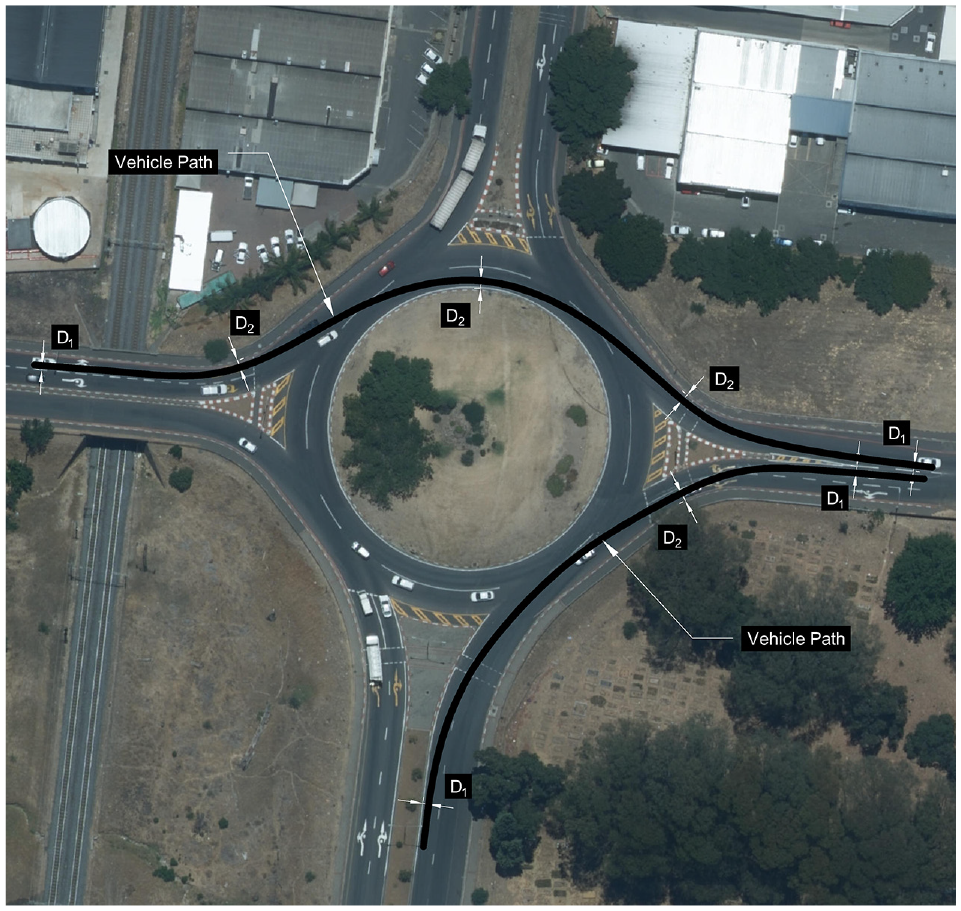
Figure 1 illustrates the Austroads ( 5 ) procedure for entry path determination for single-lane roundabouts. Values for the offsets “D1,”“M1,” and “M2” are specified in Figure 1, where M1 and M2 are the half-width of the approach and circulating lanes respectively. Note that left-hand drive is applicable in Australia. The procedure is as follows:
Step 1—The approach path is drawn parallel to the right edge of the approach roadway at an offset of “D1” from the centerline of the road. In the presence of an approach curve, this line should be drawn along the last approach curve in the direction of travel at an offset of “M1”.
Step 2—A curved line is drawn offset from the edge of the central island by half the circulating lane width. For non-round roundabouts the line may comprise multiple radii.
Step 3—A curved line is drawn offset from the left edge of the entry lane by “D1”.
Step 4—Draw the entry path as a circular curve by linking the lines drawn in Steps 1 to 3.
A similar approach is followed for double-lane entries where vehicles are assumed to cut across lanes. The major difference in this approach is that a vehicle is assumed to begin in the right lane on approach to the roundabout and cuts across to the left lane on entry to the roundabout. The vehicle is assumed to circulate in the middle of the two lanes, as illustrated in Figure 2. In all cases, the instances where vehicles cut across lanes result in higher speeds than when vehicles do not cut across lanes because of the flatter path followed by the vehicle.
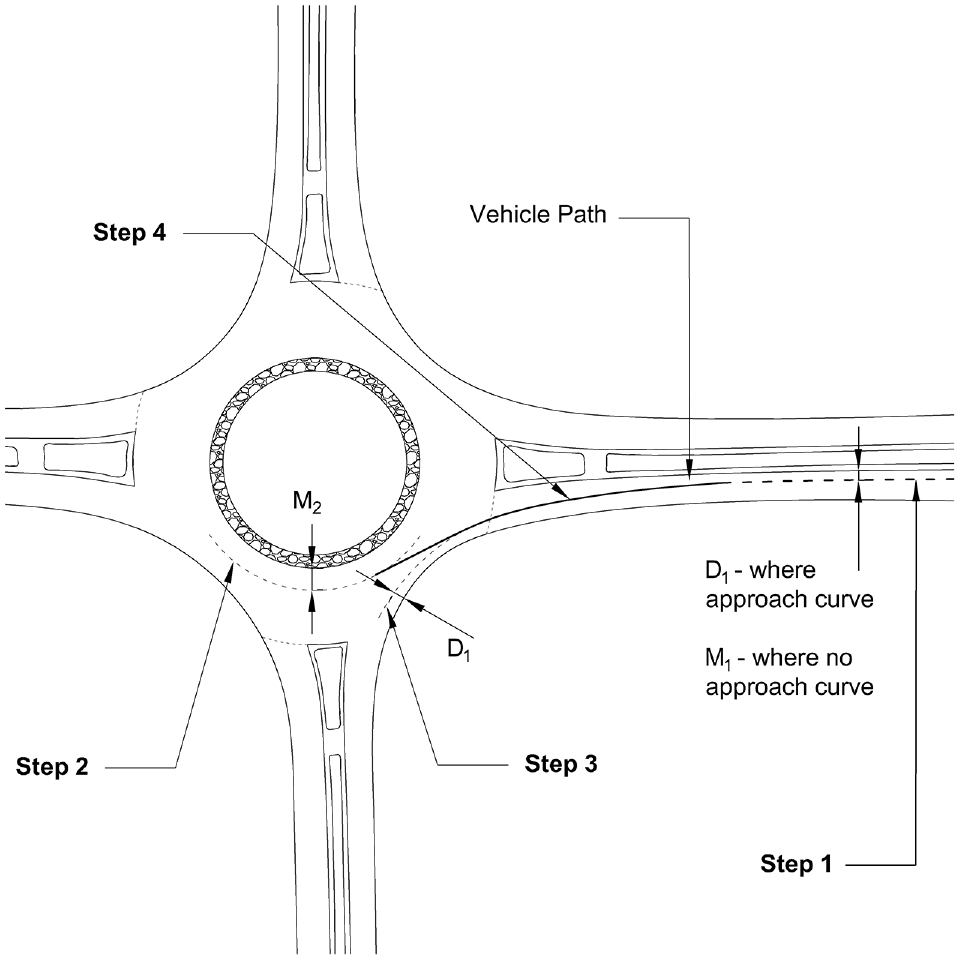
Entry path determination for single-lane roundabouts.
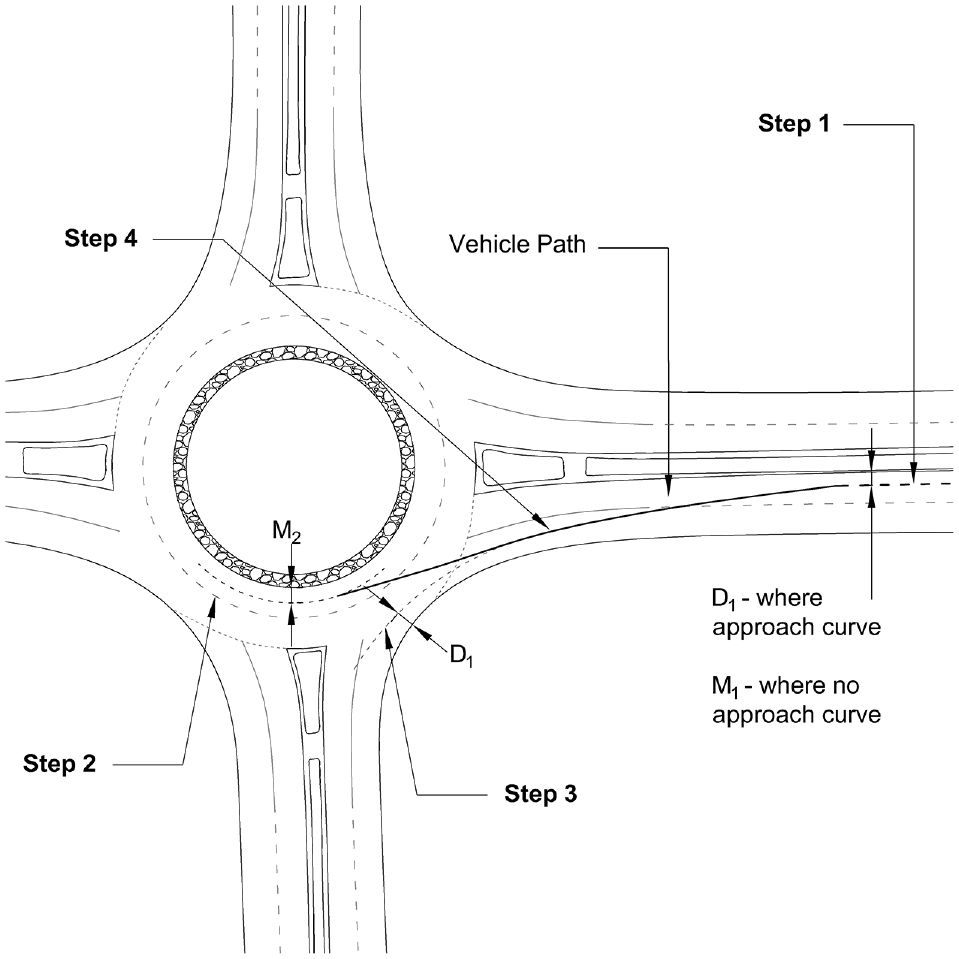
Entry path determination for double-lane roundabouts—cutting across lanes.
The design of the roundabout is considered inappropriate if a circular curve cannot be drawn according to Step 4 ( 5 ). Various alterations should be made to the design of the roundabout if the measured path radius exceeds the maximum threshold value of 55 m for the entry path radius of single-lane and double-lane roundabouts. Design adjustments include tightening the entry curve, relocating the approach leg, and/or increasing the roundabout size to limit the entry path radius ( 5 ).
The Australian guidelines do not provide an equation to estimate the speed of vehicles. The guidelines recommend evaluating the correctness of a roundabout according to the radius of the entry path of the roundabout, rather than considering the fastest path speeds. Maximum speeds can be calculated by from entry path radius using the general speed–curve equation.
The Netherlands
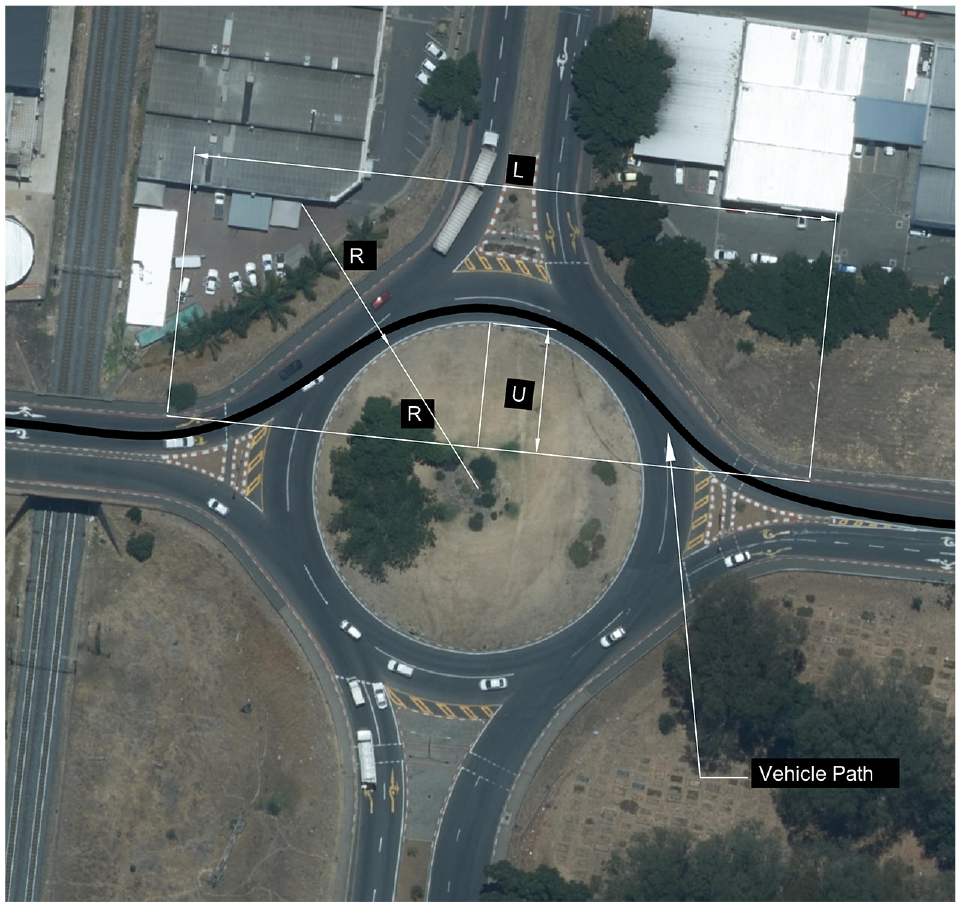
The roundabout standard in the Netherlands ( 2 ) does not require a fastest path to be drawn. Rather, the maximum speed that can be achieved along the circulating path of the through movement is evaluated from two measurements of importance: “U” and “L” as illustrated in Figure 3. “U” represents the lateral deflection in meters from the outer edge of the central island to the edge of the road if a roundabout was not in place, and “L” is the distance between the tangent of entry radius and tangent of exit radius in meters ( 2 ). The same methodology is used in the Slovenian guidelines ( 18 ).
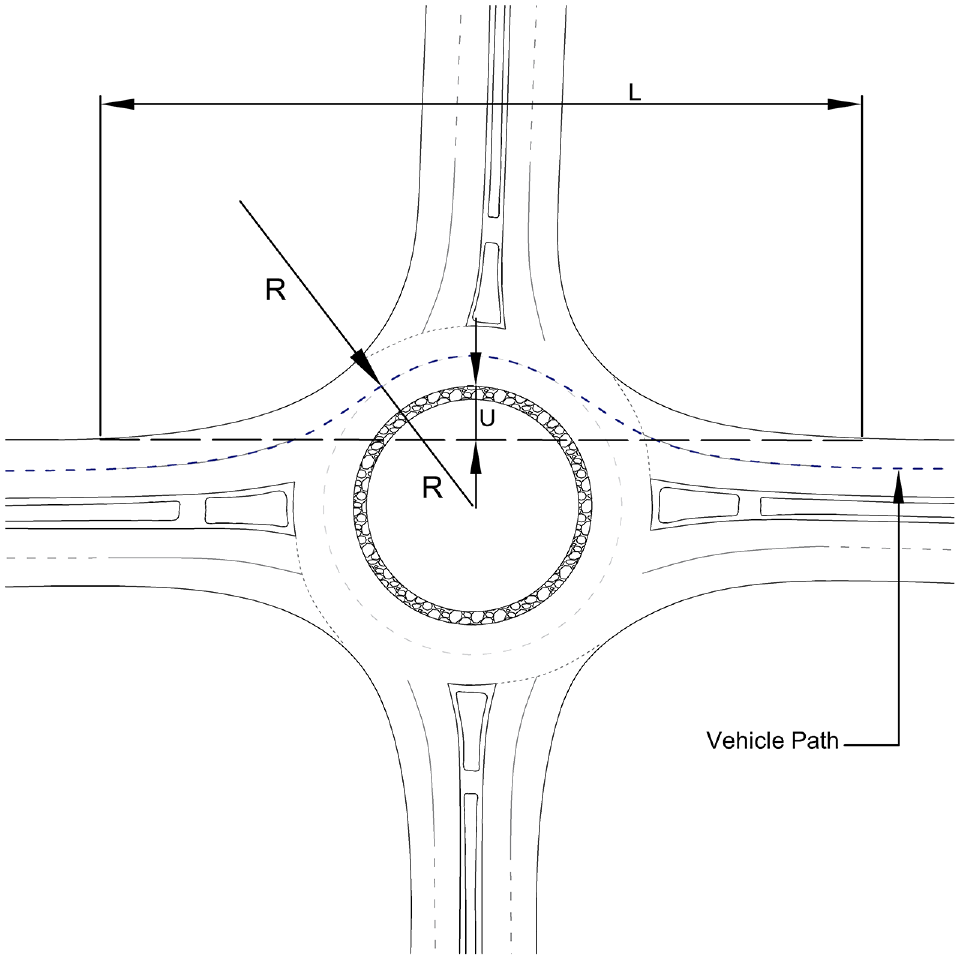
Deflection and vehicle path.
Equation 3 is used to determine the vehicle path radius (R) from “U” and “L.”
The fastest path speed (V) is then calculated using Equation 4. Design adjustments to the roundabout are required if the estimated fastest path speed is higher than 35 km/h ( 2 ).

The United Kingdom
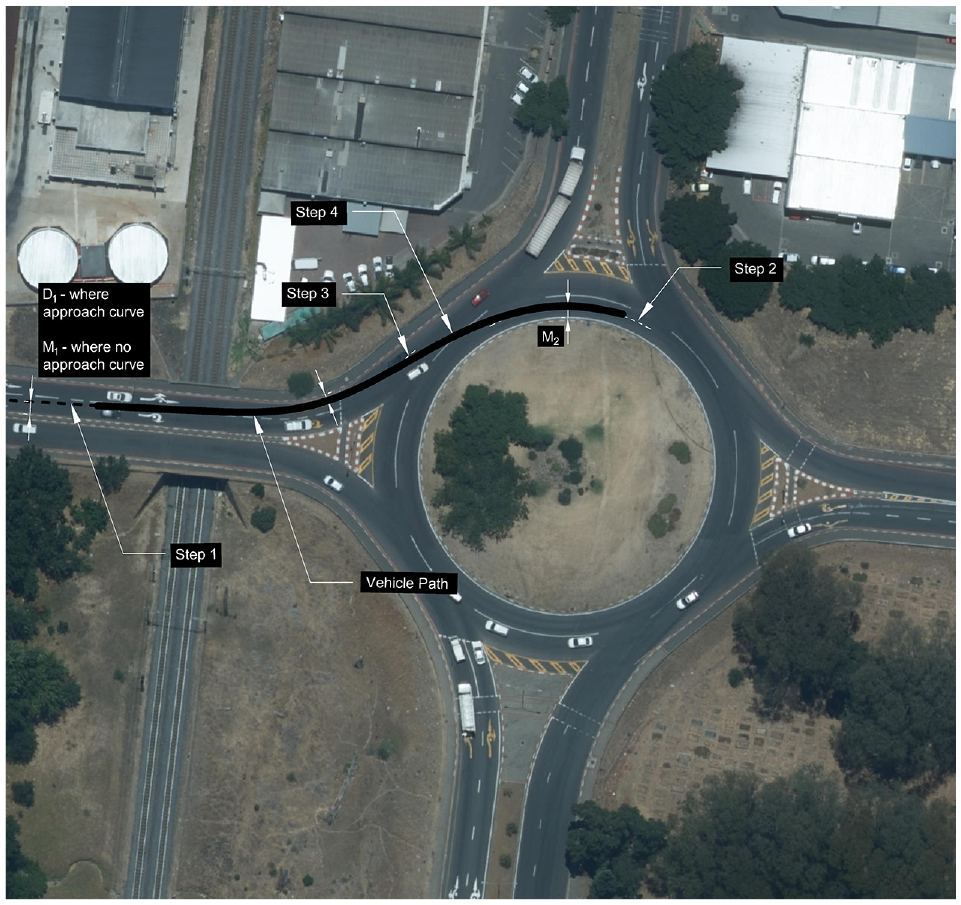
The UK guidelines only evaluate the fastest entry path of vehicles in a roundabout for the through and left turn movement. The entry path radius measures the deflection imposed on vehicles entering a roundabout governing the traversing speeds ( 19 ). This deflection occurs as the path on entry bends to the left before joining the circulatory carriageway and should not be confused with the entry curve radius ( 19 ). The Highways Agency ( 20 ) assumes an entry path of 2 m wide to ensure that the vehicle taking the fastest path maintains a minimum distance of 1 m between the centerline and the outside curbs or edge markings. The fastest path starts at a maximum of 50 m upstream of the yield line. The measurement of the entry path radius should be the smallest best fit curve over a 25 m distance on approach to the roundabout, no more than 50 m from the yield line ( 14 ).
Figure 4 illustrates the technique used to determine the fastest entry path radius for a roundabout with four approaches as per guidelines from the UK ( 4 ). Dimension “R” illustrates the entry path radius, not more than 50 m before the yield line. Point “b” signifies the start of the fastest path curve, a minimum distance of 50 m from the yield line and at least 1 m from the nearside curb. Figure 5 illustrates the approach for determining the entry path radius for the left turn movement at a roundabout with three approaches for which an identical method is followed. Once radius “R” has been evaluated through the drawing of vehicle path, it is applied in Equation 1 to estimate maximum speed.
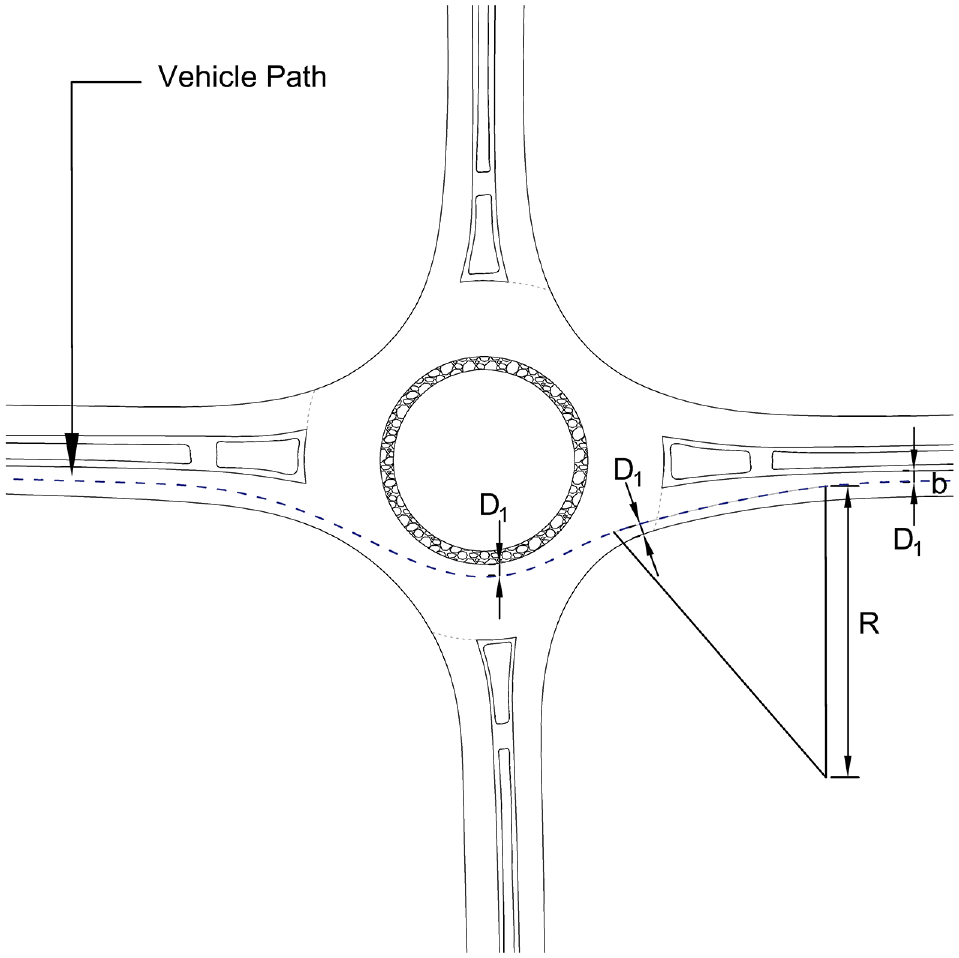
Entry path radius determination for four-legged roundabout.
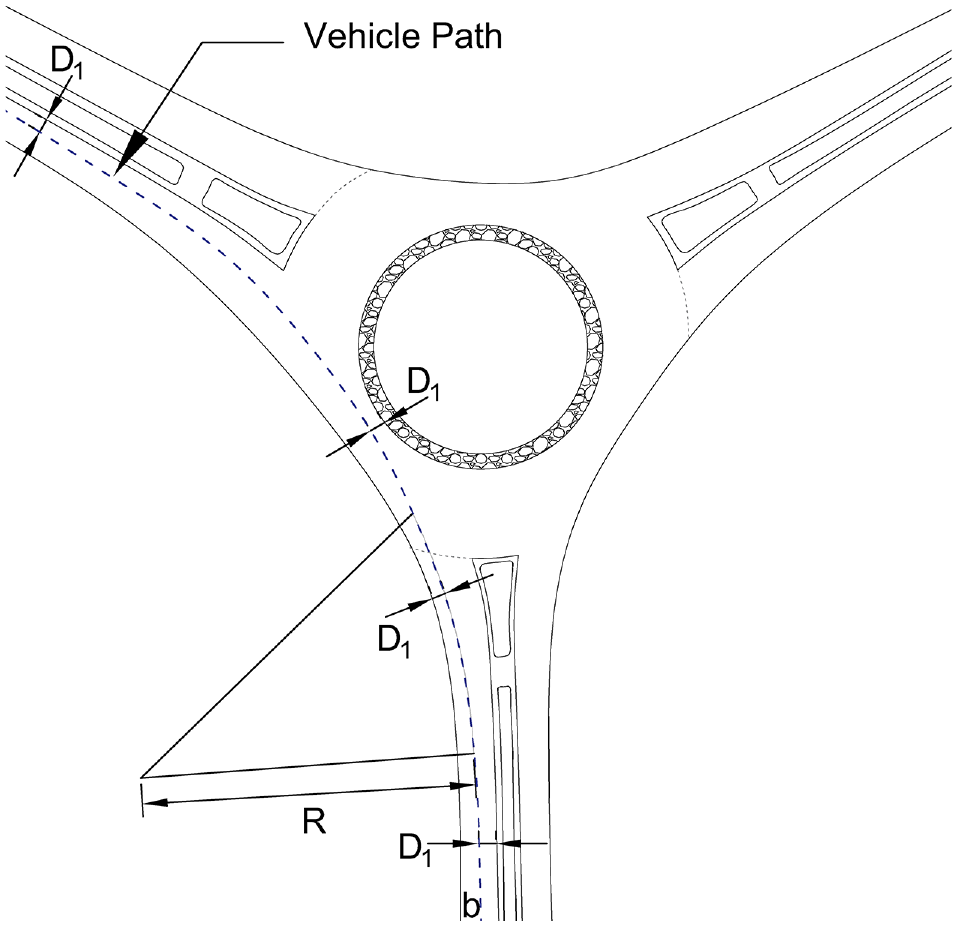
Entry path radius determination for left turn at a roundabout with three approaches.
The scenario where the approach curves to the left is more likely to produce small entry path radii for the best fit curve over the 25 m distance on the arc. The scenario where the approach curves to the right may therefore flatten the entry path significantly.
The United States of America
The speed through a roundabout is determined by drawing the smoothest, flattest path a vehicle can traverse through the intersection, ignoring all lane markings, in the absence of opposing traffic ( 12 ). Rodegerdts et al. ( 12 ) determines the design speed of a roundabout by the smallest radius along sketched fastest path, which usually occurs in the circulatory roadway.
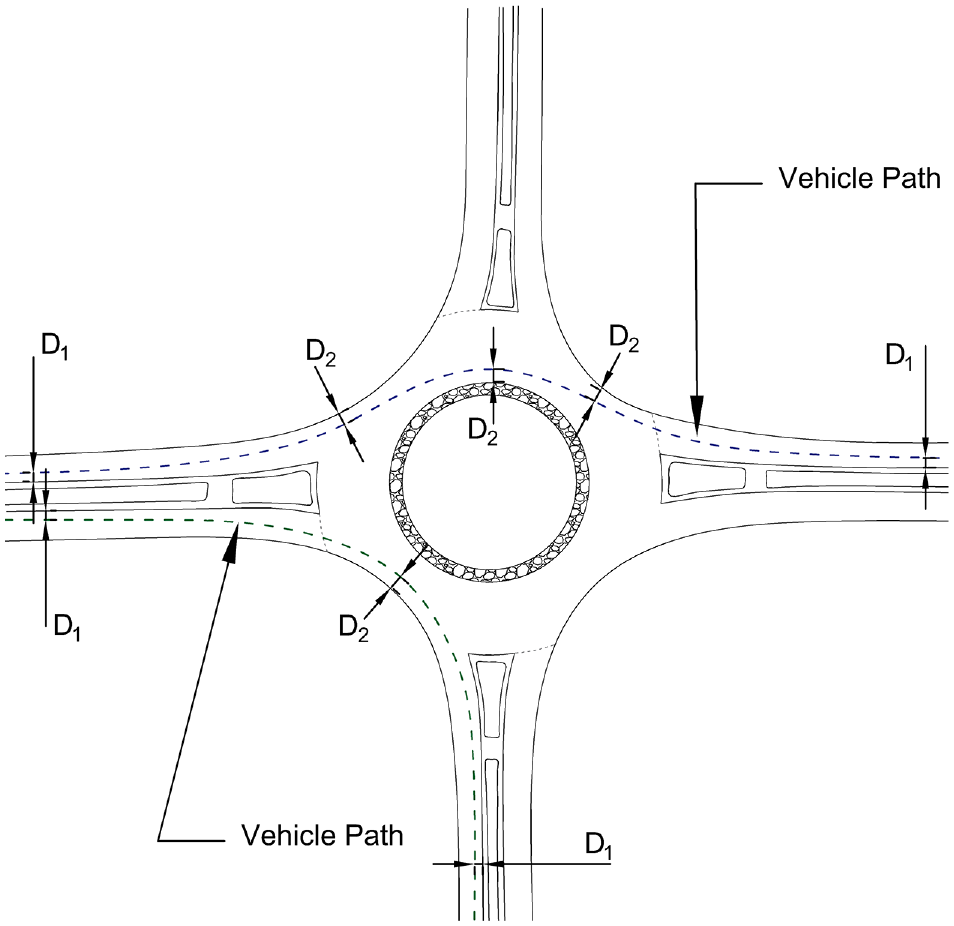
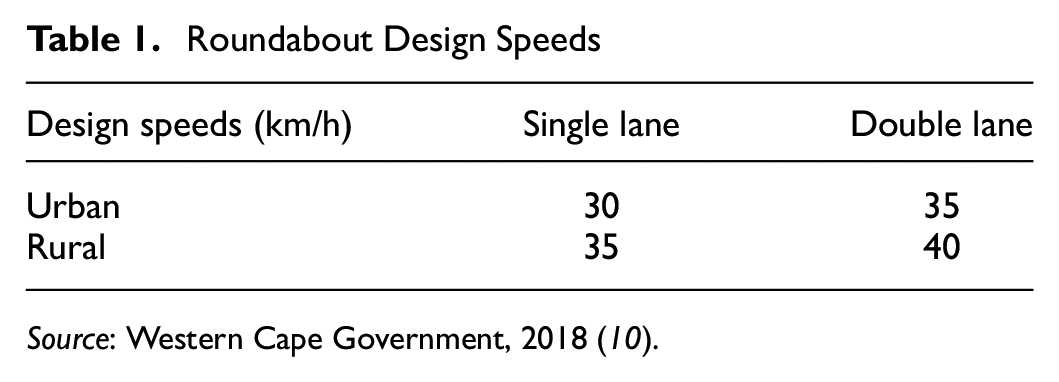
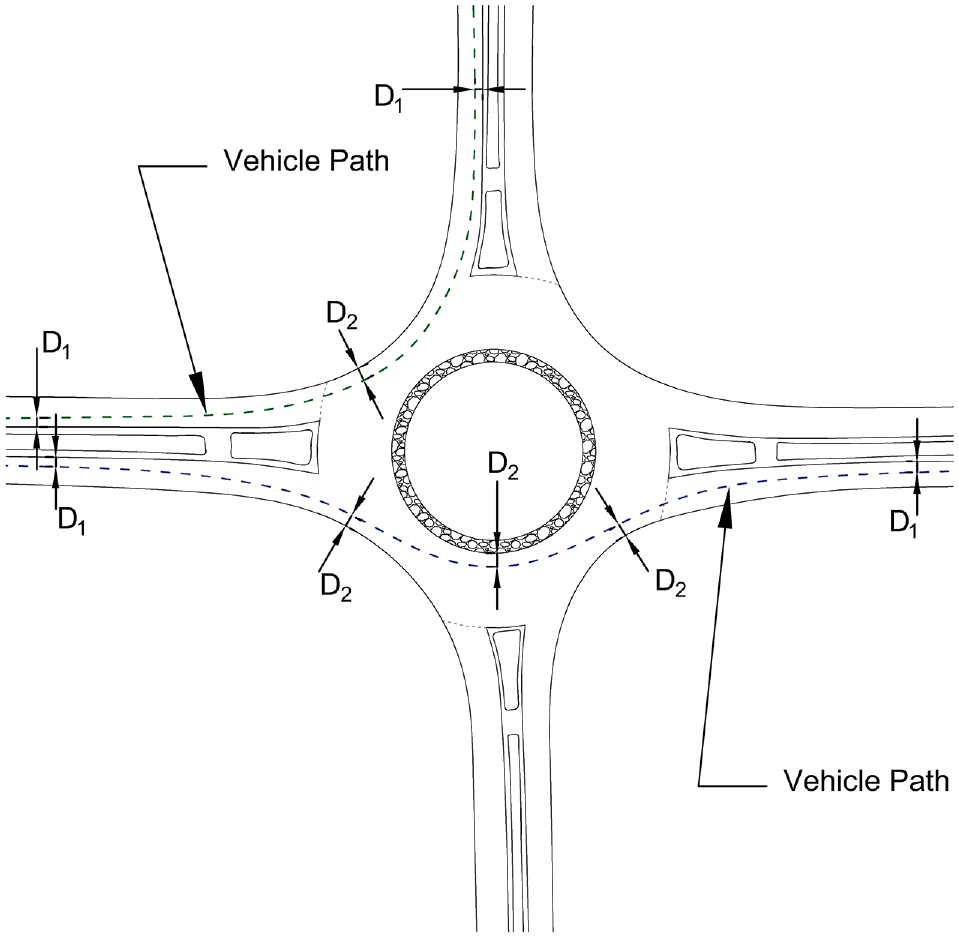
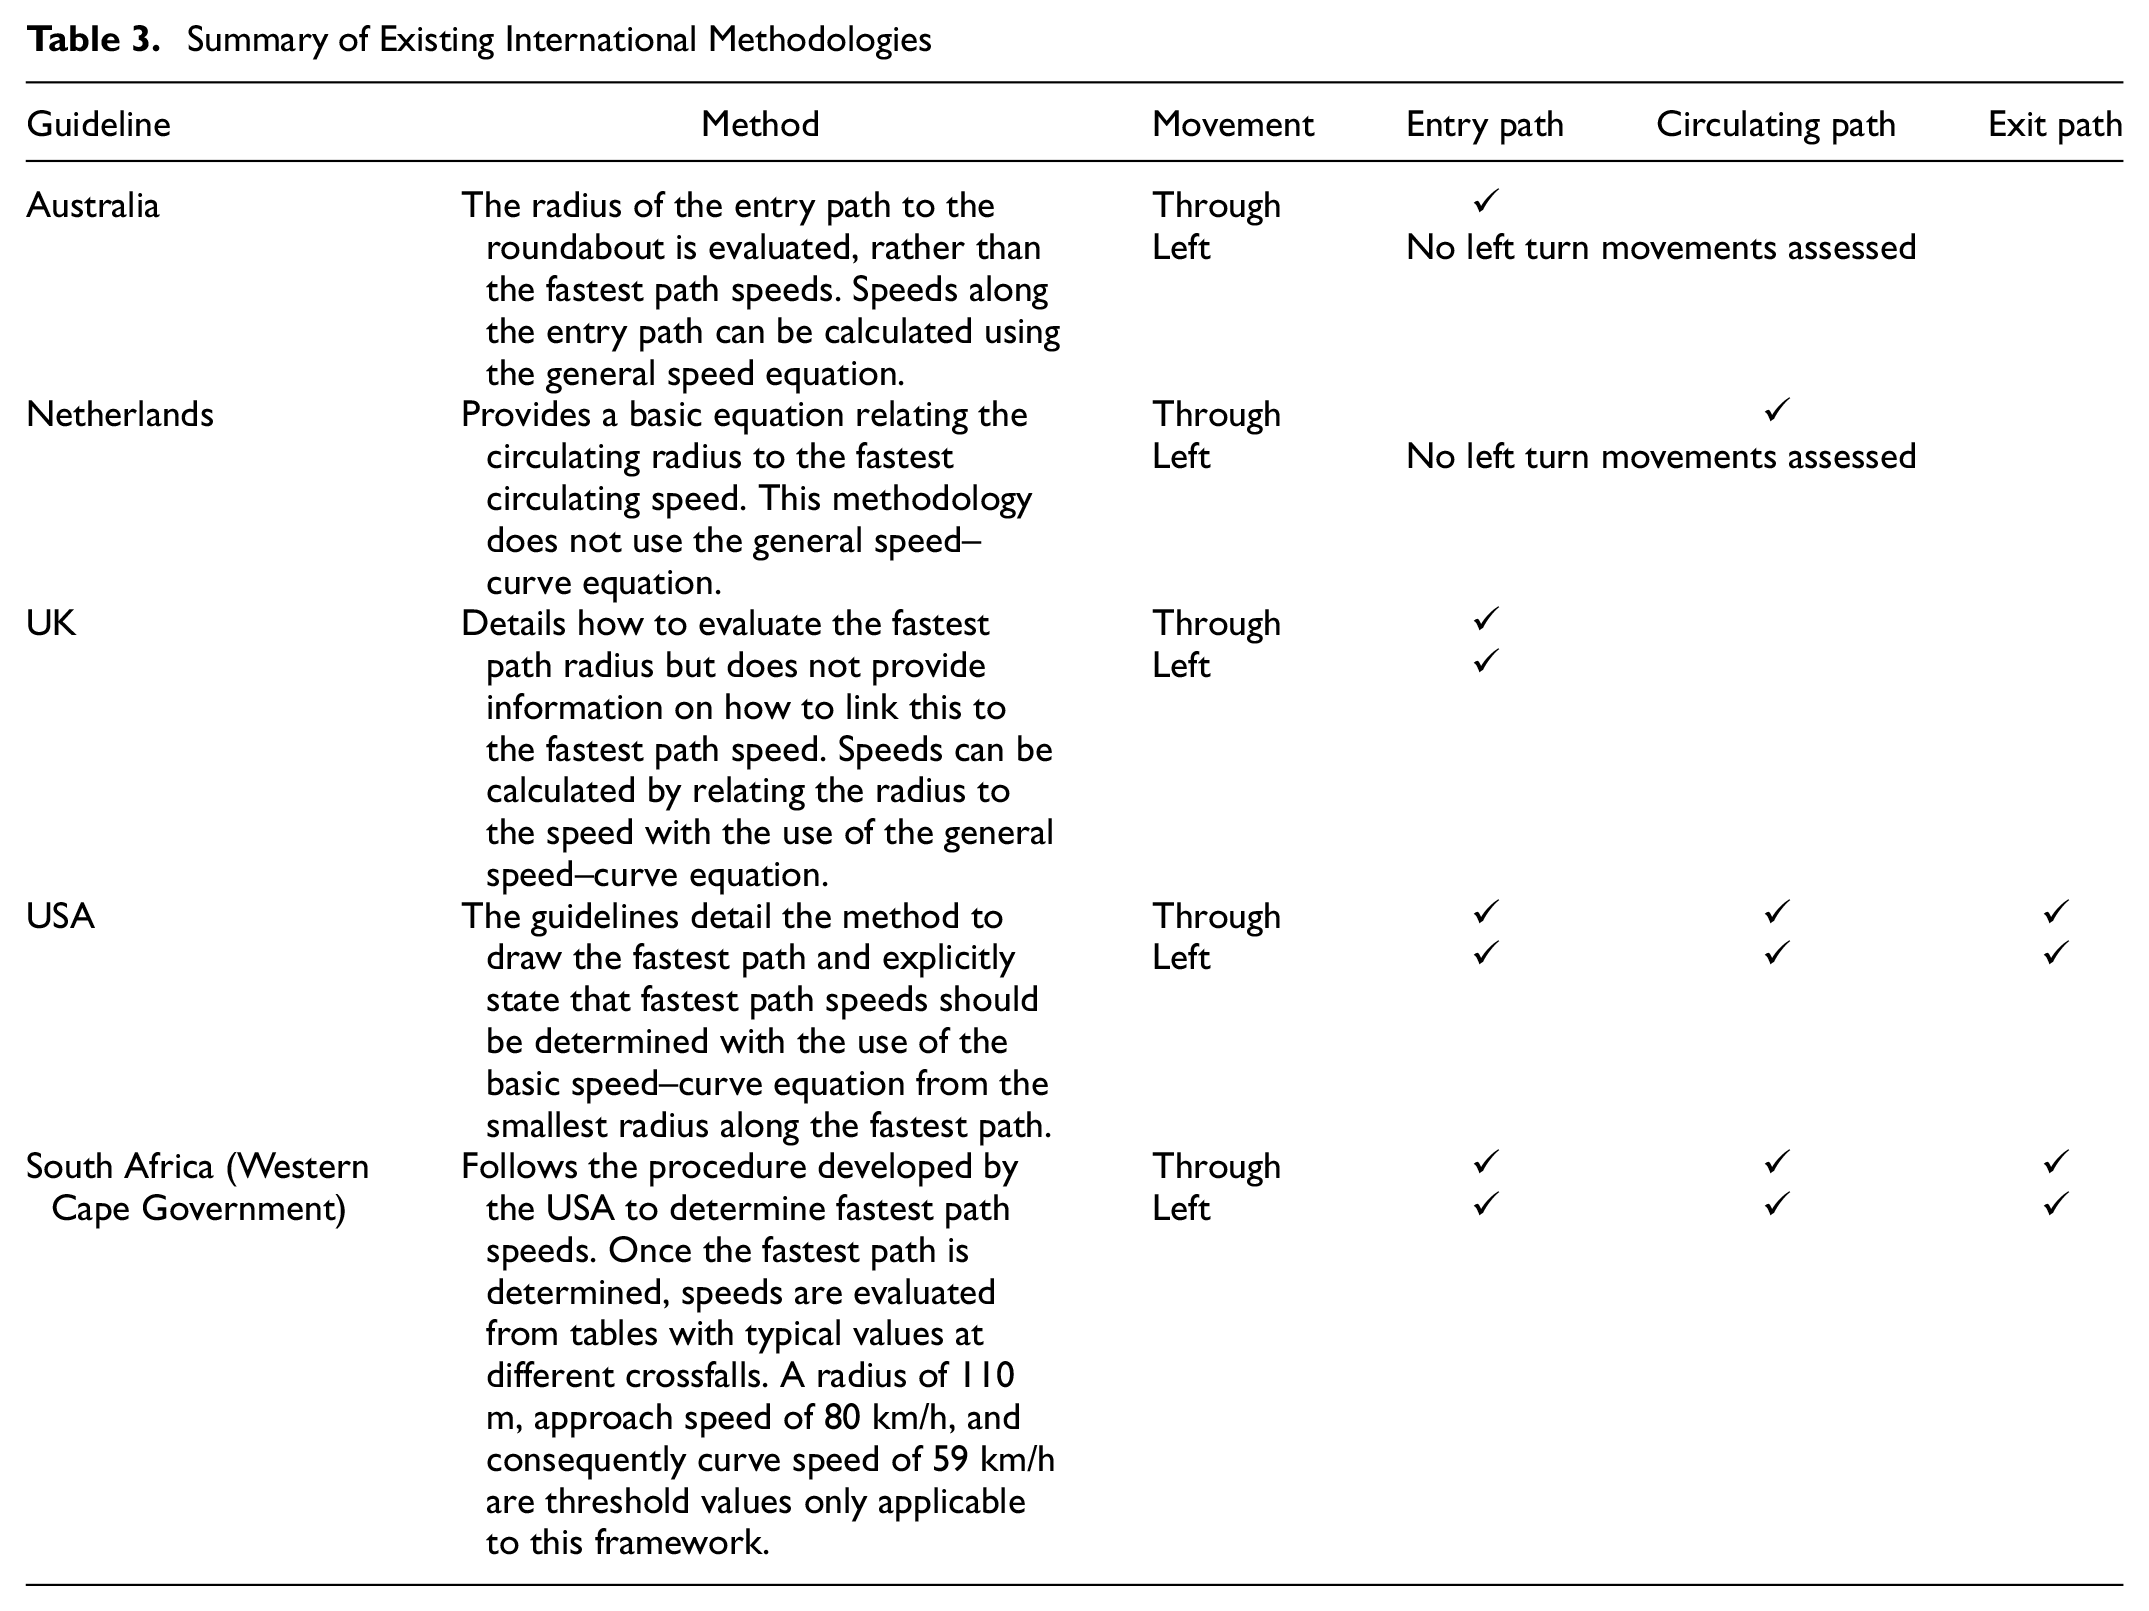
The USA guidelines on roundabouts ( 9 , 12 ) assume a vehicle width of 2 m and clearance of 0.5 m from a concrete curb. The fastest path is drawn at the following distances from the specific geometric feature of the roundabout:
1.5 m (D2) from the concrete curb
1.5 m (D2) from a roadway centerline (in the case of a double-lane roundabout)
1.0 m (D1) from a painted edge line.
Figures 6 and 7 illustrate the determination of the fastest path for the through movement at single- and double-lane roundabouts, respectively. These fastest paths are required to be constructed for all approaches to the roundabout.
Fastest path determination for single-lane roundabout.
Fastest path determination for double-lane roundabout.
Figures 6 and 7 also illustrate the design procedure for the right-turn movement at single- and double-lane roundabouts, which is a critical movement producing fast speeds. The fastest right-turn path is dependent on the layout and angles of the approaches to the roundabout. Both single-lane and double-lane roundabouts share the same fastest path design procedure for critical right-turn movements.
The radii along the constructed fastest paths are then extracted at the desired locations and Equation 1 is used to estimate the speeds. It should be noted that the USA Guide for Roundabout uses the fastest path analysis as a surrogate metric for safety, not as a direct predictor of speed ( 3 , 9 , 12 ), however the direct relationship between radius and speed is used in this paper for comparison with other international guidelines.
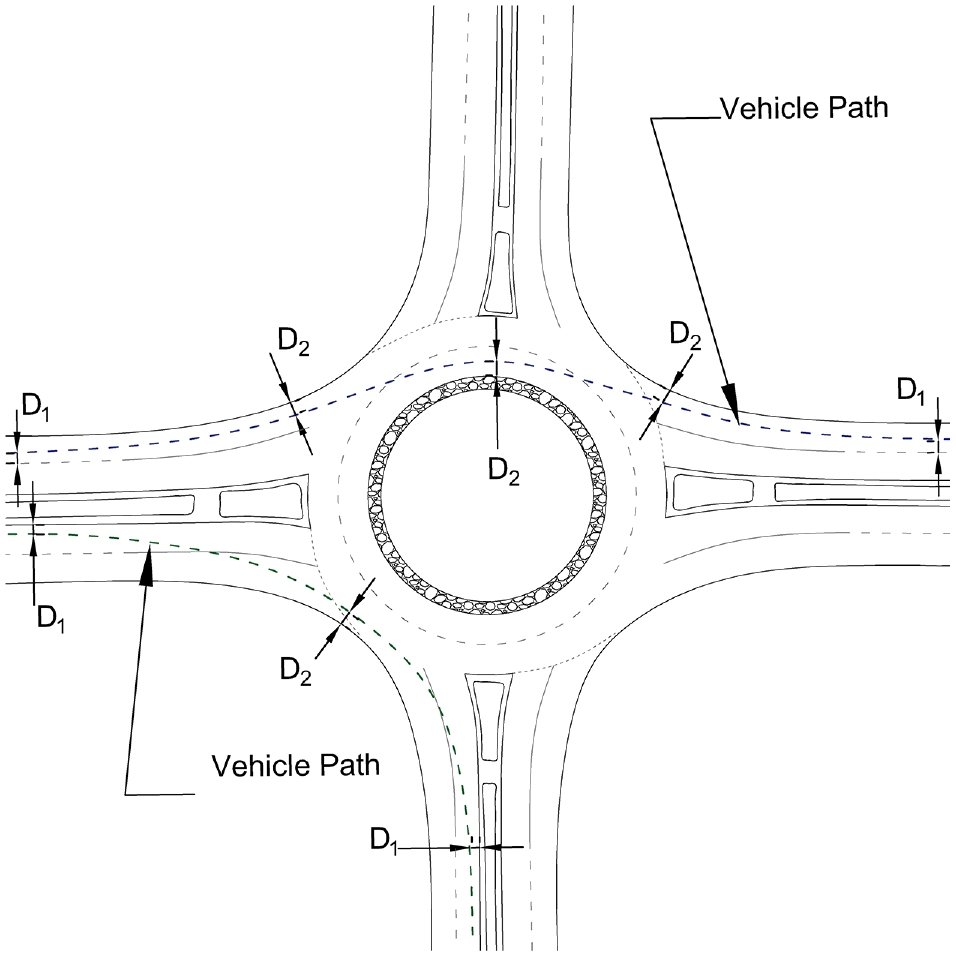
South Africa
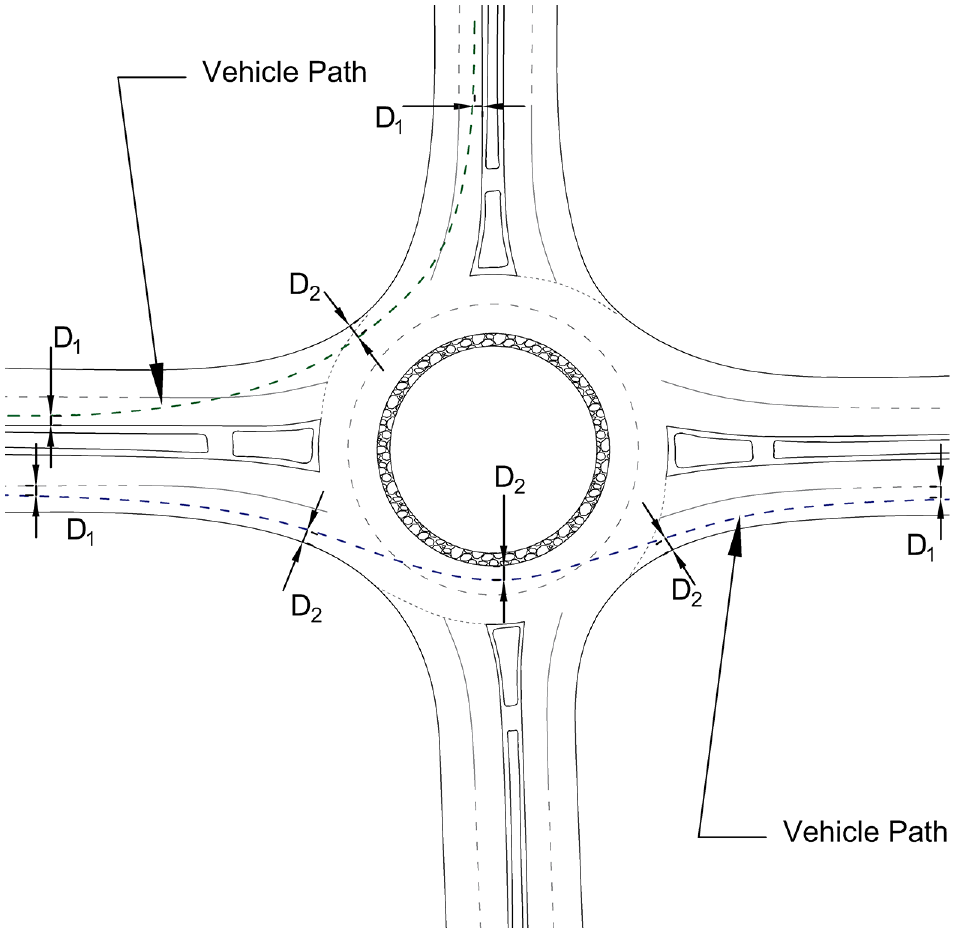
In this paper, the guidelines for the design of single-lane and double-lane roundabouts of the Western Cape province of South Africa are considered. These guidelines stipulate maximum design speeds which should not be exceeded by fastest path speeds for all movements within a roundabout ( 10 ). Table 1 illustrates these upper-limit design speeds for roundabouts in urban and rural locations. Figures 8 and 9 illustrate the methods for determining the fastest path at single-lane and double-lane roundabouts for vehicles driving on the left-hand side of the road. The method for drawing the fastest path is similar to the USA guidelines.
Roundabout Design Speeds
Source: Western Cape Government, 2018 (10).
Fastest path determination for single-lane roundabouts.
Fastest path determination for double-lane roundabouts.
Using the basic curve equation, illustrated in Equation 1, the Western Cape Government ( 10 ) in South Africa devised two tables for estimating the 85th percentile speeds through a curve (or in a roundabout) for +2% and -2% crossfall according to various circulating path radii. These tables have been combined and illustrated in Table 2, stating the upper limits for −2% and +2% superelevation for different approach speeds and determined radii. A maximum circulating speed of 59 km/h for an approach speed of 80 km/h and a radius of 110 m is tabulated.
Estimated 85th Percentile Speeds (km/h) From Radii (m) for −2% and +2% Cross-Fall Within a Roundabout
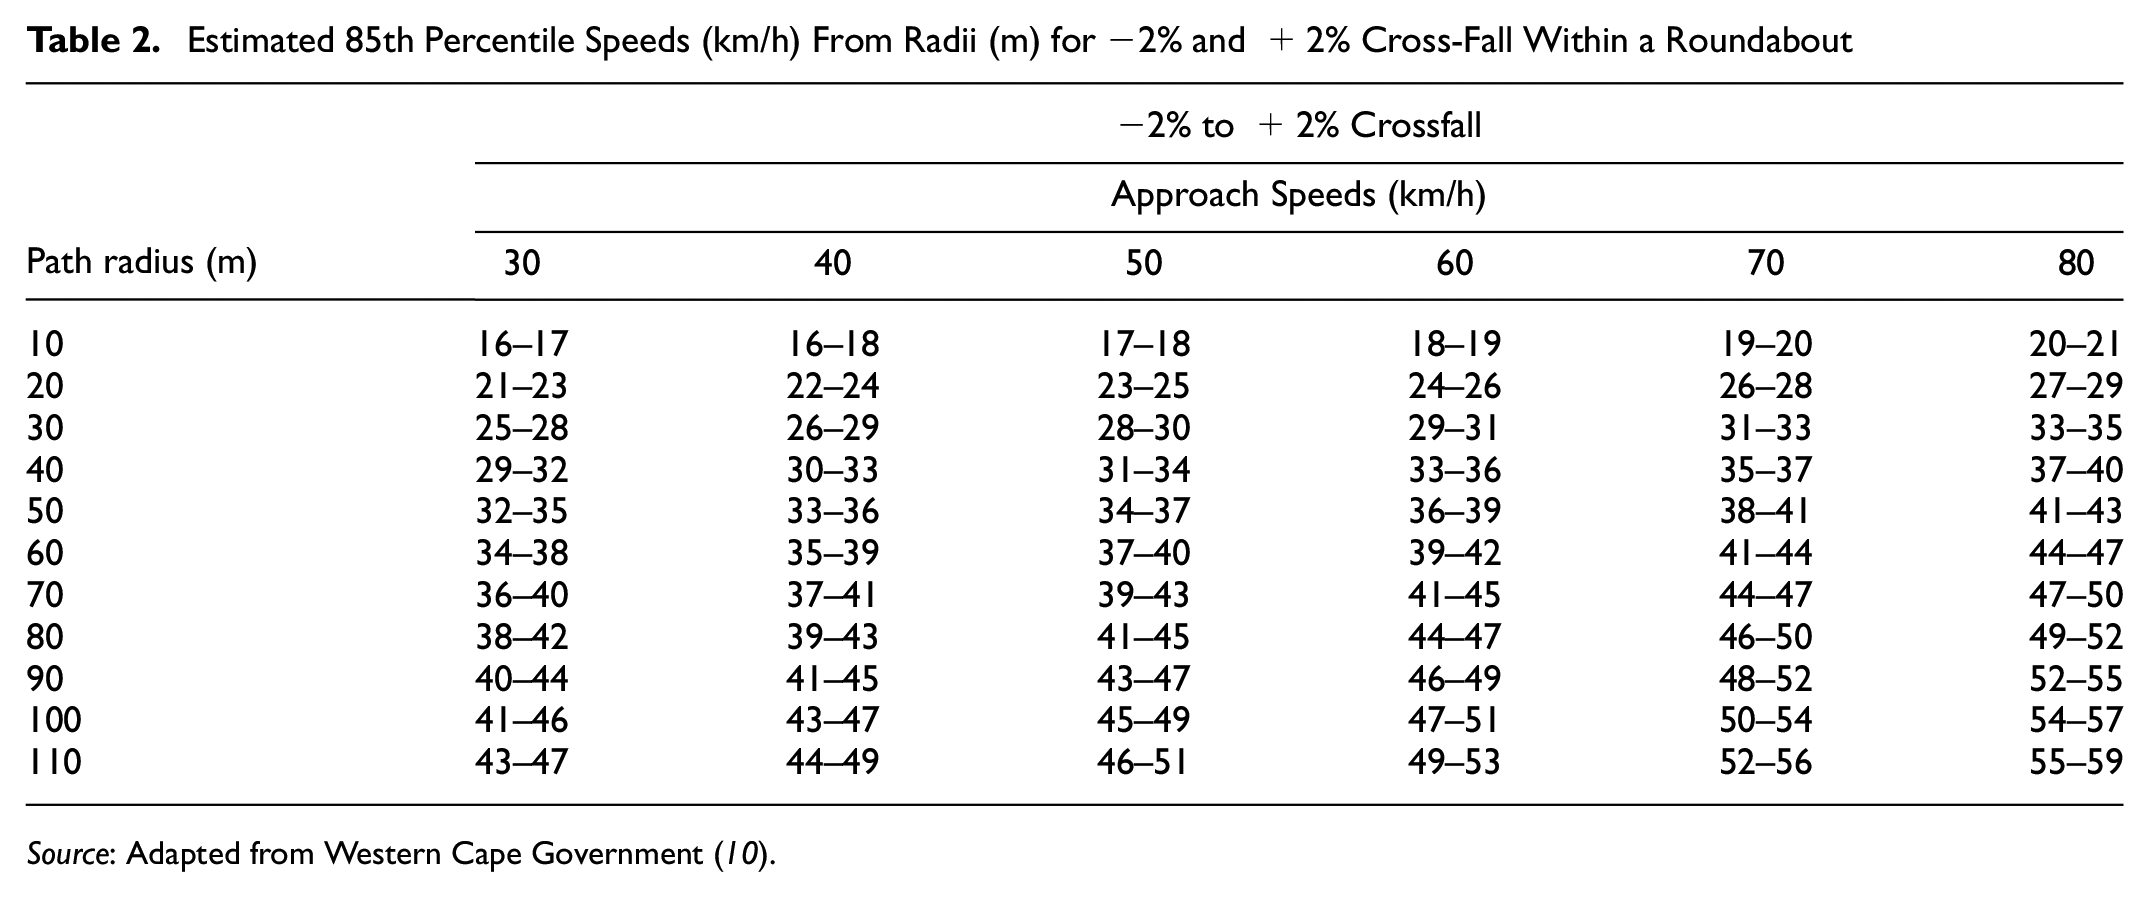
Source: Adapted from Western Cape Government ( 10 ).
Summary of Existing International Methodologies
The described guidelines with their respective prescribed methodologies to determine the fastest path or entry path speeds are summarized in Table 3, illustrating the movement and the path radii that can be extracted from each guideline. All methods require a certain amount of engineering judgment to be practiced which will result in different designs and results for each engineer executing the analysis.
Summary of Existing International Methodologies
Methodology
The methodology of this study centers on a quantitative analysis aimed at evaluating the accuracy of international roundabout guidelines in estimating fastest path and entry path speeds. With the use of a comparative approach, theoretical speeds derived from these guidelines are compared with actual speeds obtained through test vehicle measurements using the Passing–Bablok regression analysis technique.
Study Area
The study focused on roundabouts located in seven South African cities: Cape Town, Stellenbosch, Paarl, Worcester, George, Wilderness, and Bloemfontein. These locations were chosen for their geographical accessibility, ensuring a representative sample of both urban and semi-urban settings. A total of 29 roundabouts were analyzed, including eight single-lane and 21 double-lane roundabouts, with ICDs ranging from 14 to 42 m. All selected roundabouts had four approaches with varying geometries, allowing for a robust comparison of the international methodologies across different contexts.
Data Collection
Drawing package, AutoCAD, was used to draw theoretical fastest paths and entry paths on scaled aerial photographs of each roundabout, following each described international guideline. This process included determining the radii for vehicle paths during entry, circulation, and exit, which were then used to calculate speeds using Equation 1, or in the case of the Netherlands, using Equation 4. Figures 10 to 13 illustrate examples of theoretical fastest path created using guidelines from the USA (and South Africa, which follows the same approach), Australia, the UK, and the Netherlands respectively, from which radii were extracted and speeds were determined.
Theoretical fastest path using the USA and South African guidelines.
Theoretical fastest path using the Australian guidelines.
Theoretical fastest path using the UK guidelines.
Theoretical fastest path using guidelines from the Netherlands.
Actual fastest path speeds were collected using a test vehicle at all 29 roundabouts, between February and July in 2022. The test vehicle was a nimble 63 kW Polo Vivo hatchback, a popular vehicle in South Africa, during the time of the study. An onboard GPS tracking device (VBox Sport [global positioning system] tracker) recorded the test vehicle’s position and speed during maneuvers through the roundabouts. Data on fastest path speeds were collected for both through movements and left-turn movements. Figure 14 indicates an obtained fastest path of the test vehicle through a particular roundabout for the straight and left-turn movements. The test vehicle was noted to take a similar path through the roundabout as compared with the existing international guidelines investigated.
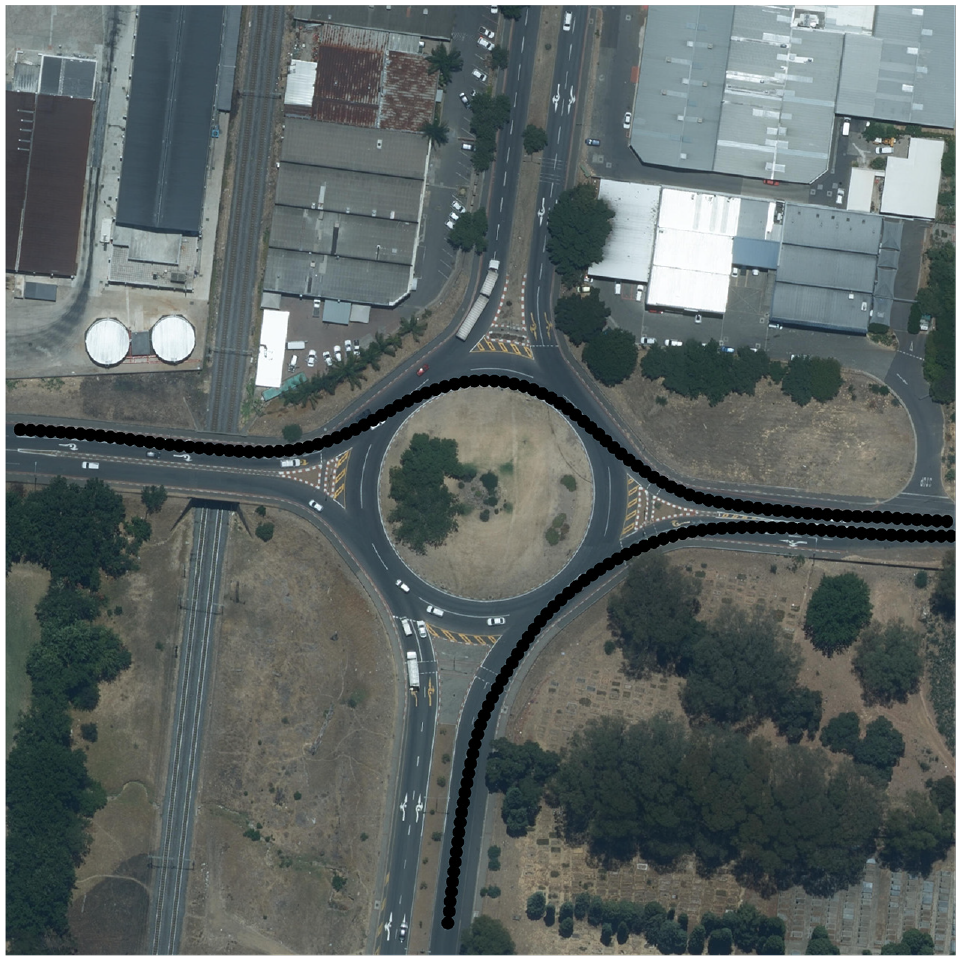
Fastest path of test vehicle measured by the VBox Sport global positioning system (GPS) unit at 20 Hz.
The main author was the sole driver conducting the test drives who had knowledge of the theoretical fastest paths through roundabouts from studying literature. Having only one test driver would ensure comparability of driving style through all roundabouts. Additionally, this one driver would be able to develop a keen sense of the limits of the test vehicle, while also understanding fastest path geometry. All test runs occurred during off-peak hours and without conflicting vehicles present as to ensure that the path of the test vehicle was not impacted. Multiple test runs were conducted, each time increasing the speed and improving the path selection. The highest achieved speeds at each entry, circulation, and exit point were obtained and used in the analysis. The test vehicle operated at high speeds, ensuring safety without risking recklessness, as described by Arries et al. ( 21 ). These speeds reflected a prudent driving approach, acknowledging urgency without compromising safety and adherence to the speed limit.
The VBox Sport GPS tracking device was used to collect the fastest path data. The VBox Sport has practical applications in driving performance analysis and accident reconstruction ( 22 ). The data were viewed and extracted using the Circuit Tools software by Racelogic. This device could record data at a frequency of 20 Hz (one data point every 0.05 s), which was necessary because of the short amount of time it takes a vehicle to maneuver a roundabout at high speeds. The VBox Sport has a documented speed recording accuracy of 1 km/h and positional accuracy of 5 m ( 22 ). The study by Arries et al. ( 21 ) confirmed the accuracy of this device for data collection for a test vehicle maneuvering roundabouts.
Method for Comparison of Estimated and Measured Speed Data
When researching existing methods, it is important to test the agreement between estimated and observed data ( 23 ). When assessing the degree of agreement, the correct statistical approach is not always immediately apparent ( 24 ). Correlation coefficients may not be the most appropriate method of determining the relationship between two methods evaluating the same variable ( 25 ). It was thus important to decide on the appropriate method for this investigation.
It was necessary to avoid the misuse of the correlation coefficient to determine the agreement between two measurements ( 26 ). The Pearson or product–moment correlation is arguably the most common correlation technique ( 27 ) and often used for method comparison. It, however, fails to provide conclusions about the agreement of the data ( 28 ). Correlation analyses can be handled as linear measures of the relationship between variables, without providing their agreement ( 29 ). Correlation coefficient and regression modeling may not provide an adequate indication of agreement as the primary focus of these techniques is the linear relationship between two variables ( 27 ). Linear regression suffers flaws concerning comparing methods as it is sensitive to data distribution (assuming normal distribution), linear relationship, and the presence of outliers ( 28 ).
Statistical and graphic techniques like the Passing–Bablok regression, Deming regression, Mountain plot, and Bland–Altman plot are useful for method comparison ( 28 ). Correlation analyses may aid in the analysis in agreement studies ( 30 ). This paper considered the use of either the Bland–Altman plot or the Passing–Bablok regression technique to assess the agreement between the estimated and observed speeds. The Bland–Altman plot (and its 95% limits of agreement [LOA]) and the Passing–Bablok regression procedure are quantitative statistical approaches for the comparison of two methods ( 31 ). Both are discussed below.
Bland–Altman Plot
Bland–Altman plots compare experimentally obtained deviations with preset acceptance limits ( 30 ). This plot analysis documents the difference between two measurements and characterises the relevance of the calculated differences ( 32 ). The Bland–Altman plot analysis requires that the mean difference between the two measurements of interest and an interval referred to as the LOA be calculated ( 33 ).
The Bland–Altman plot has several limitations that need to be met before analysis can be conducted and agreement determined, including:
Normal distribution—The most critical problem with the Bland–Altman plot is that the differences between the two measurements should meet the assumption of normal distribution ( 24 ). The data may be logarithmically transformed if this assumption is not met ( 29 ). The data may be tested for normality using classical methods such as the Shapiro–Wilk (SW) or Kolmogorov–Smirnov (KS) tests as simple visual representation of the data may not provide adequate insight ( 29 ).
Proportionality—A proportional bias, a situation where the difference between measurements increases with an increase in a specific value of measurement for example, may lead to an overestimated bias in the low end and underestimated bias in the high end ( 34 ). The bias and LOA estimates are only meaningful if they are uniform over the range of measurements ( 34 ). Adding a regression line in the Bland–Altman plot can quantify the proportional bias.
Agreement—The plot does not determine whether or not the defined intervals of agreement are acceptable or not, but rather requires conditions and requirements to be determined before undertaking the study ( 35 ).
Passing–Bablok Regression
The Passing–Bablok regression analysis was considered with the aim of overcoming some of the limits of the correlation analysis ( 27 ). The Passing–Bablok regression technique is preferred over the Deming regression because it does not assume that the error is normally distributed and is robust in the way that it handles outliers ( 27 ). The Passing–Bablok regression may provide more accurate results than the Deming regression in some instances ( 36 ). The output of this method is equations for the regression line as well as the confidence intervals ( 36 ).
The following assumptions are required by Passing–Bablok regression ( 37 ):
the variables are positively correlated;
the relationship between the variables is linear;
no special assumptions are made about the distribution of the variables.
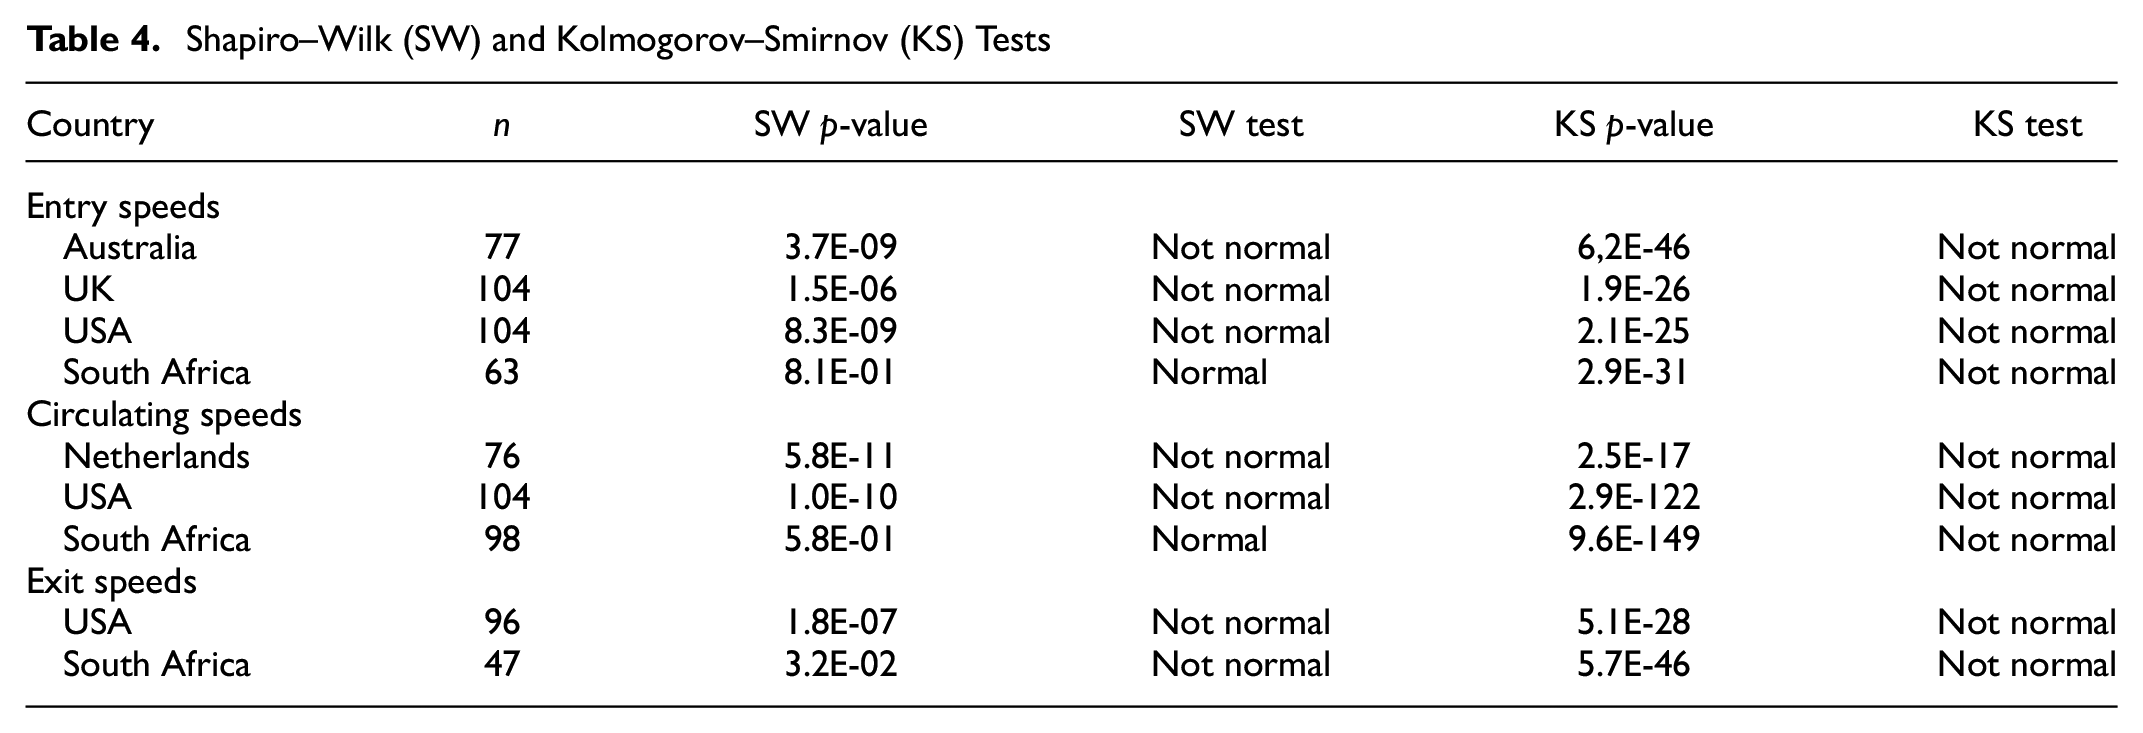
Normality Tests
The differences between the estimated and observed speeds were tested for normality using SW and KS tests. Table 4 illustrates the results of these statistical tests for the number of data points (n) included in the analysis. It is worth noting that although the SW test could not reject the null hypothesis for the differences between observed and estimated speeds from the South African guidelines, the null hypothesis was rejected in all the cases using the KS test. Given the rejection of the null hypothesis and the statistical proof that differences were not normally distributed, the Bland–Altman plot in its classical sense could not be used for method comparison. Subsequently, the Passing–Bablok test was selected to further analyze the observed and estimated speeds.
Shapiro–Wilk (SW) and Kolmogorov–Smirnov (KS) Tests
Comparison of Fastest Path Speed Estimates
The Passing–Bablok regression technique was employed to assess the agreement between the estimated and observed speeds in the context of the fastest path determination. This analysis is pivotal in discerning systematic biases and trends, and enhancing the reliability and validity of measurements. The Passing–Bablok regression analysis illustrates the fitted regression line between the two respective speeds, revealing critical parameters such as the regression equation and the confidence intervals around the regression line. Entry path speeds, circulating path speeds and exit path speeds are compared between the country guidelines (where these speeds were described) and actual fastest path speeds.
Entry Path Speeds
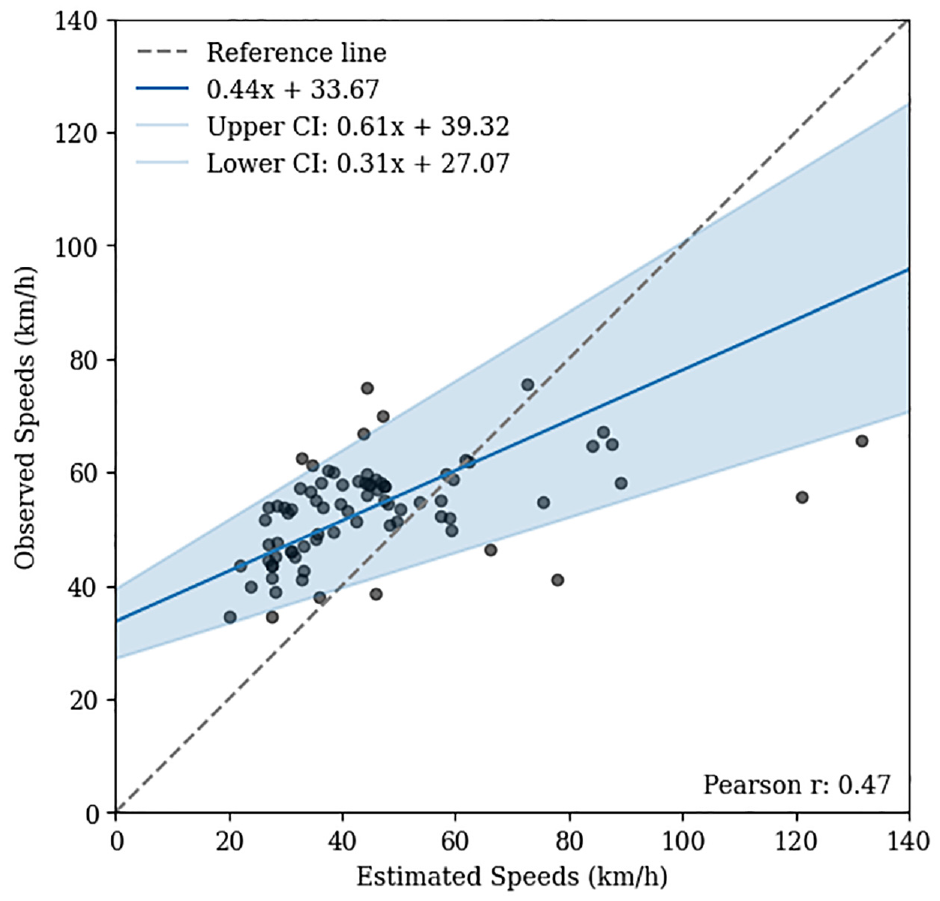
Entry path speeds for Australia, the UK, USA, and South Africa were evaluated from the respective guidelines for all 29 roundabouts that were assessed. Table 5 details the estimated (Est) speeds from guidelines and actual observed (Obs) speeds. Minimum, maximum, and mean speeds are indicated. Figures 15 to 18 describe the Passing–Bablok regression for Australia, the UK, USA, and South Africa, respectively.
Passing–Bablok regression estimated and observed entry speeds for Australian guidelines.
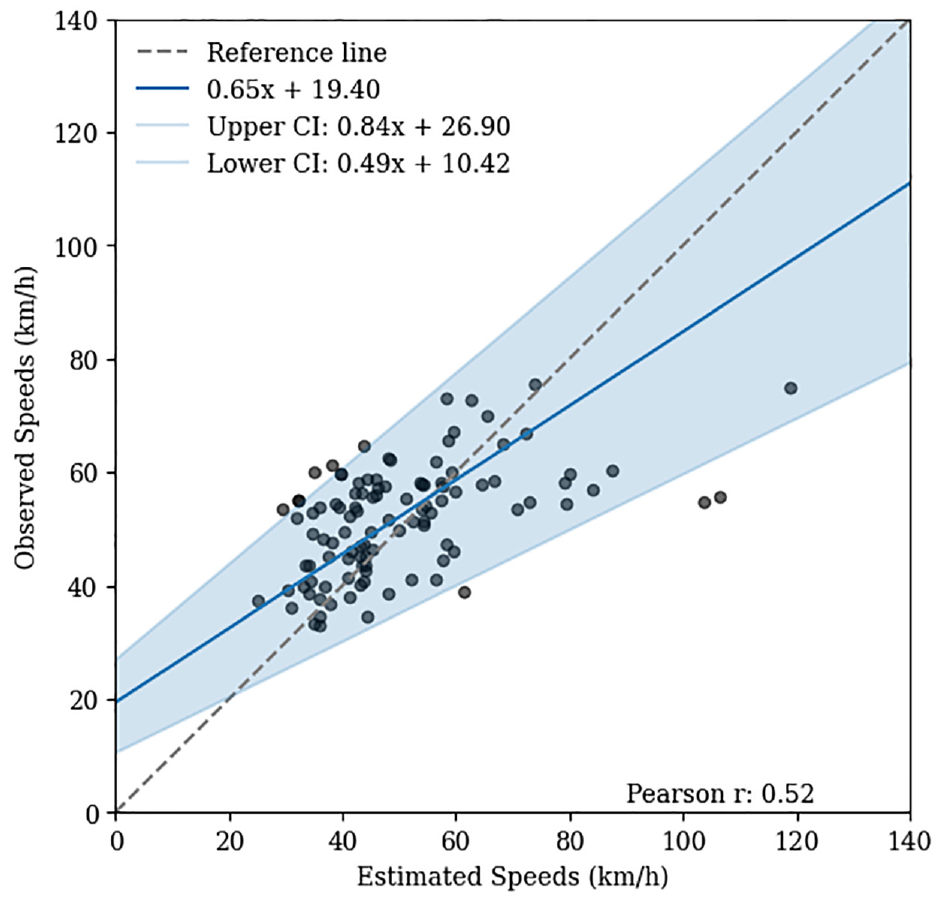
Passing–Bablok regression between estimated and observed entry speeds for UK guidelines.
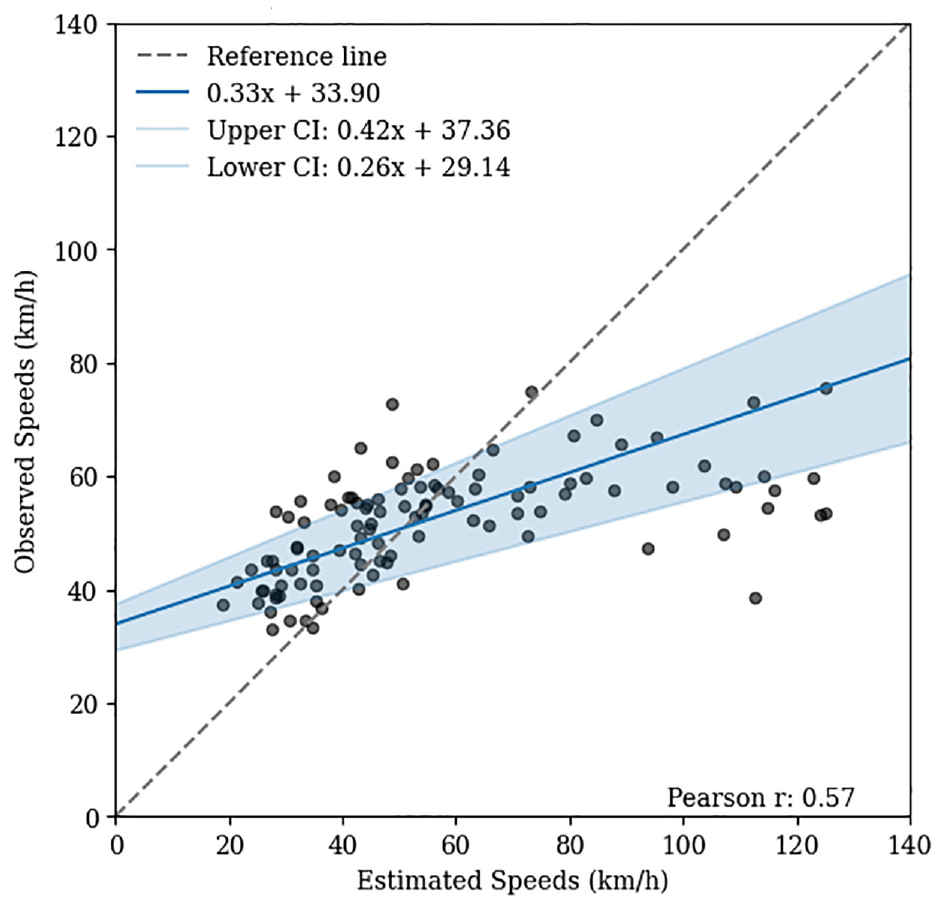
Passing–Bablok regression between estimated and observed entry speeds for USA guidelines.
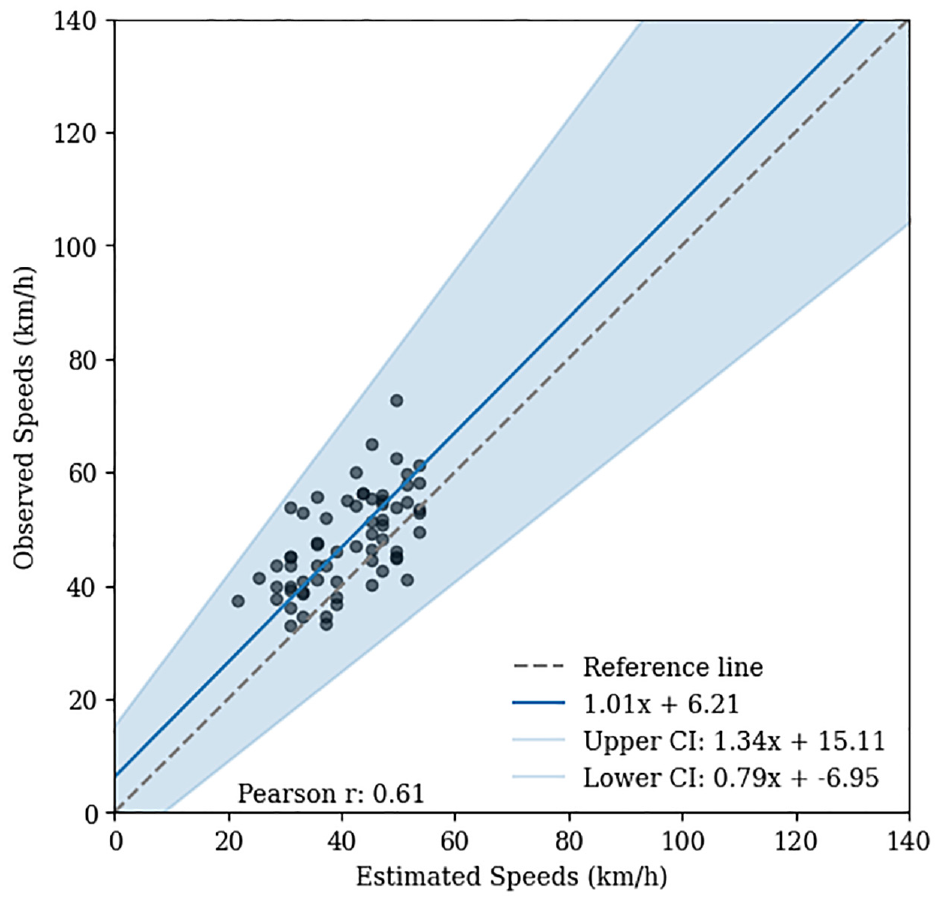
Passing–Bablok regression between estimated and observed entry speeds for South Africa.
The slopes of the Passing–Bablok regression lines for the guidelines from Australia in Figure 15 (slope = 0.44), the UK in Figure 16 (slope = 0.65), and the USA in Figure 17 (slope = 0.33) are all less than 1. This suggests a systematic tendency for these guidelines to underestimate lower speed and overestimate higher speeds. Additionally, the presence of outliers and overestimation of speeds on the higher end, as indicated by the regression plots, highlights the presence of proportional bias in these guidelines.
The slope of the regression line for the framework from South Africa in Figure 18 (slope = 1.01) is close to 1, indicating better agreement between estimated and observed speeds. This suggests that a simple transformation of the estimated speed data could improve estimation accuracy if a high correlation exists between the estimated and observed speeds. The slope of the regression line for the South African framework emphasises the tendency of the methods to disagree at higher speeds and the agreement is subject to the speed threshold of Table 2.
The results for the Pearson correlation for all the guidelines relating to entry speeds suggest a moderate correlation, with correlation coefficients ranging from 0.47 to 0.61 between estimated and observed speeds as illustrated by Table 5. Table 5 also illustrates the descriptive statistics for the estimated and observed speeds for the guidelines analyzed.
Descriptive Statistics for Entry Speeds
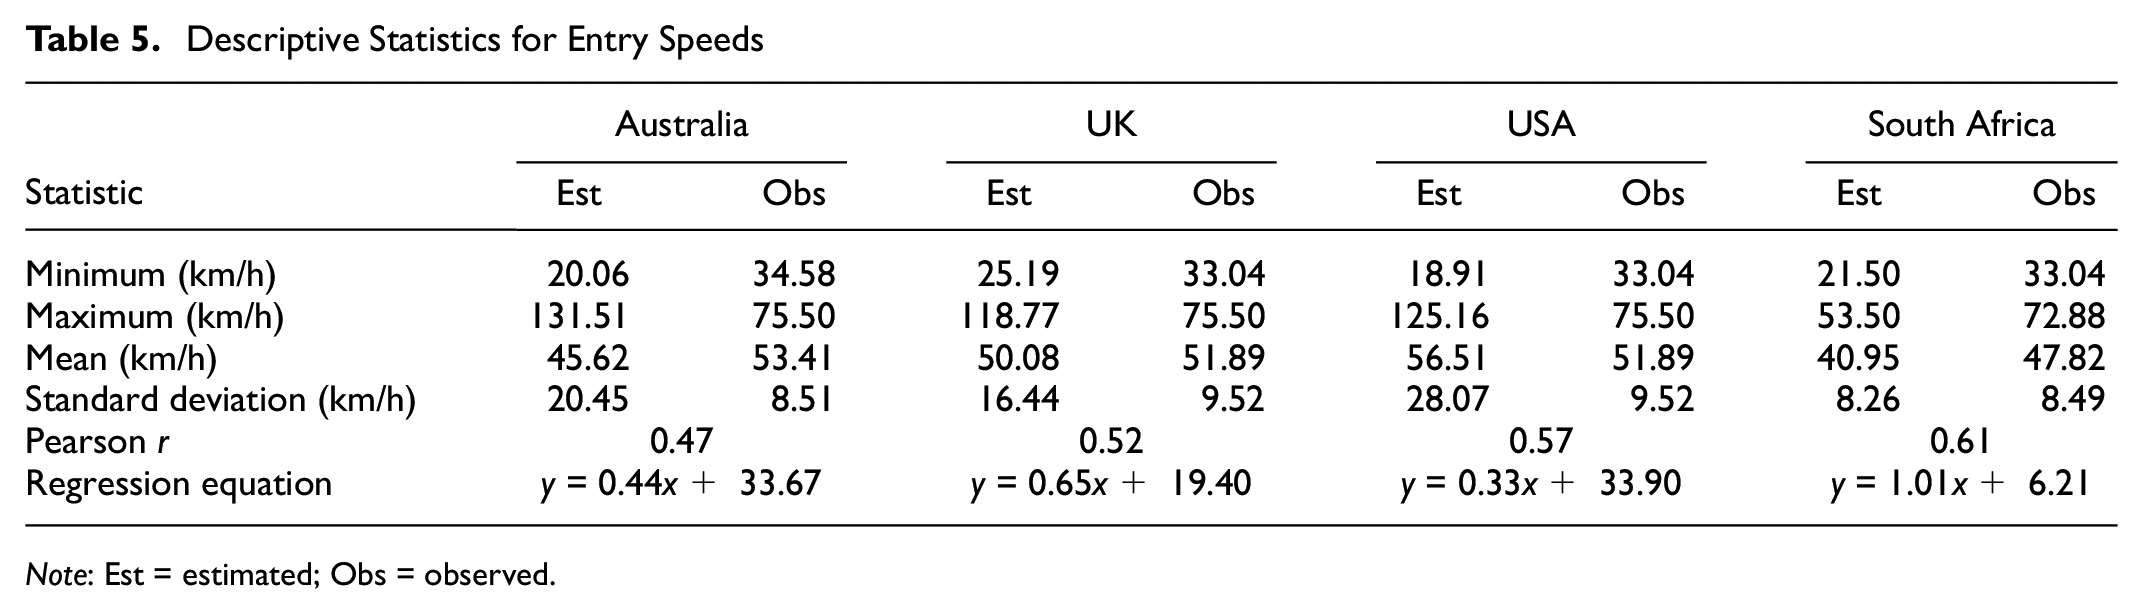
Note: Est = estimated; Obs = observed.
Analysis of confidence intervals reveals that as speeds increase, the agreement between estimated and observed speeds tends to decrease, as evidenced by widening confidence intervals. The slopes of the upper and lower bounds of the 95% confidence intervals differ significantly, with the upper bound slope often nearly double that of the lower bound slope, indicating asymmetric variability in estimation accuracy. There is a tendency for greater overestimation of speeds, with the highest discrepancies occurring at higher speeds. It is essential to note that the framework from South Africa, which limits speeds to 60 km/h, shows a different pattern because of the constrained range of speed estimations.
The evidence from the descriptive statistics in Table 5 provides proof that there is a discrepancy between the roundabout designs and the design speeds set out in Table 1 for South Africa. The mean speeds from all existing international methodologies exceed the upper limit of the design speeds, for both urban and rural roundabouts, set out in the framework from South Africa. Minimum observed speeds were more than the upper limit for urban double-lane roundabouts, with maximum observed speeds more than double the upper limit.
Circulating Path Speeds
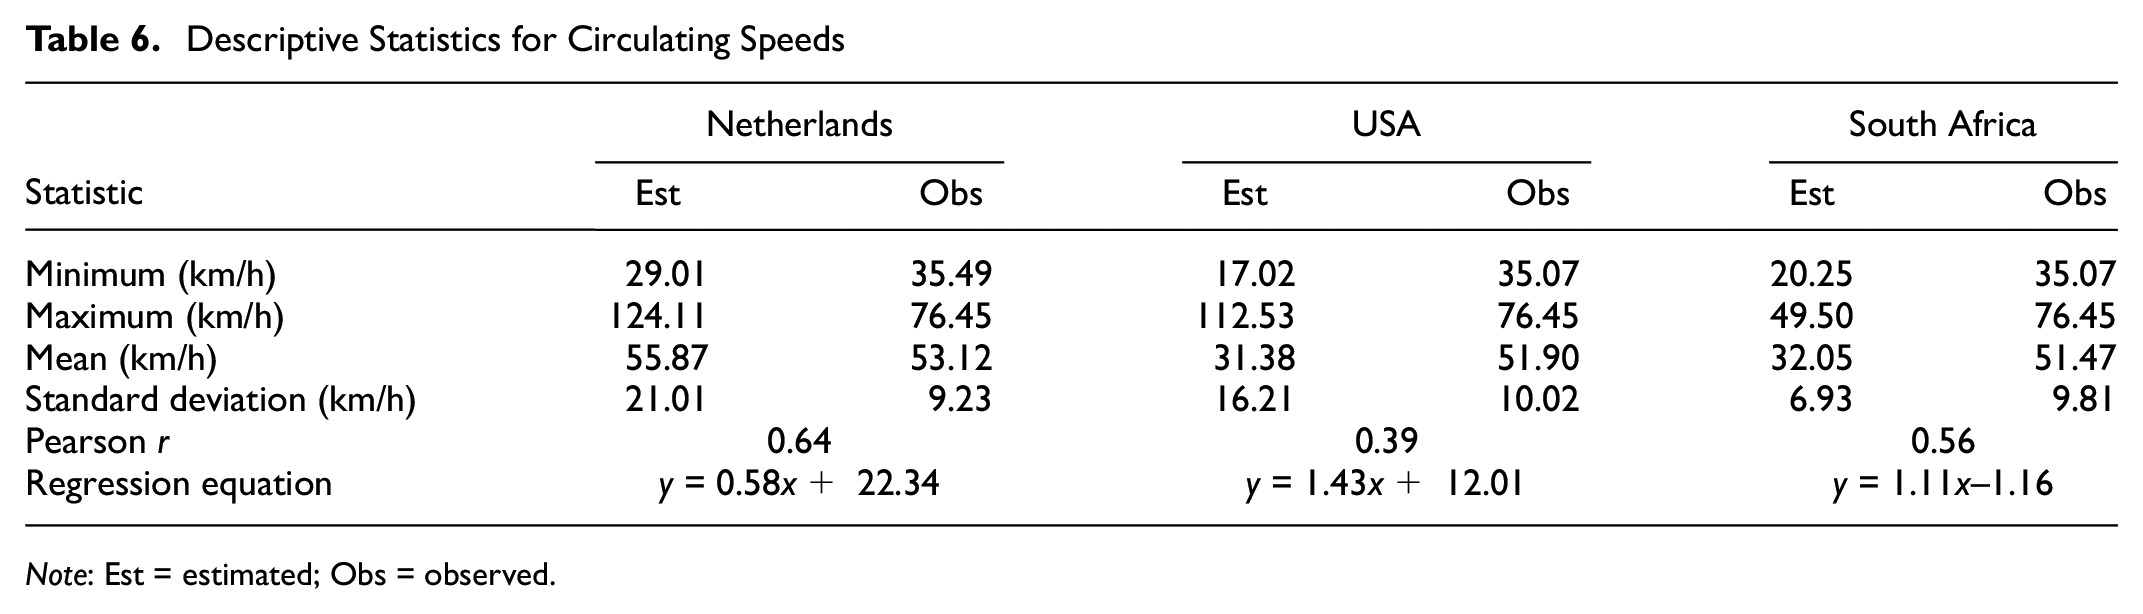
The Passing–Bablok regression analysis conducted on estimated and observed speeds in the circulatory roadway for the Netherlands, USA, and South Africa yielded interesting results relating to agreement and bias. The slope of the regression line for speeds estimated by the guidelines from the Netherlands and observed speeds, illustrated in Figure 19, is relatively flat (slope = 0.58) and significantly less than 1. Speed differences increase with an increase in speeds.

Passing–Bablok regression between estimated and observed circulating speeds for guidelines from the Netherlands.
Interestingly, the results from the USA guidelines (slope = 1.43) in Figure 20 and the framework from South Africa (slope = 1.71) in Figure 21 indicate that speeds were consistently underestimated, barring a few instances noted below the reference lines. This similarity is attributed to the similar methods applied by guidelines of both countries. Typically, as with other locations at the roundabouts, there is a general trend of increasing differences with an increase in speed, with widening of the confidence intervals apparent. This suggests that agreement decreases with an increase in speed.
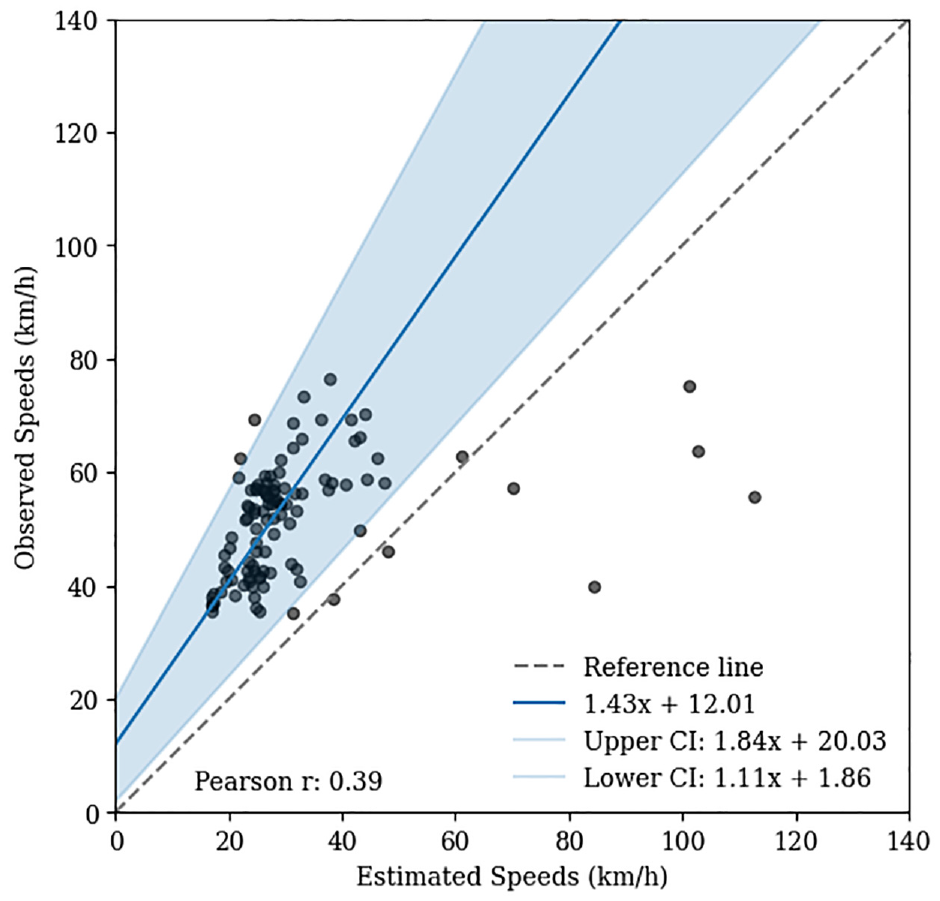
Passing–Bablok regression between estimated and observed circulating speeds for USA guidelines.
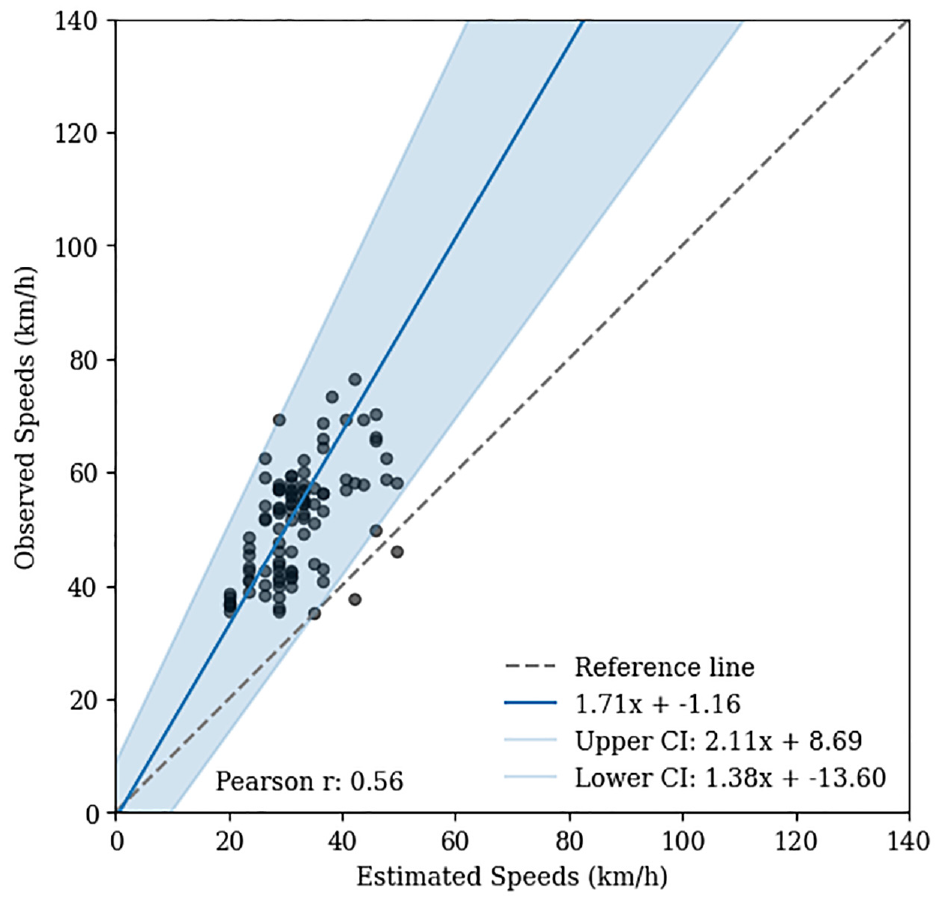
Passing–Bablok between estimated and observed circulating speeds for South Africa.
Table 6 illustrates the descriptive statistics for the estimated and observed speeds for the guidelines analyzed. There is less correlation between the estimated and observed speeds for the USA guidelines and South African framework compared with entry speed methodologies.
Descriptive Statistics for Circulating Speeds
Note: Est = estimated; Obs = observed.
Similar to the entry speeds, the minimum observed speeds of a vehicle circulating a roundabout was in excess of the upper limit of the design speed for double-lane roundabouts illustrated in Table 1. It is worth noting that for the guidelines from the USA and the framework from South Africa, the mean observed speeds were 20 km/h higher than the mean estimated speeds. This emphasizes the false sense of security designers may gain from implementing these guidelines in the design phase of a roundabout.
Exit Path Speeds
Only the USA and South African guidelines consider exit path speeds. The Passing–Bablok regression equations reveal a comparable level of agreement between estimated and observed speeds for both the USA guidelines and the South African framework for speeds on exit.
The regression line slope for the USA guidelines, in Figure 22, is relatively flat, with an intercept significantly greater than 0. This indicates poor agreement between estimations and observed data, a trend reinforced by the presence of outliers in the analysis. The resulting Passing–Bablok regression plot for entry speeds from both the guidelines from the USA and the framework from South Africa, Figures 17 and 18 respectively, are similar to the corresponding guidelines for exit speed, Figures 22 and 23 respectively. The similarity between the USA guidelines and the South African framework is evident at lower speeds. However, this similarity diminishes at higher speeds because of the South African framework's limitation in accounting for higher speed estimations, a limitation previously described.
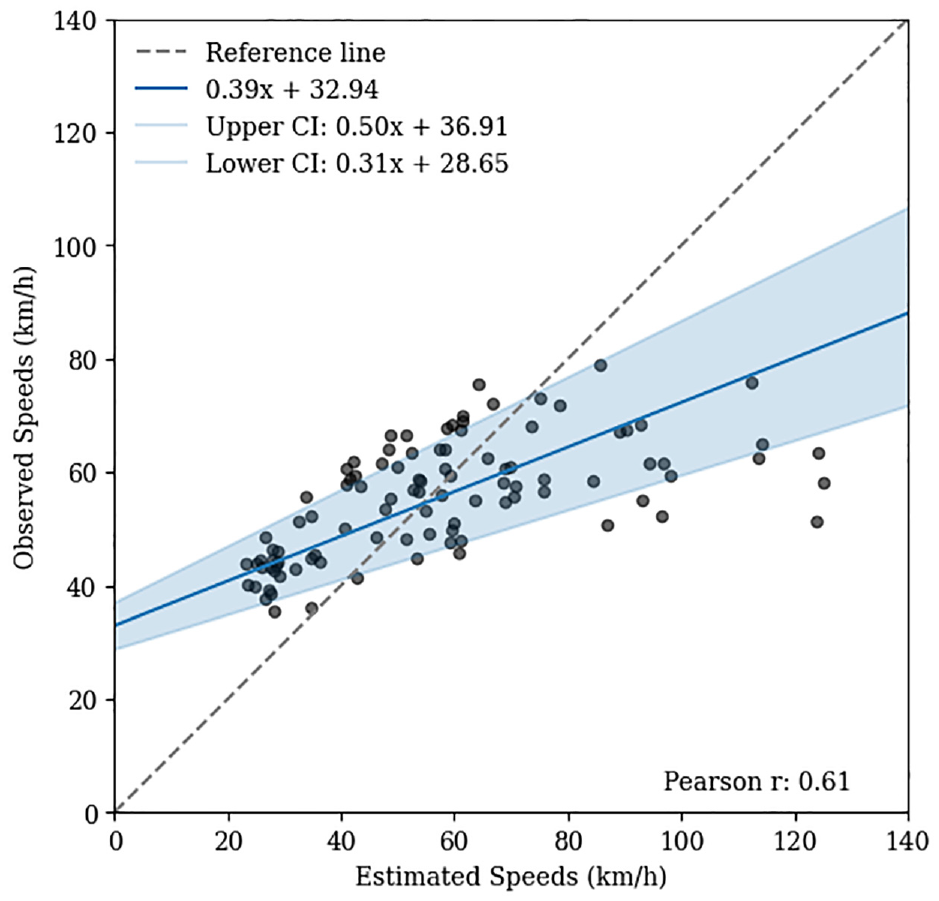
Passing–Bablok regression between estimated and observed exit speeds for USA guidelines.
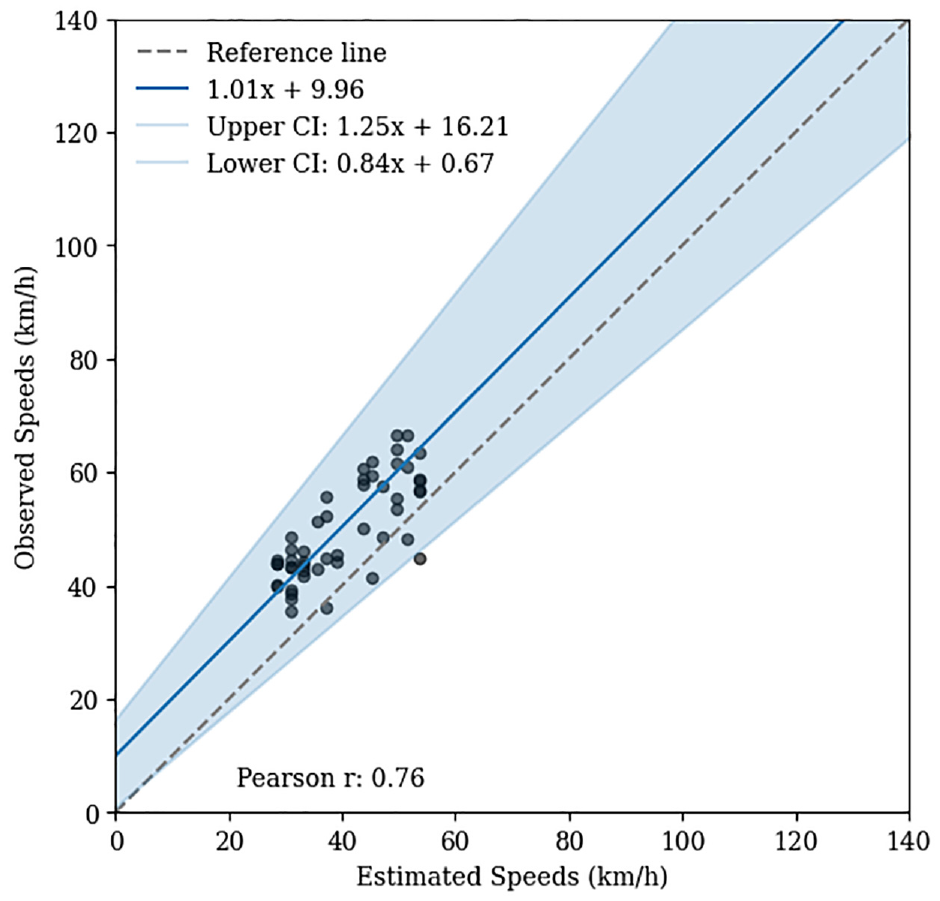
Passing–Bablok regression between estimated and observed exit speeds for South Africa.
For exit speeds, the slope of the Passing–Bablok regression line for the USA guidelines is 0.39, comparable with the entry speed slope of 0.44, indicating that a proportional bias exists. In contrast, the South African framework maintains a consistent slope of 1.01 for both entry and exit speeds, reflecting a more stable estimation pattern across speed ranges.
The strongest correlation exists among exit speeds for the guidelines from both the USA and South Africa as illustrated in Table 7, with moderate to high correlation indicated.
Descriptive Statistics for Exit Speeds
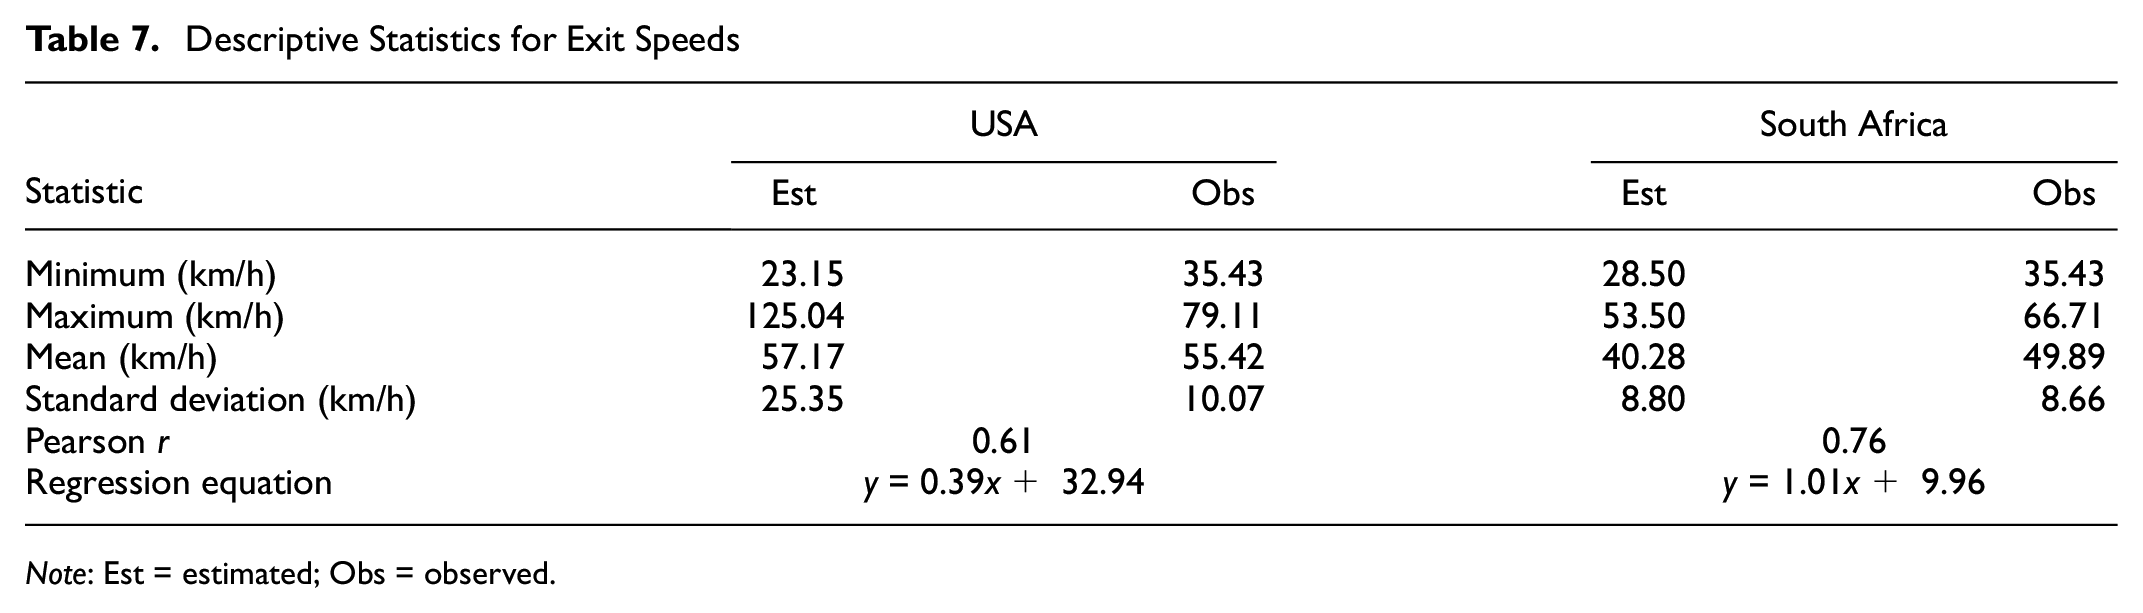
Note: Est = estimated; Obs = observed.
From Table 7 it is again evident that the minimum observed speeds are more than the upper limit of the design speeds set out for roundabouts. The evidence suggests that vehicle speeds were not significantly reduced by the roundabout analyzed.
Conclusions and Recommendations
Summary of Findings
The analysis of international methodologies for estimating vehicle speeds within roundabouts highlights several critical concerns. Among these is the inherent inconsistency in these approaches, with each country’s guideline that was assessed having a different mechanism to evaluate fastest path speed through roundabouts, leading to varying estimations of the fastest and entry path speeds. Furthermore, the significant reliance on engineering judgment required by all methods introduces subjectivity into the process, which would result in disparate outcomes between different practitioners. The Passing–Bablok regression analysis technique was pivotal to understanding and quantifying these inconsistencies. The findings reveal a systematic tendency for these methodologies to overestimate speed when speeds exceed 60 km/h, while underestimating them at lower speeds. This discrepancy is a particular cause for concern given that most roundabouts are situated within 60 km/h speed limit zones, where underestimation of speed poses a heightened risk. Designers may perceive their intersection designs to be safer than they are, contributing to a false sense of security.
Current methodologies are inadequate in aligning observed speeds with design expectations. All minimum observed speeds were higher than the upper limit of design speeds stipulated by the South African framework, indicating a failure to achieve the intended speed reduction objectives. As mean speeds increase, disparities between estimated and observed speeds widen with the widening confidence intervals and decreasing agreement, exacerbating the discrepancy.
Limitations
The authors acknowledge certain limitations in this study. One key limitation is the use of a single test vehicle and one driver, which may not fully capture the range of speed behaviors typically observed at roundabouts. Although the methodology was designed to push the limits of speed around each roundabout and record the highest possible speeds, it may not represent the variability in driver behavior or vehicle dynamics under different conditions. Furthermore, the study focused on a specific set of roundabout geometries in South Africa, which might not cover the full spectrum of geometric configurations found in other countries.
Recommendations for Future Research
This research should serve as a catalyst for future investigations aimed at developing more comprehensive predictive models for estimating the highest safe traversable speeds within a roundabout design. A more reliable means of estimating the highest safe traversable speeds within roundabout intersections is recommended to minimize the amount of engineering judgment required. This will aid in optimizing traffic movement and safety at roundabouts following evolving design standards.
There is a need for continued refinement and innovation within traffic engineering methodologies. By addressing the identified shortcomings and embracing novel approaches, we can work toward more efficient roundabout designs that better serve the needs of motorists and communities alike.
Future research should also aim to explore how geometric aspects of roundabouts can be modified to better control speed through roundabouts, with an emphasis on balancing safety and operational efficiency.
Footnotes
Acknowledgements
The authors acknowledge the South African National Roads Agency Limited (SANRAL) for their contribution to funding of this research. This research was conducted as part of a larger research project undertaken by SANRAL to investigate the design and operation of roundabouts across South Africa. The authors used Grammarly for language editing and a large language model (ChatGPT by OpenAI) to assist with refining the clarity and coherence of the manuscript.
Author Contributions
The authors confirm contribution to the paper as follows: study conception and design: J. T. Arries, M. M. Bruwer, J. C. Krogscheepers; data collection: J. T. Arries; analysis and interpretation of results: J. T. Arries; draft manuscript preparation: J. T. Arries, M. M. Bruwer. All authors reviewed the results and approved the final version of the manuscript.
Declaration of Conflicting Interests
The authors declared no potential conflicts of interest with respect to the research, authorship, and/or publication of this article.
Funding
The authors received no financial support for the research, authorship, and/or publication of this article.