
Abstract
To develop long-term strategies for transportation planning, it is necessary to understand and address the uncertainties related to mobility. This task is challenging, given the rapid evolution of passenger transportation in the U.S.A. To aid transportation planning, we combine expert insights and quantitative modeling in a two-step process to create scenarios for U.S. passenger transportation in 2030. In the first part, we use inputs from 34 experts on 18 socio-demographic, macro-economic, and technological factors that influence transportation to generate combinations of projections that are reasonable and coherent: we call them scenarios. For the three distinct scenarios thus developed, we use a spreadsheet-based transportation activity accounting tool to estimate nationwide vehicle miles traveled, carbon emissions, and electrification levels. The Hop & Drive scenario is dismal, characterized by a slower economy, greater suburban growth, and higher driving levels. Mapped by Directives envisions a future shaped by ambitious local and federal policies accelerating electrification, reviving U.S. mass transit, and lowering driving levels. The third scenario, Technology Dazzles, imagines the outcomes of rapid technological improvements and adoption, leading to an increasingly automated world with a mobility-as-a-service paradigm beginning to be realized. The projections developed for each scenario should serve as markers for transportation planners at the federal and regional levels who monitor transportation trends. These markers can be used to adjust regional and national transportation funding priorities and understand the broader implications of development and funding strategies under uncertainty.
As the transportation landscape in the U.S.A. undergoes rapid transformations because of technological innovations, demographic shifts, and increasing environmental awareness, there is a pressing need to forecast and plan for a fast-evolving future. Traditional travel demand models often rely on a set of inputs that are static and do not account for the uncertainty inherent in projecting such inputs ( 1 ). Oil prices, gross domestic product (GDP), the rise of new mobility services, such as ride-hailing and electric scooters, and lately the increase in telecommuting caused by the COVID-19 pandemic and associated changes in land-use patterns are notoriously hard to project. While some attempts have been made to incorporate telecommuting and e-shopping behavior in land-use and travel demand models, they are limited to the regional or state levels (see Wang et al. [ 2 ]) and Shemer et al. [ 3 ]). Economic input–output models also fall short in capturing the full spectrum of potential changes because of uncertain events like the pandemic, making scenario planning a crucial approach for contemporary transportation studies ( 4 ).
In this study, we employed a robust scenario planning method integrated with quantitative modeling to explore various futures of U.S. transportation up to the year 2030. Drawing on the insights of 34 experts across multiple fields, we projected 18 critical socio-demographic, economic, and technological factors that could influence future trends. This extensive expert input received through online surveys was synthesized through a series of workshops and surveys into two to three levels, per factor. Using cross-impact analysis and an extensive literature review, we combined these future levels of each of the 18 factors into three clusters made up of distinct levels of each factor. We inspected these clusters to ensure they were coherent and plausible; our logic was rooted in how transportation systems respond to the larger macro-economic context. Next, we evaluated the potential impacts of each scenario quantitatively. Using the International Energy Agency’s (IEA’s) Mobility Model (MoMo), we estimated nationwide vehicle miles traveled (VMT), carbon emissions, and electrification levels for each scenario. This approach provided actionable insights into how different futures could materially affect U.S. transportation policy and infrastructure.
Details about the process and data are illustrated in the Data and Methods section as a six-step methodology (see Figure 1). The first step involves identifying a set of descriptors that could influence passenger transportation in the U.S.A. over a decade. In steps two and three, we elicit expert opinions on their most likely, low, and high estimates for each descriptor in 2030, along with supporting arguments.
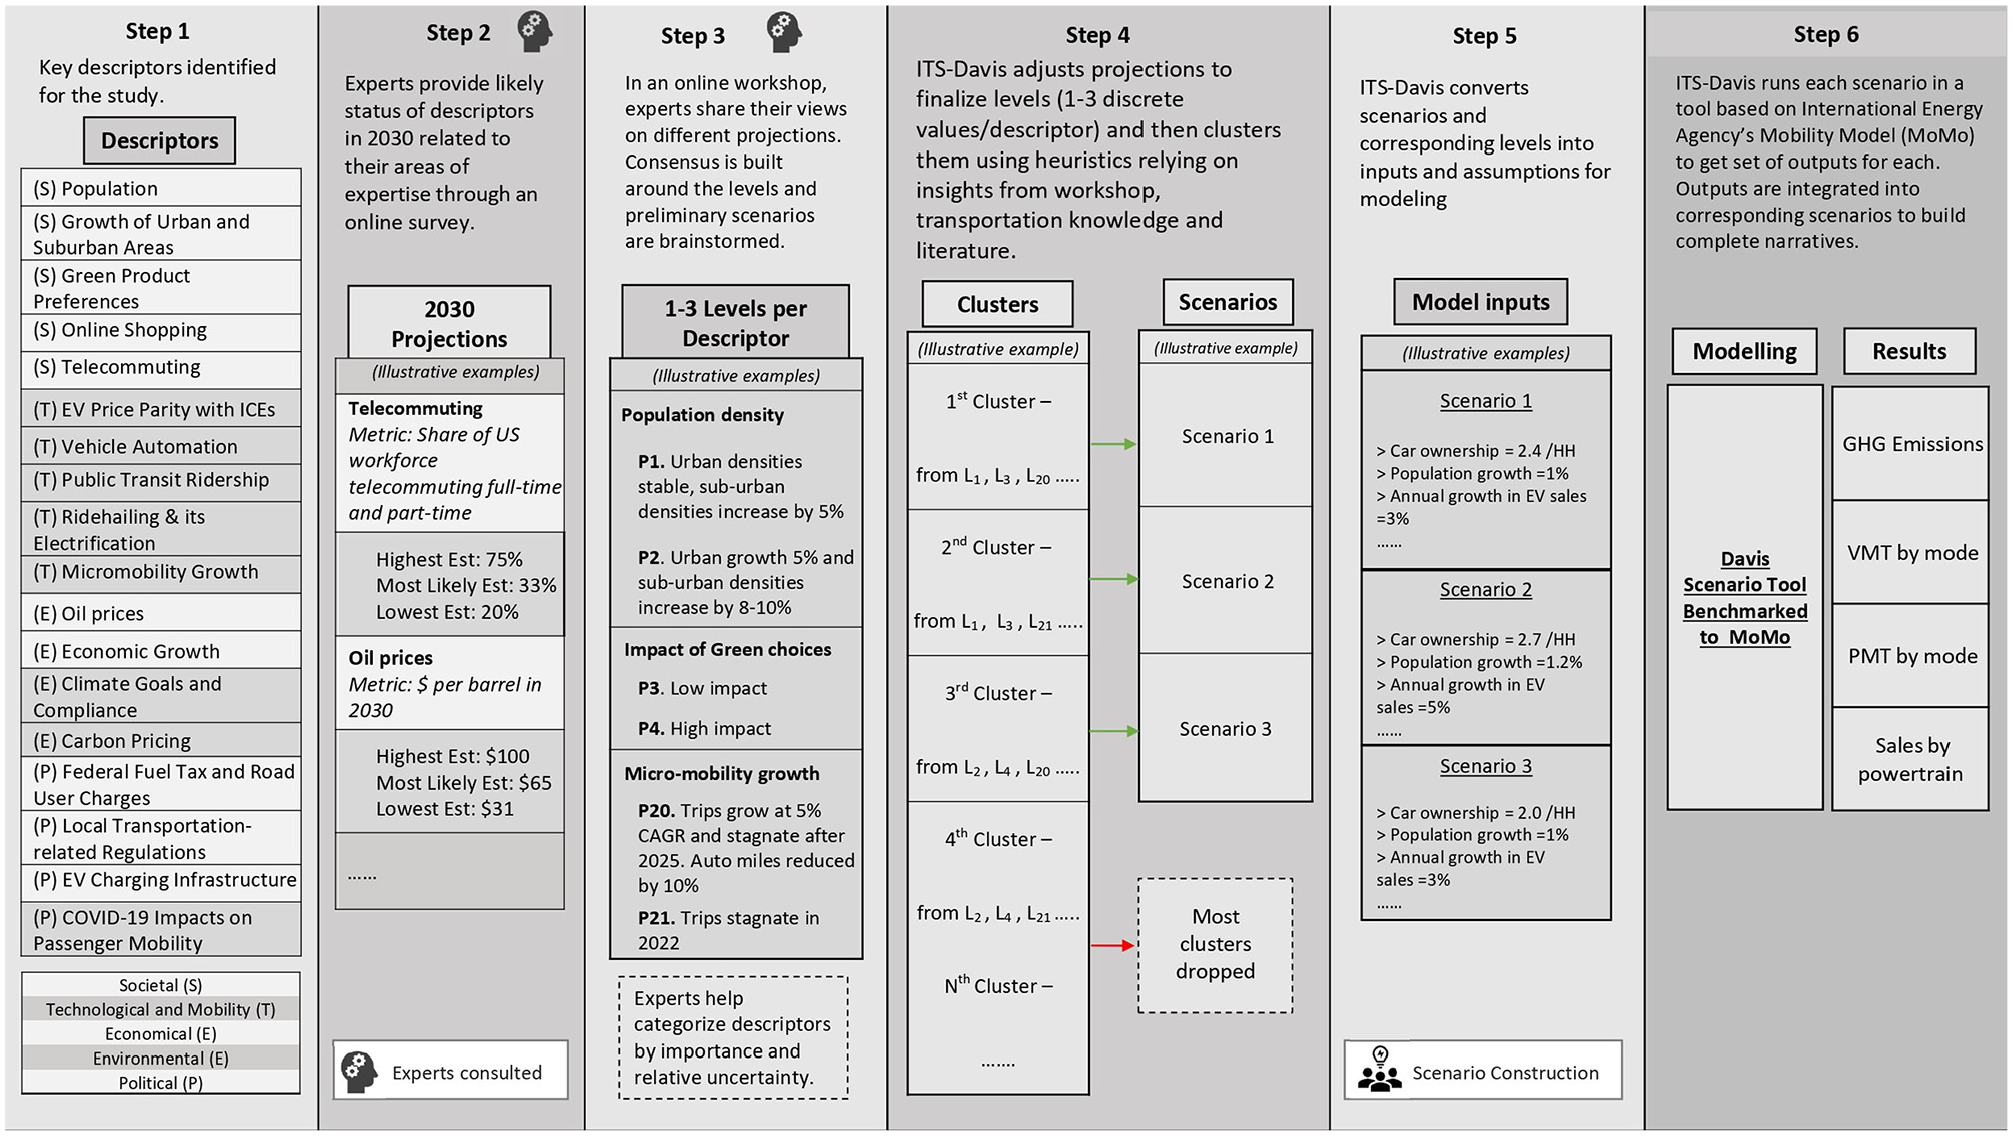
Step-by-step methodology with a list of key descriptors.
Next, in step four, we categorize different levels into bins and build three to four clusters. In step five, we convert each descriptor level into inputs and assumptions for modeling. Finally, step six involves generating scenario outputs, providing scenario-wise projections for vehicle stocks, vehicle and passenger miles traveled, energy, and electricity use, and carbon emissions.
We chose 2030 as the horizon because the current pace of change in passenger transportation is unprecedented, posing significant challenges for short-term and medium-term planning. Long-term planning is even more difficult because of the rise of new mobility services, the impacts of the COVID-19 pandemic on travel behavior, declining transit ridership, a pivotal moment for transportation electrification, evolving retail business models, and advances in vehicle automation technology. Our aim is to understand how passenger transportation in the U.S.A. could evolve as climate change becomes a more urgent issue.
Since transport policy is set at the national level, we develop scenarios covering the entire U.S.A. until 2030. At the end of our study, we present three transportation scenarios with their implications for 2030 embedded in the narratives. Hop & Drive (HD) represents a sluggish economy, greater suburban growth, and higher driving levels if no significant changes are made. Mapped by Directives (MD) is based on local and federal policies supporting electrification and transit, aiming to reduce driving. Technology Dazzles (TD) is a wildcard scenario imagining technology-led outcomes, with a rise in automation and the beginnings of a mobility-as-a-service paradigm.
The results from this study will inform policymaking and investment decisions by illustrating how various policy levers and changes in socio-economic and technological factors may influence future transportation scenarios, including the potential to effectively decarbonize passenger transportation by 2030. Our study aims to assist transportation planners and policymakers in envisioning different potential futures. The projections developed for each scenario will serve as markers for transportation planners at the federal and regional levels, helping them monitor transportation trends.
This guidance is particularly valuable during these uncertain times following the COVID-19 pandemic, when the future of transportation trends is unclear. While these scenarios were developed during the pandemic with projections leading up to 2030, progress in certain areas, such as electrification levels and vehicle automation, has been slower than anticipated. Thus, even if we use “2030” throughout the paper, it may not be inappropriate to consider these scenarios as plausible for 2033 or even 2035, about a decade into the future. Stakeholders can use these markers to adjust regional and national transportation funding priorities and to understand the broader implications of their development and funding strategies under uncertainty.
The remainder of the paper is organized as follows: the next section briefly summarizes the literature in the field and the contribution of this study. We then discuss how the data were collected and used to develop scenarios and introduce technical terms associated with our scenario-planning approach. In the next section, we briefly describe each scenario and discuss how transportation metrics such as VMT and carbon emissions associated with each were quantified using modeling. Next, we present modeling results and discuss how they compare. We conclude the paper by discussing the broad implications of each scenario for U.S. society by distinguishing certain and relatively uncertain trends that will likely shape the future of passenger transportation in the U.S.A.
Literature Review
The literature review presented below spans five themes related to this study—scenarios and scenario planning literature; applications of scenario planning methods in transportation; typology of scenario studies; methodological aspects of scenario studies; and current literature on scenario studies that incorporate emerging modes and the COVID-19 pandemic.
Scenario Planning
Scenario planning and foresight techniques are well-established in the literature on decision-making ( 5 ). A scenario is a hypothetical sequence of logical and plausible but not necessarily probable events constructed to understand causal processes and decision points ( 6 , 7 ). Within long-term planning, the scenario technique is an approach that can inform decision-making when future conditions are highly uncertain ( 8 ). Through scenarios, decision-makers obtain information concerning future policy challenges, economic trends, society, and technology. Scenarios can be developed to predict what will happen, explore what can happen, or understand how a specific target can be reached normatively ( 9 ).
Scenario Planning in Transportation
In the transportation sector, examples of the earliest scenario work date to the 1970s. Biciunas and Moses ( 10 ) and Friedlaender et al. ( 11 ) used them to identify priorities and challenges for national, state, and regional transportation planning agencies. Published research articles on transportation scenarios in the decades since then are similar in scope and focus. They include case studies of how scenario planning can help public agencies better plan transportation infrastructure investments. For example, Zegras et al. ( 12 ) presented a framework for incorporating scenarios into regional transportation planning done by metropolitan planning organizations. Kim et al. ( 13 ) also suggested a framework to help state departments of transportation strategize around construction practices. Lastly, Sadatsafavi et al. ( 14 ) used a causal loop diagram and cross-impact matrix followed by cluster analysis to build 30-year horizon scenarios for the U.S. highway industry so that state agencies could use them to assess the performance of their strategic plans.
In a federally sponsored effort, Shaheen et al. ( 15 ), documented scenario planning workshops conducted to assess risk and to prepare for possible futures in which intelligent transportation system (ITS) technologies could be used to create a more integrated and adaptive transportation system. In a study similar to ours, Zmud et al. ( 16 ) developed two scenarios for future mobility in the U.S.A. using data based on expert opinions on demographics, economics, energy, transportation funding, and technology. Passenger miles traveled were also estimated for each of the two scenarios. Exploratory scenario studies tend to be broad but could focus on specific topics, such as achieving sustainability, an example being Shiftan et al. ( 7 ). Lyons et al. ( 8 ) have documented several examples of such explorative scenarios sponsored by national governments, primarily the U.K.
Variations in Applications
While large international agencies and committees such as the Intergovernmental Panel on Climate Change, the IEA, and the International Transport Forum develop broad, nationally, and internationally focused transportation scenarios, they are often normative. For example, they respond to the prompt—what pathways will likely lead us to a fossil-free transportation world in 2050? In other transportation studies, travel demand models are applied to forecast long-term travel demand and assess transportation impacts. These models are often used at local or regional levels; national travel demand models, on the other hand, usually do not include the detailed behavioral relationships necessary to forecast the general impacts of transportation. Instead, they primarily focus on long-distance inter-city passenger travel and freight movement ( 17 ).
Methodological Aspects of Scenario Studies
Scenario development begins with identifying factors that influence the transportation sector. Significant factors that influence the development of transportation (infrastructure) are spatial and land-use planning, government policy, economic forces, technology, and social and behavioral trends ( 7 ). Since scenario planning develops through phases, Börjeson et al. ( 9 ) suggest that certain techniques are relevant to each phase of the scenario development exercise. In the generating phase, deemed to be relatively crucial for explorative scenarios, they explain that surveys, workshops, and Delphi methods have been employed to generate information. This step creates qualitative data that can be either used as is or further enriched. In the integration phase, mathematical modeling combines the ideas and information previously generated. This step, as a result, creates multiple combinations, perhaps too many to offer any conclusive opinion. Therefore, consistency could be achieved by using methods that reduce the number of scenarios to a few that are cogent. Many scenario applications first create qualitative storylines or narratives and then quantify them for mathematical modeling ( 18 ). In this study, we adopt a similar approach as it leverages the strength of expert inputs and mathematical models in converting these processed inputs into relevant metrics using established transportation relationships.
Many studies have developed quantitative scenarios for specific transportation issues in the U.S.A., especially decarbonization. For example, Liu et al. ( 19 ) compared the fuel and emissions impacts of different travel mode scenarios for inter-city trips ranging from 200 to 1600 km (or 124–1000 mi). Likewise, expert opinion-based scenario studies have been conducted using a more qualitative approach to investigate specific transportation issues.
Recent Scenario Studies
In the present age of mobility, new forces are challenging businesses and governments to rethink how the future will evolve. These forces have motivated scenario-based analyses of new shared mobility options such as e-scooters ( 20 , 21 ). Nogués et al. ( 22 ) investigated the impacts of automation in cities. They evaluated which policies could most effectively achieve the desired city scenario through a back-casting planning methodology through expert surveys. Miskolczi et al. ( 23 ) conducted a systematic literature review of 62 studies on the future of mobility published between 2012 and 2021, 16 of which developed scenarios. They identified six recurring themes in these works, namely automation, shared mobility, electric vehicles (EVs), congestion, social attitude, and greenhouse gas (GHG) emissions. Using a simple system, they assigned each reviewed scenario a score from 6 to 18 based on these themes. Finally, using the insight that shared mobility and automation are the key distinguishing factors among the studied scenarios, they developed their own scenarios. Their four scenarios for 2030 are described with respect to mobility challenges and socio-economic issues, and the most likely scenarios implied only incremental advances, such as a slow shift toward self-driving, electric, and shared vehicles.
Similar to the current study, Fulton et al. ( 24 ) utilized basic data and projections from MoMo, created by IEA, and focused on modeling the three revolutions, namely, electrification, automation, and shared vehicle trips served by transportation network companies (TNCs). Their projection system tracked the number of vehicles and their cost, daily and annual travel, average passenger loading, fuel use, and worldwide carbon emissions. The analysis is based on eight countries, one of which is the U.S.A. The three scenarios were the business-as-usual (BAU) scenario, the two revolutions (2R) scenario including a rapid increase in non-autonomous EVs and later autonomous EVs, and the three revolutions (3R) scenario, which assumes that in addition to the 2R, sharing rides in the form of on-demand ride-hailing and public transport becomes extremely popular.
Current Study in Context
In a study predating the COVID-19 era, Zmud et al. ( 25 ) employed a five-step process to develop scenarios for U.S. mobility in 2030 based on expert opinions encompassing demographics, economics, energy, transportation funding, and technology. Their results delineated two divergent futures: a “no free lunch” scenario with reduced oil dependency, stringent regulations, lower VMT, and increased transit use; and a “fueled and freewheeling” scenario marked by lower oil prices, induced suburbanization, heightened congestion, increased VMT, and declining transit usage.
Our study represents an evolution from Zmud et al. ( 25 ), as we also construct U.S. transportation scenarios for 2030 using expert inputs. However, we depart in three major ways. Firstly, we omit cross-impact analysis and leverage Zmud et al.’s work since we share many descriptors. For new factors such as the COVID-19 pandemic, we seek expert input to identify their impact on transportation. Secondly, we develop three scenarios manually, in contrast to Zmud et al.’s two, without using a proprietary foresight platform. This approach is feasible because we impose constraints by predefining the number of scenarios. We task experts with pinpointing a subset of descriptors and their associated levels that could decisively influence the scenarios’ trajectories. Lastly, instead of historical trend analysis, we apply a simplified mathematical model with established behavioral relationships to project outcomes such as VMT.
Notably, our study uniquely integrates the potential impacts of COVID-19 and employs expert insights to manage uncertainty in forecasting inputs, while adhering to established methodologies for quantifying transportation outcomes.
Data and Methods
We relied on secondary data from other studies and grey literature to develop the list of factors that explain how passenger transportation evolves. These factors are used to structure the online survey and workshop that our expert panel participated in. Their inputs constitute the primary data in this study. Additional details about the process and data are illustrated in Figure 1 and described below.
Selection of Descriptors
Various forces contribute to changing the way individuals live, work, and travel, both temporally and spatially. Based on past research ( 26 – 28 ) and other recent scenario work, such as the U.K. Department of Transport’s foresight studies ( 29 ) that incorporate emerging mobility modes and trends, we identified a set of descriptors that could influence passenger transportation over the medium term (10 years) in the U.S.A. (step 1, Figure 1). In identifying these descriptors, we relied on the STEEP framework, a simple yet comprehensive scheme to categorize different descriptors into the societal, technological, environmental, economic, and political domains. The STEEP framework is an extension of the PEST (political, economic, societal, and technological) framework introduced by American scholar Francis Aguilar in the 1960s ( 30 ). The STEEP framework is commonly used in business strategies, to categorize contextual factors that may be relevant to an issue into the five said domains. This process helped us gather historical trends and background information about each descriptor, which we used to elicit information from experts.
As the research started before the pandemic, we do not include the Ukraine war and other major global events that have transpired since the Fall of 2020 as factors. The COVID-19 pandemic remained a major discussion point.
Expert Elicitation
Experts for this study were selected based on their expertise (many publications, participation in academic and policy committees and organizations), current position (associate professor, senior planner, director, etc.), and experience (typically 10 or more years) in studying or dealing with one or more aspects of the five STEEP domains as they relate to passenger transportation. The experts work in academia, industry, nonprofit organizations, and government agencies. They were approached via email invitations. Once they agreed to participate, an online survey on descriptors was distributed to them. The survey contained background information on each of the 18 descriptors. Experts could choose to respond to as many as seven different topics depending on their expertise.
In the survey, experts provided their most likely, low, and high estimate of each descriptor in 2030 with supporting arguments (steps 2 and 3, Figure 1). Where quantitative projections were inappropriate, Likert-type questions were used to get a qualitative sense of how a descriptor may trend. The results from the survey were analyzed internally, and then later discussed with the same experts during a series of two workshops. Data visualizations and a brief list of reasons each expert noted in their rating were used to initiate discussion around each topic. The discussion helped us explore which projections will hold and why, and build consensus around them.
Creation of Scenarios
Experts contributed to the scenario creation process in three key stages. In the first, they provided us with a range of projections for each descriptor in the survey. To keep the number of projections manageable, we needed these projections condensed into fewer levels: one to three discrete values per descriptor depending on the range and the uncertainty associated with that descriptor. Therefore, for each descriptor, we showed experts in the workshop a visualization of the responses with an annotation summarizing the range and reasoning all the experts provided. We then asked the group: “What do you think are one to three levels that capture the range of this descriptor?” Using what we learned in the workshops, we finalized levels for the descriptors in 2030 (Table 1).
2030 projections for descriptors
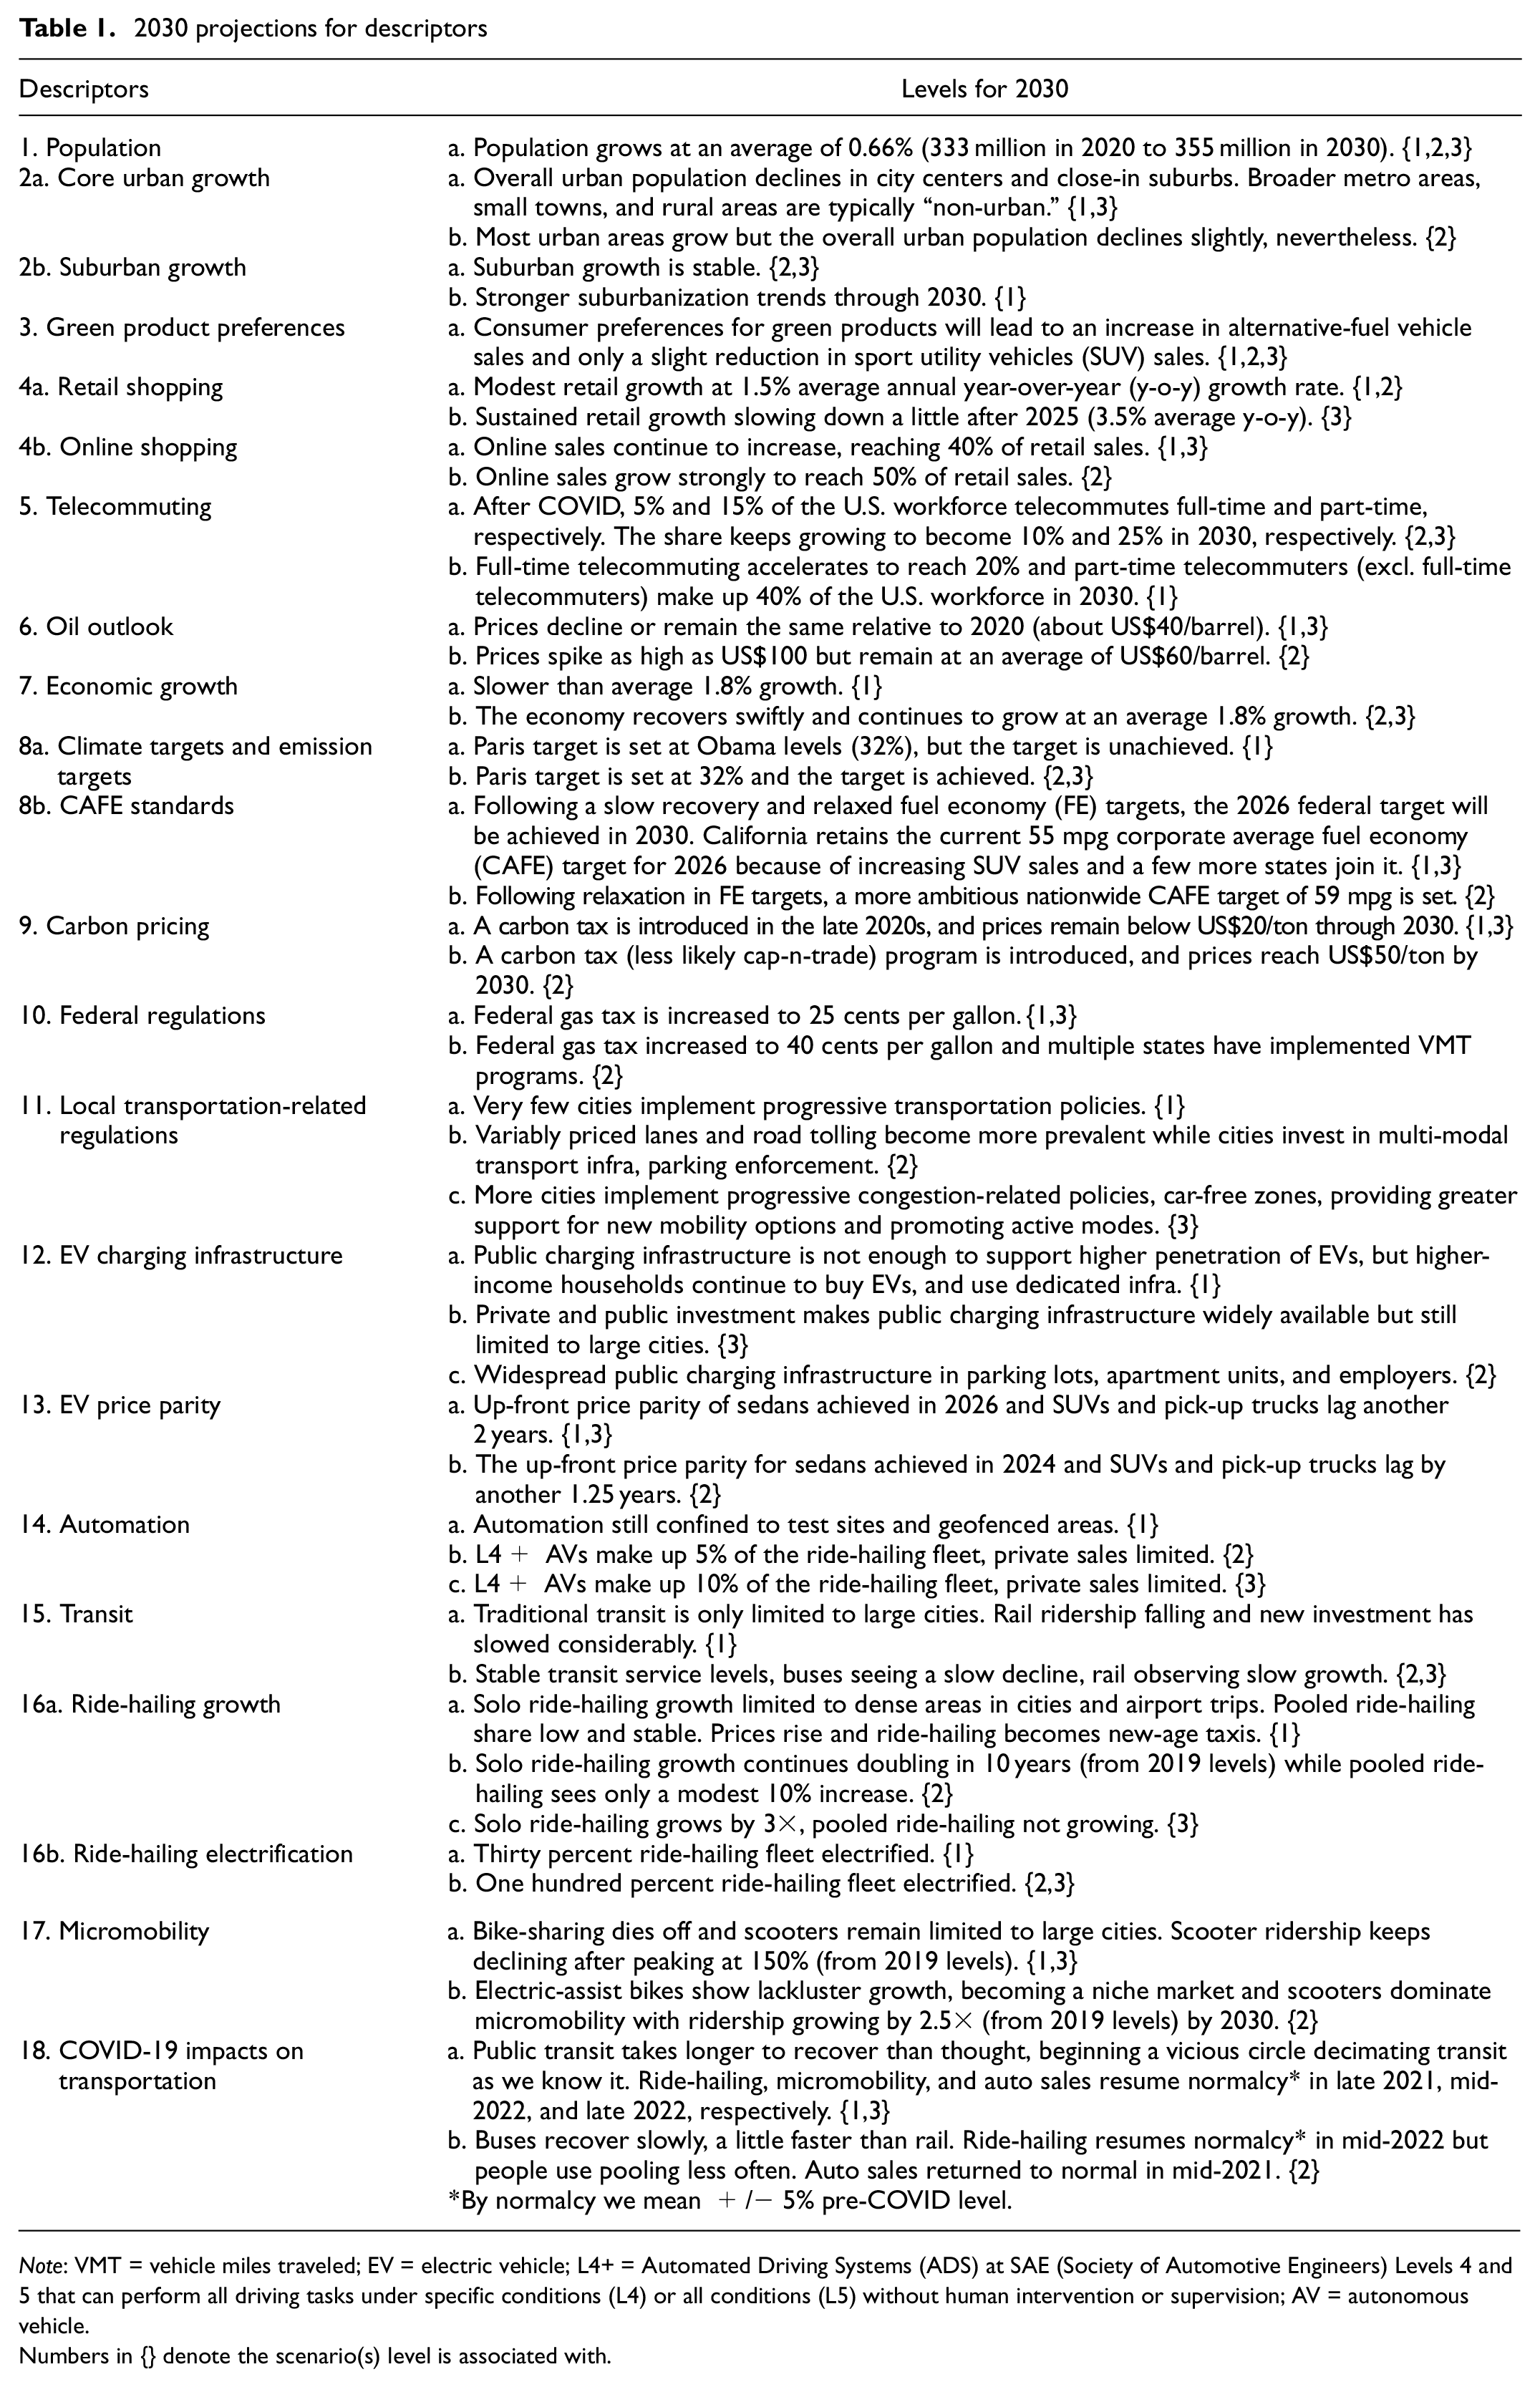
Note: VMT = vehicle miles traveled; EV = electric vehicle; L4+ = Automated Driving Systems (ADS) at SAE (Society of Automotive Engineers) Levels 4 and 5 that can perform all driving tasks under specific conditions (L4) or all conditions (L5) without human intervention or supervision; AV = autonomous vehicle.
Numbers in {} denote the scenario(s) level is associated with.
In the second stage, after the exercise to consolidate levels was over, experts were asked to provide their top three choices for the most influential descriptors that would distinguish transportation pathways in the next couple of years. Through a guided discussion, experts agreed on a subset of descriptors that are uncertain and impactful and are most likely to shape and drive transportation scenarios (see Table 2). Unlike other studies, such as Zmud et al. ( 16 ), that use computer software to iterate over the astronomical number of combinations of different levels that make up a scenario cluster, having such a subset significantly reduces the number of unique combinations across the 18 descriptors.
Levels of indicators across the three scenarios
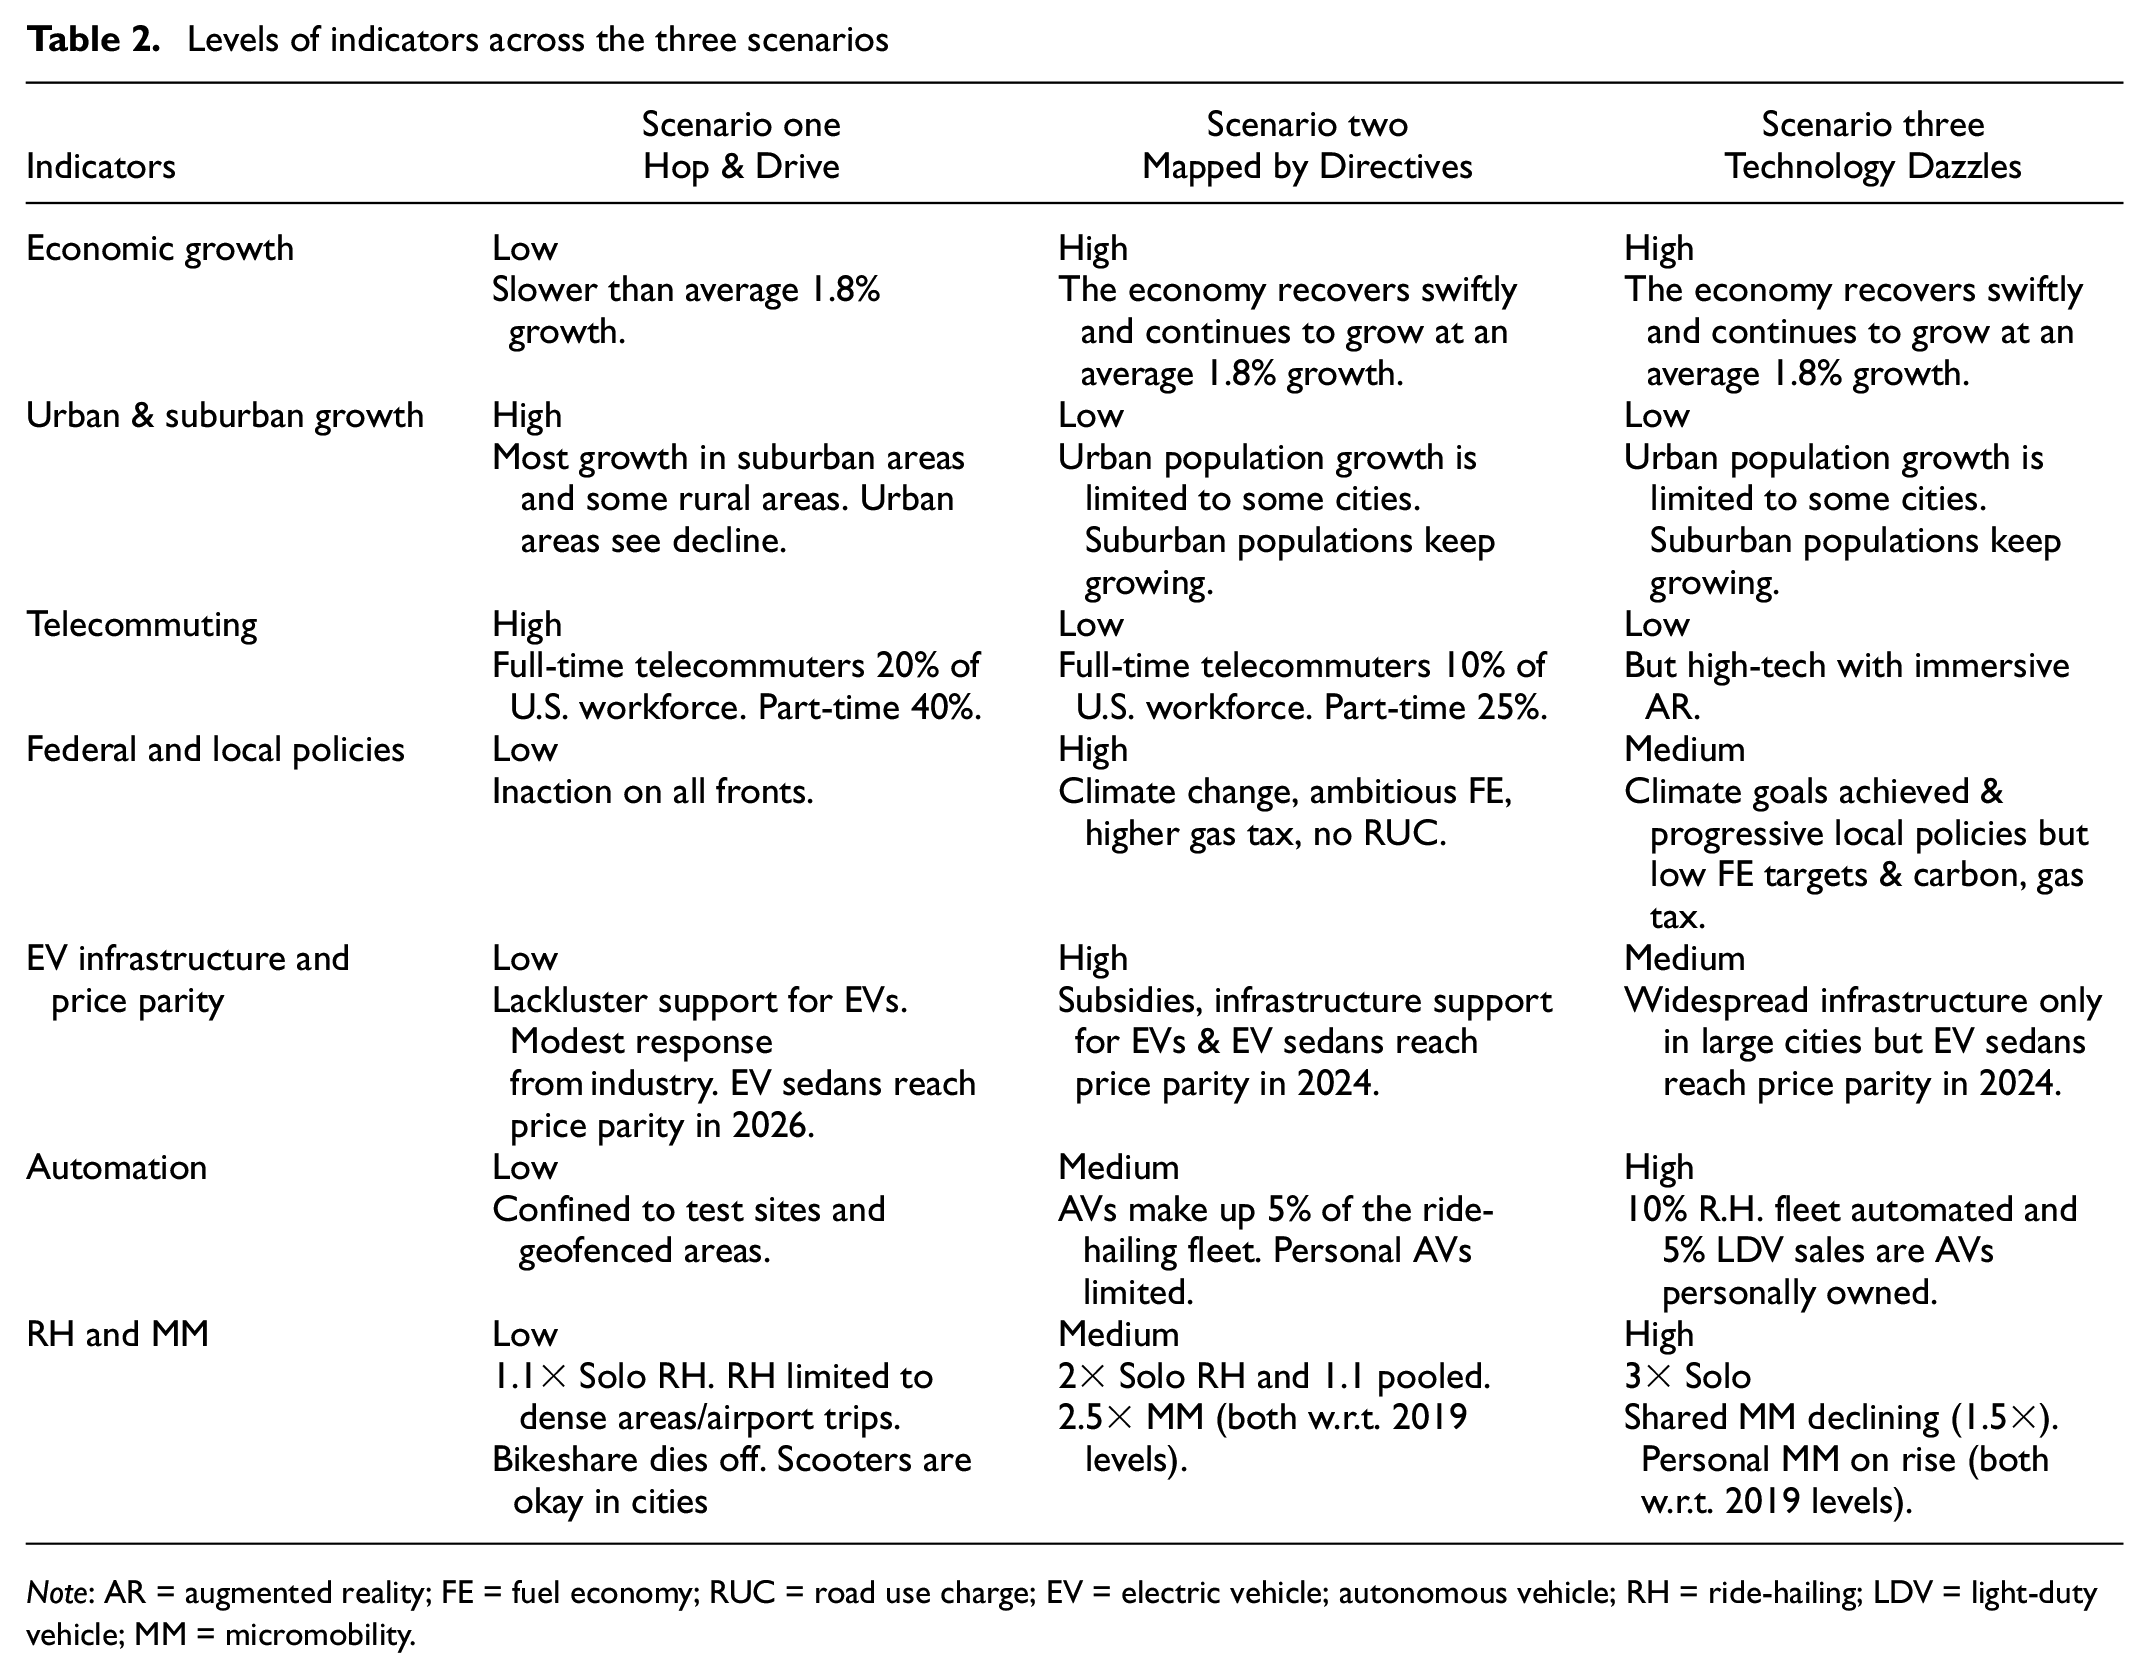
Note: AR = augmented reality; FE = fuel economy; RUC = road use charge; EV = electric vehicle; autonomous vehicle; RH = ride-hailing; LDV = light-duty vehicle; MM = micromobility.
Lastly, each expert was asked to sketch out two scenarios they foresaw playing out based on the group discussions. A scenario can be thought of as a cluster of distinct levels centered around these impactful descriptors. Experts were asked to combine distinct levels of the seven indicators in Table 2 agreed on previously. Some experts had common visions of the future, so they collectively arrived at nine unique scenarios.
The research team started with the seven indicators descriptors in Table 2 (and nine scenarios that experts shared), and added additional levels of the remaining descriptors based on logic and reasoning as opposed to a computer-based foresight tool to arrive at three to four clusters (step 4, Figure 1). Once the initial set of clusters for each scenario was developed, scenarios were iterated, and the set of levels in each scenario was adjusted until they became internally consistent. This process loosely followed the consistency analysis used by Zmud et al. ( 16 ). For example, high GDP growth is associated with strong retail spending and higher vehicle sales, therefore they belong together to be internally consistent. The numbers in curly brackets against each level {1, 2, or 3} in Table 1 denote the scenarios that level is associated with. A level can be shared by two or more scenarios.
Quantification of Scenario Outputs
A cluster of descriptor levels does not tell us enough about the outcomes associated with a scenario. Modeling is needed to convert a group of discrete levels into more complete, consistent pictures of the future. For each scenario, we converted each of its descriptor levels into inputs and assumptions for modeling (step 5, Figure 1). Scenario outputs such as person miles traveled (PMT), VMT, vehicle sales by powertrain, mode shares, energy use, and GHG emissions were generated (step 6, Figure 1) using a spreadsheet tool based on the IEA MoMo. MoMo was chosen because of its prominence (IEA has applied it for decades to conduct exploratory modeling), up-to-date baseline data, coverage (covers several developed and developing countries until 2050), user-friendliness, and tractability.
MoMo (used under license) provides historical data for the U.S.A. and other world countries and regions using a variety of sources, such as the U.S. Department of Transportation, Department of Energy, and IEA data. Because the model is more complex than was needed in this study, we developed a custom spreadsheet model with a similar structure: assumptions with respect to vehicle sales, travel per vehicle, vehicle fuel type, and vehicle efficiency across all modes are made, and these are then used to generate estimates of vehicle stocks, total travel, energy use, and CO2 emissions. Details of the model structure are available in Fulton et al. ( 31 ).
Using the model (and including data that was recent as of 2019), we started with a baseline (COVID-included) scenario to 2030 and adjusted this using the various assumptions made for each scenario. No baseline scenario remains, although the HD scenario may be the closest to one. Since MoMo models future travel in 5-year increments, we use the 2020 numbers as a base, while acknowledging that these were low and unusual for a typical year. Although we use the IEA’s MoMo to perform the modeling, the inputs are based on our data and levels determined through internal discussion. Therefore, none of our results necessarily align with the transportation scenarios that IEA develops.
To illustrate the model’s accounting process, we provide an example of CO2 emissions. Carbon emissions are assumed to be a mathematical function of vehicle stocks, travel, efficiency, and type (and carbon intensity) of fuels used, summed across all modes and vehicle/fuel types, as shown in Equation 1:

where G is the total carbon dioxide emissions in the region, A represents activity (e.g., in passenger-miles), S is the structure variable that represents the load factors (i.e., occupancy of passenger vehicles) for the various modes and fuel types, I measures energy intensity in energy per vehicle mile for each mode and fuel type, and F is the carbon intensity, both directly from the vehicle as well as “well-to-tank” emissions, such as the carbon intensity of electricity production for use in EVs.
All variables are tracked over time with vehicle stocks as a function of sales and a retirement function. We projected all activity and sales variables to 2030 based on the levels of key input variables in the scenarios, then entered these into the model to get vehicle stocks, average intensity, energy use, and CO2 emissions.
Development of Scenario Narratives
Finally, we integrated quantitative modeling results into a storyline. The resulting narratives describe three alternative versions of the future of passenger transportation in the U.S.A. from a vantage point of 2030, and present what happened through the years leading up to 2030 as if watching the events happening from a rear-view mirror. The narratives help bind together the various influencing factors and how they interact, the causal relationships at play, and the events that transpire to make a certain future happen, describing the future scenarios as stories rather than numbers and projections. For the sake of brevity, we do not report the long narratives here, but they are available on request.
Results
Our three scenarios can be broken down and identified by a set of 10 descriptors (Table 2). Six of these key descriptors have been lumped into three closely aligned pairs, namely federal and local policies, EV infrastructure and purchase price parity, and ride-hailing and micromobility, thereby generating seven indicators that distinguish the three scenarios. The table is consistent with the levels used in each scenario (Table 1) and helps distill down indicators and eventually model them.
While some descriptors drive scenarios because of their relative uncertainty and impact over others, there are a few others that are less uncertain. Their relative uncertainty is apparent from the number of levels they have. Population and consumer preferences for green products have just one level each, while carbon pricing has two.
Population: less than a decade is not enough time for meaningful changes in the U.S. population. Despite the COVID-19 pandemic, not much is expected to change previous and current U.S. Census Bureau projections. The COVID-19 pandemic could cause birth rates to tumble but how long this will last is uncertain.
Consumer preferences for green products: although climate awareness will increase, this will not necessarily translate into stronger preferences for smaller or alternative-fuel vehicles. Car choices will still be driven by a mix of car-pride and cost considerations, among others. Regulation will have a greater role to play in promoting alternative-fueled vehicles than consumer preferences for greener alternatives.
Carbon pricing: although we defined two levels for carbon pricing, the overall sentiment of experts about a carbon pricing regime was unenthusiastic because of the myriad political challenges facing a carbon pricing regime. Also, a carbon tax does not directly affect transportation outcomes, and therefore assumers lesser importance.
Scenarios
We present a short narrative-style description of the three scenarios and compare them with scenarios from two studies, Zmud et al. ( 16 ) and Miskolczi et al. ( 23 ), that share the horizon year (2030) and focus (passenger transportation) with our study. In favor of simplicity, we refer to these studies by their first author in the remainder of this section.
The first scenario—HD is governed by high rates of suburbanization and telecommuting. Through the 2020s, the U.S.A. sees a lower GDP per capita than during the prior decade. Suburban and rural living have become increasingly attractive owing to psychological and cost reasons. Telecommuting opportunities have also improved and are more widely accepted. More and more people “hop” from urban areas to suburban ones. Despite more teleworking and less commute travel, there are more trips for non-work purposes and trips are longer and more car-dependent, resulting in more overall driving. This is the closest to a BAU or baseline scenario and is the equivalent of Fueled and Freewheeling in Zmud et al. and Old Grumpy Transport in Miskolczi et al. The former is fueled by low oil prices and growing suburbanization that leads to more driving, bolstered by a lack of policy disincentives to driving. Cars and convenience are central to the latter scenario, vehicle automation is deemed slow, and shared mobility occupies a niche serving the younger generation. The second scenario—MD captures a future that is shaped by ambitious policies at the local and federal levels. Industrial leadership motivates an unclouded vision on climate change policies at the federal level and green infrastructure investments enable sustainable transportation policies at the state and local levels, accelerating transportation electrification and re-invigorating legacy urban mobility systems such as public transit. This scenario is synonymous with Zmud et al.’s No Free Lunch, where economic growth is high, but oil demand has fallen because of favorable policies and electrification. The difference though is that greener attitudes have brought about legislative change, which is not true in our case. We foresee that eco-friendly attitudes are stronger in MD, but do not exert any influence on policy progress. MD is a mix of Miskolczi et al.’s mild-progress At an Easy Pace and shared mobility-focused Mine is Yours scenarios. With the former, MD shares growth in telecommuting, stronger local policies, and greater electrification. In contrast, with the latter, it shares a drop in emissions because of electrification and a stronger economy. The third scenario—TD imagines what rapid technological improvements and adoption can lead to. Technology takes the rein, outpacing regulations and challenging car culture to make automation a reality and enable innovations such as mobility as a service, leading to an integration of modes and multi-modal travel that significantly disrupts transportation. This scenario resembles Tech-Eager Mobility, a scenario with the most intense technological transition in Miskolczi et al.’s work. Both autonomous vehicles (AVs) and EVs experience great advancements, but unlike our scenario, it bodes well for both congestion and the environment. It also contains elements from Mine is Yours, where the sharing-based market economy gains considerable traction, and greater modal integration ensues.
Quantitative Results
Overall results across the three scenarios are subtle and reflect the limited range of futures over the next few years leading to 2030. Figures 2 and 3 provide key results.
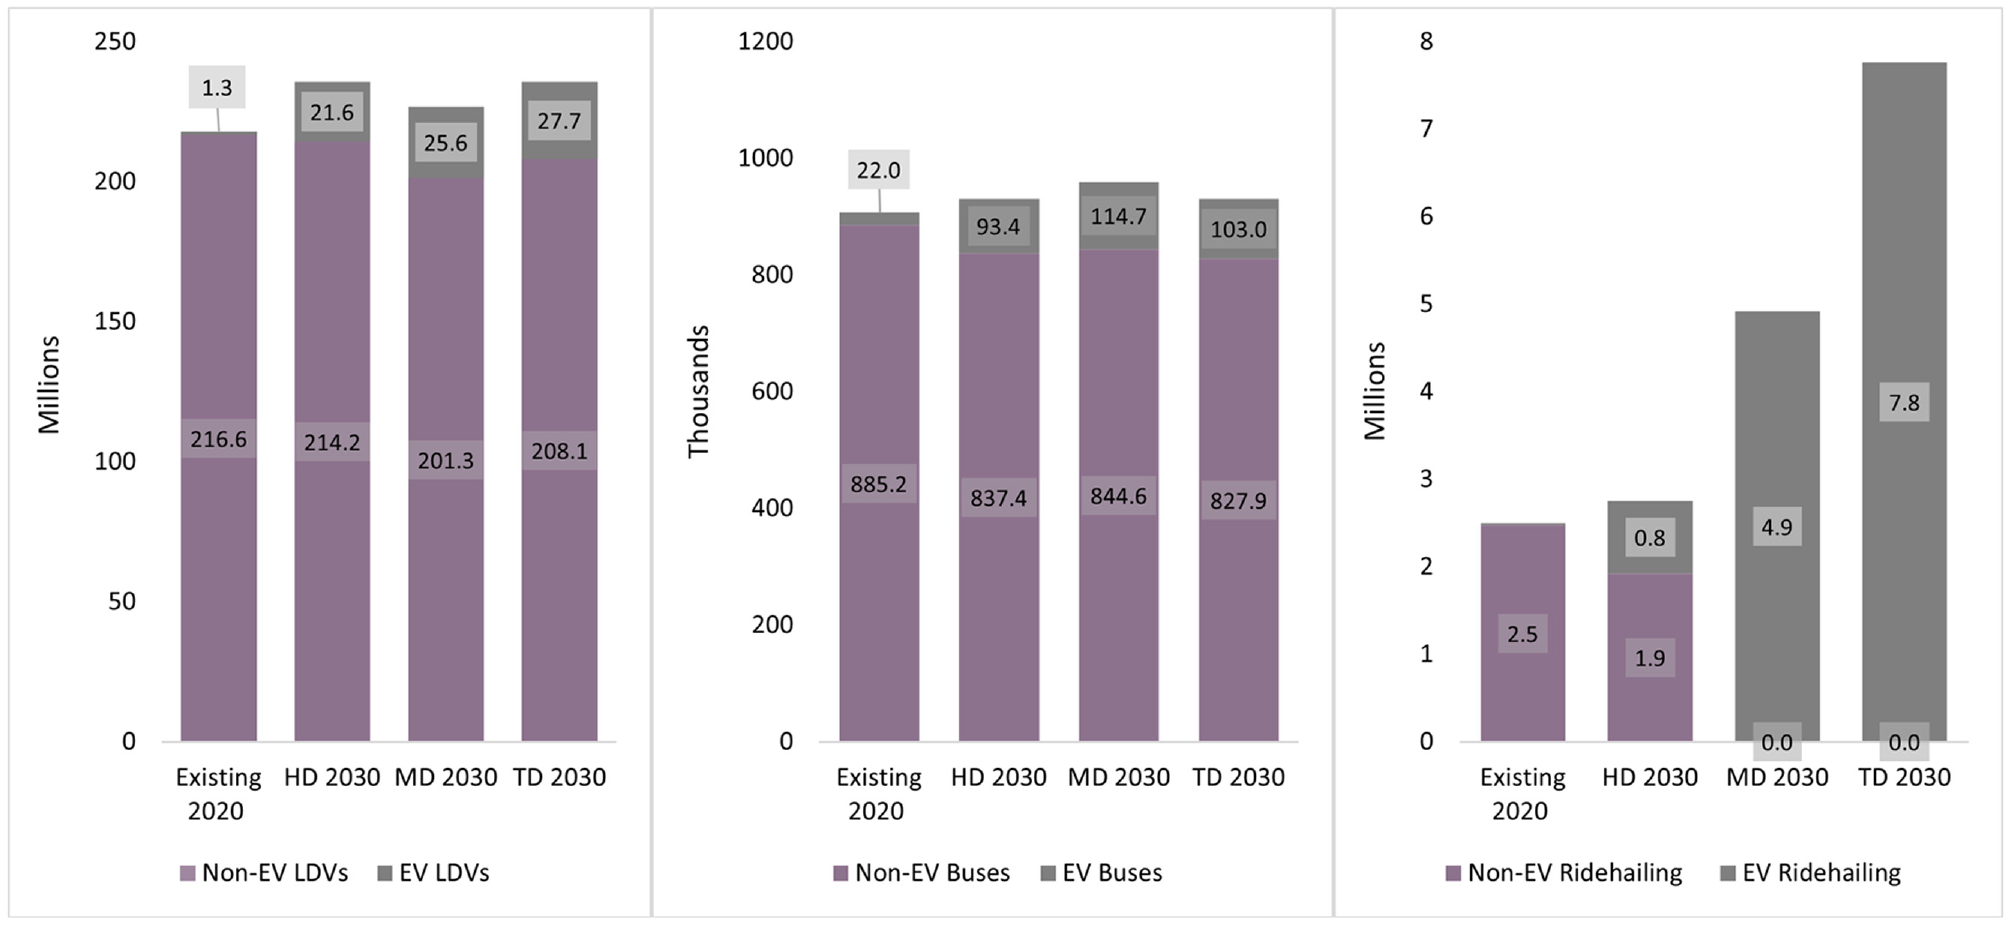
Vehicle stocks: light-duty vehicles (LDVs), buses, and ride-hailing.
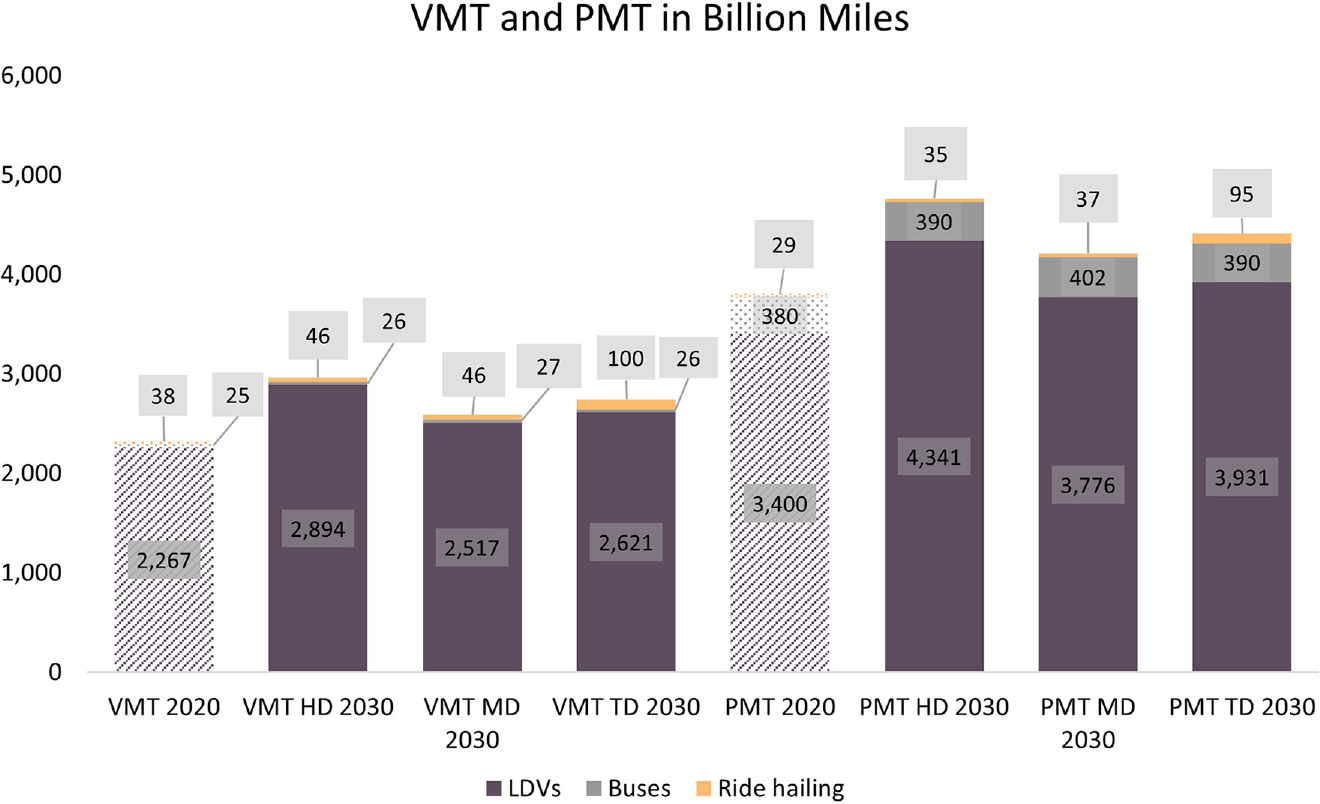
Vehicle miles traveled (VMT) and passenger miles traveled (PMT) by scenario.
The major differences appear for vehicle stock and VMT. Since light-duty vehicle (LDV)-based travel tends to dominate overall U.S. travel, changes in LDV travel tend to dominate the scenarios. In general, in HD, the new LDV sales are lower (leading to lower stocks), and electrification is lower, but because of the movement to suburbs and car-based mobility patterns, driving levels (or VMT) are higher than in the other scenarios. MD has the strongest policy intervention, resulting in lower driving levels, the highest uptake of EVs, and the lowest CO2 emissions of the three scenarios. The TD scenario has a similar level of EV uptake but lower transit and micromobility ridership than in MD, while ride-hailing fleets in TD begin to include some automated vehicles.
The total stock of LDVs is not significantly different across the scenarios, although their renewal rate is lower in HD, so average vehicles are slightly older by 2030 and achieve less fuel economy improvement than in the other two scenarios. The share of EV sales across LDVs, buses, and ride-hailing increases over time in all scenarios, as electrification advances, but much less in HD than the other scenarios. By 2030, EV sales make up 25% of total LDV sales in HD and a little over 35% in the other two scenarios, which is higher than the range that experts indicated in the survey and workshops (which were held before the 2020 U.S. elections). The higher EV sales shares in MD and TD reflect the Biden administration decarbonization targets from 2021 (including a 50% sales share target for EVs by 2030), as well as their recommitment to support state-level targets. For reference, under the Announced Pledges 2030 scenario of IEA that reflects official national commitments, EV car sales and the corresponding EV stock in the U.S.A. will be 7.4M and 35M, respectively ( 32 ). We project the MD scenario to have 8.2M EV car sales, but the other two scenarios fall short of this national target. We also forecast lower vehicle stock than IEA because of a higher vehicle scrappage rate in lieu of a robust battery recycling supply chain.
We think all of these will be important, but things could still change, such as new policies after the 2024 elections (which could be what is reflected in HD). It seems probable that California and the 13 states adopting similar standards will determine the outcomes in passenger transportation in all three scenarios.
For example, if California and the 13 states that have adopted California’s stringent GHG emission criteria under section 177 of the Clean Air Act and account for about half the U.S. car market, targeted 100% zero-emission EV sales by 2035, and achieved a 50% level by 2030, that would account for 25% light-duty EV sales share nationwide, or even higher if other U.S. states make progress. Experts in our study suggest that nine more states will join the so-called 177 states, which can boost EV sales and result in those higher shares. Although we did not explicitly model how different vehicle segments will perform, experts in our survey suggest sports utility vehicles (SUVs) will most likely make up 52% of the market share in 2030 but this could be as high as 62%.
EVs made a negligible (0.6%) share of the entire LDV stock in 2020. This share expands by 2030 to 9% in HD and 11% in MD and TD. In contrast, the non-EV LDV stock declines marginally in HD (−1%) and has sharper declines in MD (−7%) and TD (−4%). Non-EV bus stocks also decline in all three scenarios. EV bus stocks expand to five times the current fleet size in MD, followed closely by HD and TD. In both MD and TD futures, the entire ride-hailing fleet will be electric by 2030. In HD, although the total ride-hailing fleet does not change much between now and 2030, at least 30% will be electrified. Despite a 300% growth in ride-hailing trips in TD relative to 2020 levels, ride-hailing vehicle stock relative to the total LDV stock remains low at 3.3% but is 180% and 280% higher than in the shares in the MD and HD scenarios, respectively.
With respect to baseline 2020 (shaded bars in Figure 3), VMT and PMT growth in LDVs is highest in HD (+28%), followed by TD (+16%) and MD (+11%). VMT (and proportionately PMT) by buses will see limited growth across the three scenarios (from +2% to +6%). We estimate a small spike in bus stocks and transit VMT congruent to what we see from the past that transit VMT keeps creeping up slowly. Buses have become a slightly more important provider of passenger trips and travel in the MD scenario, because of a revitalization of transit systems and multi-modality. Ride-hailing VMT and PMT growth varies across the scenarios and are expected to expand the most in TD and the least in HD.
Expert-suggested average VMT growth from (pre-COVID) 2019 levels was projected at 3.7%, 1.2%, and 5% for the lowest, most likely, and highest estimates, respectively. These figures were notably optimistic, indicating modest growth from 2019 levels; even the highest estimate represents a compounded annual growth rate (CAGR) of 0.48%, lower than the Federal Highway Administration’s VMT forecast of 0.6% published in 2023 ( 33 ). In contrast, our modeling results for VMT range from 1.1% in the MD scenario to 2.5% in the HD scenario. Overall, our forecasts lean toward pessimism, aligning closely with the administration’s forecast of 1.1% VMT growth (from 2017), which was driven by factors such as population growth, strong economic conditions, and lower oil prices that typically lead to increased driving levels ( 34 ).
With respect to mode share, the experts in our study suggest that autos will dominate, with an average 75% mode share for urban mobility, similar to the pre-pandemic 83%. In contrast, new mobility modes such as ride-hailing and micromobility will gain popularity. The median solo and pooled ride-hailing mode share could reach 3.5%. When including micromobility, these modes could collectively capture 7%–15% of the mode share in 2030, according to the experts who contributed to the study. In comparison, modeling results indicate that ride-hailing will make up 0.8%, 1.7%, and 2.6% of all urban private vehicle trips in the HD, MD, and TD scenarios. That translates to a 2%–6% urban mode share and compares well with expert inputs. Modeling reveals that public transit mode shares will hover around 5%, putting it a little higher than the mean value of 3.8% experts opined. Our modeling results and expert opinion (mean value) both project a higher mode share for public transit than the pre-COVID 2.5%. Experts agreed that the aggregate transit ridership would decline by about 3%, resulting in a lower transit occupancy factor. However, this decline in ridership would have a negligible impact of only about 15 basis points on the transit mode share. In aggregate, transit mode shares remain exceedingly small compared to private cars.
Overall, all scenarios result in lower 2030 energy use and well-to-wheel transportation CO2-equivalent GHG emissions than the 2020 and the pre-COVID 2019 levels (see Figure 4). This is due primarily to changes in the vehicle fleet, that is, the increased use of EVs, with up to double the efficiency of internal combustion engine vehicles (ICEVs), thus reducing the need for energy consumed in transportation. Unsurprisingly, the MD scenario has the lowest energy use and emissions while HD has the highest. The TD scenario shows higher energy use and emissions because of the VMT associated with automation and ride-hailing and the highest electrification levels for the same reasons. The net effects on emissions are that HD has the highest CO2 in 2030, while MD has the lowest.
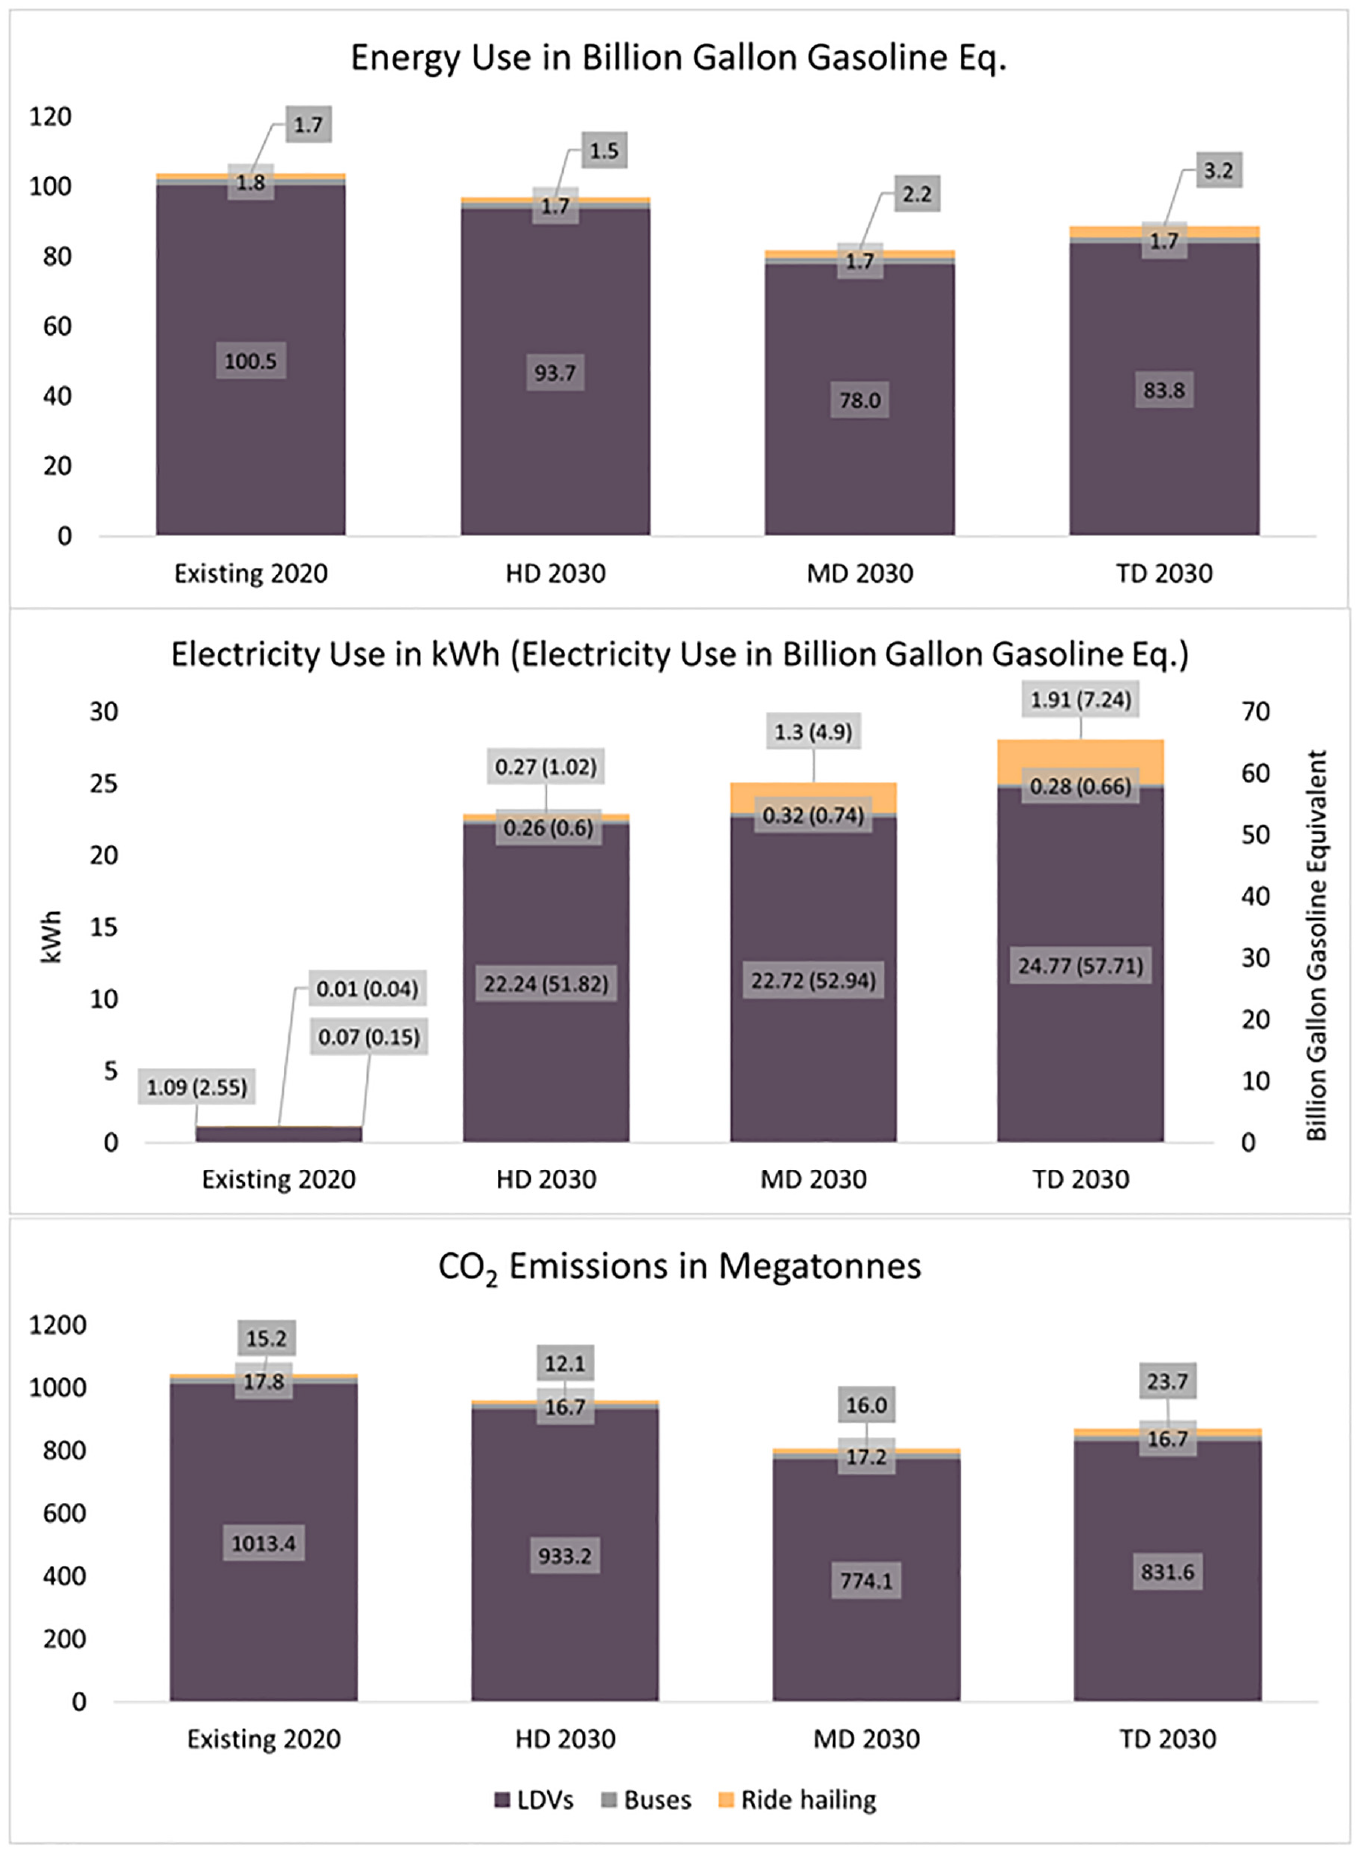
Transportation energy use, electricity use, and CO2 emissions by scenario.
Interestingly, our energy consumption projections show greater variability across scenarios compared to those in the 2023 annual outlook from the Energy Information Administration (EIA) ( 35 ). While the reference cases are similar—0.7% average decline rate in our HD 2030 scenario versus 1% in EIA’s reference case based on 2022 levels—our other scenarios forecast more significant drops. EIA’s lowest-consumption scenario, which combines low economic growth and low zero-carbon technology costs, projects a decline of 1.4%. This is conservative compared to our TD 2030 scenario’s 1.58% decline and MD 2030 scenario’s 2.36% decline.
With respect to emissions, our forecasted average annual decline rate of 0.7% in HD 2030 is more conservative than the 1.3% decline in EIA’s reference case scenario. EIA’s lowest-consumption scenario aligns with the lowest emissions, showing a reduction of 1.7%. However, this is slightly lower than the 1.8% decline in the TD scenario and significantly lower than the 2.56% decline in the MD scenario. In both cases, MD emerges as a stronger, more optimistic scenario than EIA’s equivalent eco-friendly scenario. These differences could be attributed to factors such as higher fleet electrification levels, stronger corporate average fuel economy (CAFE) standards, differences in vehicle scrappage rates, and other assumptions in our analysis.
Conclusions
Visualizing the passenger mobility landscape in the U.S.A. over a 10-year horizon is challenging, especially considering the significant changes in transportation over the past decade and the impact of the COVID-19 pandemic. Our scenario approach aims to untangle the uncertainties associated with passenger transportation, revealing several aspects and painting possible pictures of the future in 2030 without necessarily predicting what will happen.
The key limitations of our work are also its strengths: expert input and its assimilation. A similar study conducted with a different panel of experts might result in different scenarios. There are also various methods to collect, process, and combine expert inputs, some more structured and quantitative than the one we adopted. Each approach has its own merits and demerits.
Three years have passed since the start of the pandemic, and transportation continues to transform rapidly. Some of our projections, such as telecommuting levels, appear unrealistic in 2024. Does this mean these scenarios need revision? Perhaps. However, revising the scenarios to match today’s outlook would result in a different study altogether. This study aims to offer highly uncertain versions of the future while distinguishing more certain aspects from less certain ones. Just as studies on telecommuting intentions during the pandemic require follow-up studies to compare (not validate) previous findings, we need new post-pandemic scenarios to compare with our current scenarios. This paper cannot accomplish both.
Despite the speculative nature of such scenarios, their value in informing policy, providing clarity, and establishing benchmarks to guide transportation planning in turbulent times is well recognized ( 36 ). Scenario planning is also receiving renewed interest from transportation agencies, as evidenced by recent Transportation Research Board (TRB) conferences on this topic (see TRB’s scenario planning conference [ 37 ]).
Indicators and Major Uncertainties
Among the experts that participated in our study, there was general agreement about four U.S. societal trends going forward. These include stable population growth, a continued trend in suburbanization despite the growth in some urban cores, increased preference for green products, EVs gradually reaching price parity, and thus rapidly increasing electrification of private vehicles, buses, and ride-hailing fleets.
However, there is considerable uncertainty surrounding the pace of economic growth, the degree of suburbanization and growth in telecommuting, the extent and direction of environmental policies, the specific pace of vehicle electrification, the adoption of new mobility options such as ride-hailing and micromobility, and the pace of technology development for automated (and eventually driverless) vehicles. These five indicators were considered the key levers and the basis for differentiating the three scenarios considered.
A major factor is the overall state of the economy, which affects where people live, whether, how, and where they work (and how they commute), whether they have disposable cash to shop more, and whether they replace their vehicles or decide to keep them longer. Another major driver is how the U.S.A. recovers from the COVID-19 pandemic and the time horizon of this recovery. At the time of writing of this paper (mid-2022), even more contagious variants have surfaced in various parts of the world, and a return to normalcy is still distant. It remains to be seen what ongoing psychological and economic impacts will linger and how that will affect how people travel. Whether there is even a “return to normal” is an open question.
The next major driver in our scenarios is policy. At the time the expert workshops were conducted in November 2020, uncertainty loomed high with the U.S. elections and the policy landscape seemed more uncertain than it does in 2023. The Biden administration reversed numerous rollbacks and dilution of environmental policies by the 2016 administration. However, despite the reversals, movement on climate policy remains lackluster. While it is impossible to establish the exact direction that future policy will take in the U.S.A., federal spending on clean infrastructure is set to increase, and a renewed commitment to supporting vehicle electrification is apparent. In the MD scenario, we have attempted to capture what progressive policies at the federal level could do for transportation in 2030.
The final major driver and what seemed like the “wild card” was the development of automation technology. This contrasts with vehicle electrification, which is not surrounded by the same uncertainty as the technology is already mature enough. EVs in 2021 arguably achieved price parity with ICEVs for sedans in the U.S.A. and were expected to do so for larger vehicles such as SUVs, pick-up trucks, and buses shortly. Comparatively, automation is in an embryonic stage and experts differ widely in their opinion of its future. Although more pilots are being approved, a breakthrough in automation has yet to happen. Automation in freight might happen sooner. Although some companies have deployed driverless cars in city environments, very few are providing rides to the masses without a driver in the front seat. However, the race for automation is full-on, and major developments could be achieved in the next few years. However, automation uncertainty is not limited to technology development and extends to legal considerations. At the time of this writing, California and other states are actively analyzing the aspects of automation that need to be regulated. In summary, even though automation might take time to become commonplace, the possibility of unpredictable leapfrogging and the many disruptions it can bring is real. We have captured this possibility in our third scenario, TD.
Implications for the Future
Changes to automobiles are the most important drivers of change in energy use and GHG emissions from transportation, while changes in transit and micromobility use have relatively minor impacts. The starting position for public transit and ride-hailing is a small share of travel and trips. Thus, even rapid growth in either of these would not be a game changer for U.S. travel patterns. The scenario modeling results highlight the role of policy and regulations in achieving higher levels of GHG reductions. Left to market forces and under the context of the COVID-19 pandemic, we might see an HD-style future where transportation externalities worsen. Overall, the scenarios show that HD is the most energy-intensive and highest emissions version of 2030, while the MD scenario is the one with the lowest emissions, although with a pronounced increase in electricity use, thereby highlighting the need to decarbonize the electricity grid. An MD future will result in a 34% reduction from equivalent 2005 light-duty transportation emission levels, an additional 15 and 5 percentage point drops when compared to the HD and TD scenarios, respectively. This favorable future would align well with the Obama administration’s emission reduction target of 32% but will fall short of the ambitious 50%–52% reduction announced by the U.S. administration in 2021.
Footnotes
Acknowledgements
The authors would like to thank Amit Agrawal and Irene Feige of the Institute for Mobility Research (IFMO) for their contribution to the research. The study builds on the work developed in previous related research conducted at the UC Davis Institute of Transportation Studies and similar studies conducted by IFMO. The authors would like to thank James Giller, Yan Xing, Yunshi Wang, and Tak Marcus Chan for their contributions to the research. We are extremely grateful to the experts that participated in our survey and attended one of our two online workshops in Fall 2020: Kay Axhausen, Michael Berube, Paul Bingham, Chandra Bhat, Pierpaolo Cazzola, Adam Cohen, Matthew Dorfman, Frank Douma, Marie Fagan, Emil Frankel, Duleep Gopal, Ellen Greenberg, Britta Gross, Marianne Kah, James Kliesch, Kara Kockelman, B. Lindsay Lowell, Nancy McGuckin, Rolf Moeckel, Kouros Mohammadian, Patricia Mokhtarian, Geoff Morrison, Matteo Muratori, Rachel Nealer, Robert Noland, Maren Outwater, Steven Polzin, Michael Shelby, Steven Shladover, Jacopo Tattini, Jacob Teter, Jack Wells, and Johanna Zmud. Experts voluntarily participated in the study, including the survey and workshops, and no personal information about the participants was collected before or during the study.
Author Contributions
The authors confirm contributions to the paper as follows: study conception and design: A. Kothawala, G. Circella; data collection: A. Kothawala, L. Fulton, R. Dominguez-Faus, M. Ahmad; data analysis and interpretation of results: A. Kothawala, M. Ahmad, L. Fulton, G. Circella; draft manuscript preparation: A. Kothawala, M. Ahmad, R. Dominguez-Faus. All authors reviewed the results and approved the final version of the manuscript.
Declaration of Conflicting Interests
The author(s) declared no potential conflicts of interest with respect to the research, authorship, and/or publication of this article.
Funding
The author(s) disclosed receipt of the following financial support for the research, authorship, and/or publication of this article: This study was funded by the IFMO, a research facility of the BMW Group (Grant No. A20-2200). Additional financial support was provided by the 3 Revolutions Future Mobility Program at UC Davis.