
Abstract
Flood alerts are a means of risk communication that alerts the public to potential floods. The purpose of this research was to investigate factors that affected drivers’ understanding and actions given a flood presented through a mobile navigation application. Two experiments were conducted to examine the effects of time pressure and type of flood information on drivers’ planned actions when faced with potential flooding. Participants were asked about their planned actions given one type of flood information in a driving scenario either with or without time pressure. Our results indicated significant differences in participants’ behaviors across the different flood information types, but not between the two time-pressure conditions. These results suggest that displaying the flood information is helpful in promoting drivers’ safe decisions to avoid the potentially flooded roadway, and that detailed information may help users better perceive the depth and risk of the potential flood.
Keywords
Successful risk communication for hazardous situations can prevent property damage and save lives. In the case of flooding, the public can be properly informed about potential floods through flood warnings. Flood warnings, or flood alerts, can vary in the level of detail that is included in the warning ( 1 ). Some warnings tell the user the depth of the flood or where emergency resources can be found while others may only tell users that a flood is possible in their area ( 2 ). Driving is a challenging task that requires attention and awareness over a period of time ( 3 ). Distracted driving, which is any activity that causes the driver to divert their attention from the primary task of driving, was responsible for 3,522 deaths in the U.S. in 2021 ( 4 ). It is vital to relay time-sensitive information, such as flood alerts, to drivers without causing distraction. Flood alerts can also vary in how they are communicated to the public. Mobile applications (apps) are especially useful for conveying flood information to drivers because of the increasing accessibility and proliferation of mobile devices. Flash floods—sudden local flooding, typically caused by heavy rainfall—can happen quickly and without warning, catching people off-guard, especially when they are driving. It is not uncommon for drivers to be faced with a flooded roadway during a flash flood. The big question when drivers are faced with a flooded roadway is whether they will drive through it or not, and what factors influence their decision. The objective of this study was to investigate factors that affect drivers’ understanding and response to a flood alert given by their mobile navigation app in a driving scenario.
This paper first discusses the related literature on flood risk communication, decision making under time pressure, trust in automation systems, effects of past flood experience and exposure, effects of gender, type of vehicle, and flood depth, and the motivation for the current study. The paper then details Experiment 1, including its methods, results, and discussions. Experiment 2 is then explained with its methods, results, and discussions. Finally, there is a general discussion about both experiments, and conclusions are formalized.
Related Literature
Flood Risk Communication
Risk communication is a key factor in aiding people to make safe and appropriate decisions based on the risk at hand ( 5 ). The main objectives of risk communication include: to inform and educate users about the risk in general, to encourage risk-reduction behavior and protective actions, to provide disaster warnings and emergency information, and to involve the public in risk management decision making and conflict resolution ( 6 ). Risk communication can come in various forms, ranging from warning labels on consumer products to national weather safety alerts, such as flood alerts. Risk communication through weather forecasts, and government and personal information sources worldwide, can aid in appropriate activity and travel behavior ( 7 – 11 ). However, it is still unclear how weather influences people’s driving behaviors ( 12 ).
Flood risk communication aims to educate the public about a potential flood and to aid the public in making safe and smart decisions to protect themselves and their belongings from a possible flood situation. Flood risk communication can be conveyed through flood maps. Flood maps should contain real-time information, water depths, and the probabilities of occurrence, and should also use the color blue to represent water due to natural association ( 13 ). However, maps have been shown to only marginally improve message understanding when the wafamilrning messages were presented for the public’s crisis and disaster information comprehension ( 14 ). The majority of the information in a flood alert is carried by the warning itself rather than the map, although the map furthers the comprehension of the information.
With the increasing prevalence of mobile devices, flood risk communication can also be relayed through mobile devices. Cumiskey and colleagues found that mobile services are the preferred means of warning communications compared to television for flash flood alerts ( 15 ). They also found that people preferred voice short messaging services (SMSs) and interactive voice responses (IVRs) because of easier accessibility and understanding of the message ( 15 ). Specifically, for mobile devices, Leelawat and colleagues studied the different information that various weather mobile applications provided ( 2 ). They found that people want to download mobile weather apps that provide information related to flood alerts, flood-area monitoring, and flood road monitoring information. They also suggested that flood mobile apps should let users know where the flooded areas are and safe places the users can evacuate to. Even with flood risk communication, people may still enter flooded roadways for a number of reasons, such as the urgency to reach their destination, low perceived risks associated with the flood, the purpose of the trip, and social influences ( 16 – 19 ).
As a consequence of climate change, extreme precipitation events have increased more than anticipated in frequency and magnitude in the 21st century ( 20 – 22 ). Transportation infrastructure, stormwater drainage, and resources are insufficient to accommodate the increases in flooding ( 20 , 23 ). Additionally, according to the National Oceanic and Atmospheric Administration, the frequency of recurring flood events is accelerating along the U.S. East and Gulf Coasts because of sea level rise and high tides, which disrupt the communities ( 23 , 24 ). It is estimated that, by 2050, most U.S. coastal cities will experience flooding for at least a full month per year ( 23 ).
There are three common types of floods: river floods, storm surges, and flash floods ( 25 ). The first type—river floods, or fluvial floods—is when the water level in a river, lake, or stream, rises and overflows the neighboring land ( 25 ). This type of flood is only a threat to those who are located near a body of water. The second type—storm surges, or coastal floods—is typically caused by windstorms and high tides that flood the land along a coastline ( 25 ). Similar to the first type, coastal floods mainly affect those who live on the coast. The third type–flash floods, most of which are pluvial floods—happens when there is intense rainfall that causes flooding and possibly overwhelms drainage systems ( 25 ). Flash floods can happen in any location, even if there are no bodies of water nearby, which is why they are the focus of this research ( 25 ). Flash floods can increase the number of miles driven and hinder the accessibility to flood-free roads ( 26 ). Additionally, flash floods can damage transportation infrastructure (e.g., roadways), interrupt transportation networks (e.g., traffic patterns), and increase driving hazards ( 27 , 28 ). Thus, flash floods can cause serious disruption in driving safety, and it is vital to aid drivers when faced with a flooded roadway.
Decision Making under Time Pressure
Drivers must process lots of information from the driving environment simultaneously to complete their driving task ( 3 ). In addition to processing these environmental stimuli, the individual driver may also be under the influence of internal and/or external demands, such as time pressure. Time pressure has been shown to change peoples’ decision-making process and strategy, and may impair their performance ( 29 , 30 ). In a driving context, this means that drivers under time pressure may make more risky decisions than those who are not under time pressure. When driving with a navigation system, real-time directions are necessary for the driver to reach their destination with minimal errors such as wrong turns. These real-time directions may induce time pressure on the driver to quickly understand their situation and act if not given enough time to decide. Flash floods create highly critical time pressure because the rapid onset of newly flooded roadways cause unexpected, urgent decision making.
Trust in Automation Systems
Trust is defined as “the attitude that an agent will help achieve an individual’s goals in a situation characterized by uncertainty and vulnerability” ( 31 ). Distrust can be considered the opposite of trust, which is the attitude that an agent will not help to achieve an individual’s goal ( 32 ). Trust in a system is necessary for users to take full advantage of all a system has to offer ( 33 , 34 ). For flood alerts that are provided by automation, the source of the information, and the accuracy and reliability of the information, may influence how users trust and react to a given warning ( 35 – 39 ). Because trust is related to system acceptance and use, it is important to study its applications in flood alert communications to design effective warnings.
Effects of Past Flood Experience and Exposure
Some drivers may be more experienced than others when it comes to floods due to the geographical location they reside in. There have been mixed findings regarding the effect of an individual’s past flood experience and exposure to floods on their flood decision making. Pearson and Hamilton found that a person’s past behavior with a flooded roadway affected their future behaviors: those who previously drove through a flooded roadway were more likely to drive through a flooded roadway again than those who had not ( 40 ). However, Drobot and colleagues found past flood experience did not influence whether a person reported if they would drive through a flooded roadway in a hypothetical scenario ( 41 ). However, Drobot and colleagues told participants there was approximately 18 in. of water on the road, while Pearson and Hamilton included water depths of 8 in. and 24 in. ( 40 ). By including a single, relatively deep-water depth in Drobot and colleagues' study, participants may have been less likely to drive through the flooded roadway, regardless of their past experience ( 41 ).
Effects of Gender
There have also been mixed findings about the influence of gender on driving through flooded roadways. Drobot and colleagues found that gender marginally influenced one of their groups regarding whether a person would drive through a flooded roadway or not: males self-reported to drive through the flood more often than females ( 41 ). However, Coles and Hirschboeck found no difference between males and females in decisions to cross a flooded roadway ( 42 ). There have also been mixed findings about how gender affects flood risk perception ( 43 , 44 ). Given these mixed findings, gender may be another influential factor in the decision-making process when a driver is faced with a flooded roadway.
Effects of Vehicle Type and Flood Depth
The risk of driving through a flooded roadway partly depends on the type of vehicle that is trying to traverse the flooded path and its ground clearance. A vehicle’s ground clearance is the distance from the ground to the bottom of the main body of the car. If water exceeds the vehicle’s ground clearance, it could damage the vehicle’s engine ( 45 ). A typical sedan has a ground clearance of 4–6 in., while a typical SUV has a clearance of 6–8 in. ( 46 ). A larger vehicle size has been found to increase a person’s likelihood of crossing a flooded roadway ( 42 ). Although the apparent safety of an SUV may seem greater than that of a sedan, the actual safety with regard to crossing a flooded roadway is only a small difference in water depth. Although the risks associated with driving through flash floods are also connected to the water's velocity and the road conditions hidden beneath the flood, the current study focused on the depth of the flood ( 25 , 47 ).
Current Study
The purpose of the current study was to investigate factors that affected road users’ understandings and actions given a flood alert, specifically a flood alert through the mobile navigation app, Waze ( 48 ). Waze recently began piloting flood alerts in Norfolk, Virginia, U.S., that let the user know their distance away from the flood, as well as the probability of the depth of the flood ( 49 ). The flood information used in Waze comes from FloodMapp, the winner of the RISE Urban Mobility Resilience Challenge, which provides real-time street-level alerts of flooded roads ( 49 ). Currently, there are not many studies that investigate flood risk communication on mobile devices with a driving scenario despite the prevalence of mobile devices. Additionally, there are not many studies that examine drivers’ decisions when provided with flood alerts and alternative routes (but see Coles and Hirschboeck) ( 42 ). The current study filled these gaps.
Experiment 1
In this experiment, participants were asked about their planned actions given one type of flood information (flood, no flood, flood of 2 in., or flood of 4 in.) in a driving scenario either with or without time pressure. We hypothesized that participants would exhibit avoidant behaviors toward the flood (i.e., not keep the same route) when they learned that there was a flood of any depth on their route when compared to the no-flood conditions. If there was no flood expected on their route, then it was acceptable to keep the same route. We also hypothesized that participants who received the deeper water depth flood alert would exhibit more avoidant behavior of not keeping the same route than those who received the shallower water depth flood alert. Finally, we predicted that participants with time pressure would drive through the flood more often than those without time pressure because drivers under time pressure may make more risky decisions.
Method
Participants
A total of 314 participants were recruited through Amazon Mechanical Turk (MTurk), an online crowdsourcing website. Eligible participants were required to live in the U.S. and to have a Human Intelligence Task (HIT) approval rating of at least 95%, meaning they had successfully completed 95% of their previous tasks. Participants were compensated $ 0.60 for taking part in this 6- minute study. The mean reported age was 37.94 years (SD = 11.14), and their mean age of obtaining a driver’s license was 19.13 years (SD = 4.04). Participants reported their gender as either male (n = 182), female (n = 128), non-binary (n = 3), or preferred not to say (n = 1).
Experimental Design
Overall, participants were tasked to go through a driving scenario with accompanying images and audios, and decide whether to drive through a potential flood. In the scenario, the mobile navigation application warned the driver of a potential flood on their route, and then gave them options to avoid it or drive through it. After their decision, the navigation system provided an alternate route and then gave them options to avoid the flood by turning or to drive through it. After this decision, participants were directed to answer questions regarding their trust in the navigation system.
There were two independent variables in this experiment, both of which used between-subjects design. The first independent variable was the type of flood information, defined by how much detail the flood alert contained. This variable had four levels, two of which communicated a binary categorization of the presence of a flood, and the other two communicated different depths of the flood (see Figure 1). For the former, the participant received a warning that either stated a flood was on their route (i.e., “There is a flood expected on your route”), or stated no expected flood was on their route (i.e., “There is no flood expected on your route”). These two levels were abstract and contained the minimum amount of information that a warning would need to communicate if there is a flood or not. For the latter, the participant received a warning that either stated a flood was on their route that is 2 in. maximum in depth (i.e., “There is a flood of 2 in. maximum expected on your route”), or stated a flood was of 4 in. maximum in depth (i.e., “There is a flood of 4 in. maximum expected on your route”). These two levels provided more detail about the flood situation in addition to the general information that there was a flood. The depths of 2 in. and 4 in. were selected because the ground clearance for a sedan vehicle is 4–6 in., meaning a sedan could drive through 2 in. of water, but may not be able to drive through 4 in. of water.
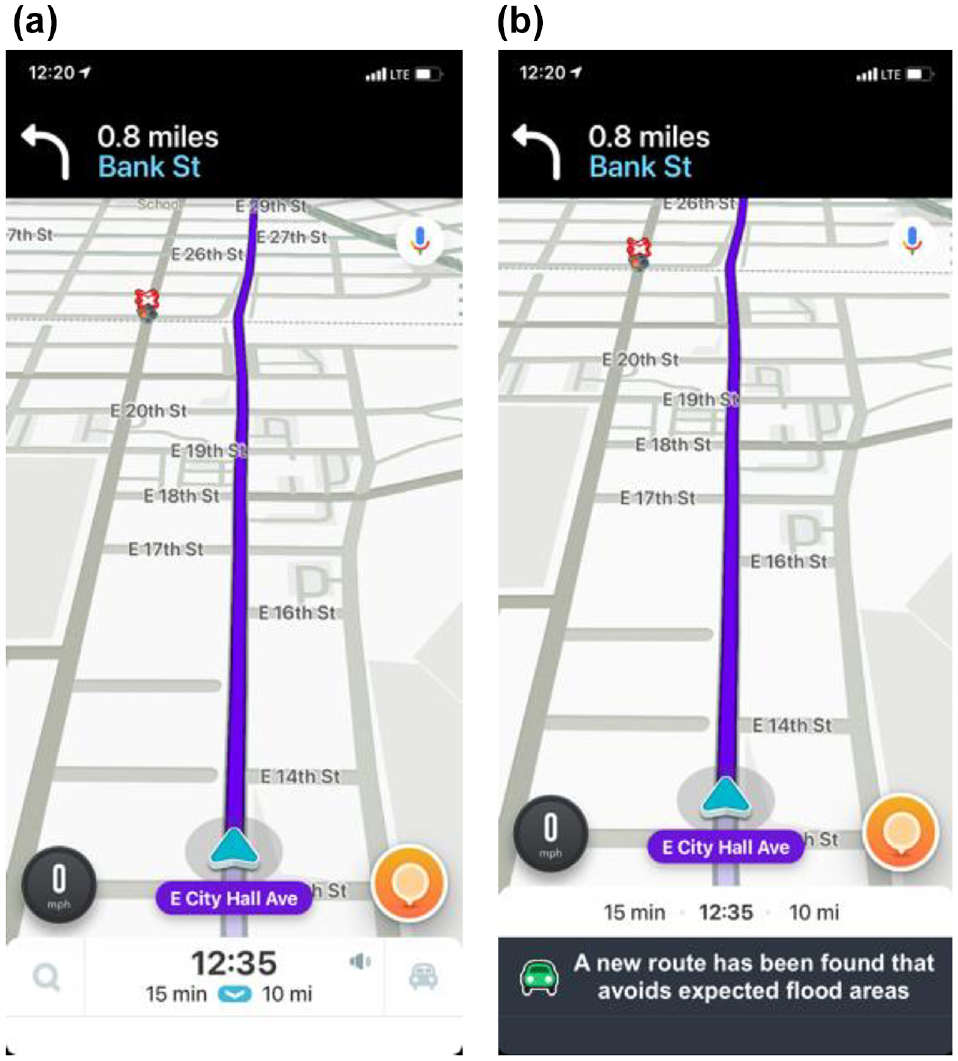
Routes shown in Waze: (a) Waze planned navigation route and (b) alternative route.
The second independent variable was the time pressure to act based on the warning given. There were two levels of time pressure (with or without). The participant either received the warning while they were driving on the road en route to their destination, with time pressure, or while still at home planning the trip a day before they departed to their destination, without time pressure.
There were three dependent variables for this study. The first was the action taken after the warning (continue with the original route, find a new route, wait for the flood to go away, go back home, stay at home, etc.). The second was the action taken after Waze’s suggestion of an alternative route, with an additional option of “accept new suggested route” in addition to the options in the previous action taken question. The third was their trust/distrust in the Waze navigation system as measured by an adapted Checklist for Trust between People and Automation from Jian and colleagues ( 32 ).
Materials and Procedure
Participants were recruited and voluntarily signed up for the study through MTurk, and then directed to complete the study through a Qualtrics survey on their own desktop or laptop computers. The participants first read and completed the consent form. The manipulation of the two independent variables led to eight unique experimental conditions, and each participant was randomly assigned to one. They were then presented with a simple auditory task (participants selected the word they heard, i.e., “chair”) to ensure that their speakers were on and could later hear the auditory warning (see Figure 2 for the procedure flow).
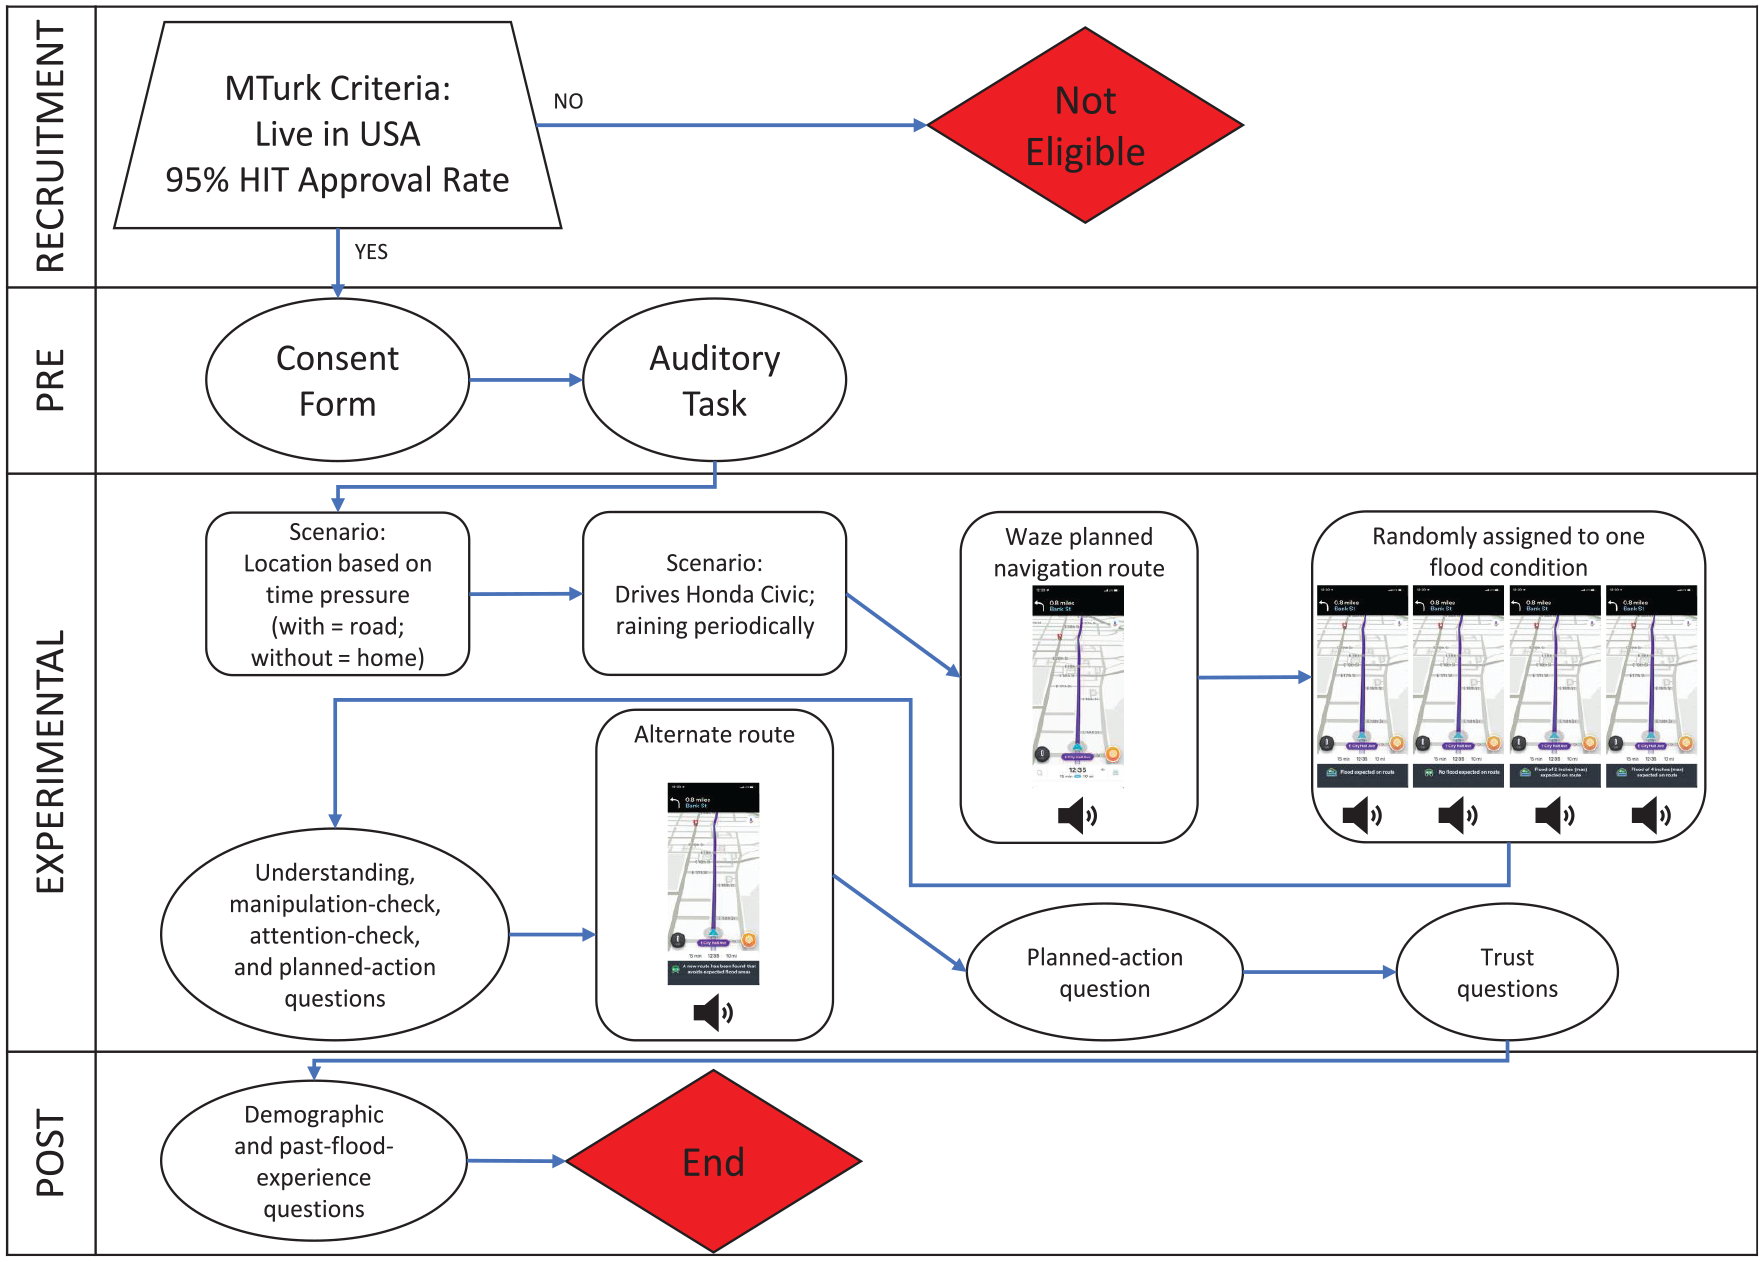
Procedure flow diagram: Experiment 1.
Participants in all experimental conditions were first told that they were either on the road or at home, depending on which time-pressure condition they were assigned to. Those with time pressure were told that they were on the road and that they were to get directions in Waze to a restaurant to pick up food. Those without time pressure were told that they were at home and they were to get directions in Waze to a restaurant to go pick up food for tomorrow. The scenario then stated that they drove a Honda Civic 4-door sedan and that it had been raining periodically for the past few days.
Images adapted from Waze (version 4.64) were included to show the route that the navigation system planned out, as well as the warning that it conveyed about the flood ( 48 ). The image that showed the planned route depicted a fictional location with fictional road names that were based on a real location (see Figure 1a). The road names were altered to avoid potential confounds introduced by the difference in familiarity of the roads. Additionally, the images that showed the flood alert were created based on other warnings given by Waze (e.g., railroad crossing) because Waze did not produce notifications of flood alerts at the time of the study (spring 2021).
Once Waze mapped the route (see Figure 1a), visual and auditory warnings were presented to communicate the flood situation and possibly the depth of the flood water, depending on the condition to which they were assigned (see Figure 3 for the visual warning). All of the auditory warnings were derived from Voicemaker.in (version Beta), an online text-to-speech (TTS) voice that reads entered text using a synthesized voice (Joanna; English, U.S.; standard TTS; no special effects). The auditory warning was 1.56 s in duration for the flood scenario, 2.02 s for the no-flood scenario, 3.14 s for the flood-of-2-in. scenario, and 3.08 s for the flood-of-4-in. scenario.
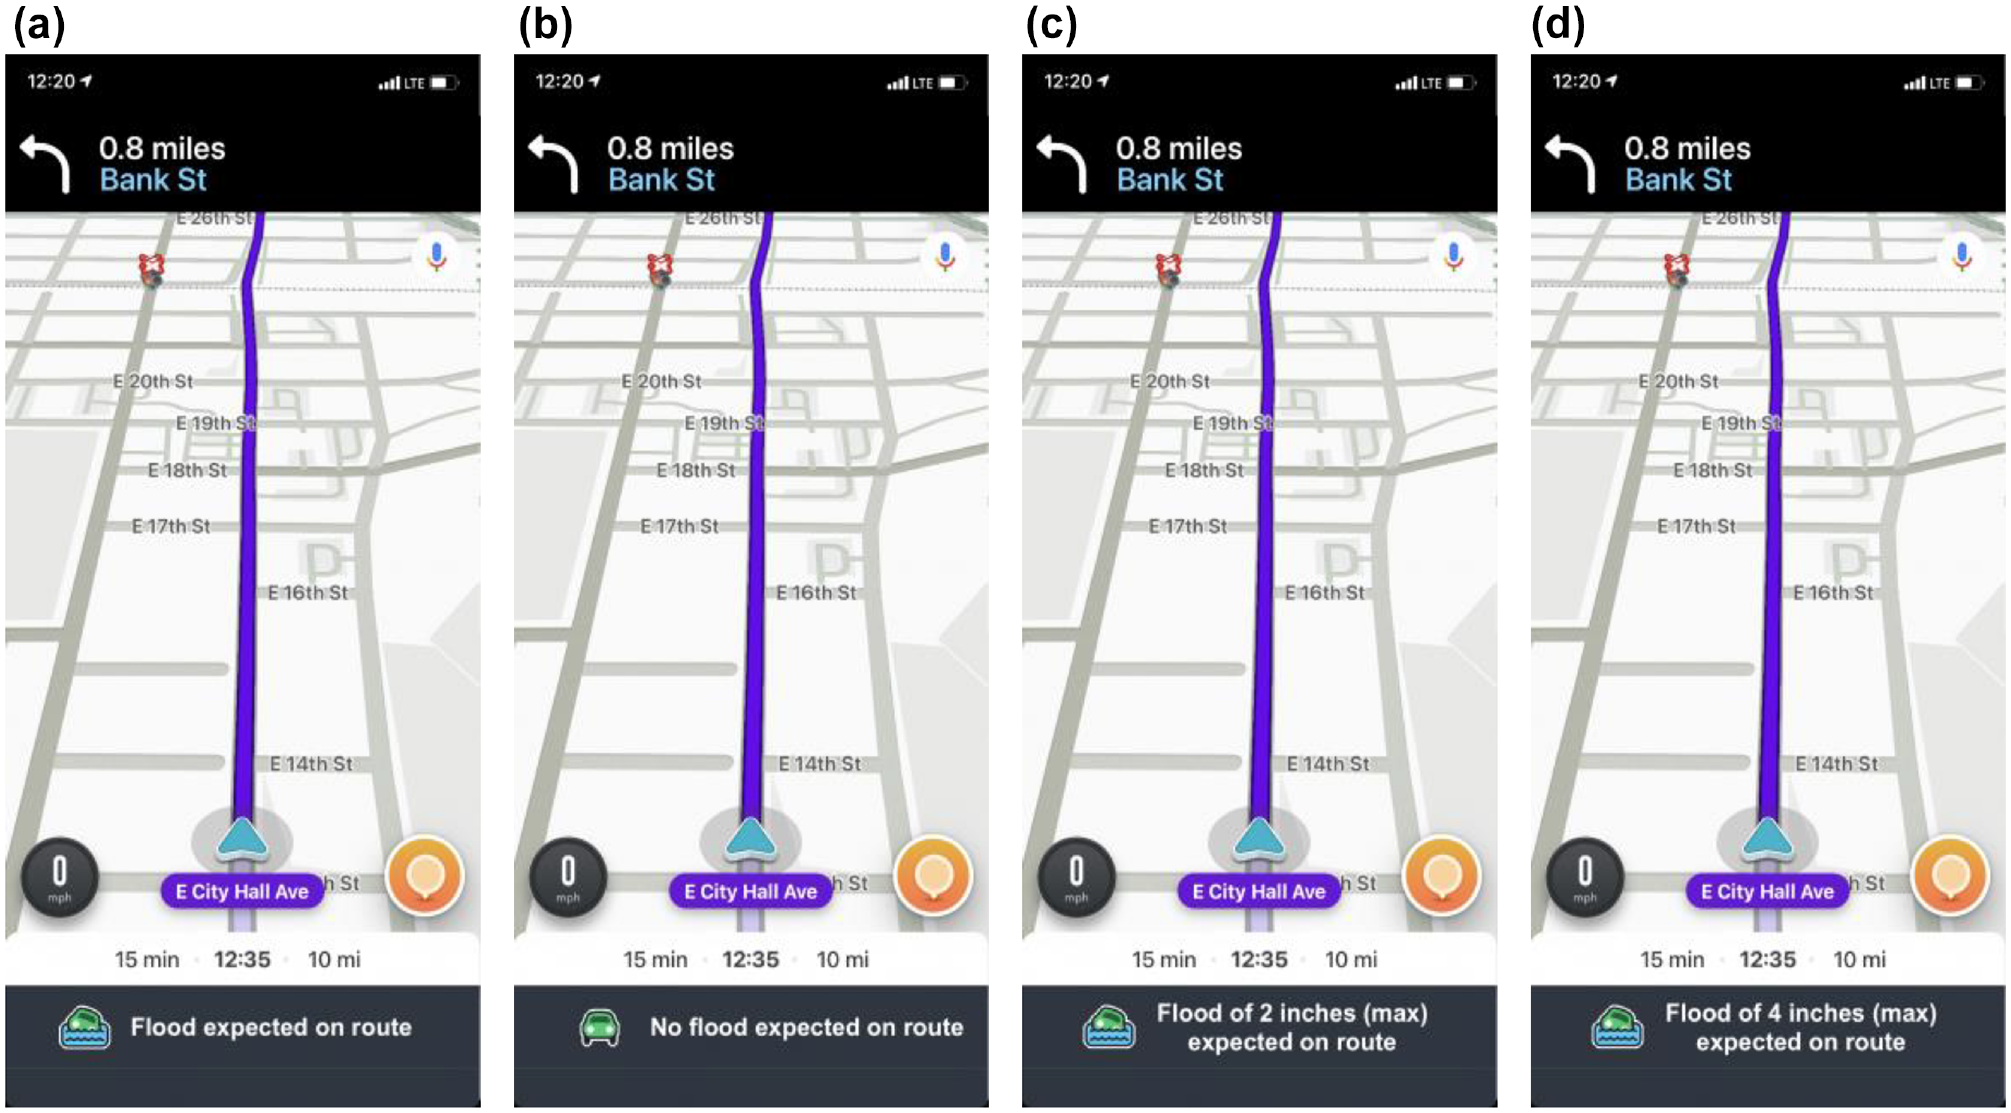
Waze flood alerts: (a) flood, (b) no flood, (c) flood of 2 in., and (d) flood of 4 in.
After the visual and auditory warnings were presented, participants answered four understanding questions testing their understanding of the situation, including where they were located in the scenario, what kind of vehicle they drove, the nature of the flood situation, and the depth of the flood water. Following these understanding questions, they answered manipulation-check questions, such as how important the depth of the flood water is and how urgently they must decide what to do. They then answered a multiple-choice planned-action question about what they plan to do in their situation. Lastly, they answered three more manipulation-check questions for time pressure, such as if they felt they had enough time to decide, if they wished they had more time, or if the time impacted their decision.
In addition, an attention-check question was embedded within the understanding questions. The purpose of this attention check was to ensure the participants were paying attention and reading the questions. The attention check stated, “Based on the scenario, where are you planning on going? For this question, answer nowhere.” If participants did not select the answer nowhere, it indicated that they were not paying enough attention during the study, and their data were excluded from the data analyses.
Once they answered all of the above questions, the participant was told that the navigation system had found an alternative route. This was presented with an image from Waze with an alert that a new route had been found that avoided the expected flood areas (see Figure 1b), along with an auditory alert. The auditory alert lasted 3.14 s. Participants were again asked a planned-action question, now including the new option of accepting the new route that the system suggested for them.
Lastly, participants answered their agreement to seven trust questions on a scale of 0 (not at all) to 7 (extremely) to measure their trust in the navigation system, and five questions measuring their distrust in the navigation system on the same scale ( 32 ). Participants then answered several demographic questions as well as questions about their past flood experience, how often they drive in a typical year, and their exposure to floods ( 50 ). They were then given a unique code to enter into MTurk to receive compensation (see Appendix).
Results
A total of 95 participants (30.25% of the total) missed the attention check and were excluded from the data analyses. Of the remaining 219, the mean reported age was 38.42 years (SD = 11.77). Participants reported their gender as either male (n = 116), female (n = 100), or non-binary (n = 3). More details about participants’ demographics are in Table 1. Only 218 participants responded for the age at which they obtained their license (M = 18.67, SD = 3.64), while all 219 responded for the other three sections in Table 1. For the GPS apps used, participants were able to select multiple apps.
Demographic Information of Participants in Experiment 1 Who Passed Attention Check
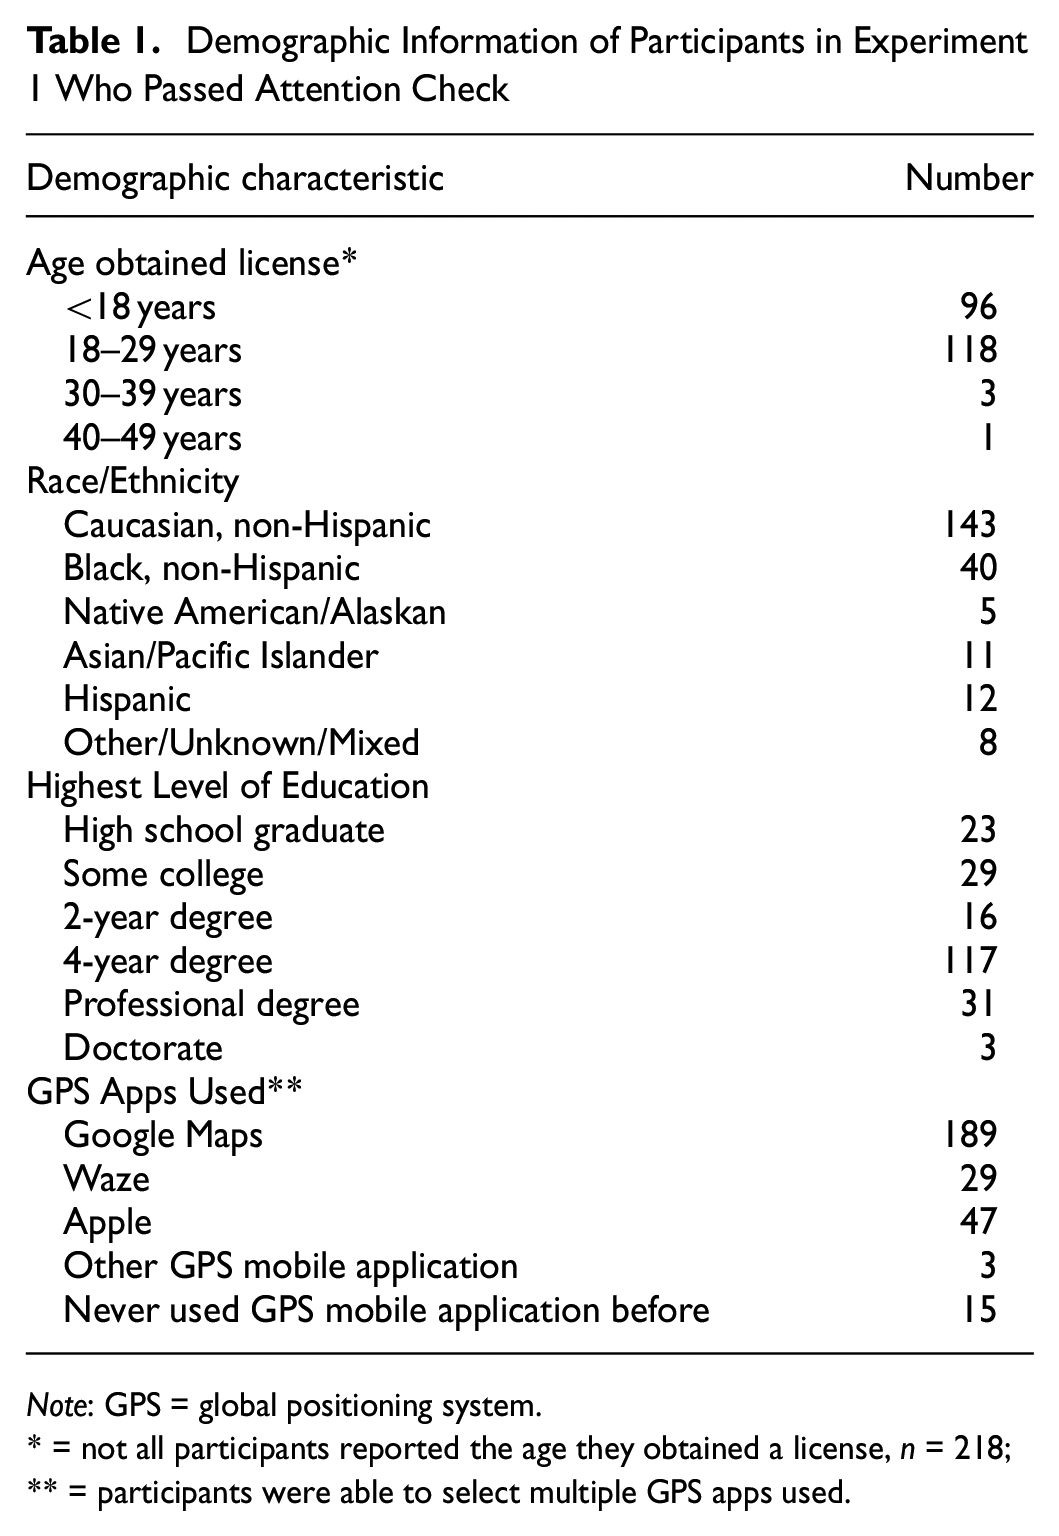
Note: GPS = global positioning system.
* = not all participants reported the age they obtained a license, n = 218; ** = participants were able to select multiple GPS apps used.
Manipulation Checks
For the manipulation check of time pressure, the questions were averaged to create one urgency score from a scale of 1 (little urgency felt) to 5 (lot of urgency felt). An analysis of variance (ANOVA) was conducted on this urgency score based on flood information type and time pressure. Levene’s test was significant, indicating that there were unequal error variances, F(7, 211) = 2.99, p = .005. The analysis found that time pressure did not significantly affect the urgency to decide F(1, 211) = 1.41, p = .236, ηp2 < .01, however, the flood information type did, F(3, 211) = 8.00, p < .001, ηp2 = .10. There was a significantly lower sense of urgency for the no-flood condition (M = 2.09, SD = 0.94) than the flood (M = 2.85, SD = 0.94), flood-of-2-in. (M = 2.72, SD = 0.94), and flood-of-4-in. condition (M = 2.74, SD = 0.94), ps < .003.
Action Taken Following the Warning
For the question on what they plan to do in their situation following the warning, participants’ answers were coded binarily. If participants kept the original route, this would mean that they would potentially drive through the flooded roadway, a risky decision (coded as 1). All other options, such as finding a new route or waiting for the flood to go away, represented risk-avoidant decisions (coded as 0). Logistic regression analyses were conducted on these coded actions taken with the type of flood information and time pressure as predictors, and past flood experience, frequency of driving, and gender as covariates.
The logistic regression model was statistically significant χ2(9, N = 219) = 92.92, p < .001. The full model explained 48.40% (Nagelkerke R 2 ) of the variance in the action taken after the warning and correctly classified 81.74% of the actions. (See Table 2 for the logistic regression results and Figure 4 for the percentage of participants that kept the original route by flood information and time pressure.) Using the no-flood-information group as the reference group, the inverted odds ratio indicated that, when holding the covariates constant, the odds of participants keeping the original route in the no-flood condition (M = 74.14%, SD = 44.17%) was 103.09 times higher than the yes-flood condition (M = 3.92%, SD = 19.60%), 15.36 times higher than the flood-of-2-in. condition (M = 20.37%, SD = 40.65%), and 11.70 times higher than the flood-of-4-in. condition (M = 25.00%, SD = 43.69%), ps < .001. Past flood experience was a significant covariate in the model, p = .003. Increasing past flood experience was associated with more participants displaying risk-avoidant actions. Time pressure, frequency of driving, and gender were not significant predictors in the model, ps > .05.
Logistic Regression Predicting Action Taken after the Warning, with “No-Flood” and “Without-Time-Pressure” Conditions as Reference Groups (Experiment 1)
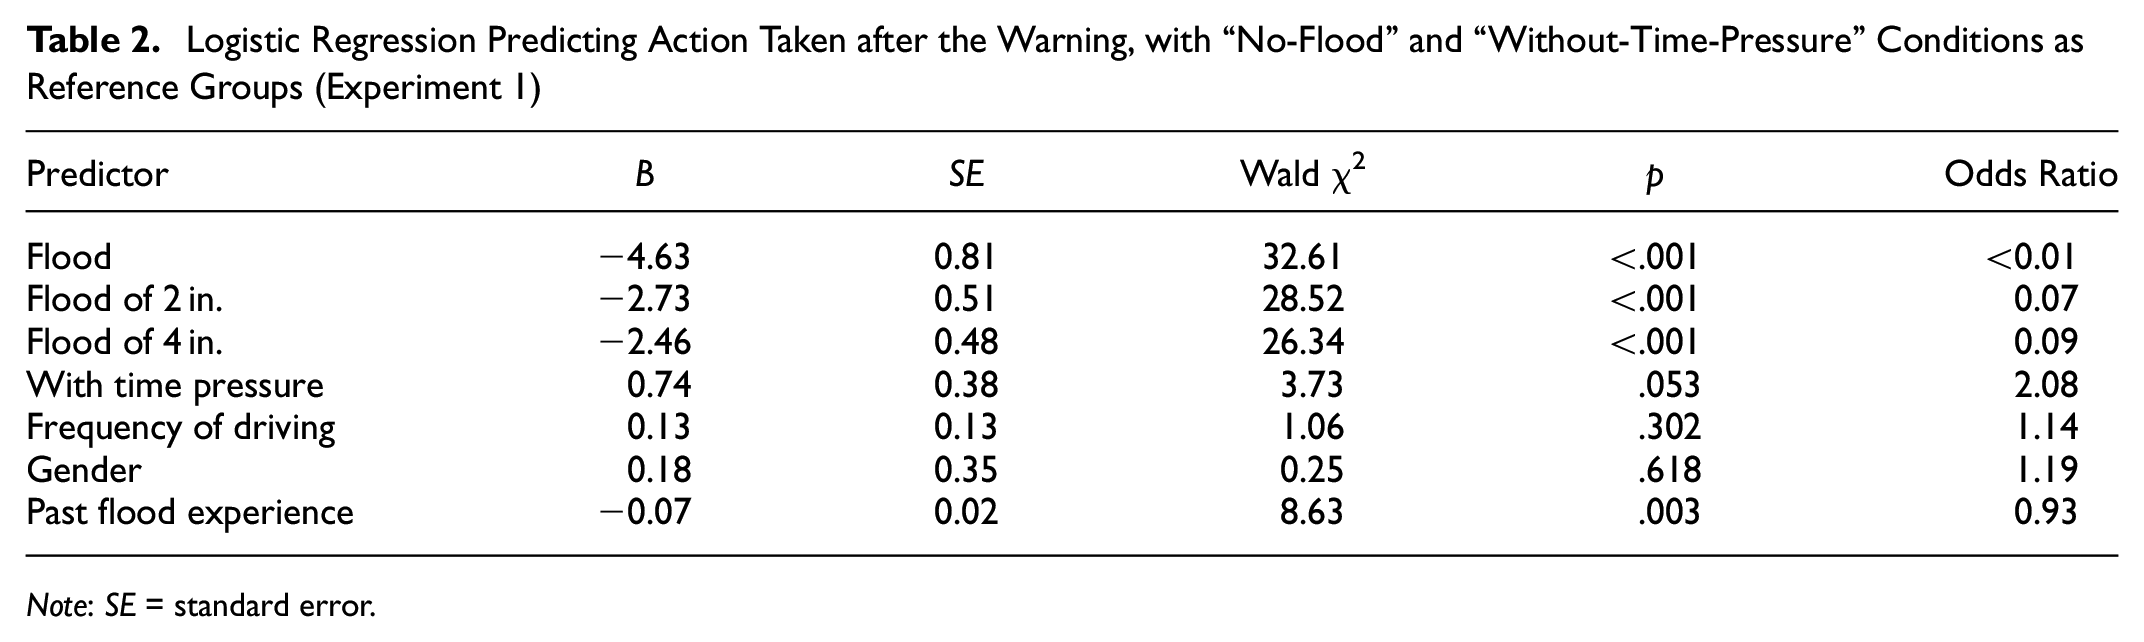
Note: SE = standard error.
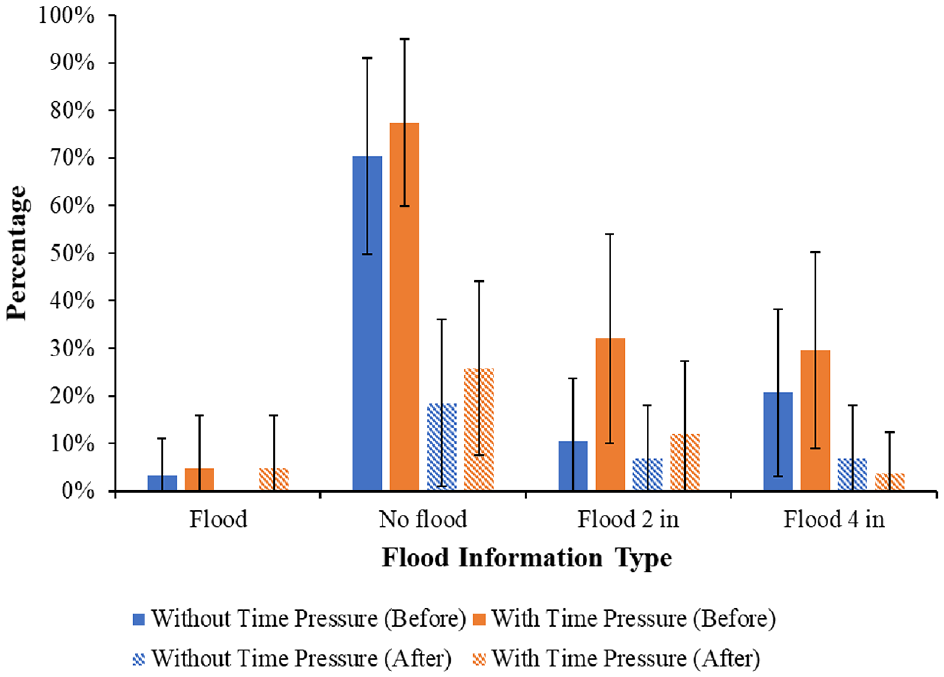
Percentage of participants who kept the original route following the warning and after the alternative route by time pressure and flood information type: Experiment 1.
To test the effects of including more detailed flood alerts, another logistic regression was performed with the same model but with the yes-flood condition as the reference group along with the without-time-pressure condition as the same reference group as before. The odds ratio indicated that, when controlling the covariates, the odds of participants keeping the original route for the yes-flood condition (M = 3.92%) was 6.69 times lower than the flood-of-2-in. condition (M = 20.37%), Wald χ2 = 5.54, p = .019, and 8.79 times lower than the flood-of-4-in. condition (M = 25.00%), Wald χ2 = 7.53, p = .006. The comparison between the flood-of-2-in. and flood-of-4-in. conditions was not significant, p = .568.
Action Taken Following the Alternative Route
After participants responded to what they planned to do in their situation after receiving the warning, they were then presented with an alternative route and were again asked what they plan to do in their situation, but now with the additional option of accepting the alternative route. The logistic regression model was statistically significant χ2(7, N = 219) = 16.87, p = .018. The full model explained 15.47% (Nagelkerke R2) of the variance in the action taken after the warning and correctly classified 89.95% of the actions. Using the no-flood-information type and without-time-pressure group as the reference groups, the inverted odds ratio indicated that, when holding the covariates constant, the odds of participants keeping the original route for the no-flood condition (M = 22.41%, SD = 42.07%) was 13.89 times higher than the yes-flood condition (M = 1.96%, SD = 14.00%), 2.51 times higher than the flood of 2 in. condition (M = 9.26%, SD = 29.26%), and 5.07 times higher than the flood-of-4-in. condition (M = 5.36%, SD = 22.72%. Only the comparison between the no-flood and the yes-flood and that between the no-flood and the flood-of-4-in. conditions were statistically significant (see Table 3 and Figure 4). Time pressure, past flood experience, frequency of driving, and gender were not significant predictors in the model.
Logistic Regression Predicting Action Taken after the Alternative Route, with “No-Flood” and “Without-Time-Pressure” Conditions as Reference Groups
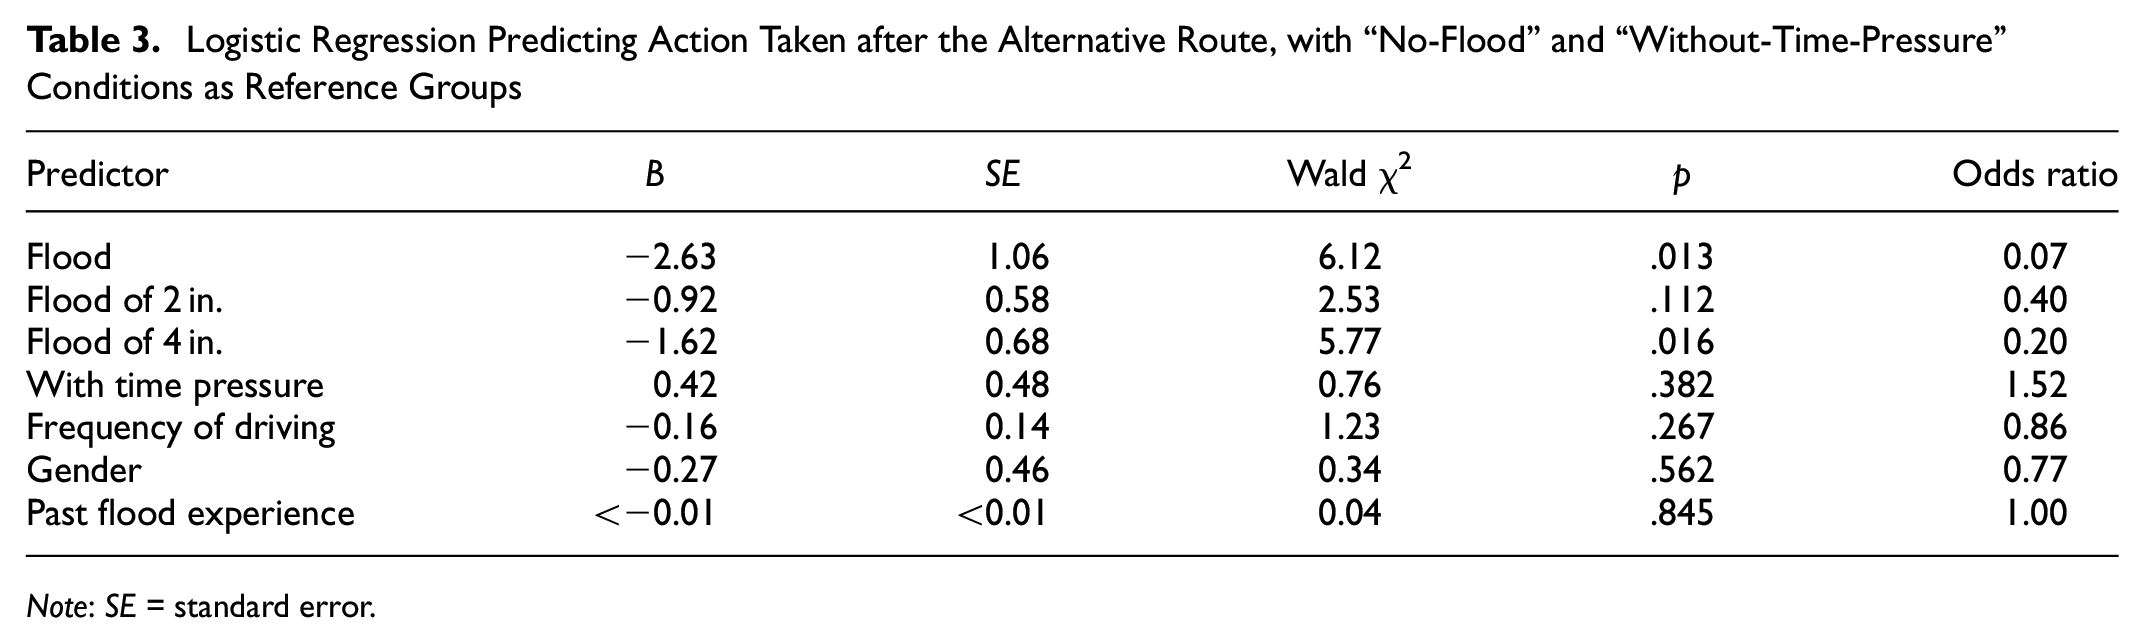
Note: SE = standard error.
Several exact McNemar’s tests were conducted to compare the planned actions following the warning (before the alternative route) and the actions after the alternative route was given. Overall, there was a significantly greater proportion of those who kept the original route directly after the warning was presented (M = 31.96%, SD = 46.74%) than those after the alternative route was presented (M = 10.05%, SD = 30.13%), p < .001 (see Figure 4). Participants kept the original route before the alternative route significantly more often than after the alternative route for all subgroups except for without time pressure and flood of 2 in., with time pressure and flood, with time pressure and flood of 2 in., and flood, p < .05 (see Table 4).
McNemar Test Results and Descriptive Statistics
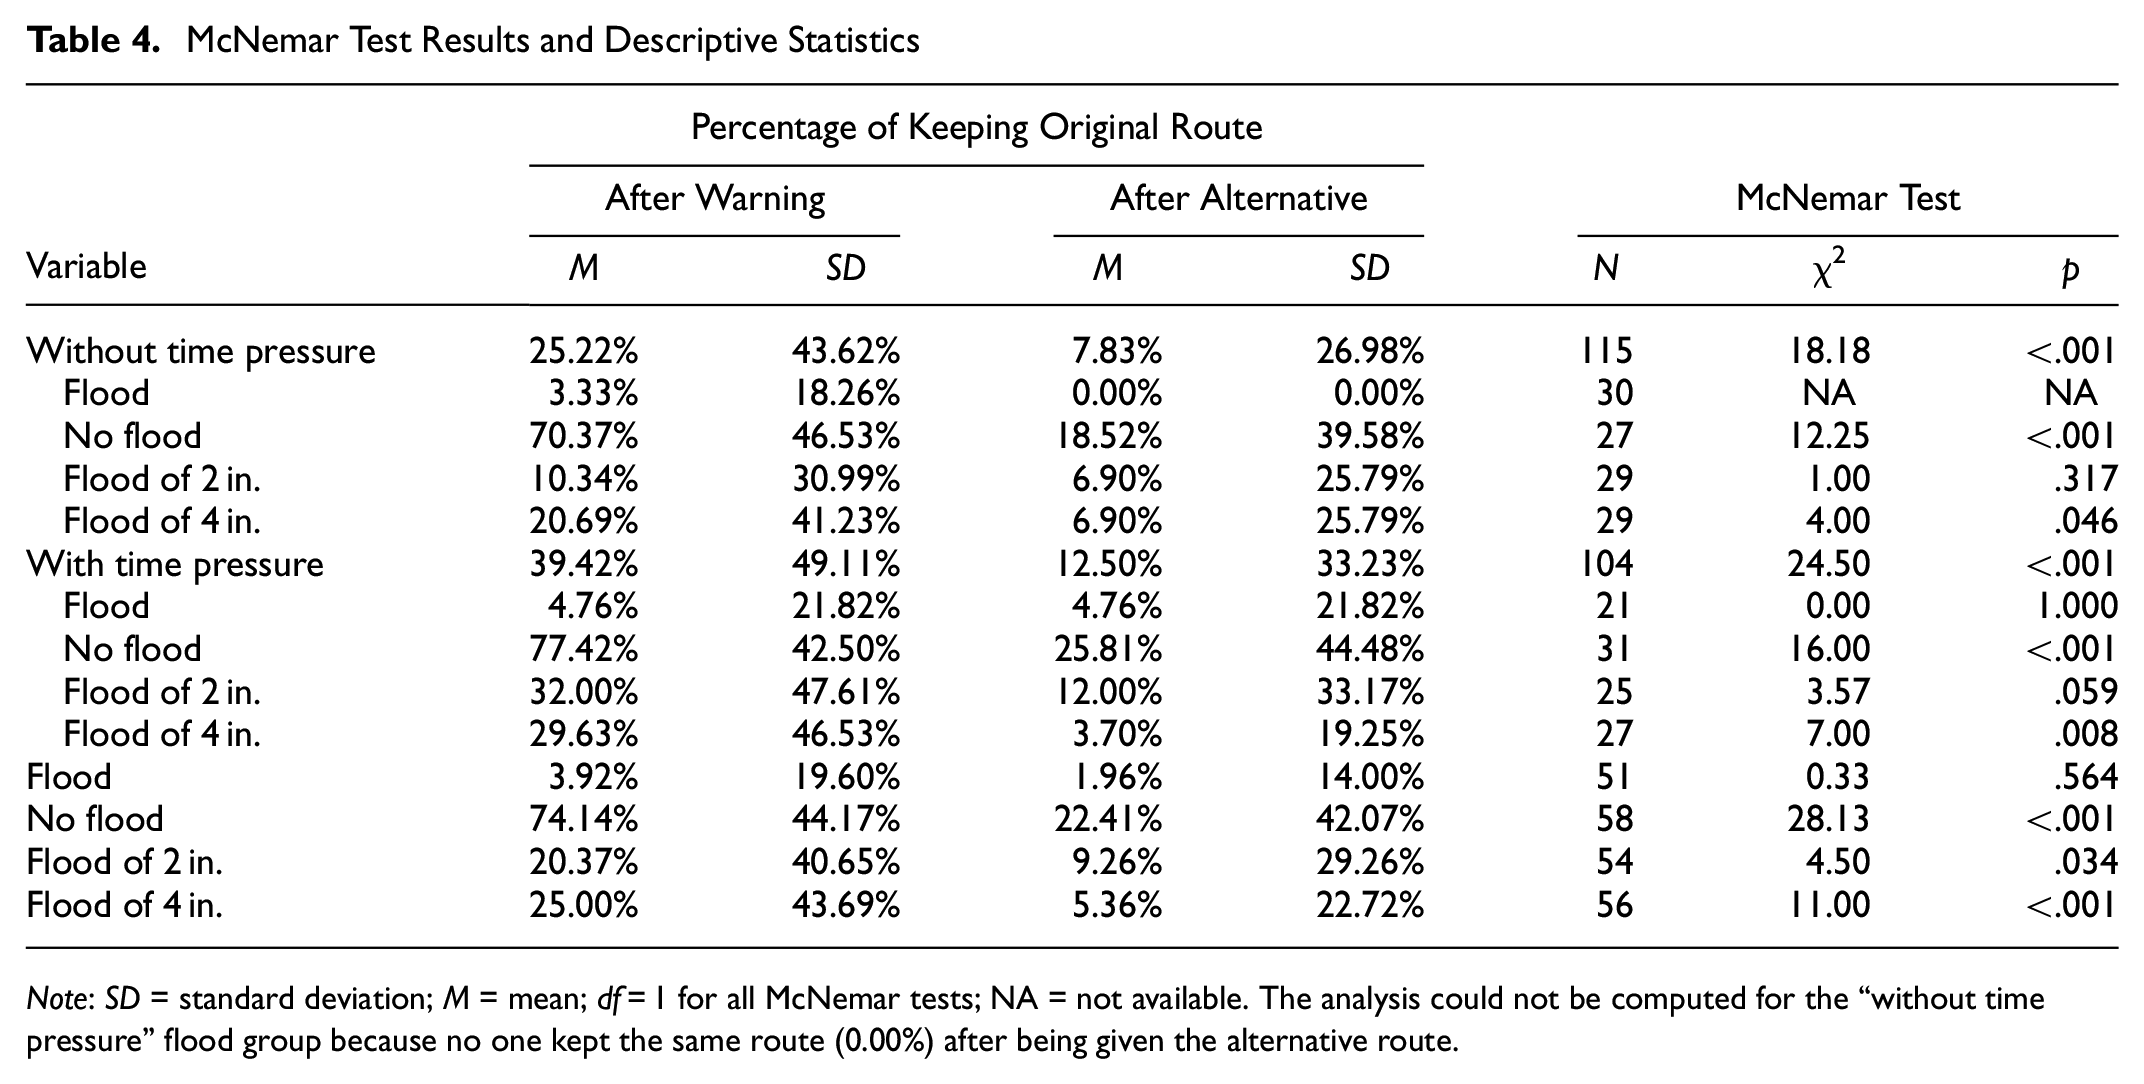
Note: SD = standard deviation; M = mean; df = 1 for all McNemar tests; NA = not available. The analysis could not be computed for the “without time pressure” flood group because no one kept the same route (0.00%) after being given the alternative route.
Trust
A single trust score was compiled by averaging the ratings from the seven questions measuring trust and reverse coding the five questions measuring distrust. An analysis of covariance (ANCOVA) was conducted with the trust in the navigation system based on the type of flood information and time pressure, controlling for how often it floods in their current location, how often it has flooded in previous locations they have lived at, frequency of driving, gender, primary mode of transportation, and past flood experience. The ANCOVA revealed that, after controlling for all six covariates, there was no significant difference in trust based on flood information type nor based on time pressure, ps > .05. The covariate of frequency of driving was a significant predictor of trust, F(1, 205) = 10.41, p = .001, ηp2 = .05. People who drove daily (M = 5.16, SD = 1.12) had significantly higher trust in the navigation system than those who drove once a month (M = 3.86, SD = 1.09), t(200) = 3.21, p = .033. No other effects between trust and covariates were significant, ps > .05.
Discussion
Manipulation Checks
From the manipulation checks, it seems that the flood information type had a significant effect on manipulation-check questions that were intended for the time pressure. This may be because there is less urgency to act and the importance of time is lost when there is no flood expected ahead, compared to when there is a flood expected of any depth. However, the time-pressure manipulation check did not have any significant effects. This may be because of the presentation method—a written description of the scenario—used in this study. It may also be due to a lack of urgency within the food-pick-up premise.
Actions Taken
Our first hypothesis, that participants would exhibit avoidant behaviors by not keeping the original route after the warning in the flood conditions compared to the no-flood condition, was confirmed. This indicates that participants engaged in risk-avoidant behaviors when they were warned of an expected flood on their route. Drivers’ perceived risk was most likely lower in the no-flood condition than in the flood conditions, which is an influential factor in their decisions to drive through a flood ( 51 ). Similarly, participants showed more avoidant behaviors in the general-flood and flood-of-4-in. conditions compared to the no-flood condition after the alternative route was presented. However, this trend was not seen in the flood-of-2-in. condition when compared to the no-flood condition. A possible reason for this is that even though those in the no-flood condition were able to keep the original route without any repercussions, offering the alternative route was attractive and an easy option to take. Changing routes when driving is a common flood-avoidance strategy ( 52 , 53 ). Those in the no-flood condition displayed more avoidant behaviors after the alternative route was presented, similarly to those in the flood-of-2-in. condition. Additionally, it is possible that the risk of driving through 2 in. of water was so low that it was similar to the no-flood condition.
Our hypothesis that participants in the flood-of-4-in. condition would exhibit more avoidant behavior than those in the flood-of-2-in. condition was not supported by the data. This result is inconsistent with what Pearson and Hamilton found, which may be because of the depth of the flood waters used or the difference in the depth of the flood waters ( 40 ). We used 2 in. and 4 in., while they used 20 cm (7.9 in.) and 60 cm (23.6 in.). It is likely that participants perceived both 2 in. and 4 in. floods to be shallow enough to drive through.
Moreover, participants in the flood condition were less likely to keep the original route directly after the warning when compared to the flood-of-2-in. and the flood-of-4-in. conditions. This means that participants engaged in more risk-avoidant behaviors when they were informed that there was flood but the depth of the flood waters was unknown. When simply stating that there is a flood, the message contains uncertainty as to how deep the flood is (e.g., it could be 2 in., 4 in., or deeper than 4 in.). These results show the ambiguity effect, which is a cognitive bias that describes how people avoid options that are ambiguous ( 54 ). Thus, it is reasonable that drivers tend to drive through the flood less often when the depth of the flood is not specified than when it is specified at 2-in. and 4-in. levels. However, this trend was not seen after the alternative route was presented, possibly because the option of an alternative route is very appealing to drivers, which can be seen by the significant increase in risk-avoidant behaviors after the alternative route was presented for the flood-of-2-in. and 4-in. conditions.
Our hypothesis that participants in the with-time-pressure condition would keep the same route more often than those in the without-time-pressure condition was not supported by the logistic regressions. The nonsignificant results involving time pressure can be attributed to the lack of effectiveness of time-pressure manipulation discussed earlier. Another possibility for why time pressure did not have a significant effect after the alternative route was presented could be that adding in the alternative route increased risk-avoidant behaviors overall. Specifically, within both conditions for time pressure, there was a significant increase in risk-avoidant behaviors from before the alternative route was presented and after. However, it was those with time pressure who had a larger increase in this behavior (26.92%) compared to those without time pressure (17.39%). It seems that the alternative route was more appealing for those with time pressure than those without.
Including the alternative route helped participants engage in more risk-avoidant behaviors. It seemed that including an alternative route was most effective for the no-flood and flood-of-4-in. conditions. Those in the flood-of-4-in. condition had very a similar proportion of those who kept the same route after the alternative route was presented (5.36%) compared to the flood-of-2-in. condition (9.26%). Including an alternative route was also effective for both time pressure conditions. Providing the alternative route can be viewed as a “nudge,” which is “any aspect of the choice architecture that alters people’s behavior in a predictable way without forbidding any option or significantly changing their economic incentive” ( 55 ). The alternative route nudges the driver toward accepting the option while still allowing them freedom of choice. Additionally, the participants may have accepted the alternative route because of previous familiarity with their own navigation system, displaying the mere exposure effect ( 36 ). Overall, it seemed that including a risk-avoidant alternative helped the drivers make safe decisions more easily, possibly because it was readily available to them to choose.
Past flood experience, frequency of driving, and gender were all covariates that were added to the models for both before and after the alternative route was presented. Only past flood experience was a significant predictor for the actions taken before the alternative route, supporting the findings by Pearson and Hamilton ( 40 ). However, after the alternative route, none of these covariates were significant predictors of the model. This may mean that including the alternative route is such an attractive action to everyone, and that it does not matter if people have driven through floods in the past or not.
Trust
The results from analyzing trust indicate that neither the flood information type nor time pressure influenced the amount of trust or distrust participants had in the navigation system. This may be because the actual system was the same throughout each condition. Participants may not relate the warning message to influence trust or distrust, or external factors such as time pressure, to their impressions of the navigation system. Several covariates were added into the analysis; however, the only covariate that was a significant predictor of trust was how frequently they drove. This may be related to the amount of exposure the participant has had to a mobile navigation system. The more often someone drives, the more likely it is that they have used a navigation system before, so they have more-developed notions about it. More experience with a system can lead to appropriately calibrated trust ( 31 , 33 ). This may show a transfer of trust from the participant’s navigation system to the one used in the study, since the images were modeled after Waze ( 48 ).
Limitations
One limitation of the study is that there was a limited number of flood depths manipulated. We only had 2 in. or 4 in. of flood depth, which is much shallower than what Pearson and Hamilton used ( 40 ). They included depths that were roughly 8 in. and 24 in. Additionally, most sedan vehicles have a ground clearance of 4–6 in. ( 46 ). Technically, driving through a flood of 2 in. would be fine, since there is little risk of it causing damage to the vehicle. However, at 4 in. of depth, there is a greater risk from driving through the flooded roadway, since it may cause the vehicle to stall, stranding the driver in a flooded roadway ( 45 ). Experiment 2 includes greater depths of flood water to see if participants know the risks of driving through deeper water, as well as more questions about the perceived depths and the ability of vehicles.
Another limitation is that we never asked what the participants thought the depth was for the flood scenarios. This is especially important for the general yes-flood conditions, which had the highest risk-avoidant behaviors of the four conditions. Experiment 2 also includes questions about what participants believe the depth is for the flood condition where no specific depth is stated. This may provide insight into why it had the most risk-avoidant behaviors compared to the conditions that did state the depth of the flood waters.
This experiment found that the covariate of past flood experience was only a significant predictor of actions before the alternative route was presented. This points to the importance of including an alternative route. However, it is important to look into this variable in Experiment 2 to see if its significance holds.
Lastly, it is possible that the scenario used to manipulate time pressure was not urgent enough. This would explain why there was no significant measurable difference based on time pressure as well as for the manipulation check. For example, picking up food is not as urgent as if someone were driving to the hospital.
Experiment 2
Experiment 2 was similar to Experiment 1, except in four distinct ways. First, Experiment 2 only had participants respond once what their planned actions were. Second, questions were added about the depth of the flood and how capable different vehicles were at traversing them. Third, a revised understanding question was included to ask participants what they think the depth of the flood was, which is especially important for the general flood condition where no specific flood depth is stated. Lastly, more flood depths (6 in. and 8 in.) were included in the flood conditions that would exceed the ground clearance for a sedan vehicle. We hypothesized the three same hypotheses as in Experiment 1.
Method
Participants
A total of 330 participants were recruited through Amazon MTurk. In addition to the eligibility requirements in Experiment 1, participants were required to have a driver’s license, have normal or corrected-to-normal vision, be between the ages of 18 and 65 years, and have not participated in Experiment 1. Participants were compensated the same as in Experiment 1. The mean reported age was 37.54 years (SD = 10.46). Participants reported their gender as either male (n = 186), female (n = 139), or preferred not to say (n = 5). The data was collected in two batches. The first data collection period was for all of the flood-information conditions. The second data collection period was for only the flood-of-4-in. flood information type because there were less valid data from that flood information type than the others.
Experimental Design
This experiment used a 2 × 6 between-subjects factorial design. Two additional conditions were added to the flood information variable from the prior study (flood of 6 in. and flood of 8 in.), resulting in a total of six flood alert types (four conditions that relayed the depth of the flood in the warning and two that conveyed a binary categorization of if a flood was present). The second independent variable of time pressure was manipulated in the same manner as in the previous study. There were two dependent variables for this study—the action taken after the warning was presented, and their trust in Waze.
Materials and Procedures
Participants were recruited through MTurk and randomly presented one of the 12 scenario conditions through Qualtrics, similar to Experiment 1. The study followed a similar procedure to Experiment 1 with new visual and auditory warnings conveying the flood situation in their scenario (see Figure 5). The same auditory warnings from the previous study were used again, with the addition of the flood of 6 in. warning that lasted 3.12 s in duration, and the flood of 8 in. warning that lasted 3.11 s in duration.
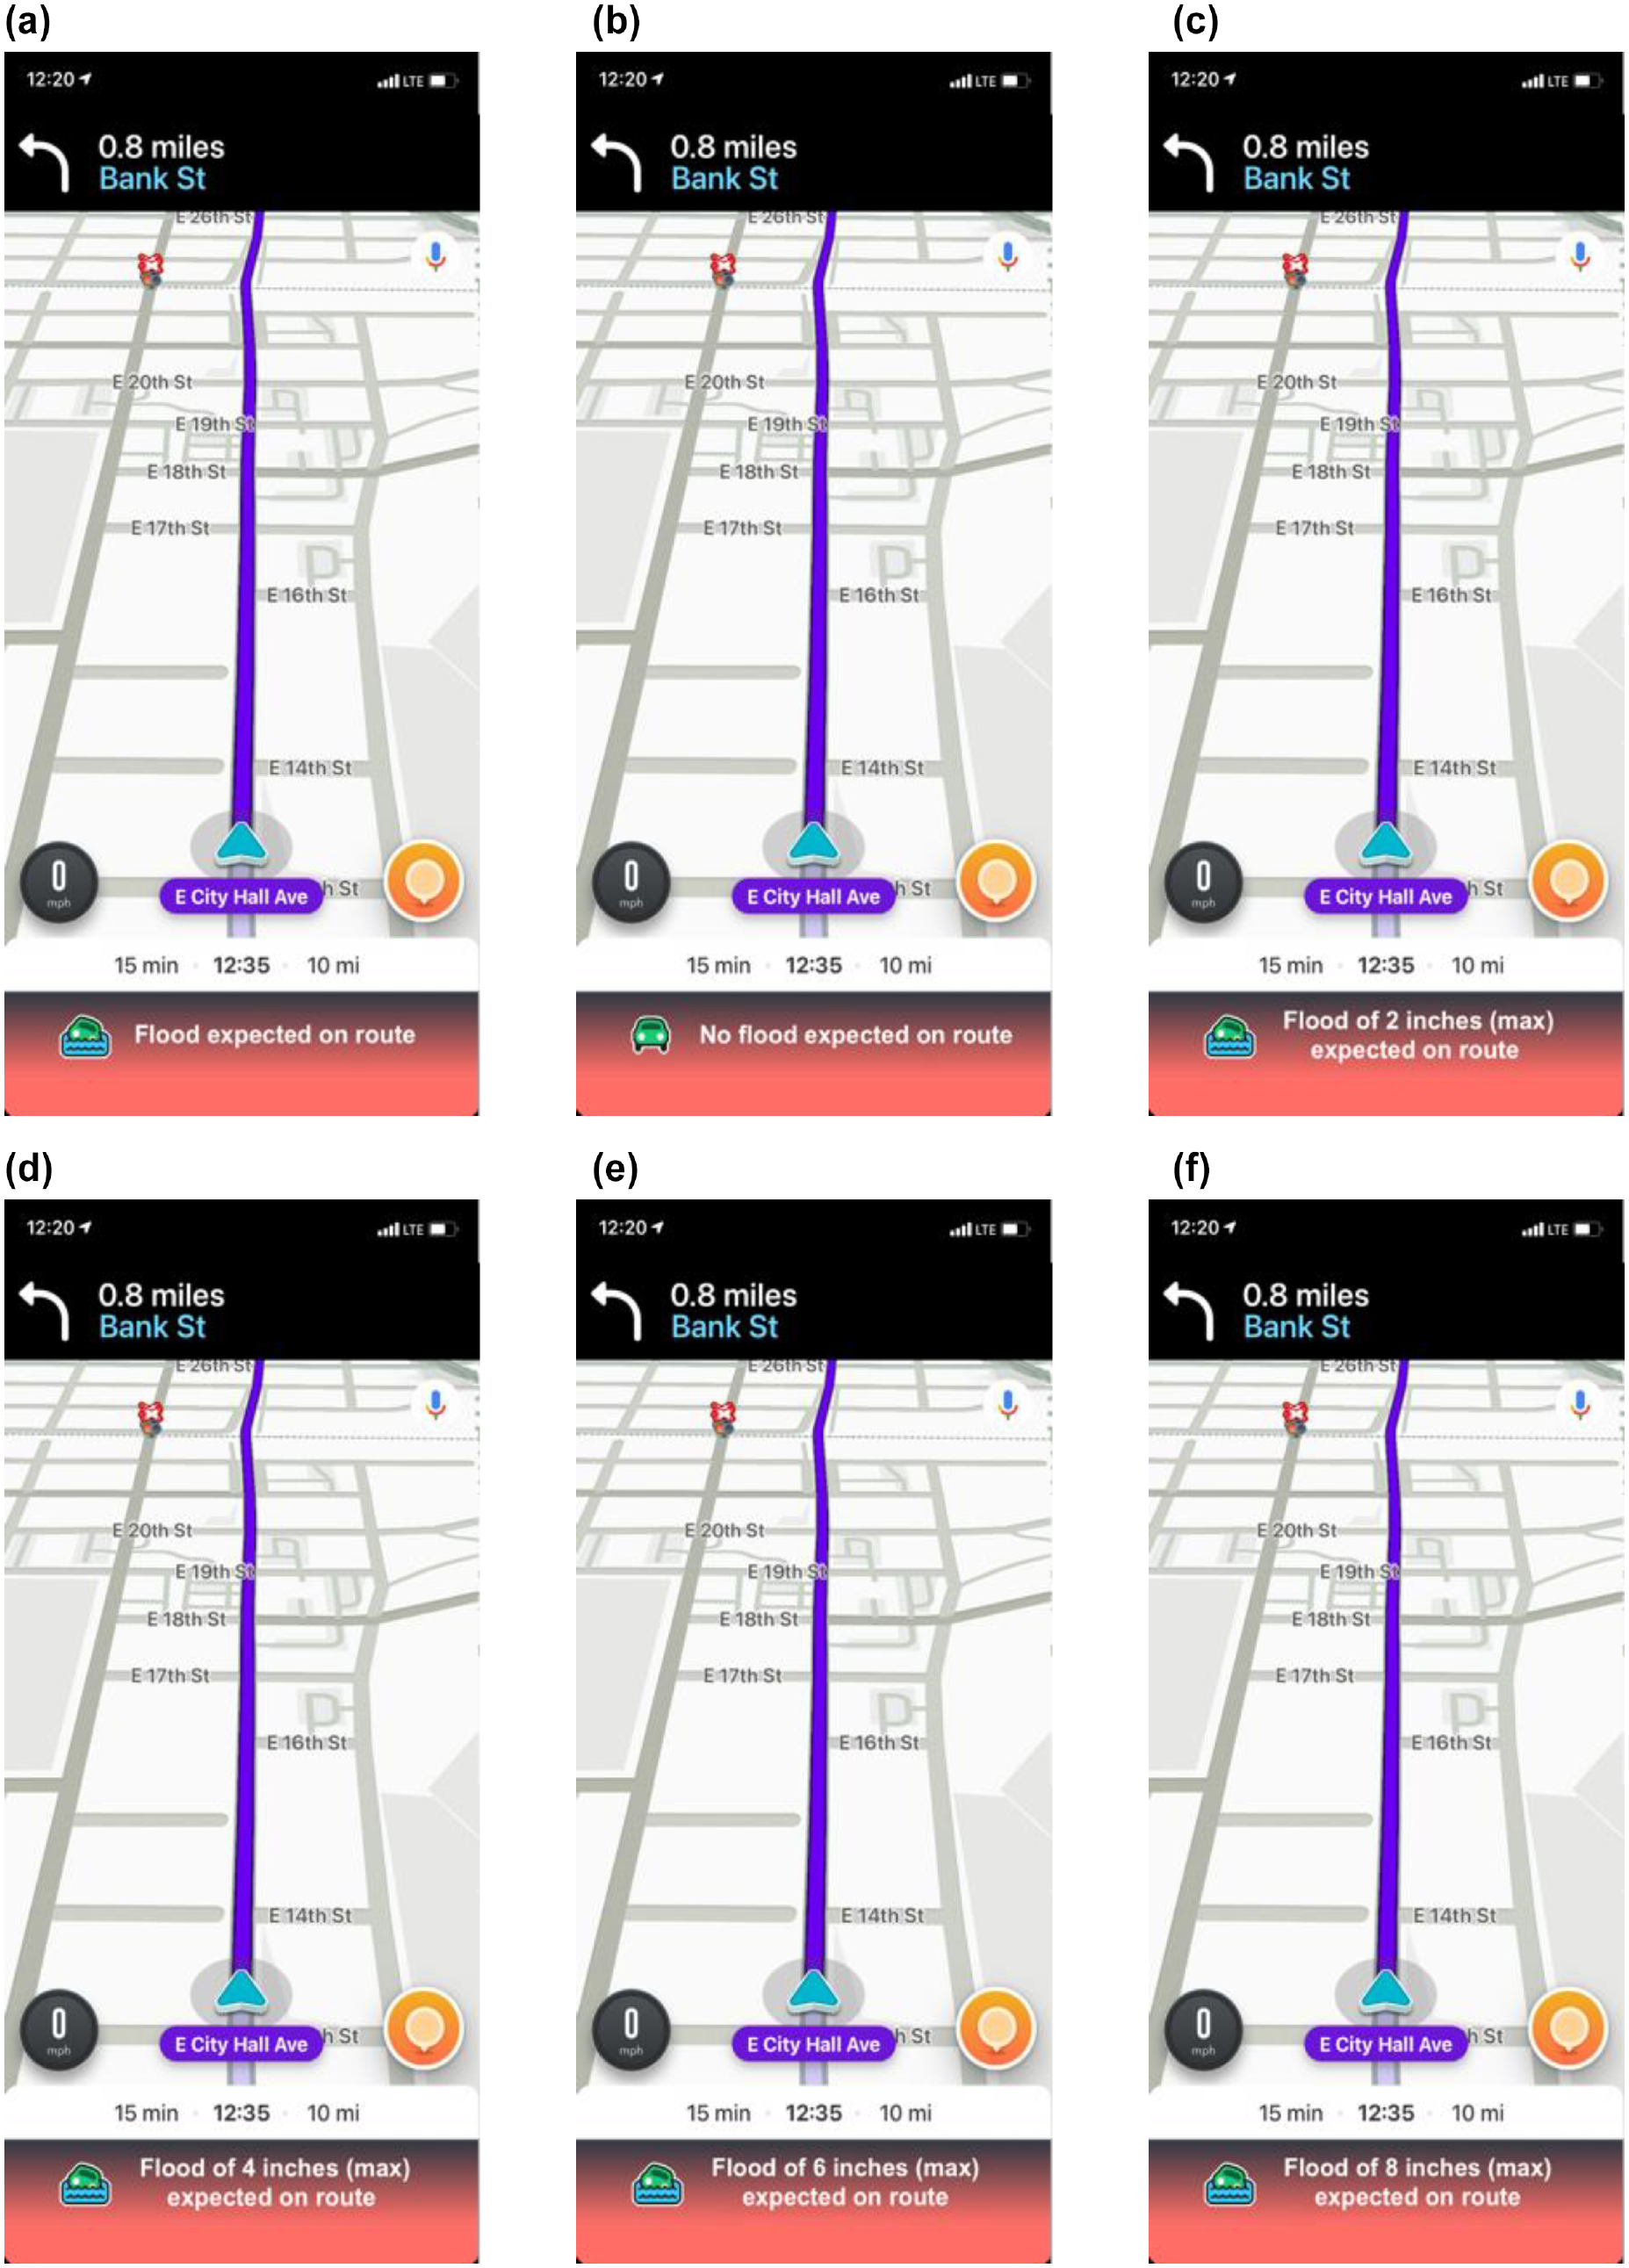
Revised Waze flood alerts: (a) flood, (b) no flood, (c) flood of 2 in., (d) flood of 4 in., (e) flood of 6 in., and (f) flood of 8 in.
After receiving the visual and auditory warnings, the participants answered the four understanding questions used in Experiment 1. One change from the prior experiment was to the understanding question on the depth of the flood. Rather than a multiple-choice question, a sliding scale from 0–12 in. of water depth was used in this experiment. Participants then answered the manipulation check questions and planned-action question, the same as in Experiment 1. The same attention check as in the prior study was included again in the same location.
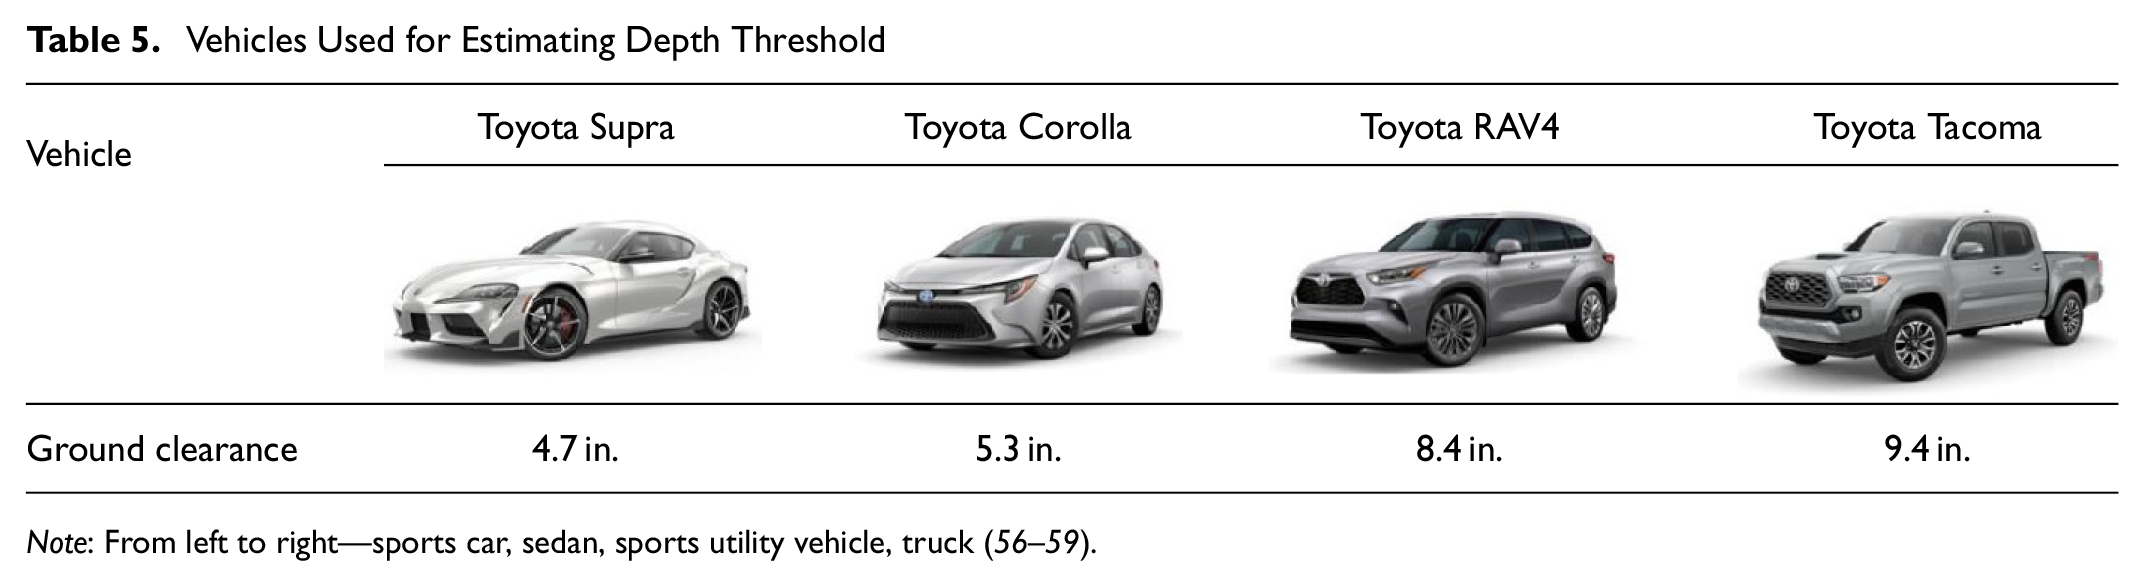
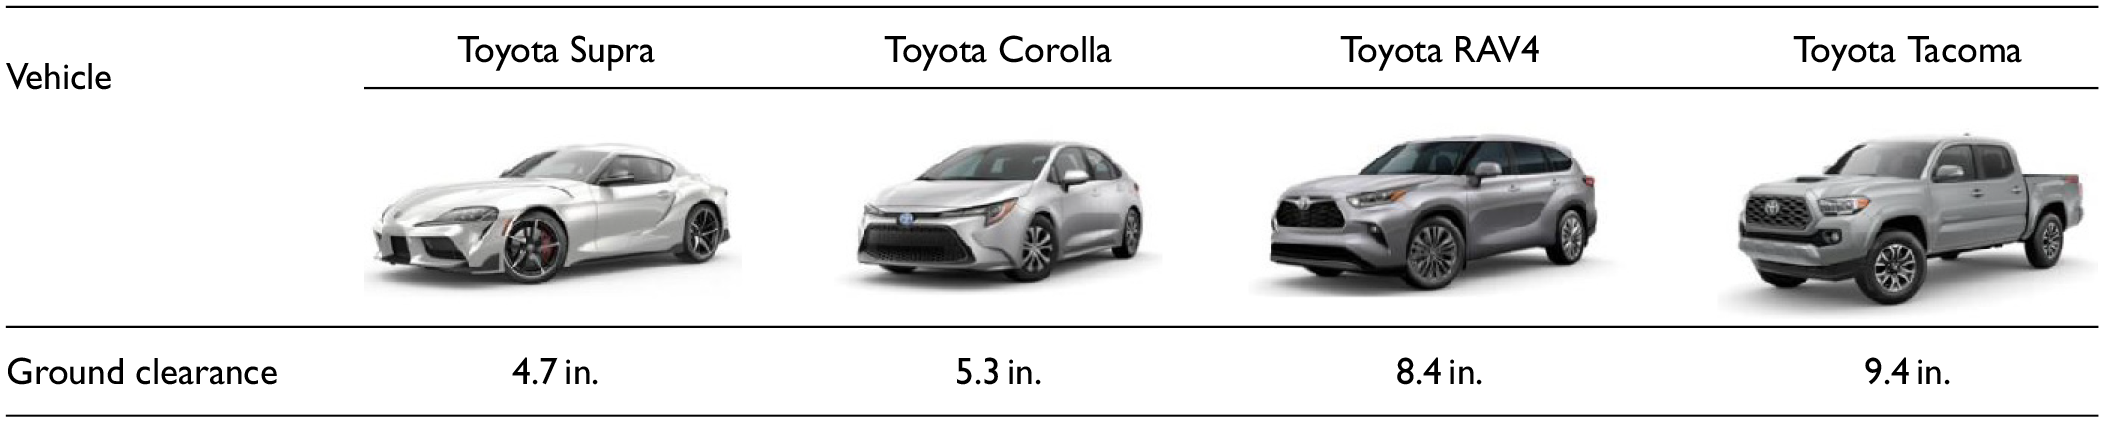
After these questions, the participants then answered four depth-threshold questions, where they estimated the amount of water that a given vehicle could drive through on a slider scale from 0 in. to 12 in., for a sports car, a sedan, an SUV, and a truck (see Table 5). They then answered the same trust/distrust and demographic questions as in Experiment 1 ( 32 , 50 ). After completing all of these questions, the participant was given a unique code to enter into MTurk to receive compensation for their participation in this experiment (see Figure 6 for procedure flow).
Vehicles Used for Estimating Depth Threshold
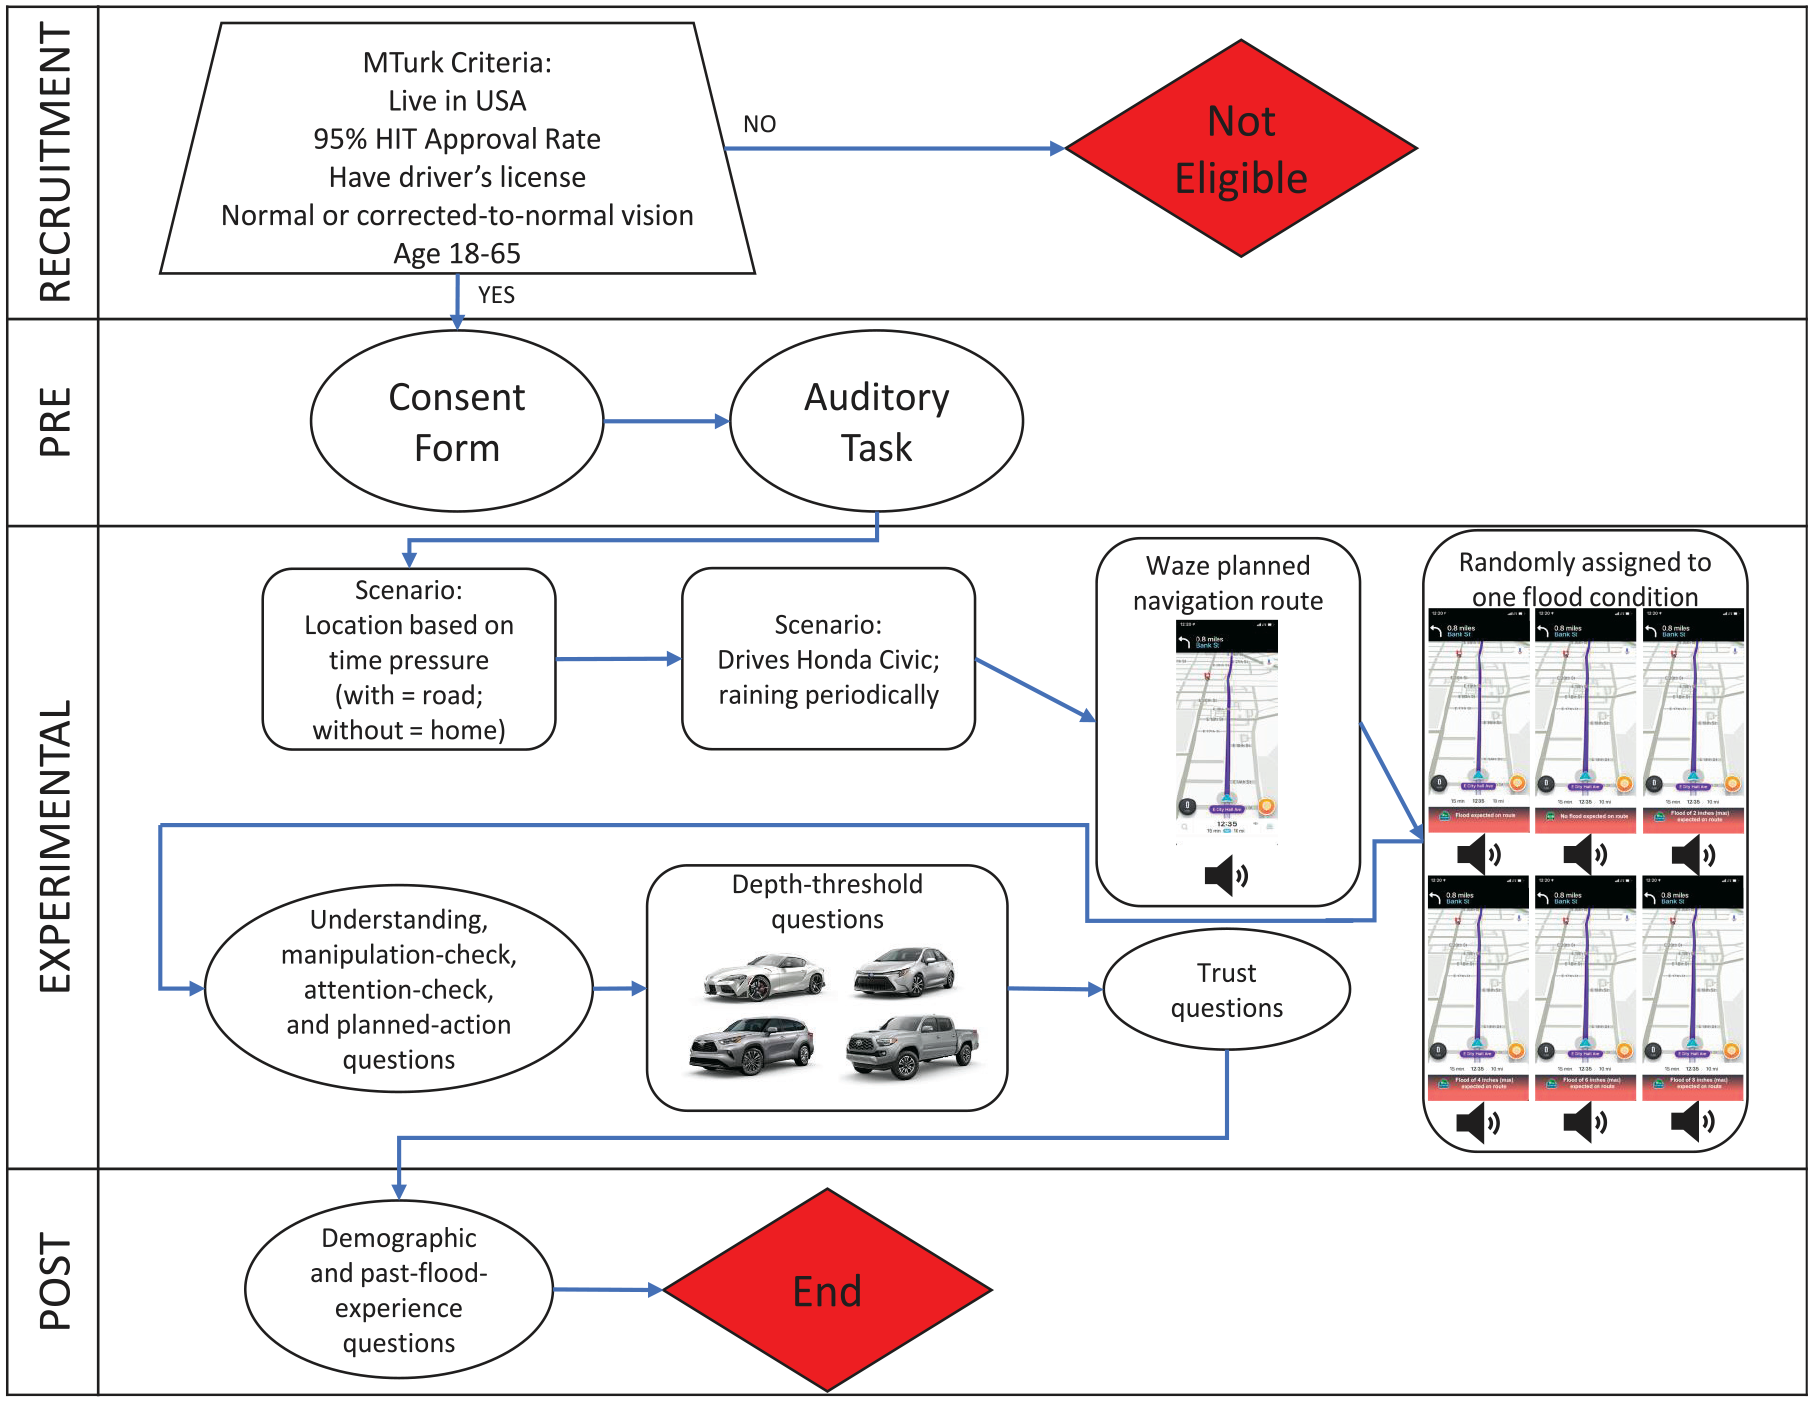
Procedure flow diagram: Experiment 2.
Results
A total of 58 participants (17.58% of the total) missed the attention check and were excluded from the data analyses. Of the remaining 272, the mean reported age was 38.22 years (SD = 10.58). Participants reported their gender as either male (n = 148), female (n = 119), or preferred not to say (n = 5). More details about participants’ demographics are in Table 6. Only 269 participants responded for the age they obtained their license (M = 20.30, SD = 3.73), while all 272 responded for the other three sections in Table 6. For the GPS apps used, participants were able to select multiple apps.
Demographic Information of Participants in Experiment 2 Who Passed Attention Check
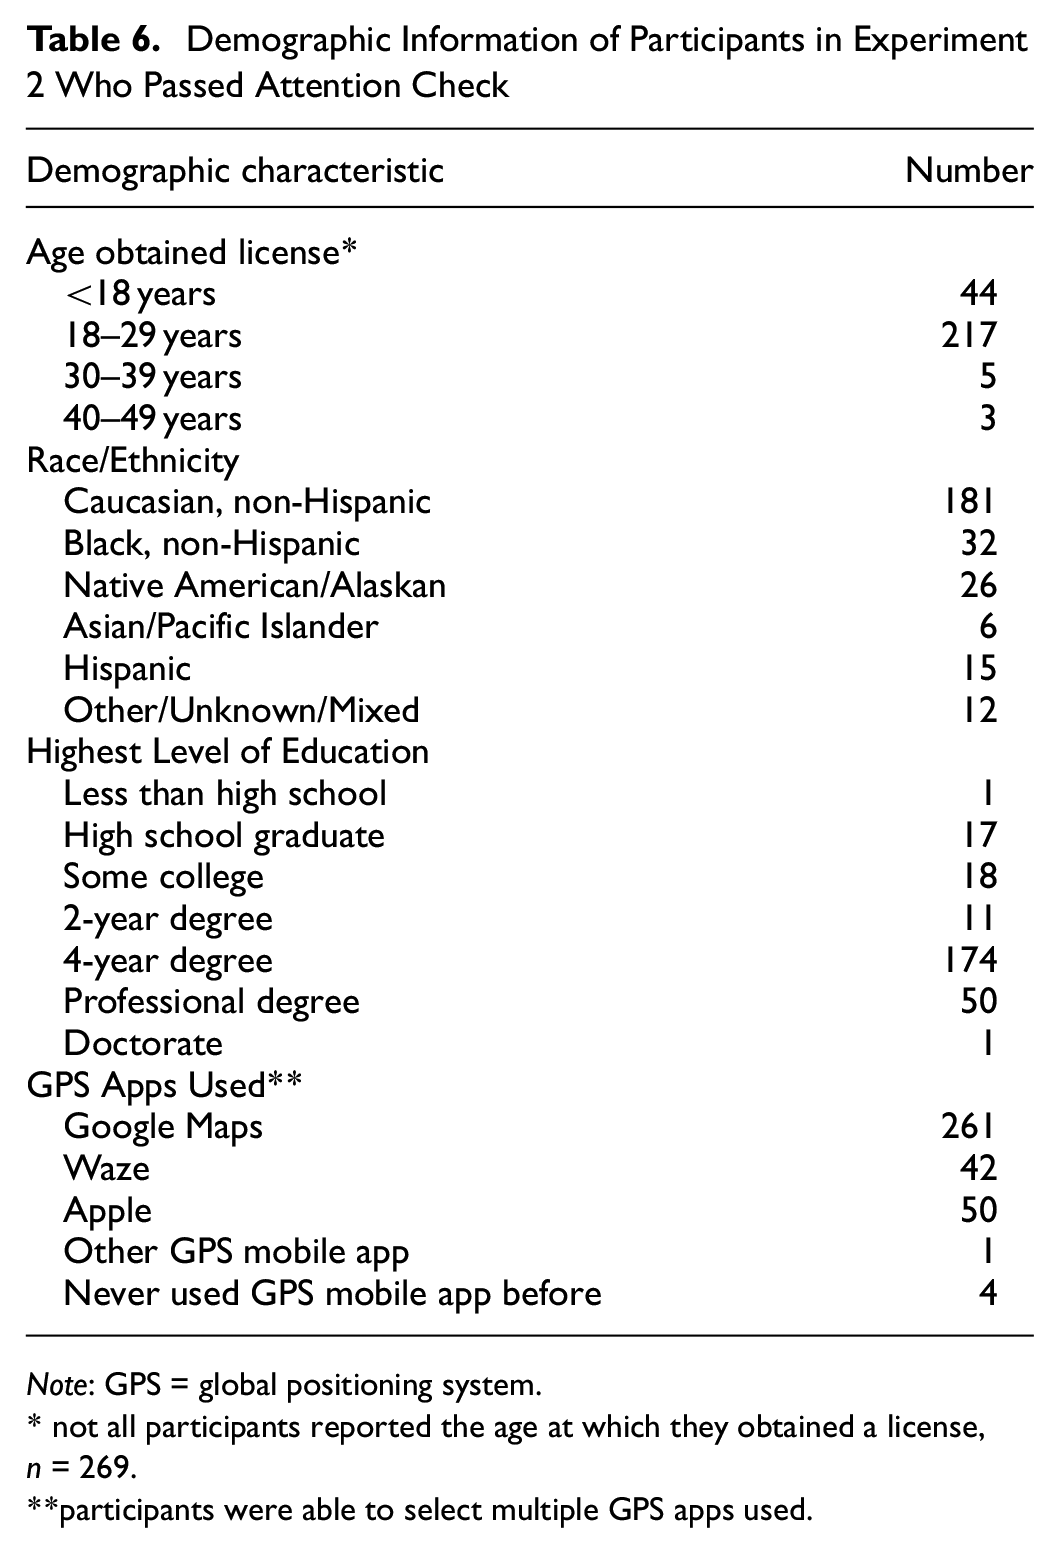
Note: GPS = global positioning system.* not all participants reported the age at which they obtained a license, n = 269. **participants were able to select multiple GPS apps used.
Manipulation Checks
An ANOVA was conducted on the urgency to decide based on flood information type and time pressure. Levene’s test was significant indicating that there were unequal error variances, F(11, 260) = 2.32, p = .010. Similar to Experiment 1, the analysis found that time pressure did not significantly affect the urgency to decide F(1, 260) = 1.80, p = .181, ηp2 < .01; however, the flood information type did, F(5, 260) = 7.54, p < .001, ηp2 = .13. There was a significantly lower sense of urgency for the no-flood condition (M = 3.14, SD = 0.80) than the flood (M = 3.73, SD = 0.80), flood-of-4-in. (M = 4.08, SD = 0.80), flood-of-6-in. (M = 3.89, SD = 0.80), and flood-of-8-in. condition (M = 3.89, SD = 0.80), ps < .04).
Action Taken Following the Warning
The same binary coding method was used as before in Experiment 1. Logistic regression analyses were conducted on the actions taken with the type of flood information and time pressure as predictors, and past flood experience, frequency of driving, and gender as covariates. There was no multicollinearity among these covariates or with the predictors, ps > .05.
The logistic regression model was statistically significant, χ2(9, N = 272) = 27.60, p = .001. The full model explained 15.39% (Nagelkerke R2) of the variance in the action taken after the warning and correctly classified 79.78% of the actions. (See Table 7 for the logistic regression results and Figure 7 for the percentage of participants that kept the original route by flood information and time pressure.) Using the no-flood-information group as the reference group, the inverted odds ratio indicated that, when holding the covariates constant, the odds of participants keeping the original route in the no-flood condition (M = 40.48%, SD = 49.68%) was 4.72 times higher than the yes-flood condition (M = 12.82%, SD = 33.87%), and 7.97 times higher than the flood-of-4-in. condition (M = 6.98%, SD = 25.63%), ps < .01. Time pressure, past flood experience, frequency of driving, and gender were not significant predictors in the model, ps > .05 (see Table 7).
Logistic Regression Predicting Action Taken after the Warning, with “No-Flood” and “Without-Time-Pressure” Conditions as Reference Groups (Experiment 2)
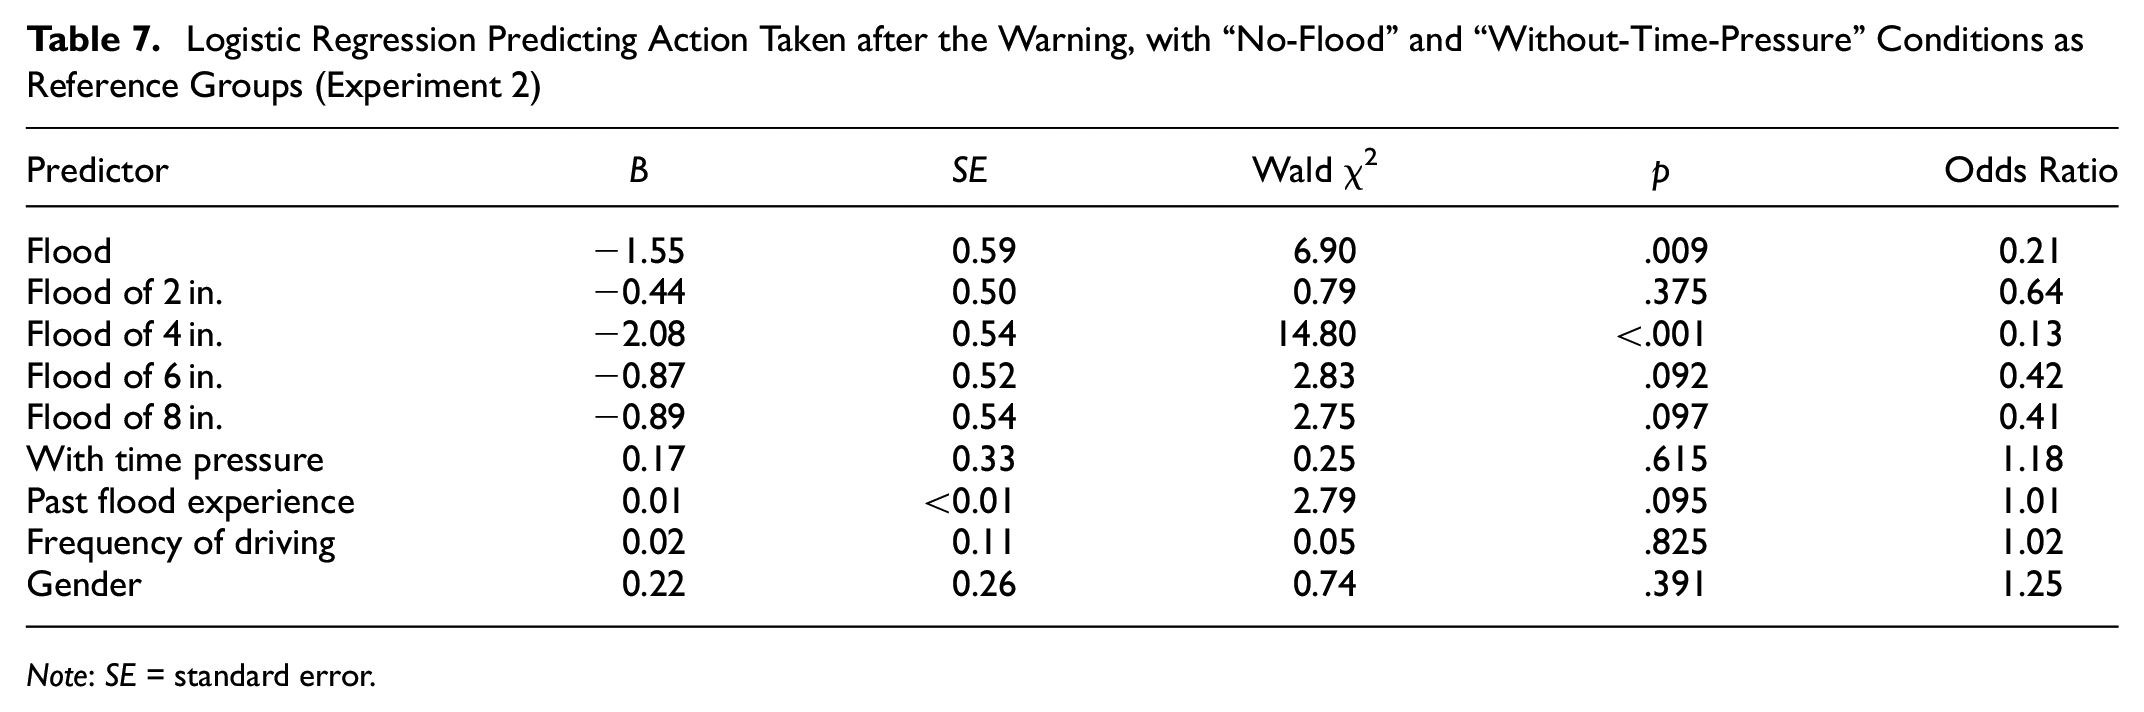
Note: SE = standard error.
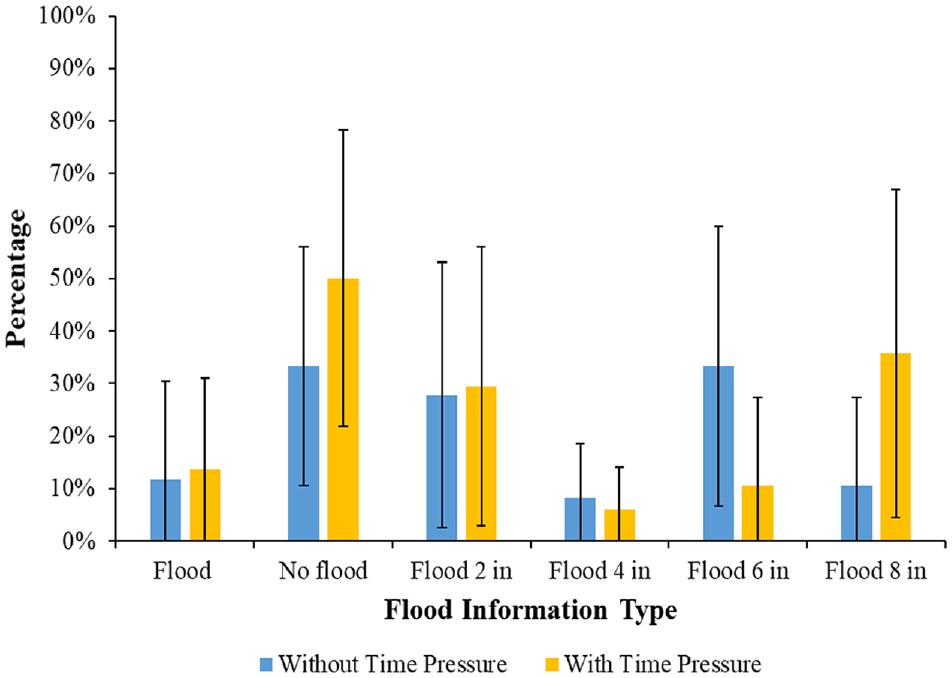
Percentage of participants who kept the original route after the warning and alternative route by time pressure and flood information type: Experiment 2.
To compare the flood-information conditions containing the depth of the water to the general yes-flood condition and other flood depths, another logistic regression was performed with the same model but with the flood-of-4-in. condition as the reference group along with the without-time-pressure condition as the same reference group as before. The odds ratio indicated that, when holding past flood experience, frequency of driving, and gender, the odds of participants keeping the original route for the flood-of-4-in. condition (M = 6.98%) was 5.13 times lower than the flood-of-2-in. condition (M = 28.57%, SD = 45.83%), Wald χ2 = 8.23, p = .004, and 3.34 times lower than the flood-of-6-in. condition (M = 21.62%, SD = 41.73%), Wald χ2 = 4.18, p = .041. All other comparisons between flood conditions were not significant, ps > .05.
Trust
As in Experiment 1, a single trust score was created from the trust measure. An ANCOVA was conducted with the trust in the navigation system based on the type of flood information and time pressure, controlling for how often it floods in their current location, frequency of driving, gender, primary mode of transportation, and past flood experience. Six extreme outliers in the trust data based on the three interquartile range (IQR) criterion were removed; three were in the flood-of-4-in. and without-time-pressure conditions, one was in the flood-of-2-in. and without-time pressure conditions, one was in the flood-of-6-in. and without-time-pressure conditions, and one was in the flood-of-8-in. and with-time-pressure conditions. The ANCOVA revealed that, after controlling for all five covariates, there was no significant difference in trust based on flood information type nor based on time pressure, ps > .05. However, the interaction between flood information type and time pressure on trust was significant, F(5, 249) = 3.23, p = .008, ηp2 = .06. Follow-up analyses showed that the time pressure had significant effects only in the flood-of-2-in. and flood-of-4-in. conditions, such that higher trust was induced with time pressure than without in the flood-of-2-in. (with time pressure: M = 5.02, SD = 0.73; without: M = 4.32, SD = 0.74), and the flood-of-4-in. (with time pressure: M = 4.75, SD = 0.74; without M = 4.30, SD = 0.73), ps < .01.
Additionally, the covariate of past flood experience was a significant predictor of trust, F(1, 249) = 8.54, p = .004, ηp2 = .03; those with more past flood experience tended to trust the navigation system less than those with less experience. The covariate of frequency of driving was also a significant predictor of trust, F(1, 249) = 34.28, p < .001, ηp2 = .12. Participants who drove daily (M = 5.08, SD = 1.00) had higher trust in the navigation system than those who drove once a month (M = 4.33, SD = 0.81), 2–4 times a month (M = 4.42, SD = 0.95), once a week (M = 4.45, SD = 0.82), and 2–3 times a week (M = 4.57, SD = 0.80), ps < .05. Lastly, the covariate of how often it floods in their current location was a significant predictor of trust, F(1, 249) = 7.64, p = .006, ηp2 = .03. Those who live where it floods a lot (M = 4.28, SD = 0.97) have lower trust in the navigation system than those who live where it does not flood (M = 4.99, SD = 0.96), t(249) = 2.25, p = .027. No other covariates were significant, Fs < 1.
Depth Threshold
Participants estimated the depth of the flood in the yes-flood (M = 6.77, SD = 2.92), no-flood (M = 5.43, SD = 3.98), flood-of-2-in. (M = 5.34, SD = 3.40), flood-of-4-in. (M = 6.51, SD = 2.83), flood-of-6-in. (M = 6.43, SD = 1.76), and flood-of-8-in. conditions (M = 7.79, SD = 2.12). Participants also rated what they thought the depth threshold was for four different vehicles (sports car, sedan, SUV, truck) on a scale of 0–12 in. of water. A repeated-measures ANOVA was conducted on the depth threshold by the vehicle type. Mauchly’s test of sphericity was significant, indicating unequal variances, χ2(5) = 176.65, p < .001, so a Greenhouse-Geisser correction was used. There was a significant effect of vehicle type on depth threshold, F(2.04, 553.03) = 60.44, p < .001, ηp2 = .18. Participants rated the SUV (M = 6.81, SD = 2.77) and the truck (M = 7.49, SD = 2.74) to have greater depth thresholds than the sports car (M = 5.85, SD = 3.14) and the sedan (M = 6.04, SD = 2.91), ps < .001. Additionally, participants rated the truck to have a greater depth threshold than the SUV, p < .001.
Discussion
Actions Taken
Our first hypothesis was confirmed again; participants who were in the yes-flood, and the flood-of-4-in. conditions were all significantly less likely to keep the original route when each was compared to the no-flood condition. However, this was not seen for the flood-of-2-in., 6-in., or 8-in. conditions. A possible reason for this is that participants were unaware of the depth threshold of the sedan vehicle they were driving in the scenario, which would not be able to drive through 6 in. or 8 in. of water without risking vehicle damage. The flood-of-2-in. condition is shallow enough for a sedan to drive through.
Our second hypothesis was partially supported by the data; those in the flood-of-4-in. condition displayed more avoidant behaviors than those in the flood-of-2-in. condition. This result was consistent with what Pearson and Hamilton found ( 40 ). However, this trend was not seen for the other flood-depth conditions. This may be due to the large variances in the data for the other flood depth conditions. There were no significant differences between those who were alerted of a general flood and those who were alerted of a flood with a specific depth, similar to our previous study’s results, since participants were able to accept a new route suggested by the GPS as an action option. This, again, shows how alluring the alternative route suggestion is at nudging drivers ( 55 ).
Our third hypothesis—that participants in the with-time-pressure condition would keep the same route more often than those in the without-time-pressure condition—was not supported, similar to results in Experiment 1. This, again, may be due to the lack of urgency of the premise to pick up food.
Trust
Similar to Experiment 1, neither the flood information type nor time pressure influenced trust in the navigation system. However, those in the without-time-pressure for the flood-of-2-in. and flood-of-4-in. conditions had lower trust than those in the with-time-pressure for those flood conditions; time pressure had no effects in the other conditions. This means that time pressure has a varying effect depending on the flood information type and time pressure type. An earlier warning given may increase trust in the navigation system for specific flood information types, allowing drivers to prepare more.
The covariates added into the model of how frequently participants drove, their past flood experience, and how often it floods in their current location, were significant predictors of trust. Together, these covariates represent exposure to floods, where more exposure, more past flood experience, and more frequent floods, the less trust they had in the navigation system. This could indicate negative previous experiences with the navigation system in flood situations, such as encountering a flood on a route the navigation system directed the driver to follow. The lack of trust may also be because of navigation systems not having flood detection features, which may frustrate those who drive more often and those who encounter floods more often.
Depth Threshold
Participants tended to overestimate the depth for the no-flood, flood-of-2-in., 4-in., and 6-in. conditions, since the warning relayed the maximum depth of the flood. It is possible that the conveyed maximum depth was not relayed enough for the drivers to appropriately understand. It may be related to the large variances in the data. Participants estimated the depth for the yes-flood condition similarly to the depth for the flood-of-6-in. condition. When given no depth information, participants may assume it to be a relatively deep depth that is unsafe to drive through. Participants accurately believed that the truck and the SUV had a greater depth threshold than the sports car and sedan. Overall, they believed that the sports car and the sedan had higher ground clearances than the vehicles in the images, but thought the SUV and truck had lower ground clearances than those in the images. This may be because the question had a slider from 0 in. to 12 in. of ground clearance, which may have biased their depth threshold judgments.
Limitations and Future Studies
One limitation is that data collection was collected at two different times. For this type of study, the data is typically collected all during the same period of time. During the break in data collection, it is possible that a nationally or globally known event occurred (e.g., a major hurricane or flood) that might have influenced the results of the study. This may explain why the flood-of-4-in. condition had a smaller variance than the other flood-depth conditions. However, participants were recruited the same way both times, so there should not be any differences between the two data collection periods.
Another limitation is that participants now had the option of accepting a new route suggested by the GPS as an action, without getting an alert from the GPS that a new route was found. This is different from the previous study in that it is not emphasized that a new route was found, but the option is still available to drivers. Additionally, the manipulation check questions were on a scale of 1 to 7, while in the previous study, they were on a scale of 1 to 5. This expansion of answer choices was made to better describe the options for the questions; however, it makes it difficult to compare the raw means between the two studies.
When we asked for participants to estimate the depth of the flood as well as the depth threshold, they were presented with a slider from 0 in. to 12 in. of water depth, which may have biased their estimates. Future studies can have an empty text box for participants to input a number to reduce the possibility of a ceiling effect. Lastly, the driving scenarios were described to participants in written passages and images, which could be less realistic and might have influenced participants’ decisions, especially with regard to time pressure. Future studies can utilize a driving simulator to increase the external validity of the study and test different flood information conditions.
General Discussion
Overall, the flood-information conditions had significant effects on how people acted after receiving a flood alert and following a suggested alternative route. For the former, drivers made more risk-avoidant decisions when alerted of the presence of a flood or a flood of any depth on their route, which may be related to their perceived risk of the situation ( 51 ). For the latter, this was only the case for the general-flood and the flood-of-4-in. conditions. Since a typical sedan has a depth threshold of 4–6 in., the driver may have determined that continuing straight through 2 in. of flood was acceptable. However, for the 6-in. and 8-in. floods, drivers should have avoided them. Note that the data in these conditions had large variances, indicating potential individual differences in the decisions. It is possible that some drivers overestimated the depth threshold of their vehicle in the study. It is also possible that some people may still drive through a flooded roadway, regardless of the warnings and avoidant options given to them. Additionally, mixed results were found when comparing the actions taken based on the depths of the floods, which also could indicate that drivers may have a poor sense of depth measurement, assuming that their measurement was based on the warning rather than the visual representation of the flood. Participants did not have accurate estimations of the ground clearance of the vehicles presented (e.g., they overestimated the sports car and sedan, and underestimated the SUV and truck). They also overestimated the depth of the flood in the flood information conditions that provided the maximum depth (flood-of-2-in. and flood-of-4-in. conditions).
Including the option of an alternative route significantly helped drivers make more risk-avoidant decisions for the majority of flood-information conditions, supporting that it is an appealing and possibly familiar option to drivers ( 60 ). Past flood experience, gender, and frequency of driving were all used as covariates for the actions taken. However, only the covariate of past flood experience was a significant predictor for before the alternative route was an option, again supporting the use of including an alternative route as an option; the alternative route was so attractive it negated any effect of past flood experience.
Overall, we did not find much influence of time pressure, which may be due to the presentation medium of the study (i.e., online survey) and the way it was manipulated (i.e., changing the time of the scheduled drive) in the studies. It could also be because of the lack of urgency of the premise used: to pick up food. There were mixed results about the effect of time pressure and flood information on trust. However, our results do show that how frequently someone drives is an indicator of trust in a mobile navigation app for flood alerts. Those who drive daily have higher trust in the navigation system than those who drive less frequently. Familiarity and prior experience with a system have been shown to increase trust ( 61 , 62 ). This implies that familiarity with navigation systems can potentially lead to more calibrated trust, and we found that the vast majority of our participants had used a mobile GPS navigation application before.
One limitation of both experiments is that the data were collected through MTurk, which did not allow the researchers to control the participants’ experimental environment. For example, the auditory warning may have been relayed at different intensities because of different volume settings on the participants’ devices. Future studies may conduct the experiment in a controlled setting in the researcher’s laboratory ( 63 ). Another limitation is that we did not control for the participants’ experience with Waze, which may have influenced their trust in the navigation system. Their experience with Waze can be measured and included as a covariate in the analyses in future studies.
Currently, navigation applications lack detail or transparency for flood alerts during driving. The present study tested several ways to introduce these flood alerts to drivers to prevent harm or damage while driving. The implications from this research support the inclusion of an alternate route option for drivers when faced with a flooded roadway. Additionally, the results show the importance of providing a warning to drivers to aid them in risk-avoidant behaviors. If navigation applications implement these findings, it can potentially help users avoid dangerous situations and make safer decisions on the road, preventing costly driving mistakes during floods and, ultimately, making it to their destination faster and safer.
Conclusions
In conclusion, whether the flood information is displayed can significantly affect drivers’ decisions regarding a potentially flooded route. When presented with flood-risk information, people are less likely to drive through floods; however, providing more detailed information might not necessarily aid in risk prevention when the flood depth does not reach a certain threshold. There is a possibility for time pressure to play a role in drivers’ decisions, although it requires further validation. These results can help design effective flood alerts and better understand drivers’ behavior given a flood alert.
Supplemental Material
sj-docx-1-trr-10.1177_03611981241287539 – Supplemental material for Influence of Time Pressure and Flood Information Type on Flood Alert Effectiveness in Driving
Supplemental material, sj-docx-1-trr-10.1177_03611981241287539 for Influence of Time Pressure and Flood Information Type on Flood Alert Effectiveness in Driving by Katherine R. Garcia, Scott Mishler and Jing Chen in Transportation Research Record
Footnotes
Acknowledgements
Part of this work was presented at the 29th Annual Conference of the Research Institute of Human Factors in Road Safety Department of Management with Bar-Ilan Center of Smart Cities, the Human Factors and Ergonomics Society 65th International Annual Meeting, the 2022 APA Annual Convention, and the Human Factors and Ergonomics Society 66th International Annual Meeting.
Author Contributions
The authors confirm contributions to the paper as follows: study conception and design: J. Chen, K. Garcia, S. Mishler; data collection: K. Garcia; analysis and interpretation of results: K. Garcia, S. Mishler, J. Chen; draft manuscript preparation: K. Garcia, S. Mishler, J. Chen. All authors reviewed the results and approved the final version of the manuscript.
Declaration of Conflicting Interests
The author(s) declared no potential conflicts of interest with respect to the research, authorship, and/or publication of this article.
Funding
The author(s) disclosed receipt of the following financial support for the research, authorship, and/or publication of this article: This work was supported by the National Science Foundation award #1951745.
Supplemental Material
Supplemental material for this article is available online.
References
Supplementary Material
Please find the following supplemental material available below.
For Open Access articles published under a Creative Commons License, all supplemental material carries the same license as the article it is associated with.
For non-Open Access articles published, all supplemental material carries a non-exclusive license, and permission requests for re-use of supplemental material or any part of supplemental material shall be sent directly to the copyright owner as specified in the copyright notice associated with the article.