
Abstract
Urban heat islands (UHI) have become an increasingly pressing issue owing to the global warming trend and a steady growth of urban areas. Revegetation, shading, or the reduction of sealed surfaces is not always possible in cities. Therefore, one way to fight UHIs is through adapting currently used pavements. This study assesses the thermal behavior of 12 different pavement materials in a custom-made test stand. The materials include mastic asphalt (MA 8, MA 8 white), porous asphalt (PA 4, PA 4 abraded, PA 4 white, PA 8, PA 8 abraded, PA 8 white), asphalt concrete (AC 11 transparent, AC 8 yellow), and semi-flexible pavements (SFP 8, SFP 8 zeolite). The albedo was assessed using pyranometer. Sensors and thermal imaging were used to measure temperatures during two simulated heat cycles. Both the temperatures underneath the test specimens and at the surface were considered, as well as the cooling times of the materials. The results showed high maximum temperatures for PA and MA, as well as low maxima for the white painted materials, with differences in maxima of up to 15°C. Porous asphalt, like PA 8, cools faster than MA 8 from roughly 47°C to 28°C, taking 3.7 h compared with MA 8’s 5.1 h. This highlights the importance of considering cooling times and regional solar phases in experimental setups. Through the wide range of tested materials, a significant linear correlation between the measured albedo and surface temperature was proven. Ultimately, a foundation for thermal comparability between these materials was established.
Keywords
The increasing occurrence and duration of heat waves, attributed to global warming, present environmental challenges ( 1 , 2 ). One of these is the increase in temperature in densely populated areas, commonly referred to as urban heat islands (UHI) ( 2 , 3 ). Owing to urbanization, a shift away from rural living toward increased urban settlement can be observed globally ( 4 ). Several factors contribute to the UHI effect with the primary influences being anthropogenic heat emissions, the choice of building materials, the intricate geometry of urban landscapes, and the lack of green areas, water bodies, moisture retaining soil, and natural shade ( 1 , 4–9). During summer nights, the difference in air temperature between urban and surrounding rural areas can reach up to 12°C ( 1 , 8 ). Consequences comprise increased energy use for cooling, air pollution, and health risks ( 2 , 6–8).
Around 20%–40% of urban areas are typically covered by pavements ( 3 , 6 , 10 , 11 ). Therefore, one way to mitigate UHI is through the implementation of cool pavements ( 1 , 3 , 5 , 6 ). There is some ambiguity in the definition of cool pavements ( 1 , 3 ), with the term typically describing pavement technologies with reduced surface temperatures ( 1 , 8 , 10 ). As with the term’s definition, there are various approaches to classify cool pavements. For instance, they can be classified in regard to their cooling mechanism, as outlined by Li ( 8 ):
(1) Modification of thermal properties
(2) Enhancement of evaporation
(3) Enhancement of convection
(4) Reduction of thermal energy
Thermal properties can be enhanced by adjusting the thermal conductivity, surface reflectivity, heat capacity, and heat emissivity ( 4 , 8 ). The thermal conductivity was improved in past studies by adding graphite powder and carbon fibers or using thermally conductive aggregates such as quartzite ( 4 , 12 ). Reflectivity is a well-researched property ( 6 , 8 , 10 ). It can be regulated primarily by the color and roughness of the material ( 1 , 6 , 8 , 13 ). On the one hand, the range of wavelength affects the pavement’s heat reflectance ( 1 , 14 , 15 ). On the other hand, reflection can be subdivided into specular and diffuse reflection ( 1 , 16 ). Both of those aspects contribute to the overall reflection of the pavement ( 1 , 6 , 13 ). Furthermore, enhancing the reflectivity may adversely affect pedestrian thermal comfort ( 8 , 9 , 17 ). High levels of reflectivity can lead to an increase in air temperatures close to the surface ( 8 , 9 , 17–19).
In addition to that increased cooling demand for buildings, or limitations on driving safety owing to light reflection can occur ( 1 , 13 ). Research is investigating coatings that mitigate these effects ( 20 – 22 ). The emissivity is thought to primarily influence the night temperatures and cooling behavior of pavements ( 6 , 8 ). To change the thermal capacity, phase change materials have been investigated ( 23 , 24 ). Decreased thermal capacities have been found for porous materials ( 11 , 25 ). Porous materials can also enhance evaporation, by storing water near the surface ( 8 , 26 , 27 ), but show decreased emissivity ( 25 ). Furthermore, when dry, porous asphalt exhibits reduced thermal conductivity and heat flow ( 1 , 11 , 28 ). This results in higher surface temperatures compared with denser asphalts ( 1 , 6 , 28 ). Regardless, a study has shown that despite higher surface temperatures, the near-surface air temperatures are lower ( 28 ). Overnight, porous asphalts have the ability to cool down rapidly owing to their low density ( 8 , 28–30). In addition to porous materials, water-retaining materials, such as semi-flexible pavements, are being studied to improve evaporation ( 1 , 5 , 8 ). Water retention can be increased by adding biochar, fly ash, ceramic waste powder, or zeolite to the cement slurry ( 31 – 34 ). Furthermore, zeolite powder enhances the reflectivity of the cement slurry ( 32 ). Convection can be influenced by the roughness of the pavements and is dependent on the speed and temperature of the air flow near the surface ( 6 , 8 , 28 ). Reducing thermal energy can be accomplished through natural shade and active mechanical cooling, such as embedded pipes with circulating water ( 8 , 35 , 36 ).
The literature review presented a diverse range of materials and their impact on the mitigation of UHI effects. However, there is a paucity of experimental comparative analysis of these materials. The objective of this study is to provide a systematic experimental comparison of the thermal behavior of internationally acclaimed cool pavement technologies. Such alterations included modifications to a material’s thermal capacity, as exemplified by the use of porous asphalt. The incorporation of zeolites into semi-flexible pavements has been demonstrated to enhance evaporation even under dry conditions. Furthermore, the reflectivity of the materials was modified through the application of paint, the use of abraded materials, and the alteration of the color of the entire asphalt mixture. A comparison was conducted between 11 materials, which may be categorized as cool pavements, and a dense and highly bituminous mastic asphalt. This resulted in a total of 12 materials being considered in this study.
Currently, there are no standardized test methods for analyzing the thermal behavior of pavements. Therefore, a versatile, yet simple test stand was developed. On the one hand, this allowed for direct comparison of different cool pavement technologies. On the other hand, an in-depth analysis and contrasting comparison of the experimental results was possible. Temperatures, cooling behavior and reflectivity were investigated for the purpose of this study. In addition, this study aims to statistically investigate the experimental correlation between albedo and temperature of the tested materials.
Materials and Methods
Materials
To enable comparison of a wide range of materials, the thermal behavior of 12 different pavements was investigated. Two specimens were produced for each material. The materials can be subdivided into four mix designs: mastic asphalt mixes (MA), porous asphalt mixes (PA), asphalt concrete mixes with transparent binder (AC), and semi-flexible pavement mixes (SFP). Table 1 lists these mix designs along with information on the materials and mix designs. The samples are depicted in Figure 1 and more details are given below.
Specimen Mix Designs and Materials
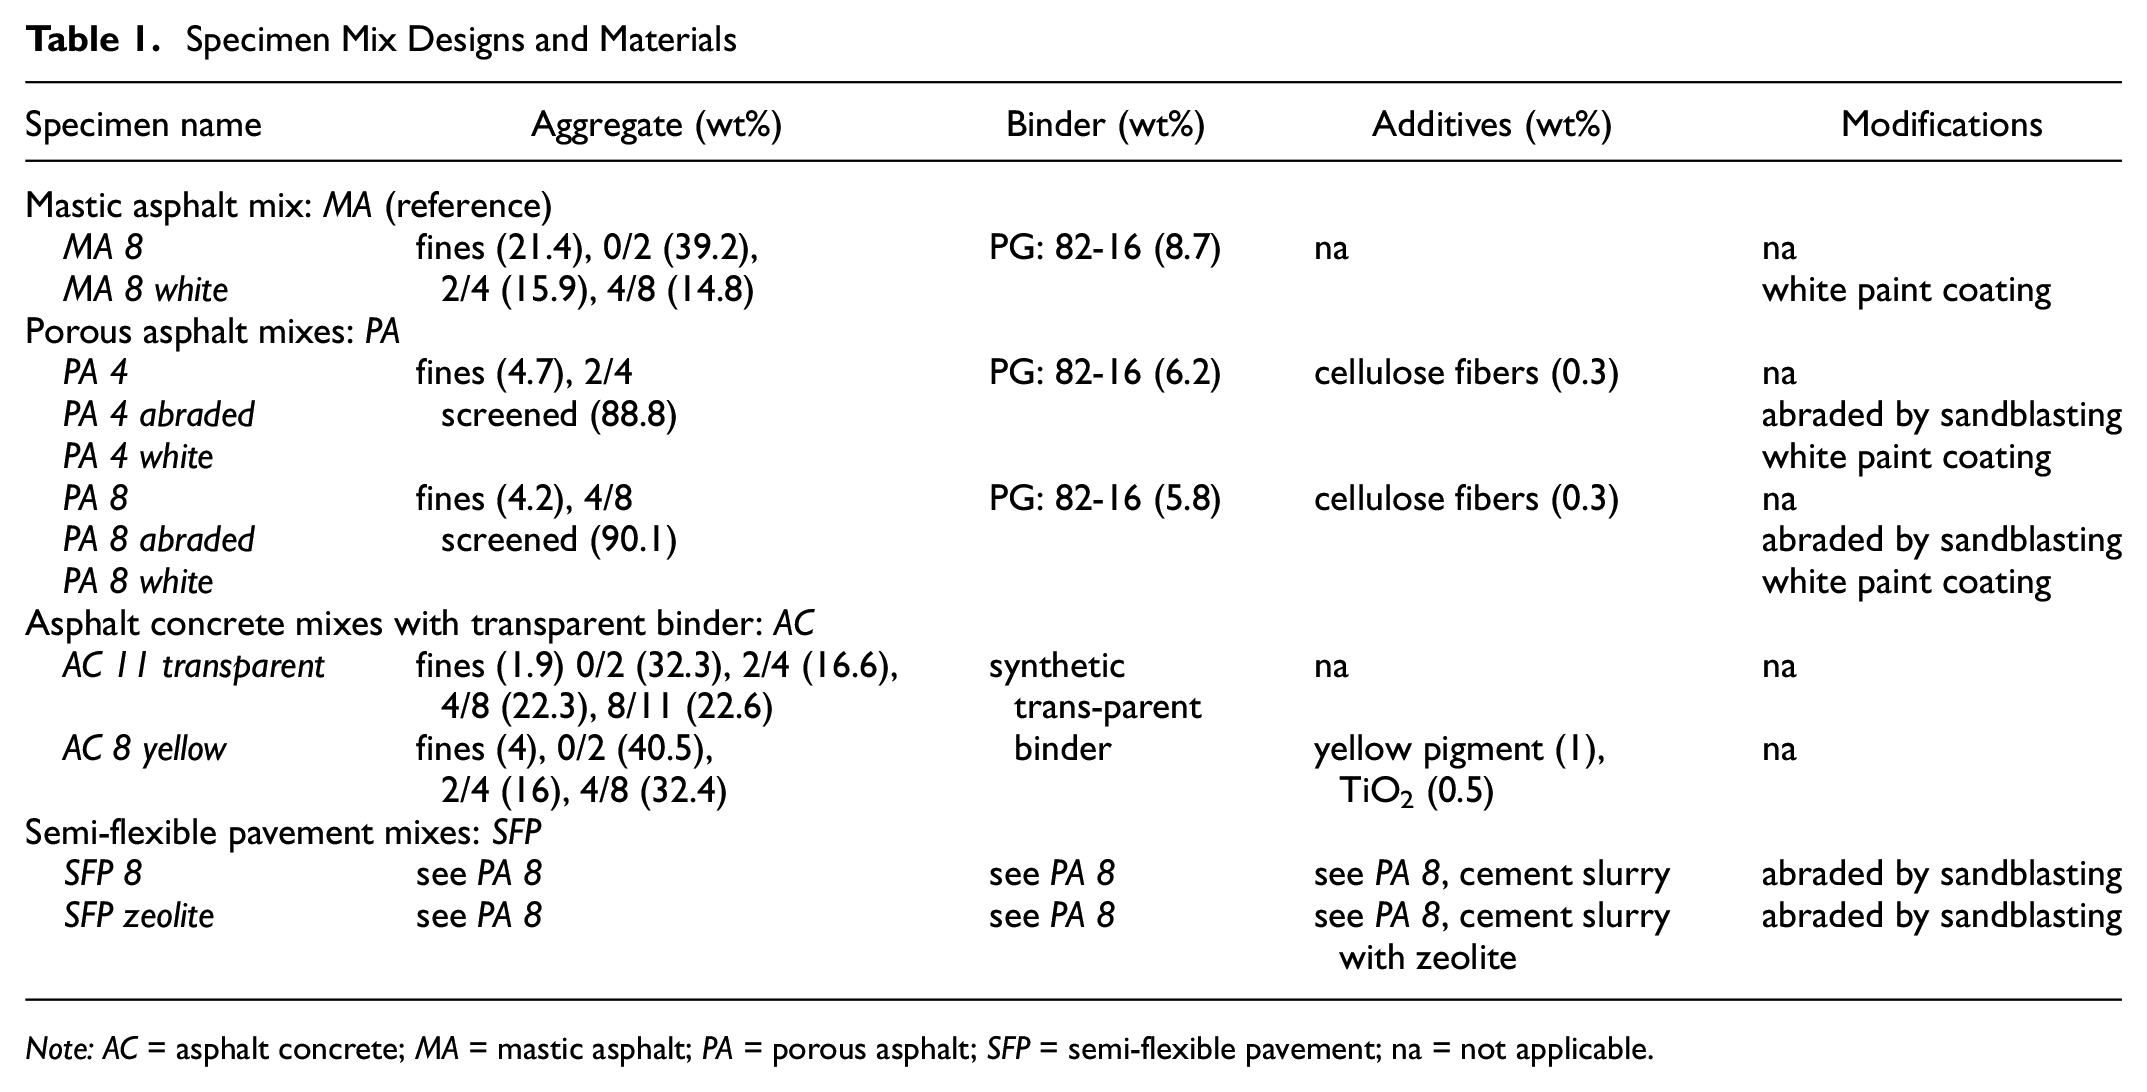
Note: AC = asphalt concrete; MA = mastic asphalt; PA = porous asphalt; SFP = semi-flexible pavement; na = not applicable.
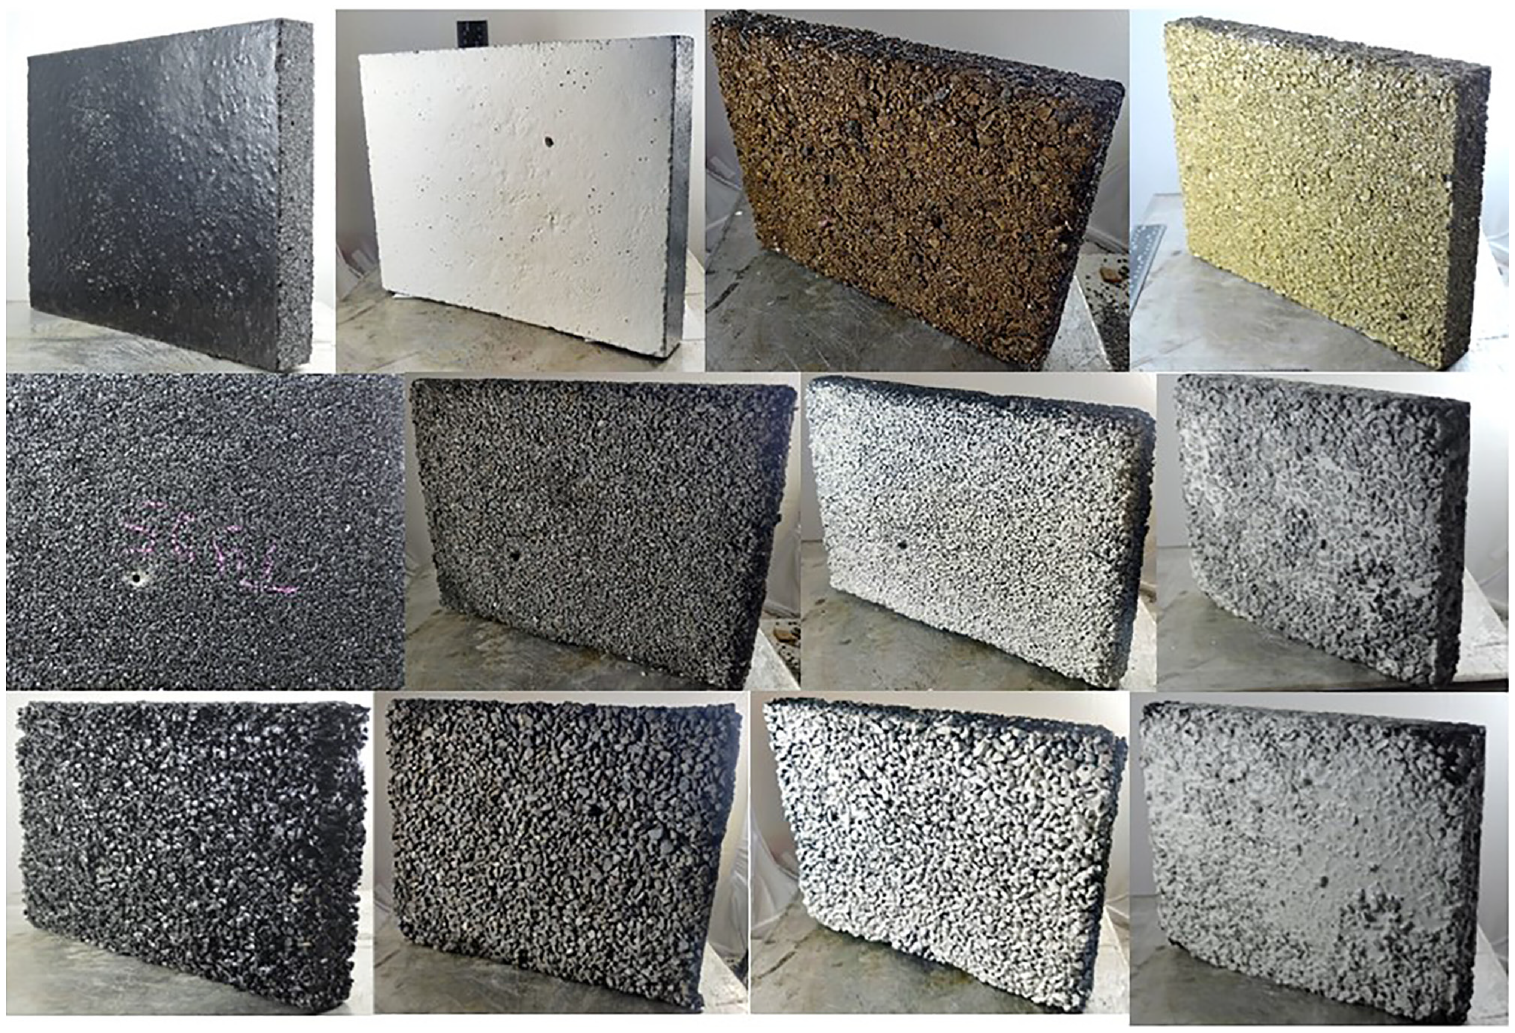
Mix designs (from left to right: MA 8, MA 8 white, AC 11 transparent, AC 8 yellow, PA 4, PA 4 abraded, PA 4 white, SFP 8, PA 8, PA 8 abraded, PA 8 white, SFP 8 zeolite).
Mastic Asphalt Mix (MA)
Mastic asphalt is frequently used in some European countries for bike lanes and pathways in urban areas. Accordingly, it served as a reference. It contains a high proportion of fines and binder, making it a dense material. This study tested a mastic asphalt with maximum aggregate size of 8 mm (MA 8) (see Table 1). The aggregates used for these asphalt specimens was kersantite and granite porphyry.
Once the reference samples (MA 8) had been tested, the surface was colored using white paint (MA 8 white), as depicted in Figure 1. For this, a characteristic road marking paint made of methyl methacrylate with added color pigments in RAL 9016 was used. The paint’s volume per area is dependent on the material’s roughness, with a range of 1.5 to 2.5 l/m2. After the coloring process the specimens were tested once more. The change in reflectivity owing to the paint was considered in the test program to analyze the relevance of high reflectivity for thermally induced loading. At this high level of reflectivity, the white paint would not last in service. In addition, as discussed in the introduction, highly reflective pavements can cause increased thermal stress for vulnerable road users owing to high near-surface air temperatures.
Porous Asphalt Mixes (PA)
Ellebjerg and Bendtsen ( 37 ) provided the basis for the design of the porous asphalt mixes. This allowed for a void content of 23% for PA 4 and 25% for PA 8 to be obtained. To achieve this high void content, the aggregates were screened before mixing to minimize the number of fines and smaller aggregates. Once more, the aggregates employed were kersantite and granite porphyry. In addition, cellulose fiber pellets were added as a reinforcing additive. Owing to the repeated intense thermal loading on the test specimens, a binder with PG 82-16 was used to circumvent deformation during installation and removal after radiation. After thermally testing the porous mix designs (PA 4 and PA 8), the specimens were sandblasted, and therefore abraded (PA 4 abraded and PA 8 abraded). By removing the near-surface binder, it is possible to mimic the condition of the road after a few years in service. PA abraded result in a lighter color owing to the stone being laid open on the surface of the material. Similar to the mastic asphalt, a white coating with the same paint was applied to the abraded specimens to produce PA 4 white and PA 8 white.
Asphalt Concrete Mixes with Transparent Binder (AC)
A honey-colored synthetic transparent binder, free of asphaltenes, was used to mix the asphalt concrete. Light-colored natural mineral aggregates, primarily dolomitic limestone, were used to increase the reflectivity of the mix. Owing to the color change of the entire asphalt mix, the durability of the color is enhanced. Abrasion will continue to provide a light-colored surface. The transparent binder with no further additives was used to produce an asphalt concrete with maximum aggregate size of 11 mm (AC 11 transparent). An AC 8 was produced including titanium dioxide (TiO2) and yellow pigment increasing the test specimen’s reflectivity (AC 8 yellow). Both materials are depicted in Figure 1.
Semi-Flexible Pavement Mixes (SFP)
SFP are composite pavements consisting of a layer of flexible pavement with a high porosity (in the range of 15-35%) and a rigid layer, typically a cementitious material ( 38 , 39 ). For this study the PA 8 was used as the primary scaffold for the semi-flexible pavements, into which a cement slurry was poured and spread. Owing to gravity, the cement slurry reached all voids of the scaffold. The dry components of a high-performance flowable mortar for semi-flexible pavements were used as the primary product of the cement slurry. By adding water to the dry cement–aggregate mixture, the finished product can be liquefied and incorporated into the porous asphalt structure. The mortar–water mixture was adjusted to the water requirement of 21.6% suggested by the products guidelines. This cement slurry introduced into the PA 8 provided the SFP 8. Subsequently, the second SFP (SFP 8 zeolite) was optimized by adding zeolite in a dry component ratio of 85:15 (mortar:zeolite). The ratio of zeolite added was inspired by Higashiyama et al. ( 34 ). A water content of 22.1% was added since the zeolite required more water for liquidation. Through the addition of zeolite, the water storage capacity was increased from 2.2% to 3.3% of the sample weight. The SFP were abraded by sandblasting before any laboratory testing was conducted, to ensure that the surface resembles that of SFP in the field.
Methods
Two identical test stands were used to evaluate the thermal and reflective behavior of the specimens. The setup of these test stands is outlined in Figure 2. It comprises a wooden box lined with insulating polystyrene. A drainage layer was included, on which the specimens were placed. Subsequently, the test specimens were irradiated by a 150W daylight lamp. Pyranometers were positioned at the edge of the test stand to optimize the space available. All experiments were conducted at an ambient air temperature of 24 ± 2°C in a temperature-regulated laboratory setting. To ensure that neither the ambient air nor the initial temperature of the slabs affected the thermal behavior during the experiments, the specimens were stored in the same room.
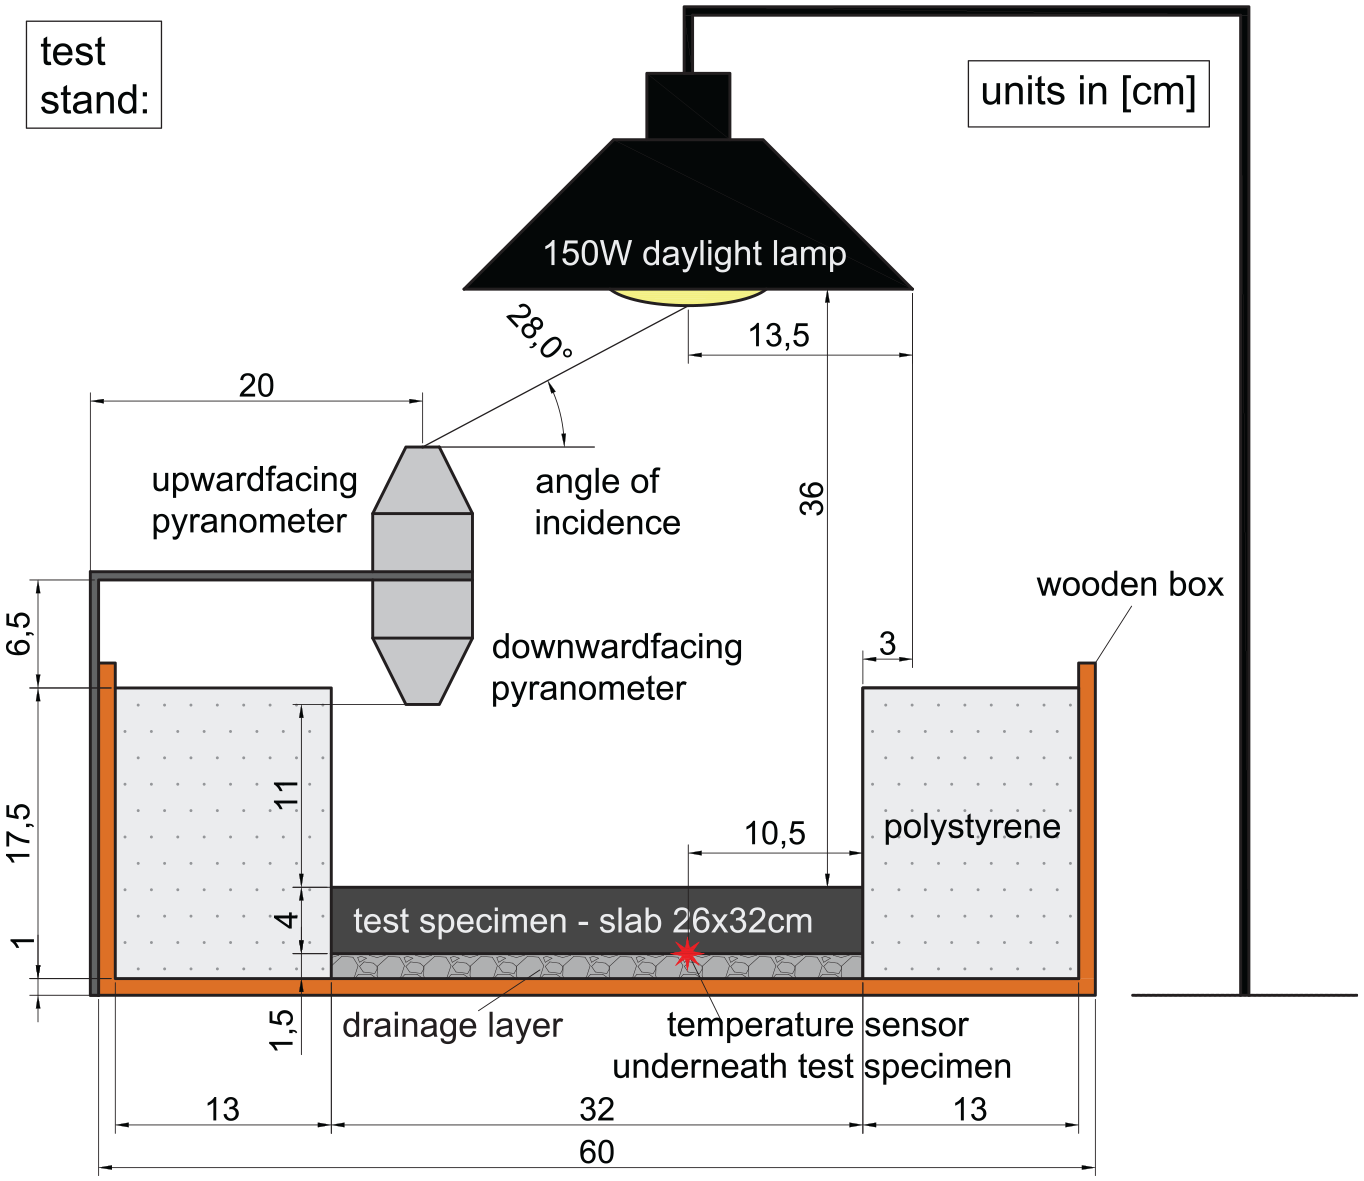
Schematic structure of the designed test stand.
To draw conclusions about the reflective behavior, the albedo of the materials was calculated using Equation 1. Owing to the flat incidence angle of 28° on the upper pyranometer (see Figure 2) the denominator Iinc,28 was multiplied by a factor of 1.67. This factor was derived from experimental data reported by Chen et al. ( 40 ). By correcting the measured albedo with this factor, the values of this study can be compared with the values mentioned in literature, in which incident angles of 90° are used ( 41 , 42 ).

The albedo measurement was conducted following repeatable protocols in a dark room, at which the daylight lamp served as the sole light source. The averages of the measured data collected during 1 h of irradiation were inserted into Equation 1 for the parameters Iref (downward-facing pyranometer) and Iinc,28 (upward-facing pyranometer). Thus, the
The sensor recorded temperatures underneath the test specimens at the location of maximum irradiation, see Figure 2. The temperature sensors utilized in this study are configured to record temperatures between −50°C and +140°C with a resolution of 0.1°C and an accuracy of ±0.3°C. Ain addition, thermal camera snapshots were taken, allowing for a two-dimensional analysis of the surface temperatures and location of the maximum surface temperature of each test specimen. The device has been calibrated to record thermal images within a temperature range of −20°C to 100°C with a resolution of <0.1°C and an accuracy of ±2°C. Recording surface temperatures using sensors was deemed unsuitable because of the direct irradiation of the lamp on the sensor, which would also be detected.
Two different cycles of each specimen were recorded. A distinction was made between a 17-h and a 22-h cycle, as shown in Figure 3. Each cycle was divided into illumination and cooling phases to simulate summer heat periods. Whereas, the 17-h cycle is characterized by alternating 2-h illumination phases and 1-h cooling phases, depicted in Figure 3 in red. The 22-h cycle includes 2-h illumination phases and longer cooling phases of 3 hs. Subsequently, the temperatures of the test specimens were monitored from the 12th hour of the cycle to complete cool down, shown Figure 3 in green.
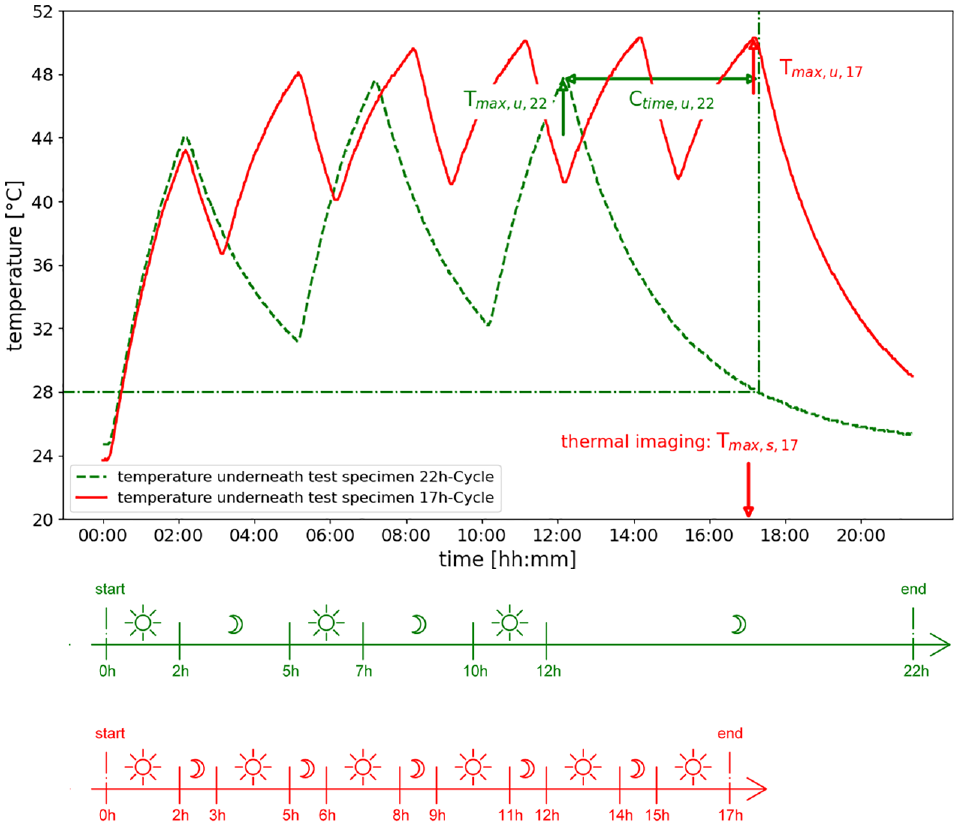
Comparison parameters and heat cycles of the recorded temperatures. (Color online only.)
Various parameters were implemented to interpret measurements of different mix designs. These parameters include albedo values (
Results and Discussion
Albedo
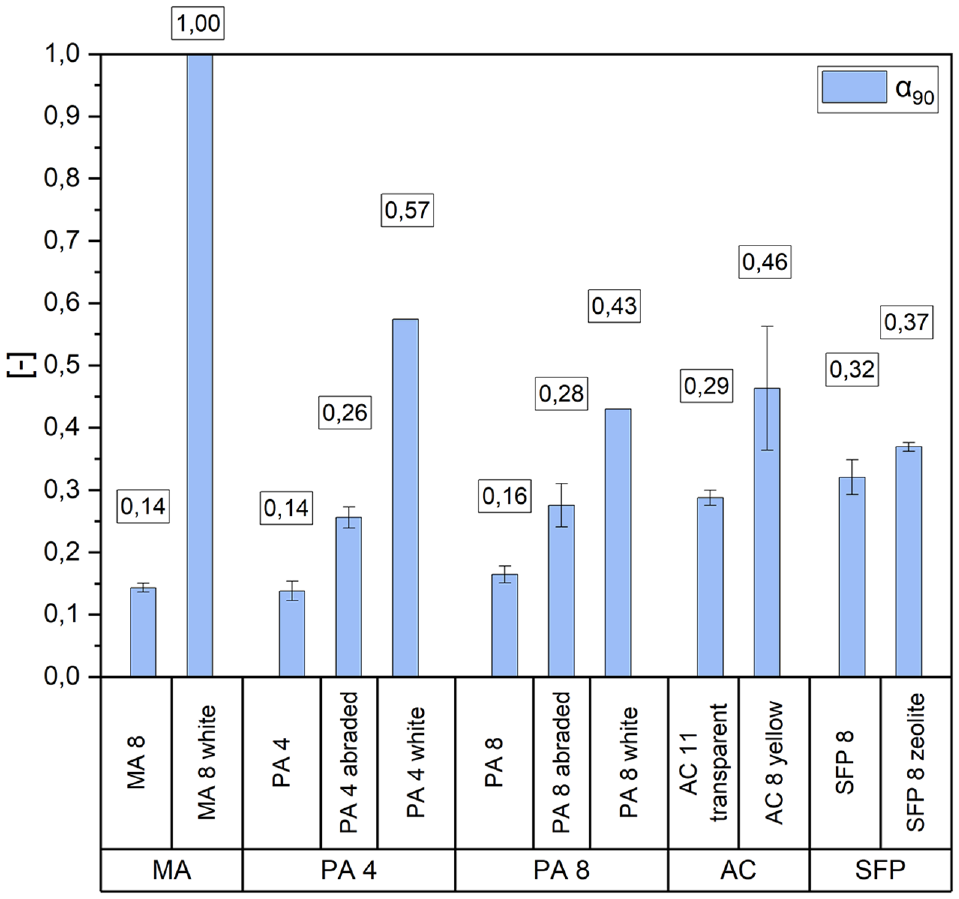
Figure 4 shows the albedo values analyzed using Equation 1. The numerical values refer to the average albedo (α90) obtained from two test specimens respectively. A clear demarcation of the test specimens with black surfaces can be identified. The unmodified asphalts PA 4, PA 8, and MA 8 displayed comparatively low α90 of 0.14 to 0.16. After sandblasting, the PA surfaces showed increased reflectivity (see PA 4 abraded and PA 8 abraded). However, both SFP had higher reflectivity than the abraded PA, with average albedo of 0.32 and 0.37. The zeolite enriched SFP exhibited higher albedo. By using a synthetic transparent binder, the albedo was roughly doubled compared with the conventional asphalt mixes PA 4, PA 8, and MA 8. The average albedo was 0.46 when yellow pigments and TiO2 were added. PA 8 white achieved values in the same order of magnitude. The test specimens PA 4 white, with smaller maximum aggregate size, showed averaged albedo of 0.57. Compared with PA 8 white with average values of 0.43. Albedo values of 1 were calculated for the MA 8 white samples using Formula 1. Regardless of the almost complete reflection of these test specimens, the values calculated using the approximated formula must be viewed critically. A complete reflection would indicate that the materials do not heat up at all, which is not the case.
Measured albedo.
This study supports the consensus that lighter surfaces have higher albedo. Preliminary statements can be made based on the color of the specimens, which is documented in Figure 1. The reflectivity of the AC specimens was increased by adding pigment and TiO2. However, it is unclear as to what extent the different additives contribute to this enhancement. Further studies are required to make a definitive statement. Similarly, the increase in reflectivity of the SFP zeolite cannot be explained without further investigation, even though it is suggested in literature, as mentioned in the introduction, that zeolite can enhance the reflectivity of the SFP ( 32 ).
When examining the white and therefore highly reflective surfaces (MA 8 white, PA 4 white, and PA 8 white), the degree of surface roughness has an immediate effect on the reflectivity. Owing to the smaller particle size of PA 4, the pores are also smaller than those of PA 8. Therefore, as the smoothness of the surface increases, so does the albedo of these test specimens with the same surface color. It must be noted that the color did not reach all visible aggregates of the test specimens. Therefore, darker spots still appeared within the colored porous materials. Nevertheless, the influence of surface roughness on the albedo is generally supported by international literature ( 43 – 46 ). Similar observations cannot be made in the abraded and unmodified state of those tested materials. As a result, this effect may be more prominent at higher albedos.
Temperatures
Figure 5 displays the maximum temperatures recorded during the two test cycles. The bar chart on the left illustrates the maximum temperatures measured on the surface of the test specimens during the 17-h cycle with thermal imaging. The bar chart on the right shows the maximum temperatures underneath the test specimens during the 17-h and 22-h cycle measured with a sensor. An average value for Tmax,u,17 and Tmax,u,22 was calculated and marked with an x. This strengthens the informative value of the maximum temperatures underneath the test specimens and facilitates comparison of the different materials by including four measurements instead of two. However, the values of the individual test cycles should be analyzed regardless.
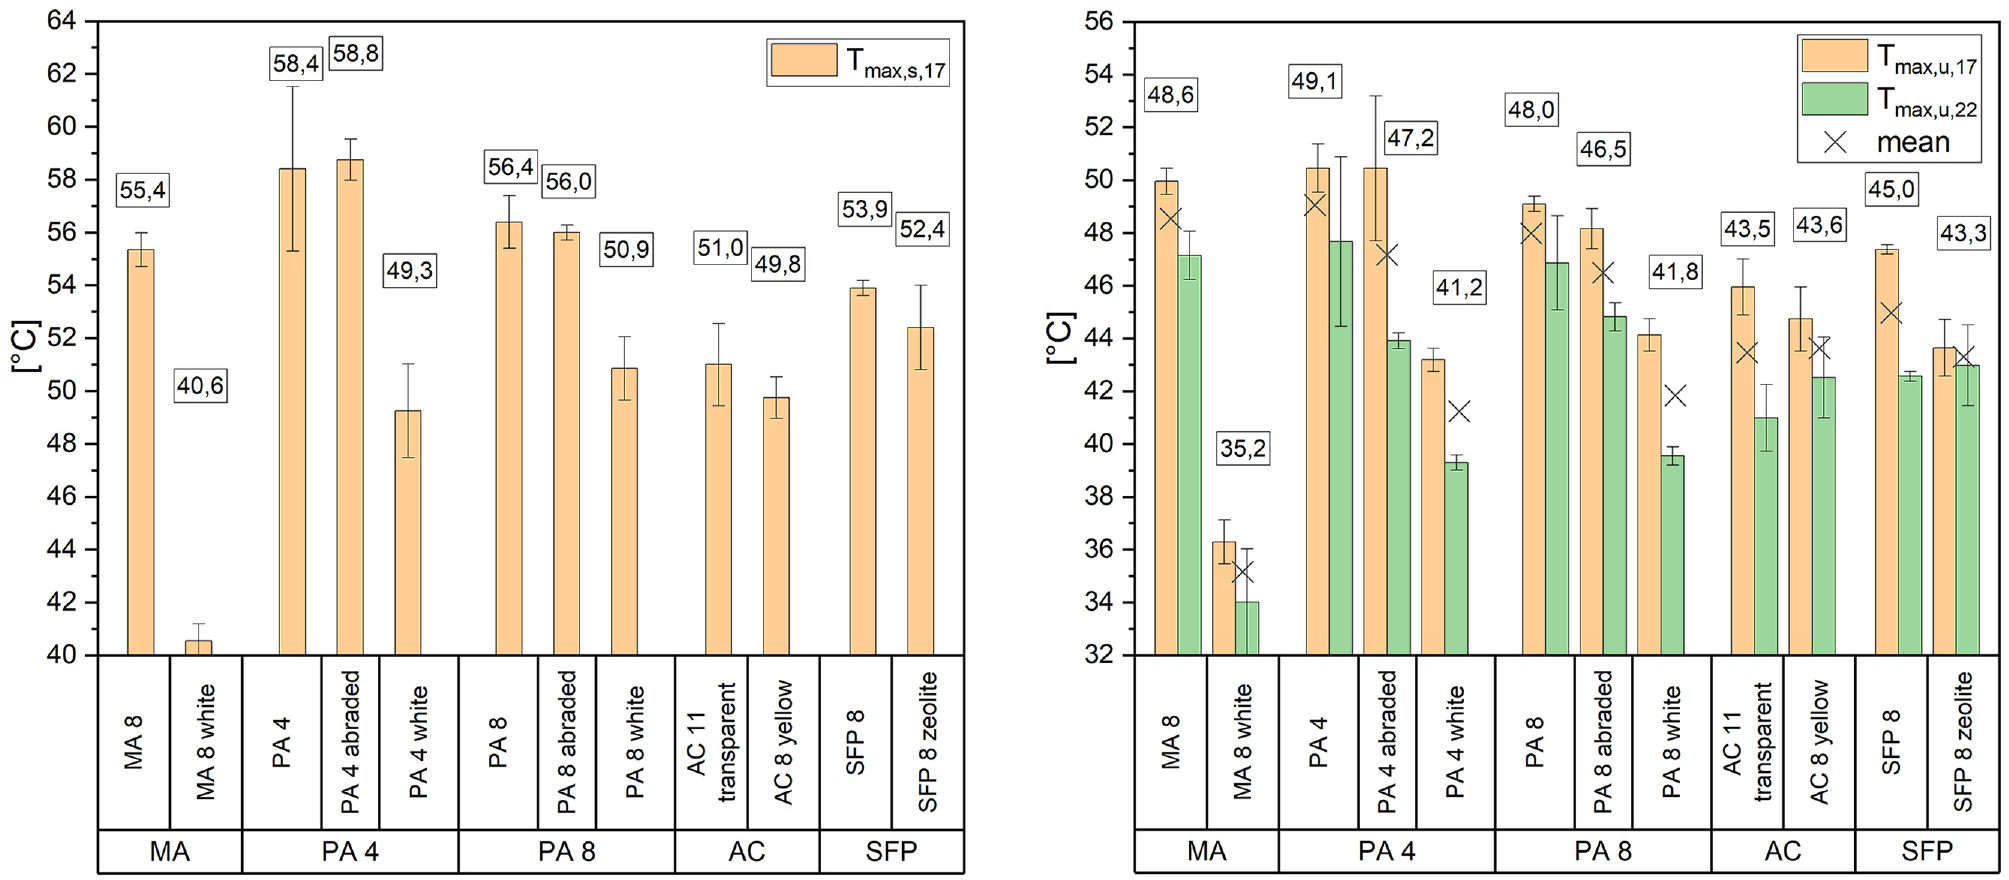
Maximum surface temperatures measured with thermal imaging (left) maximum temperatures underneath test specimen measured with sensor (right).
The porous asphalt mixes exhibited the highest surface temperatures (Tmax,s,17), while PA 4 had higher temperatures (58.4 ± 3.1°C) than PA 8 (56.4 ± 1.0°C). However, no significant temperature reduction on the surfaces was observed owing to sandblasting (PA 4 abraded [58.8 ± 0.8°C], PA 8 abraded [56.0 ± 0.3°C]). The surface temperature of the unmodified MA (55.4 ± 0.6°C) was slightly below PA 8 abraded, followed by the SFP mixes. SFP 8 zeolite (52.4 ± 1.6°C) showed lower average temperatures than SFP 8 (53.9 ± 0.3°C). PA 4 white (49.3 ± 1.8°C) and PA 8 white (50.9 ± 1.2°C) had similar maximum surface temperatures as the AC 8 yellow (49.8 ± 0.8°C), whereas AC 11 transparent (51.0 ± 1.6°C) averaged 1.2°C higher than AC 8 yellow. The lowest temperature was achieved by far for the MA 8 white (40.6 ± 0.6°C).
Similar trends can be observed when looking at the average temperatures measured underneath the test specimen, as shown with parameters Tmax,u,17 and Tmax,u,22. The temperature difference between the black surfaces (MA 8 [Ø 48.6°C], PA 4 [Ø 49.1°C], and PA 8 [Ø 48.0°C]) is not as noticeable as it was on the surface. Regardless, the highest temperatures were observed in relation to these materials. The temperature difference between the porous asphalts (PA 4 and PA 8) and the sandblasted ones (PA 4 abraded [Ø 47.2°C] and PA 8 abraded [Ø 46.5°C]) is more prominent than when looking at the surface temperature with an average difference of 1.5°C or more. Following the PA samples are the asphalt concrete and semi-flexible pavements. However, it is not possible to determine a significant difference between the average temperatures underneath the test specimens of AC 11 transparent (Ø 43.5°C) and AC 8 yellow (Ø 43.6°C). An average temperature difference of 1.7°C was observed between SFP 8 (Ø 45.0°C) and SFP 8 zeolite (Ø 43.3°C), which is more prominent. The test specimens colored in white (MA 8 white [Ø 35.2°C], PA 4 white [Ø 41.2°C], and PA 8 white [Ø 41.8°C]) recorded the lowest temperatures, with MA 8 white exhibiting the lowest temperature.
The 17-h cycle is characterized by shorter cooling phases. This explains why the temperatures measured during this cycle are higher than those of the 22-h cycle. The difference in mean temperatures between the two cycles varies from material to material. This reinforces the importance of differing between heat cycles and duration in future studies. A gap between the bar charts of the two cycles is noticeable for certain mix designs, like PA. This phenomenon could be density related. At the same time, other factors are probable to measure in. For instance, there is almost no gap within the SFP 8 zeolite measurements visible. In comparison to that, the SFP 8 specimens indicating a gap of more than 4°C. Therefore, it is feasible, that the added zeolite influences the thermal behavior intricately. As mentioned in the introduction, there are studies focusing on the effect of zeolite in more detail ( 32 , 34 ). Similarly to those studies, an improvement of the temperature evolution by adding zeolite can be confirmed. However, as depicted in Figure 5, under dry conditions the average difference in temperatures between SFP 8 zeolite and SFP 8 is limited to roughly 2°C in this study. In addition to the investigation of the thermal behavior of the SFP, the water storage capacity of the test specimens was measured. SFP 8 zeolite specimens demonstrated a water storage capacity of 3.3 wt.% in average. Compared with that SFP 8 had a water storage capacity of 2.2 wt.%. Yet, it is still unclear to what extent this increase affects the overall heat mitigation abilities of the SFP 8 zeolite in a post-precipitation scenario.
Furthermore, Figure 5 shows that the addition of yellow pigment and TiO2 has a positive impact on temperatures during the 17-h cycle, both on the surface and underneath the test specimens. However, the effect of TiO2 and pigment cannot be determined individually. Investigating this would require further studies. Within the scope of this study, the thermal benefit of the additives cannot be detected during the 22-h cycle. A plausible explanation for this can be found in the non-linear nature of the material’s cooling and heating behavior, since the two cycles vary primarily concerning their cooling time. Further investigation of this can be found when discussing the cooling time (Ctime,u,22) of the materials later on.
Adding pigments and TiO2 to the mixture enhances the durability of the surface color of the pavements. Compared with that, coatings can abrade quickly. The white coloring of surfaces in this study was investigated mostly to estimate the influence of reflectivity. Among the remaining materials, AC and SFP show low maximum temperatures. Interestingly, the sandblasting process for black surfaces resulted in higher albedo, but did not result in significantly lower temperatures. The sandblasting of the PA resulted in higher albedo, but a decrease in temperatures compared with the untreated PA was limited. Furthermore, according to literature, porous materials tend to insulate thermally under dry ambient conditions, leading to higher surface temperatures ( 1 , 11 , 47 ). This would explain why PA showed higher temperatures than MA.
Correlations
After showcasing the results and discussion of the temperatures and albedo of the 12 materials, a correlation between the surface temperatures and the temperatures underneath the specimens was assumed. The correlation between the two measured temperatures for the 17-h cycle is depicted in Figure 6 on the left. In addition, a correlation between albedo (α90) and the surface temperatures Tmax,s,17 was anticipated, seen on the right side of Figure 6.
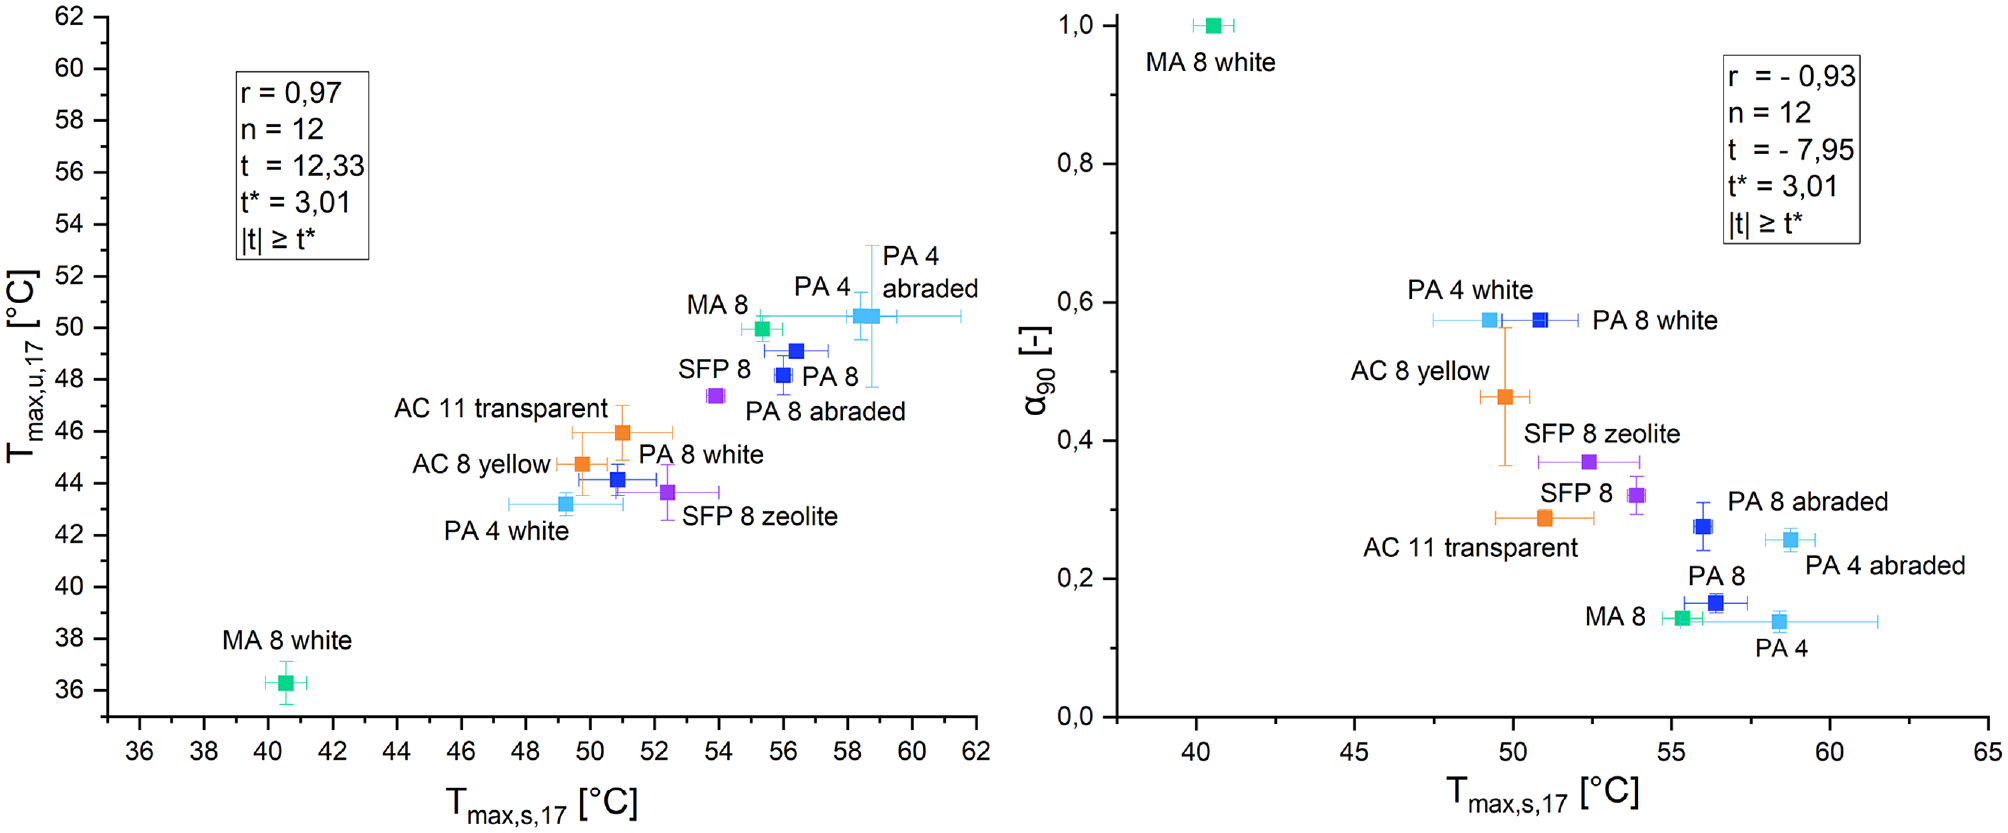
Correlation between maximum surface temperatures and maximum temperatures underneath test specimens (left); correlation between maximum surface temperatures and albedo (right).
To determine if the correlations can be seen as statistically significant the linear correlation coefficient according to Pearson (r) was calculated. With r being defined as: −1 ≤ r ≤ 1. In the case that r = 0 no correlation is evident, while a value of +1 describing absolute positive linear correlation and −1 an absolute negative linear correlation, respectively. For testing the hypothesis via t-statistics, the t-value can be calculated with the aforementioned variables. Therefore, the number of samples under investigation is defined as n. As commonly used, a two-sided rejection region with a probability of 0.01 was investigated. With the help of a t-table it can be found that the probability of |t| ≥ 3.012 is equal to a probability of 0.01. In this case the null hypothesis can be rejected, and the alternative hypothesis is feasible and can be accepted. A significant correlation can be assumed ( 48 – 50 ).
All the above-mentioned results are documented in Figure 6. The experiments made statistically valid attempts at the detection of a correlation between Tmax,u,17 and Tmax,s,17, as well as Tmax,s,17 and α90. In both cases the correlation can be seen as a significant linear correlation and the possibility of the null hypothesis being rejected erroneously is less than 1%.
In addition to evaluating the correlation statistically, it can also be analyzed graphically as depicted in Figure 6. Both correlation diagrams show a clear group formation. MA 8 white stands out from the other materials. Followed by the porous, white colored asphalt mixes. The next group consists of asphalt concrete and semi-flexible pavements. The group comprising black and sandblasted surfaces represents the final subgroup with the highest temperatures and lowest albedo. Since the investigated specimens have a height of 4 cm, the linear correlation between the temperatures is not surprising. With thicker plates the comparison of the surface temperature to the temperature underneath the specimens is unlikely to be linear. The linear correlation found between Tmax,s,17 and α90 may be limited to the investigated materials. Nevertheless, it can provide a useful approximation for informing subsequent research endeavors focusing on similar materials.
Cooling Time
As already mentioned in the discussion of the temperatures, the cooling time can influence the materials maximum temperatures. Therefore, Figure 7 displays the cooling time to +28°C (Ctime,u,22) during the 22-h cycle, measured using the sensor underneath the specimens. Ctime,u,22 defines the time required for the material to cool down from its maximum temperature to 28°C. It is important to note that materials with high maximum temperatures store more heat energy, which later can be released during the cooling phase. The cooling process is non-linear, as shown in Figure 3. Therefore, interpreting the cooling time to a threshold is more appropriate than considering the cooling rates in this case.
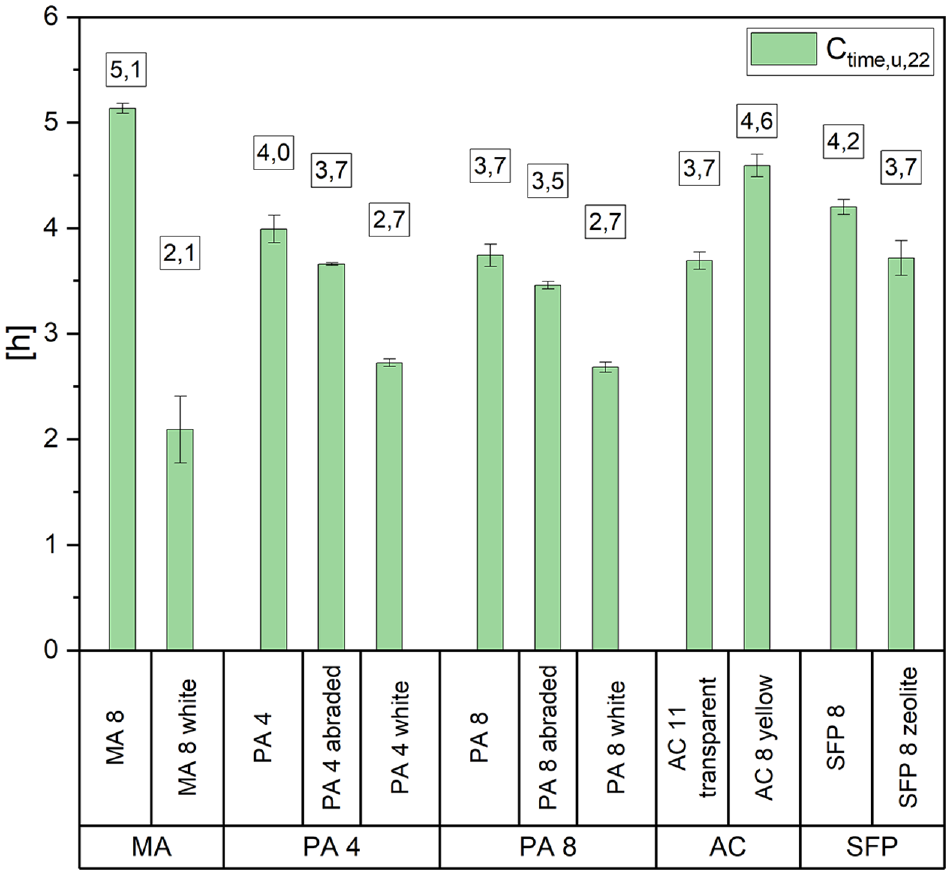
Cooling time to 28°C underneath test specimens measured with sensor.
The MA 8 took the longest to cool down to +28°C at 5.1 h, followed by the AC 8 yellow. Similar cooling times of 3.5 to 4.2 h were observed for the semi-flexible pavement mixes, AC 11 transparent and porous asphalts with black or sandblasted surfaces. The rapid cooling of the porous asphalts is particularly noteworthy, as they cooled down from respectively high temperatures (see Figure 5) to +28°C in under 4 h. The MA 8 white test specimens were the fastest to reach the threshold temperature with 2.1 h. However, these specimens took a long time to cool as they only had to drop in temperature by approximately 6°C from +34°C during the 22-h cycle.
This suggests a relationship between density and cooling behavior. The mastic asphalt mixes have a high density owing to the high proportion of added fines (21.4 wt%) and binder (8.7 wt%) (see Table 1) and low air void content. AC 8 yellow is assumed to have a higher density than the coarser grained AC 11. Conversely, porous asphalts have a lower density owing to the porosity of up to 25%. Therefore, they also have faster cooling properties.
Conclusions
This study investigated various cool pavements under constant laboratory conditions. To achieve this, a test stand was designed to measure albedo, maximum temperatures on the surface and underneath the test specimens, as well as cooling times. These parameters were quantified by the implementation of various parameters during two different heat cycles. Twelve materials were tested in total. Therefore, this study offers a direct comparative analysis of a wide range of materials that are potentially applicable in mitigating the UHI effect.
The findings of this study are divided into two categories. On the one hand, findings of other studies in international literature can be confirmed:
A distinction can be made between smooth and rough surfaces when considering the type of reflectivity of such materials. While rough surfaces have an increased diffuse reflection compared with smooth surfaces, which primarily inhibit specular reflective properties, Materials with smooth surfaces typically have cooler surface temperatures than rough surfaces. This can also be observed with materials such as MA 8 white and MA 8 compared with rougher surfaces such as the porous asphalts.
The cooling capacity of materials is affected by their density. Porous materials showed accelerated cooling behavior.
The presence of air voids in porous asphalt is associated with elevated surface temperatures. Voids serve as thermal insulators under dry conditions. In this study, PA 4 and PA 8 exhibited the highest surface temperatures out of all the materials that were tested. However, it should be noted that the observed change in surface temperature may also be attributed to the diffuse reflection of rough surfaces, as previously discussed.
Changing the color of a material without altering any other properties can enhance reflectivity and, therefore, reduce surface temperatures. This was shown through the immense reduction in surface temperatures for the white painted materials (PA 4 white, PA 8 white, and MA 8 white). However, past studies have shown that high and focused reflectivity leads to high near-surface air temperatures which negatively affect well-being and health of vulnerable road users.
SFP 8 zeolite showed higher albedo than SFP, which supports the thesis that zeolite enhances the reflectivity ability of the cement slurry introduced to the SFP.
Zeolite has been identified as a potential enhancer of semi-flexible pavement’s thermal behavior in heat mitigating efforts. However, in this study, the difference in average temperatures between SFP 8 and SFP 8 zeolite was limited to 1.5°C on the surface and 1.7°C underneath the test specimens. Notably, the temperatures were recorded under dry conditions. Variations in humidity levels could yield larger temperature differences.
Mastic asphalt is not recommended for cities fighting UHI. The reference asphalt performed poorly, with high temperatures recorded both on the surface and underneath the test specimens, as well as long cooling times.
On the other hand, this study has uncovered new findings:
SFP and AC tested in this study exhibited similar maximum temperatures. With exception of the cooling time of AC 8 yellow, all SFP and AC demonstrated effective thermal behavior in mitigating heat. However, as evidenced by the results, the reduction in average temperature achieved by these materials is limited. A comparison of these materials with the reference asphalt (MA 8) revealed a reduction in surface temperature ranging from 1.5°C (SFP 8) to 5.6°C (AC 8 yellow), while the temperature underneath the specimens exhibited a reduction ranging from 3.6°C (SFP 8) to 5.3°C (SFP 8 zeolite).
Abrasion of porous asphalts by sandblasting had a minimal effect on the temperatures, even though the albedo was increased.
A significant linear correlation between albedo and surface temperatures was detected. This correlation cannot be generalized but can serve as an approximation for future studies.
The difference in temperatures between the cycles reinforces the importance of distinguishing between heat cycles and duration in future studies. This supports the assumption that cooling times influence the material’s maximum temperatures. Adapting the test cycle to the solar phases of a specific region can aid in identifying a suitable cool pavement for that area. This approach considers the non-linear thermal behavior of the material and allows for higher accuracy in investigating the heating and cooling times.
The versatility of the developed test stand used in this study allows adjustments to be made to several variables, including heat cycles, irradiation intensity, light source, and the potential expansion of the experimental setup to include moisture testing and infrared light. For future experiments, such adjustments would be of interest. Nevertheless, the purpose of this study was to provide an experimental comparison of the thermal behavior of a wide range of cool pavement materials. A considerable body of literature exists on the subject of cool pavements. However, there is a paucity of direct experimental comparison of different materials in international literature, making this study a valuable contribution to selecting appropriate pavement materials for UHI mitigation. Regardless, it is of great importance to continue finding ways to achieve resilience toward a more sustainable climatic environment in urban areas.
Footnotes
Author Contributions
The authors confirm contribution to the paper as follows: study conception and design: Sophie Stüwe, Bernhard Hofko; data collection: Sophie Stüwe; analysis and interpretation of results: Sophie Stüwe, Bernhard Hofko; draft manuscript preparation: Sophie Stüwe. All authors reviewed the results and approved the final version of the manuscript.
Declaration of Conflicting Interests
The authors declared no potential conflicts of interest with respect to the research, authorship, and/or publication of this article.
Funding
The authors received no financial support for the research, authorship, and/or publication of this article.