
Abstract
Multiple sensing technologies exist for advanced driver support and driving automation systems. Car manufacturers combine different solutions to increase the robustness and operational capabilities of driving automation technology perception systems. One sensing method that did not achieve high market penetration with respect to other solutions is the thermal camera. Thermal cameras can operate in low-light and high-contrast conditions as they do not need external sources of illumination. Instead, they are sensitive to the infrared radiation emitted by any surface above 0 K. Thus, thermal cameras can be a suitable candidate to compensate for the weaknesses of visible cameras. To establish the potential benefit of thermal cameras for pedestrian protection, this paper reports on an experiment using state-of-the-art thermal imaging sensors. The authors’ scientific effort includes a characterization of the infrared sensor capability to identify pedestrians when coupled with a detection algorithm and provides a simulation-based investigation of the potential safety benefits of thermal camera adoption. The analysis additionally includes a heuristic characterization of the detection capabilities of a passenger car equipped with visible cameras to provide a baseline comparison. Ultimately, the thermal sensors return noteworthy detection capability that could lead to a potentially significant improvement in road safety on rural roads provided that the sensor has sufficient resolution.
State-of-the-art advanced driver assistance systems (ADAS) and automated driving systems (ADS) make extensive use of several sensors to feed the decision-making algorithm with the necessary information to enable driving assistance or automation. Each sensing solution has its advantages and disadvantages. For instance, visible cameras can deliver high-resolution images with color information, but they need external lighting sources to operate and might suffer from glare and blooming effects ( 1 ). Similarly, radars can provide long-distance obstacle detection, even in the presence of occlusion ( 2 ), regardless of the luminosity conditions. However, they have limited spatial resolution. Conversely, LiDARs return high-density point clouds, but the sensing capability deteriorates in bad weather conditions. Given the current unavailability of an overarching sensing solution capable of covering all the use-cases needed for automation, vehicle manufacturers typically rely on combinations of sensors working together via fusion algorithms.
One sensing system that does not appear to be frequently adopted is the thermal camera. Thermal cameras are sensitive to infrared electromagnetic light between 8 and 14 µm. The infrared spectrum is characterized by a longer wavelength than the visible spectrum (400–700 nm), thus being invisible to the human eye. Infrared radiation is emitted by almost anybody at a temperature exceeding absolute zero. As such, thermal sensors can perceive objects without needing external illumination as opposed to visible cameras.
One key benefit of thermal cameras is the capability of detecting vulnerable road users (VRUs) at late night and in low-visibility conditions. Indeed, VRU fatalities represent more than half the total number of road casualties, and pedestrians alone are roughly 20% of the total share of deceased as of the 2021 European Commission report ( 3 ). Similar figures apply to the United States ( 4 ). According to the CARE database ( 5 ), in the European Union, 24% of fatal accidents involving pedestrians take place on rural roads where road illumination might not be present and the relative majority of occurrences take place during the winter months.
Thus, there might be cases where even the most recent vehicles featured with sophisticated ADAS, such as the advanced emergency braking system (AEBS) for pedestrian protection, might fail to safely handle road conditions because of the unavailability of a perception system capable of operating in low light. In fact, the current legislation regulating AEBS is UNECE Regulation 152 ( 6 ) that mandates type-approval testing to be carried out with a minimum ambient illumination of at least 2,000 lx in the pedestrian scenario (1,000 lx for the car-to-car cases) without blinding lights. Such an illumination level corresponds to daylight conditions. Moreover, the AEBS should be tested in the speed range of 20–60 km/h and collision avoidance is mandated up to 40 km/h, whereas different mitigations of impact speed should be produced depending on the payload, which results in the “shark fin” curve shown in Figure 1.
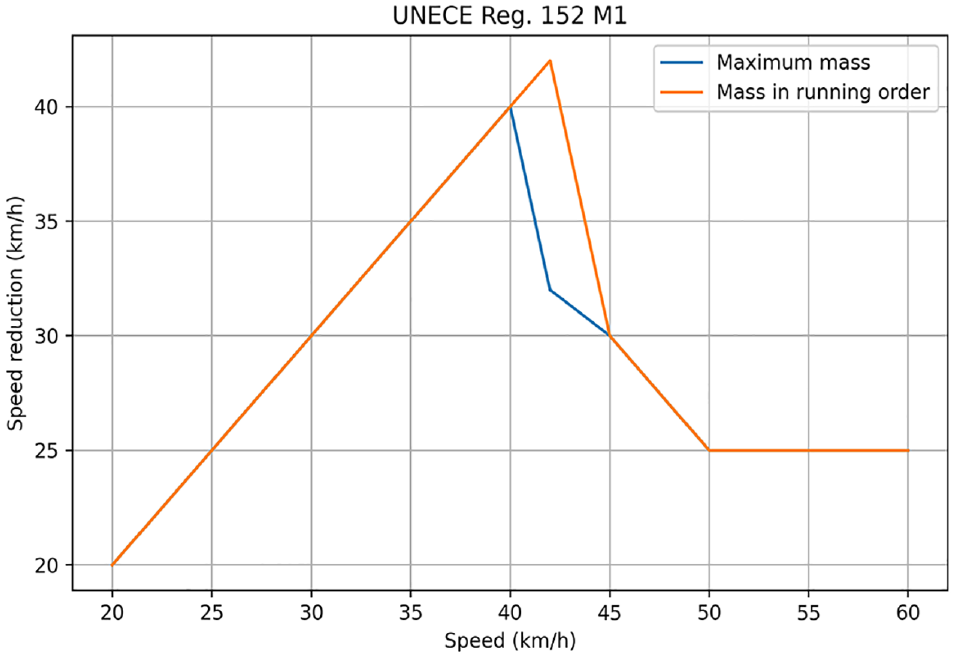
UN-R152 braking requirements.
On the other side, the European New Car Assessment Programme (Euro NCAP) started to assess the performance of commercial AEBS in low-light conditions in their latest testing procedures for VRU protection ( 7 ), although still in the same speed range as UN-R152.
Conversely, before a potential amendment of the legislation removing the requirement on minimum illumination (implying a vehicle should always be able to stop regardless of illumination) can take place, it is necessary that policymakers are provided with impartial and high-quality scientific evidence demonstrating that cost-effective sensing solutions are available to address such a potential safety gap.
The present contribution investigates the safety benefits of introducing thermal cameras for detecting pedestrians in a Euro NCAP-style ( 7 ) pedestrian crossing scenario. The scientific effort leverages the independent experimental evidence collected at the Joint Research Centre (JRC) for the European Commission in Ispra, Varese, Italy, using two thermal imaging sensors having different resolutions. The detections collected were compared with the detections from a commercial passenger car that exploited traditional vision-based cameras. The experiments were repeated during different times of the day and for different spacings of the pedestrian crossing to also factor in the degradation of detection performance owing to the relative distance. Eventually, based on the estimated detection capabilities, the safety impact of adopting thermal cameras is envisaged by coupling the perception with the state-of-the-art decision-making model, fuzzy surrogate safety model (FSSM) ( 8 ). Overall, this study has a twofold contribution. First, we provide an experimental characterization of the detection capabilities of two cost-effective infrared sensors in comparison with a commercial passenger car’s performance for a wide range of testing environments. Second, we give the thermal vision setup a quantitative safety assessment using a simulation-based approach that relies on an established safety performance model. The approach is novel as, typically, the distance to the target is overlooked when establishing the detection capabilities of a perception system in favor of computer vision-inspired metrics that do not directly address the safety implications. It shall be clarified that the distance is here obtained from ground truth measurements whereas, in a real-world scenario, the target-to-bumper clearance will have to be estimated using either a stereo camera configuration or via camera–radar fusion. That is because of the limitations of a mono-camera setup, regardless of whether the same can sense the visible or the infrared spectrum. Moreover, most literature does not provide tangible safety arguments informed by the empirical findings supporting the implication of a perception system.
Relevant Literature
This section summarizes the most important contributions of thermal camera applications in the driving automation and pedestrian detection algorithms. The present contribution stands out from the cited literature by accounting for the distance to the VRU and providing a simulation-based framework to quantitatively assess the implication of thermal cameras. Although some works report the size of the target as pixels in the frame, it is impossible to infer the relative distance of detection without detailed information about the focal length. This makes estimating the increase in potential safety for different speed/reaction times unattainable. Additionally, the work leverages modern neural network detection algorithms trained to operate in the infrared domain in contrast with many classical computer vision approaches discussed.
Thermal Cameras in Automotive Applications
The topic of thermal cameras for VRU protection is not a novelty in the literature. A review by O’Malley et al. ( 9 ) in 2008 analyzed different perception algorithms that could be used to detect VRUs in the infrared domain.
A contribution closely related to our scientific effort was proposed by Krotosky and Trivedi ( 10 ) in 2007. In particular, the authors carried out an experimental assessment of the effectiveness of several imaging solutions in pedestrian detection, including thermal, visible, and multimodal-stereo solutions. Their work suggests that a multimodal trifocal setup would provide the best performances.
Similarly, Chen and Huang ( 11 ) studied a setup relying on a stereo camera combined with a thermal camera for detecting pedestrians. The focus of the work is on feature extraction for increased performance. However, both works ( 10 , 11 ) do not consider the degradation of performance of distance and the reduced effectiveness of visible cameras as illumination drops at night.
Dai et al. ( 12 ) compared the effect of detecting pedestrians using different infrared wavelengths from near-infrared in the range of 0.65–0.85 µm to the long-wave infrared (LWIR) in the range of 7.5–13 µm. Concerning the near-infrared camera, the authors reported 95% for target distances up to 50 m. Unfortunately, the work does not report which focal length was used for the assessment. Thus, the field of view cannot be estimated to compare the findings with our contribution.
The deterioration of thermal sensor capability to detect objects with relative distance was studied by Savastürk et al. ( 13 ), although in the context of vehicle detection and not VRU detection. Likewise in our study, a 0.3 Mpx (VGA resolution) thermal camera was used that returned a detection rate of more than 60% for vehicles as far as 150 m.
A more recent survey summarizing applications for thermal cameras in the automotive fields was presented by Farooq et al. ( 14 ), as a result of the European project. The work divides infrared camera applications into “in-cabin” and “forward vision” solutions. For in-cabin applications, driver/passengers status identification and face recognition are identified as the strongest use-cases. Conversely, forward-looking sensors are used for object detection, in a similar way to our approach and image segmentation. Nonetheless, the object detection algorithm presented in the survey does not investigate the impact of distance in the detection assessment, which we demonstrate here to play a crucial role.
Thermal vision is not always used as a stand-alone sensor. In fact, there are state-of-the-art literature contributions where fusion-based solutions are suggested that leverage infrared vision. For instance, thermal vision has been combined with stereo vision by Chen and Huang ( 11 ). Using a comparable setup, Chadli et al. ( 15 ) suggested adopting a gated approach to fuse infrared and vision-based frames at the detection level. The approach delivers comparatively stronger detection performances for precision and robustness to false positives. Nonetheless, thermal cameras can also be fused with active perception systems, such as radar, as achieved by Bhadoriya et al. ( 16 ). Finally, Choi and Kim ( 17 ) accomplished the integration of thermal vision with a LiDAR sensor. The approach required manufacturing a three-dimensional target for extrinsic calibration but produced a perception system capable of tangible recall and precision improvements at nighttime for a visible camera plus a LiDAR fusion system.
Eventually, for modern infrared sensing technology, two solutions dominate the market ( 18 ):
Uncooled sensors (microbolometers): cheaper and more robust because they do not necessitate external cooling, but return low-quality images;
Cooled sensors: deliver the highest quality image but necessitate cryogenic cooling to remove the thermal noise generated by the sensor itself to properly operate.
In this work, we make use of uncooled sensors because of the lower cost that would be compatible with the price tag of automotive industry-used sensors and thus scalable for a large market adoption.
Pedestrian Detection Algorithm
Another relevant line of research is connected to the perception algorithms used for pedestrian detection. We report here a brief summary of the main contributions in literature, given that our research is mostly focused on sensing technology rather than on a specific detector.
Baek et al. ( 19 ) investigated traditional computer vision-based algorithms for pedestrian detection using thermal cameras. Their study suggested that using dedicated kernels for features extraction can give better performances than vision-based kernels.
Khatab et al. ( 20 ) in the survey work reported how, among the convolutional neural network (CNN) approaches, faster region-based CNN delivered the best accuracy performance but required more computational time. Conversely, the You Only Look Once (YOLO) algorithm is recommended when computational time is of the highest priority.
Ragesh and Rajesh ( 21 ) noted how the performances of detector algorithms are still not in line with ISO 26262 ( 22 ) when it comes to the reliability needed for automotive applications.
Pedestrian detection algorithms relying on CNN explicitly tuned for thermal cameras have been discussed by Farooq et al. ( 23 ). The authors noticed how the YOLO-v5 framework provided the best performances and could run in real-time on dedicated graphics processing units. Also of particular relevance is the role of data sets supporting the training of CNN in the infrared domain as pointed out by Chadli et al. ( 15 ).
Thermal sensors are also stated to be particularly efficient in determining the number of pixels needed for detection. In particular, it has been reported that a bounding box of 20 × 8 pixels can result in detections with more than 90% of confidence ( 24 ).
Methods
This section reports the methodological approach used to characterize the thermal sensors, establishing a comparison with the visible cameras and inferring the safety implications using a simulation-based driver model.
Thermal Imaging Sensors
Two uncooled microbolometer-based thermal imaging sensors were exploited for the assessment:
QVGA resolution camera (based on 320 × 240 pixels ATTO320 12-µm pitch sensor from Lynred) operating in the LWIR equipped with a 6.2-mm f/1.0 Umicore lens delivering a horizontal field of view (HFOV) equal to 36°;
VGA resolution camera (based on 640 × 480 pixels ATTO640 12-µm pitch sensor from Lynred) LWIR equipped with a 14-mm f/1.0 Umicore lens delivering an HFOV equal to 31°.
The two cameras deliver one-channel 16-bit color depth raw images. These images are post-processed to be corrected with a shutterless algorithm. The corrected images can be converted into a grayscale 8-bit image for on-screen visualization and for the neural network inference process. The sample rate was 30 frames per second (fps) common to both cameras. The sensors were enclosed in a weather-proof case and mounted on the top of a supporting vehicle during testing.
Thermal Cameras Perception Algorithm
Common to both the thermal cameras was the post-processing phase where a ResNet50 ( 25 ) neural network was used to detect humans in the frame. The residual network has been retrained to better perform on one-channel thermal images by the authors on a small data set containing less than 5,000 samples. Training on a larger data set would have yielded better detection performance.
The algorithm returns bounding boxes surrounding objects in the frame that are classified as humans. An example of the inference process is provided in Figure 2. The left-side image of Figure 2 illustrates the 8-bit thermal camera output following a correction process to reduce the imaging static noise and distortion. In the right-side image, the detection outcome is shown where the green box is the detected pedestrian with the corresponding x and y coordinates. At the bottom, the set of detections associated with the frame (“image_0000003.png”) are shown, with the corresponding x, y, and confidence. More than one detection per frame, such as in this case, can be returned by ResNet50. However, a threshold has been adopted to reject false positives. Throughout the tests, a minimum 60% confidence level has been set to accept the pedestrian detection as valid.
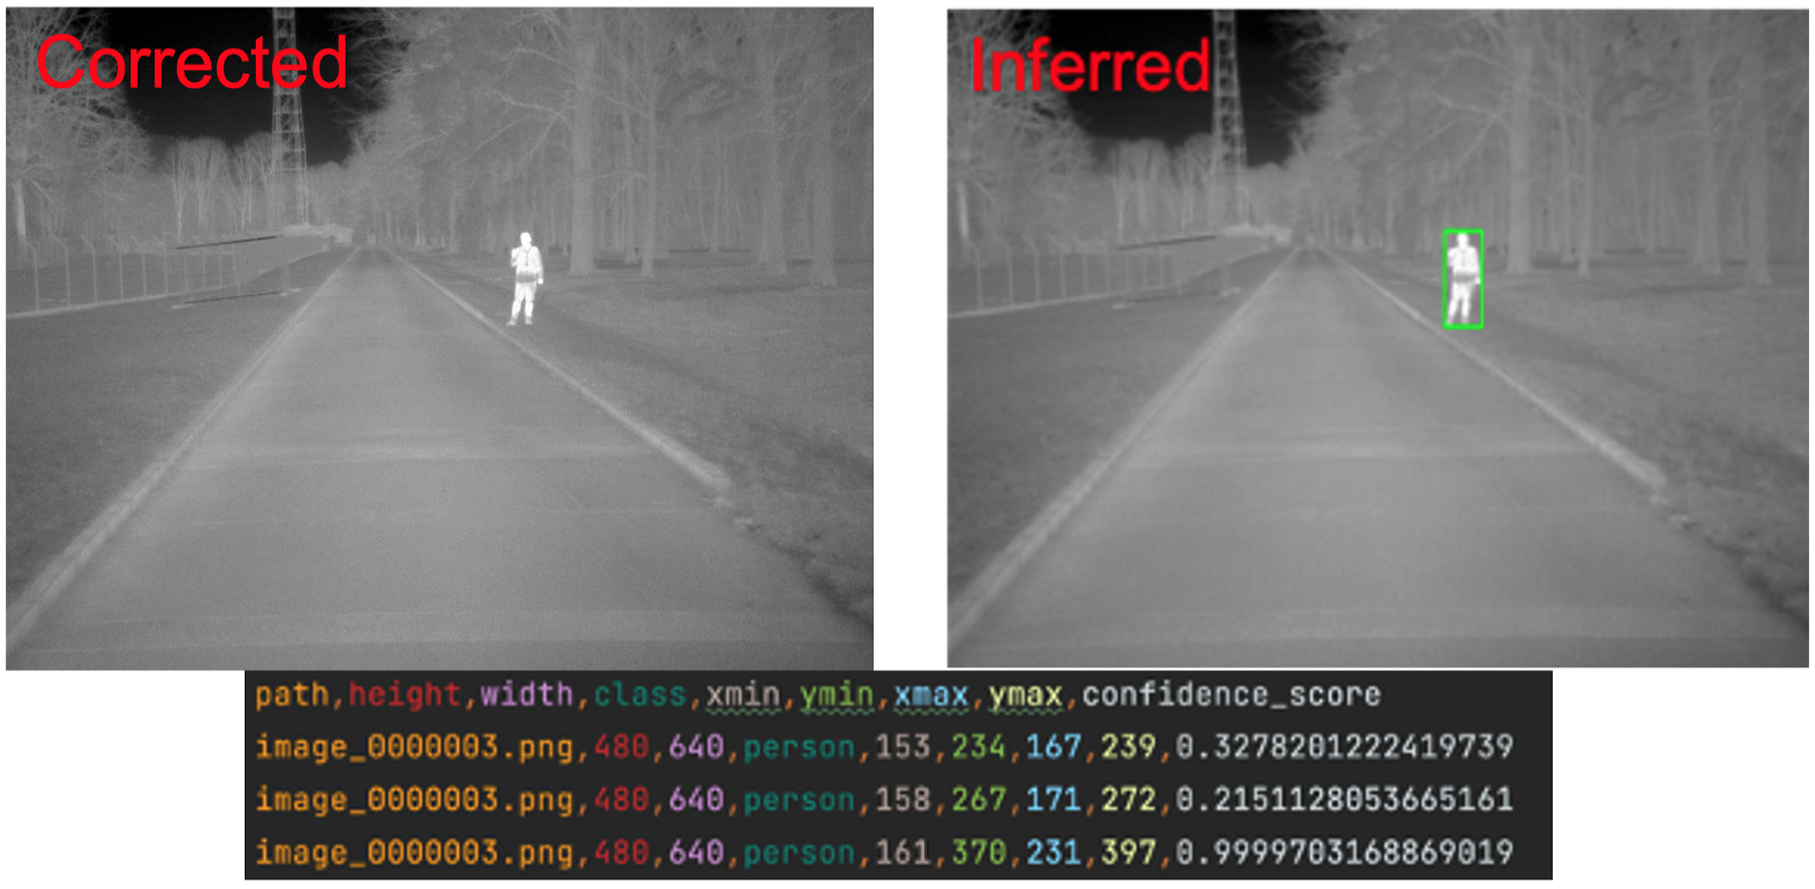
Inference process outcome.
Benchmarking Conventional Perception System
We included in the evaluation of the thermal sensors a conventional vehicle equipped with state-of-the-art ADAS. In particular, the reference vehicle is featured with a trifocal front-facing high-resolution camera setup where the three cameras have different HFOV to cover wide (short-range) and narrow (long-range) use-cases.
To evaluate the detection capability of the given sensor setup, we noted when the onboard human–machine interface (HMI) displayed a pedestrian profile on the main dashboard. This approach was the only feasible way to proceed as it was not possible to access the perception data generated by the vehicle because of the proprietary nature of the in-vehicle message exchange protocol.
Whenever the pedestrian outline was displayed throughout the full duration of the experiment, we assigned a perfect detection probability to the corresponding experiment. If the pedestrian was displayed for a few frames only, we assigned a detection probability equal to 0.5, whereas if the target never appeared we gave zero detection probability.
Reference Scenarios
The basic scenario setup is shown in Figure 3. A vehicle equipped with thermal cameras was positioned in the middle of the lane facing a standing pedestrian on the lane’s margin (either left or right). The conventional vehicle was placed next to the vehicle equipped with thermal cameras to match the target distance. Both vehicles remained stationary throughout the tests.
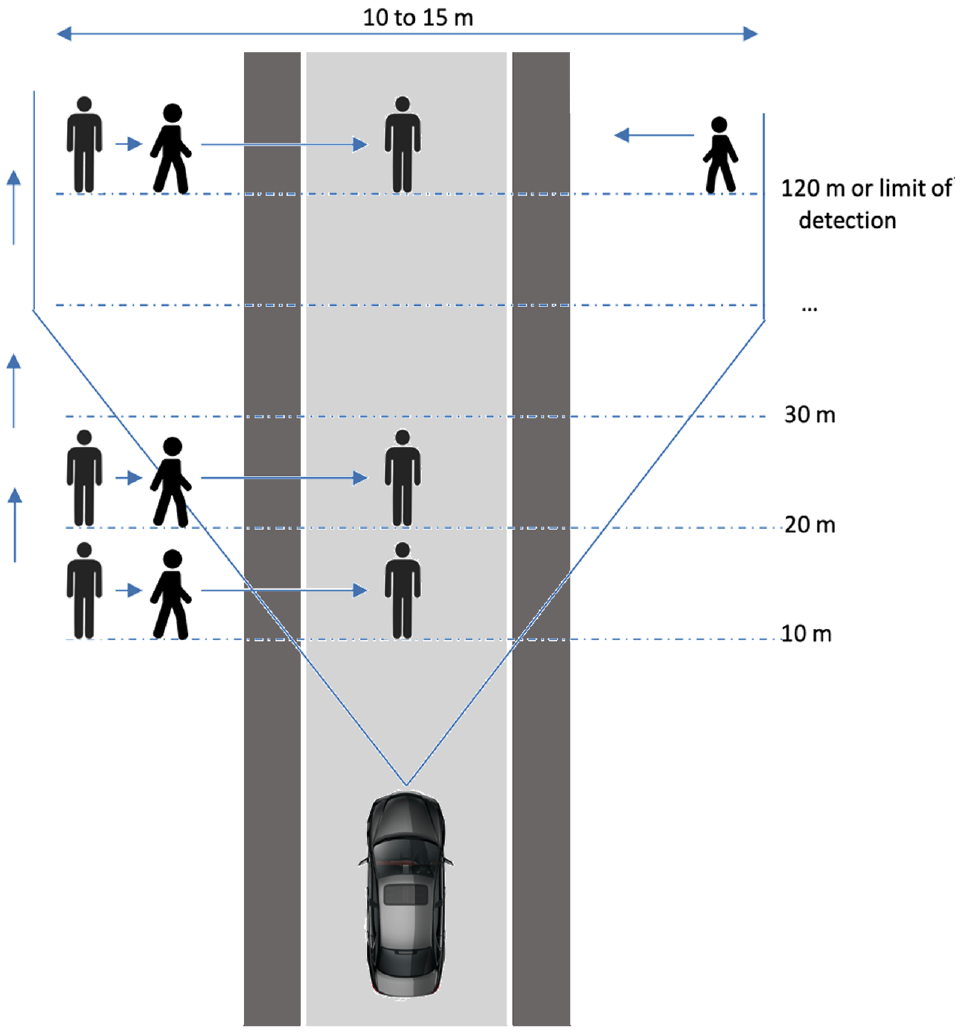
Pedestrian scenario crossing schematic overview.
As the thermal imaging sensors are not linked to the AEBS intervention, the objective of the analysis was not to verify the actual capability of avoiding a collision. Instead, the objective was to provide a quantitative assessment of the detection capability of thermal cameras compared with the detection returned by the conventional vehicle. The experiments begin when the pedestrian starts to cross the road and end when they have accomplished the lane crossing.
The experiment was carried out in March 2023. The temperature outside ranged from 6°C to 18°C and humidity from 38% to 93%. We recorded a total of 207 scenarios. These scenarios were tested across two different locations within the JRC site that replicated urban and rural environments at different times of the day: daytime, sunset, and nighttime. Moreover, we tested at varying distances between the ego vehicle and the target. We selected four participants to act as targets for our experiment. These included one female and three male individuals, ranging in height from 165 to 185 cm.
Note that the testing setup does not match the testing specification mandated by UN-R152 and Euro NCAP for the absence of disturbing factors. As visible in Figure 4, the environment is more representative of a typical urban/rural road given the presence of trees, buildings, and potholes.
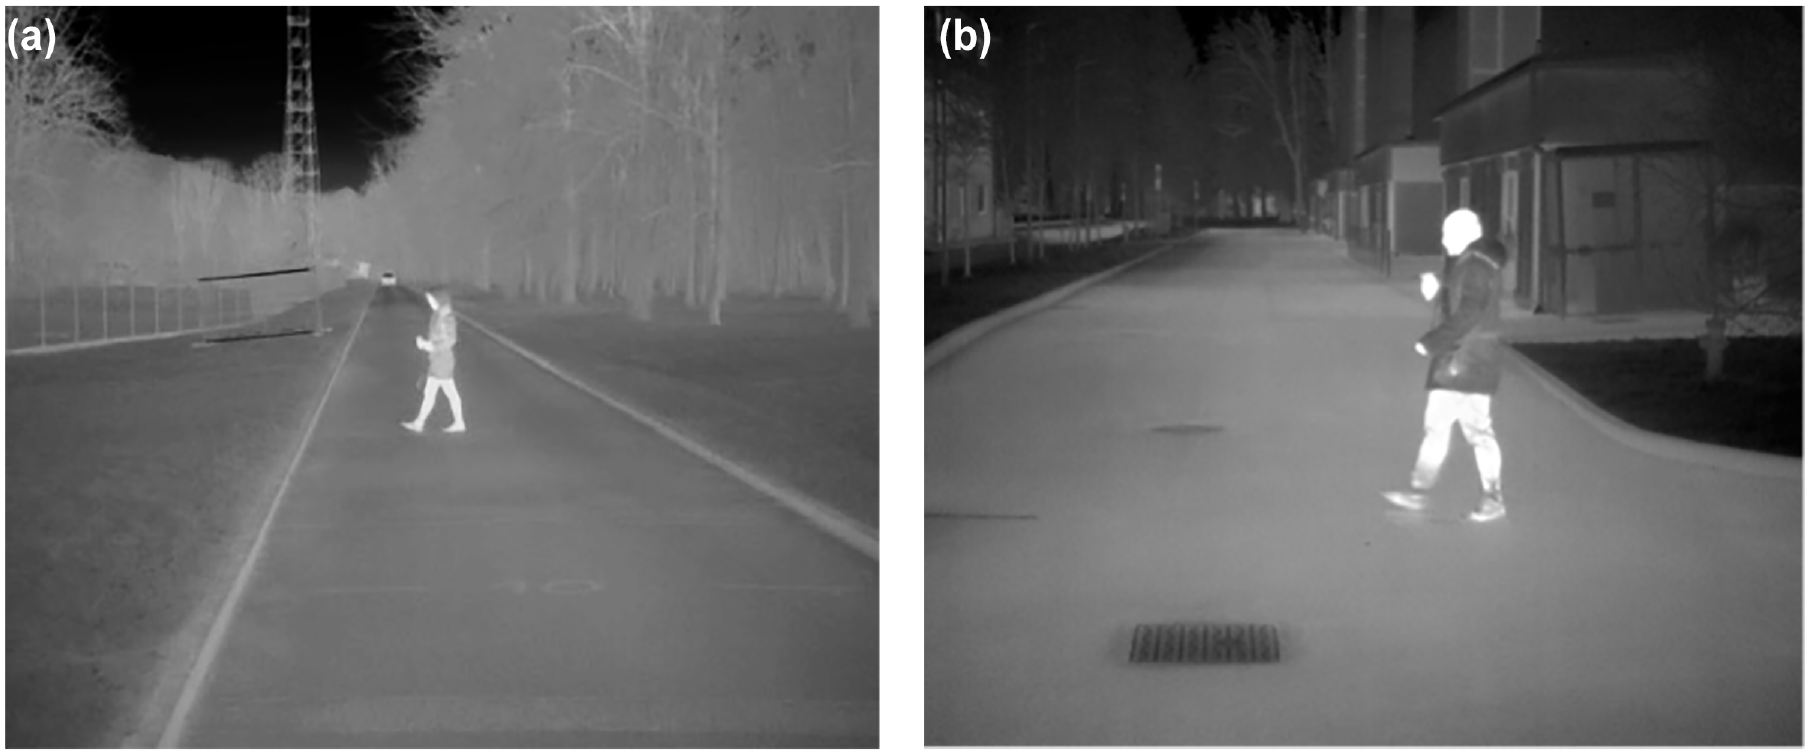
(a) Rural versus (b) urban scenarios.
Safety Models
The FSSM, as presented by Mattas et al. ( 8 ), is here adopted to infer braking behavior, based on the probabilities of detection for the thermal and visible cameras. The safety of the situation is evaluated using two FSSMs, the proactive fuzzy safety metric and the critical fuzzy safety metric ( 26 ). In contrast to crisp safety metrics, for which each situation can be either safe or unsafe, for the FSSM, a situation can be evaluated to be unsafe with a degree of truth. Thus, the reaction of the controller is based on the level of safety, using simple fuzzy rules, and can lead to calm, anticipative deceleration. Such reactions can have an important effect in avoiding emergency situations and can be expected from ADS that operate at high speeds. When the safety level becomes critical, an emergency braking response is simulated, similar to that of an AEBS. In the FSSM simulations, the rate of change in the acceleration of the simulated vehicle is bounded by a minimum jerk. A reaction time is included between the controller’s decision and the actuation. Notably, the FSSM is not a model replicating the behavior of any specific ADS or ADAS but sets a threshold on the expected performance in different safety-relevant situations. The tuning of the model’s parameters has been carried out according to the UN Regulation 157 annex ( 27 ). The main difference from the version of the regulation that is focused on vehicle interactions, apart from the shape and speed of the road users, is that the pedestrian is always considered to have the right of way.
The reference scenario adopted for evaluation is the Euro NCAP-style pedestrian crossing where the pedestrian is coming from the right side of the vehicle center. Several vehicle speeds,
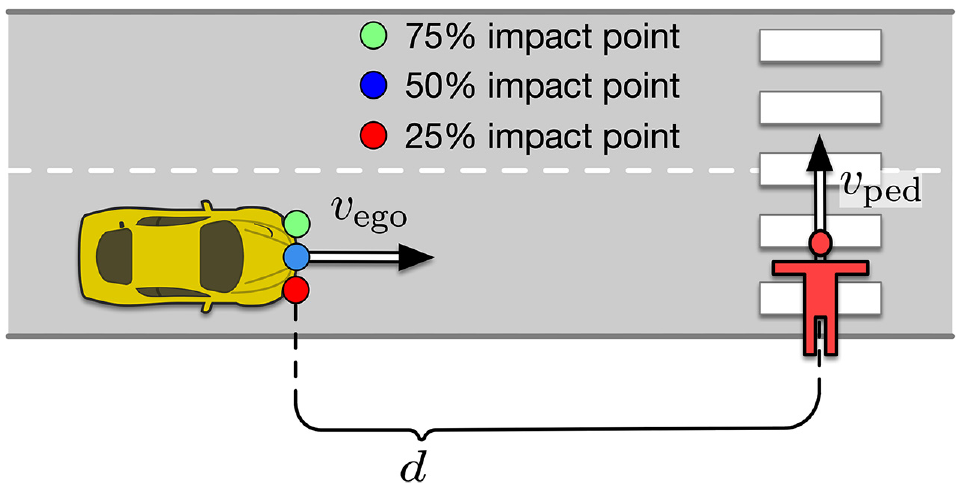
Pedestrian crossing scenario to infer advanced emergency braking system (AEBS) performance based on different sensing.
The FSSM behavior is dictated by the detection probability for the pedestrian. Based on the probabilities identified in the assessment phase for both the thermal sensors and the visible camera, the model is informed about the pedestrian status. The computation of the detection probability runs with the same frequency as the operational frequency for the sensor to ensure consistency in the evaluation. The modeling assumptions are such that if the pedestrian has been detected, even once, the FSSM still assumes the same exists for three reference time windows corresponding to 0.2, 0.5, and 1.0 s. Afterward, the FSSM stops the deceleration and keeps a constant speed. If further detection is provided, the controller starts to decelerate once again, bound by the minimum jerk limit. The reason for investigating the behavior for the three windows is related to the memory effect that some AEBS can be equipped to compensate for the noisy detection and improve robustness. At this stage we are not interested in optimizing over this parameter; therefore, we assumed three reference figures to provide a more complete assessment.
Overall, for each combination of initial distance and initial vehicle speed, three different impact points, three different pedestrian speeds, and three different memory time windows were investigated. Further, as a result of the stochasticity, each test was run using 10 different random seeds. Therefore, for each speed–distance combination, 270 simulations were run. Finally, with eight different initial speed parameter values and five different initial distances, the total number of simulations reached 10,800.
Results
Infrared Sensors Assessment
This section describes the detection capabilities of thermal cameras and the corresponding heuristic characterization of the vision-based system as in the experimental campaign carried out.
Confidence Degradation
The first key performance indicator analyzed is the confidence degradation for the distance between the sensor and the pedestrian crossing the road. We computed the median confidence throughout the sequence of frames in each experiment. At the given frame rate of 30 fps, we collected on average 76 frames per experiment. Then, we computed the mean and variance for the experiments corresponding to the same distance for both the low-resolution and high-resolution thermal cameras.
Figure 6 reports the findings for both thermal sensors. The picture depicts the mean perception confidence corresponding to each scenario at the given distance together with the 95% measurement confidence (2
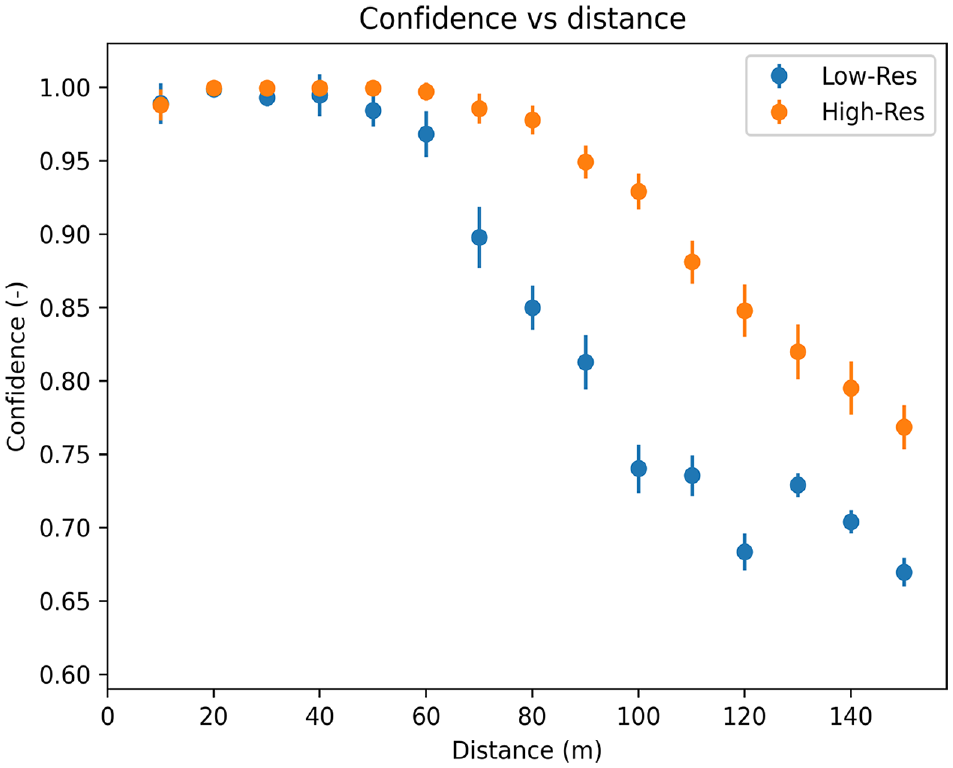
Confidence versus distance, high- and low-resolution thermal cameras.
The highest-resolution sensor performs better by returning a detection confidence higher than 80% up to 120 m. The lower resolution shows a substantial drop in confidence already at 80 m together with a larger dispersion in the data. The lower confidence of the lower-resolution sensor implies a reduced capability of detecting pedestrians crossing at more than 80 m.
Figure 7 depicts instead the role of the different testing environments (i.e., urban and rural environments) to the detection confidence degradation over distance. The two different environment configurations do not seem to affect the perception confidence in a noticeable manner. Conversely, the low-resolution camera starts to experience a drop in confidence at 60 m whereas the high-resolution one is fully confident up to 80 m with a slower decay in confidence as the distance is increased in both testing environments.
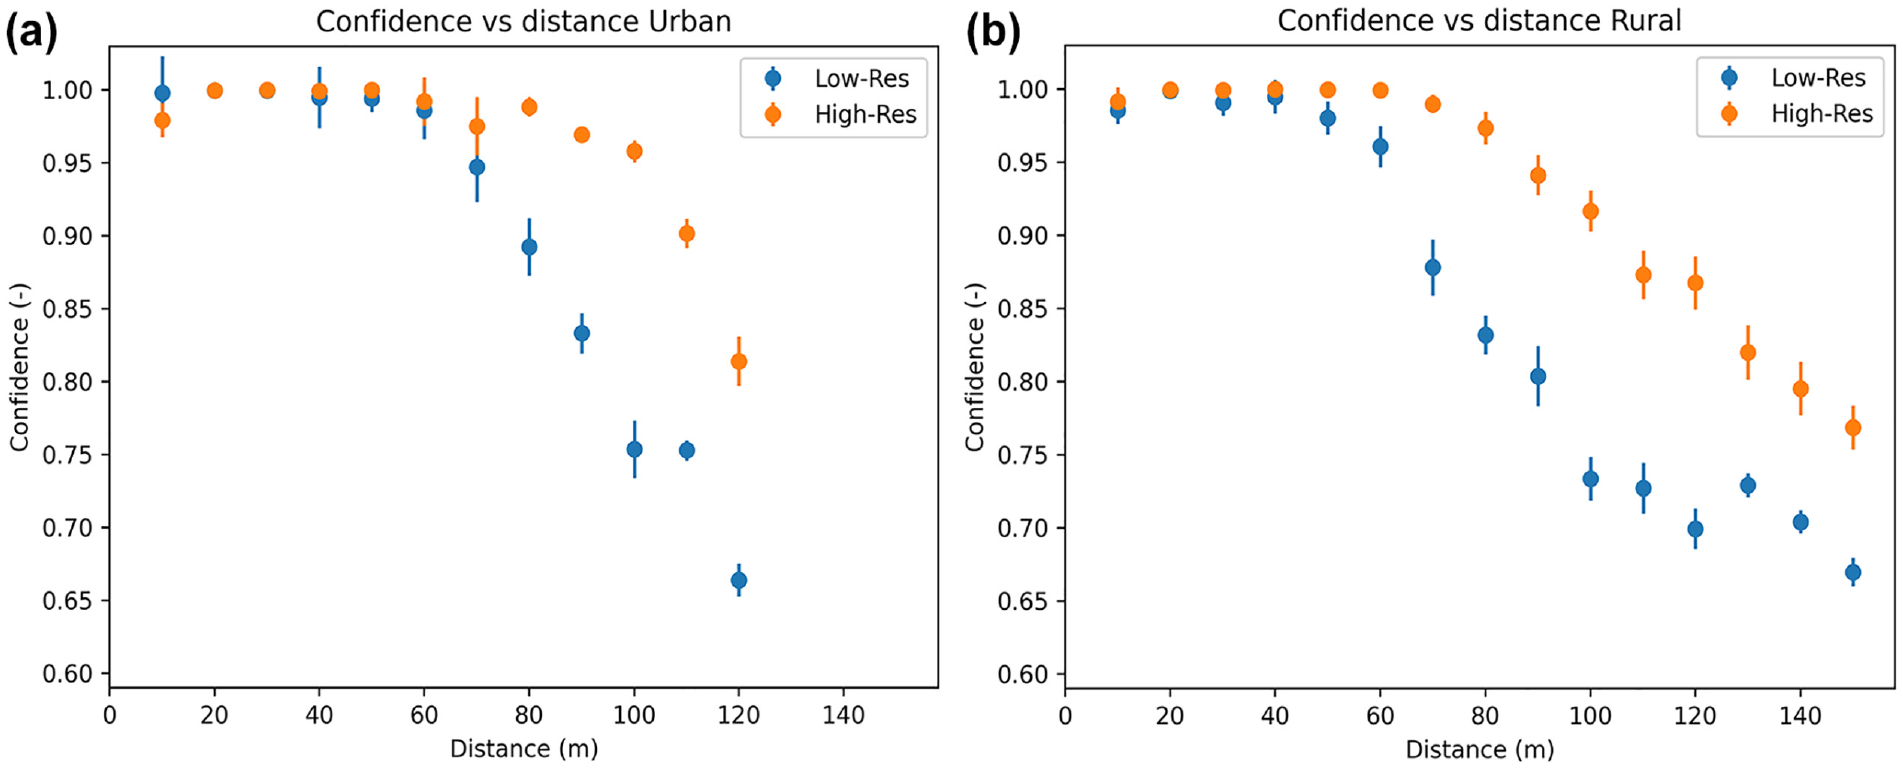
Confidence in (a) urban versus (b) rural scenarios.
Detection Robustness
The second key performance indicator is related to the robustness of the algorithm in keeping a neat separation between detecting true positives and false positives. We computed the distributions of confidence for the correctly classified pedestrian and the distributions of the other detected object wrongly classified as human but that never exceeded the threshold for both the sensors in Figure 8.
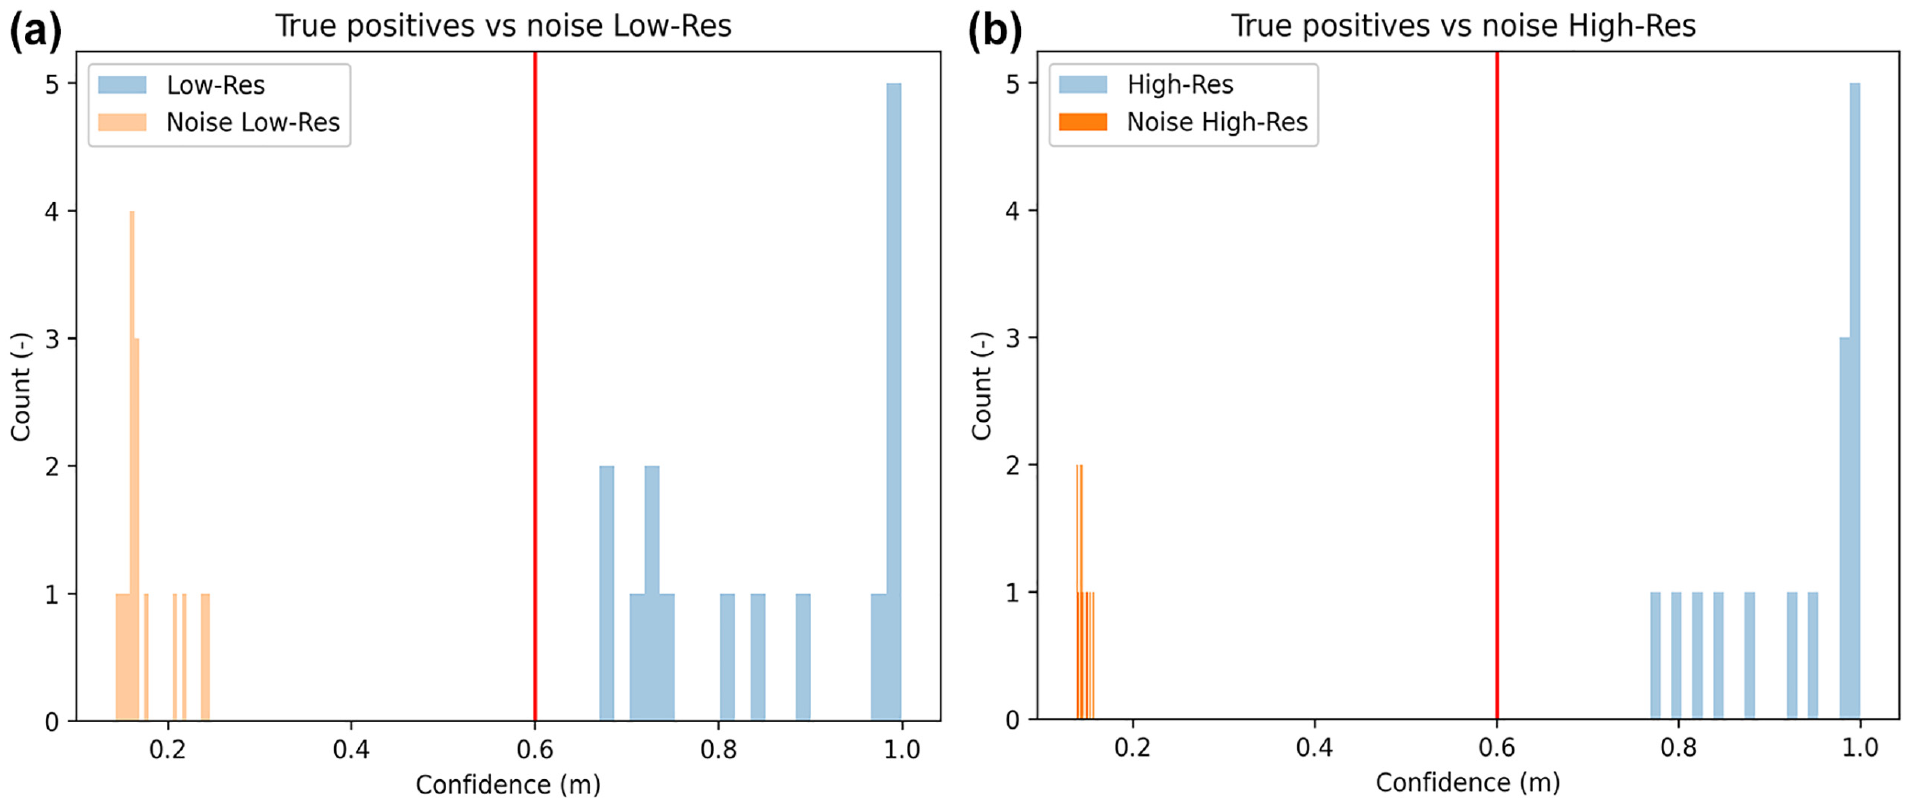
True positives versus other noisy detection: (a) low resolution and (b) high resolution.
The horizontal distance between the corresponding set of distributions is indicative of the robustness of the detection algorithm. In fact, whenever the true positive distribution is very close to the threshold, there are chances of a true pedestrian being discarded. The oppositive is true for the noise distributions: when they are too close to the acceptance threshold there might be the probability of a false positive detection.
Overall, the clear impact of the resolution in spreading apart the two distributions can be noticed. The high-resolution camera is indeed much more effective in maintaining the incorrect detection below a 20% confidence and ensuring the correct ones stay above 80%.
Luminosity Independence
A common claim concerning thermal vision is that it is unaffected by luminosity conditions. Although that is a widely accepted assertion for the thermal sensor alone because of imaging physics, when the same sensor is coupled with an artificial intelligence-based image detection/classification algorithm, the pipeline benefits from an additional verification step to further validate the claim.
We compared each experiment’s median confidence by grouping the tests according to the luminosity conditions into three classes: “day” (>400 lx), “sunset” (10–400 lx), and “night” (<10 lx).
Figure 9 reports the confidence boxplots for the low-resolution camera and high-resolution camera. The orange lines are the median confidence levels, the solid blue areas correspond to the Q1–Q3 interquartile range (IQR), whereas the black horizontal marks are the Q3 + 1.5 IQR (max, top) and Q1 – 1.5 IQR (min, bottom) ranges, respectively.
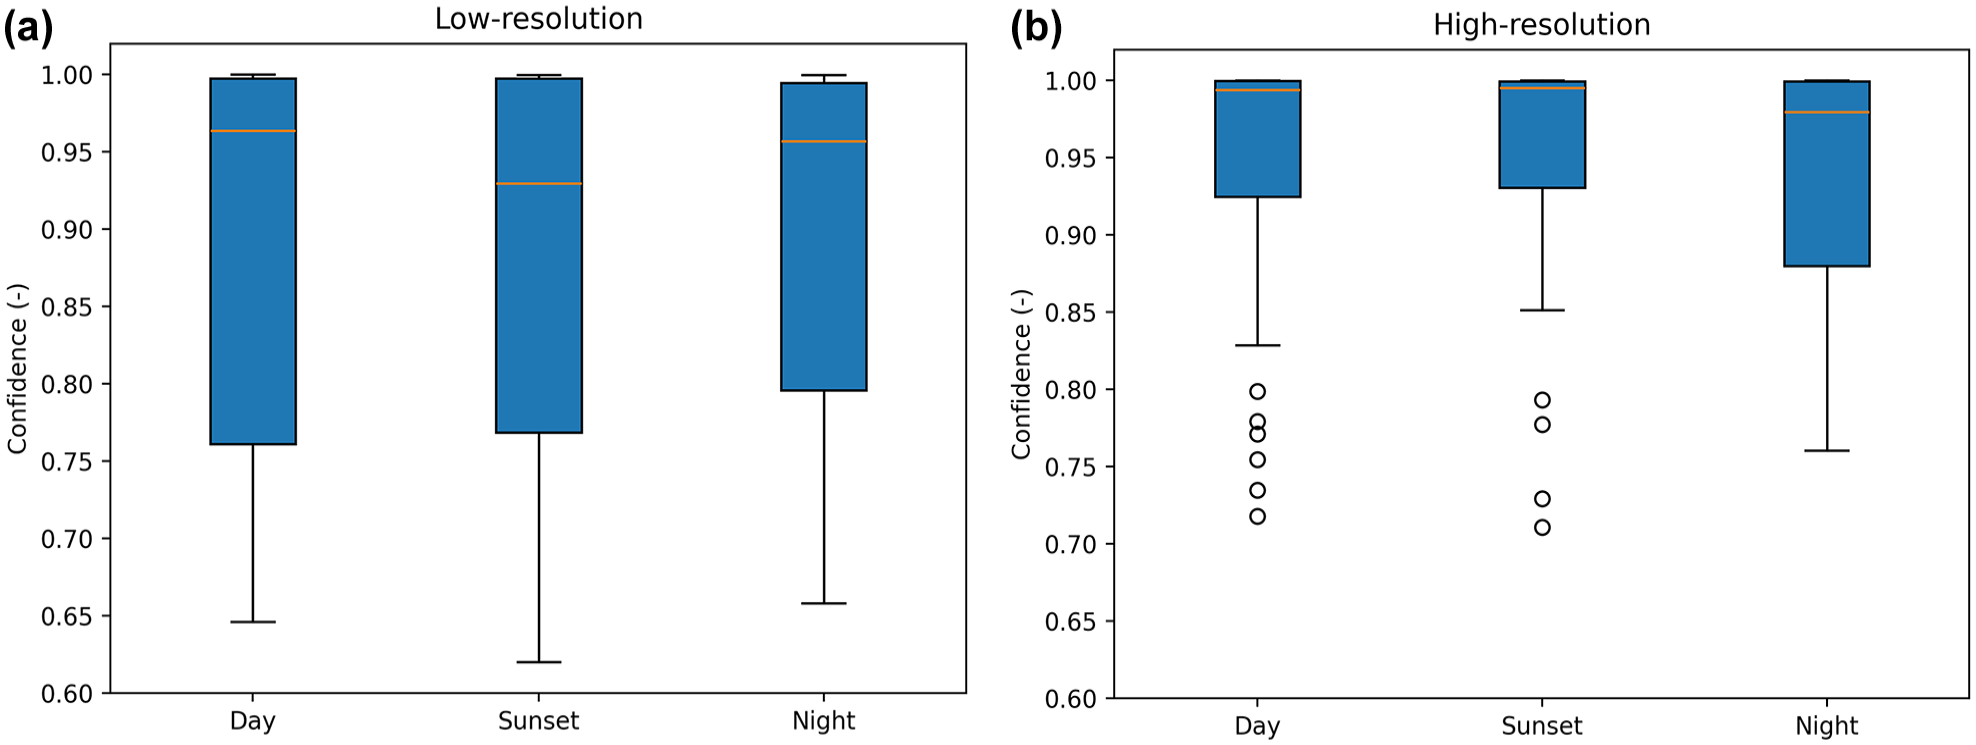
Median confidence for the considered luminosity conditions: (a) low resolution and (b) high resolution.
A qualitative evaluation of Figure 9 indicates that there is no statistically significant difference between the external illumination to the detection confidence. Nonetheless, statistical testing can provide a quantitative assessment of the claim. We computed the p-value associated with the t-test for each couple (day versus sunset, day versus night, and sunset versus night) of observations. The resultant values are summarized in Table 1.
T-Test p-Values for External Illumination Sensitivity
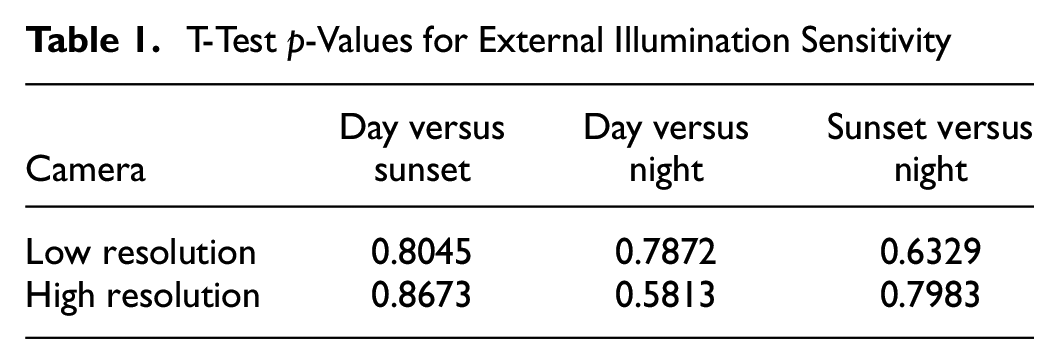
As in Table 1, the computed p-values suggest that confidence does not depend on illumination as the values are substantially higher than the commonly used p-values (0.05 or 0.01). Such an assessment provides quantitative proof that the detection algorithm is performing equally in daylight and night conditions.
Target Size Effect
To account for the effectiveness of the detection algorithm to detect humans and for the role played by the lens/sensor combination to support that, we computed the detection confidence versus the size of the pedestrian in the frame as shown in Figure 10a coupled with the actual target size as a function of the distance as shown in Figure 10b. The computation in Figure 10a is independent of the pedestrian size and the distance, and it is mostly focused on the effectiveness of the detection algorithm. Moreover, it allows for further elaborations based on the reported focal length and HFOV for future research where practitioners might experiment with different combinations of lenses and sensor specifications. In fact, for a given target distance a wider angle lens will make the pedestrian appear smaller in the frame but will increase the likelihood of detecting targets approaching from the lateral direction. The opposite is true for a narrow field-of-view lens. Such considerations are presented in Figure 10b for the specific combinations of lenses and sensor sizes. Figure 10b depicts the VRU size reduction in pixels along the vertical direction as measured by the sensor (blue and orange star markers) and by using the thin lens analytical model (light red and light violet lines):
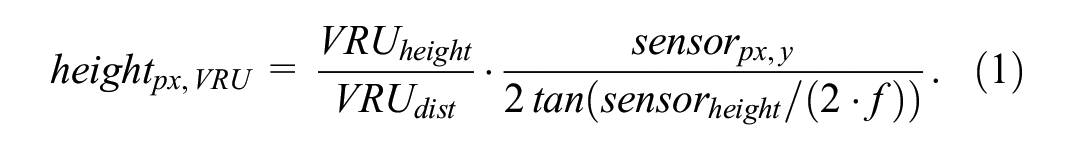
In Equation (1)
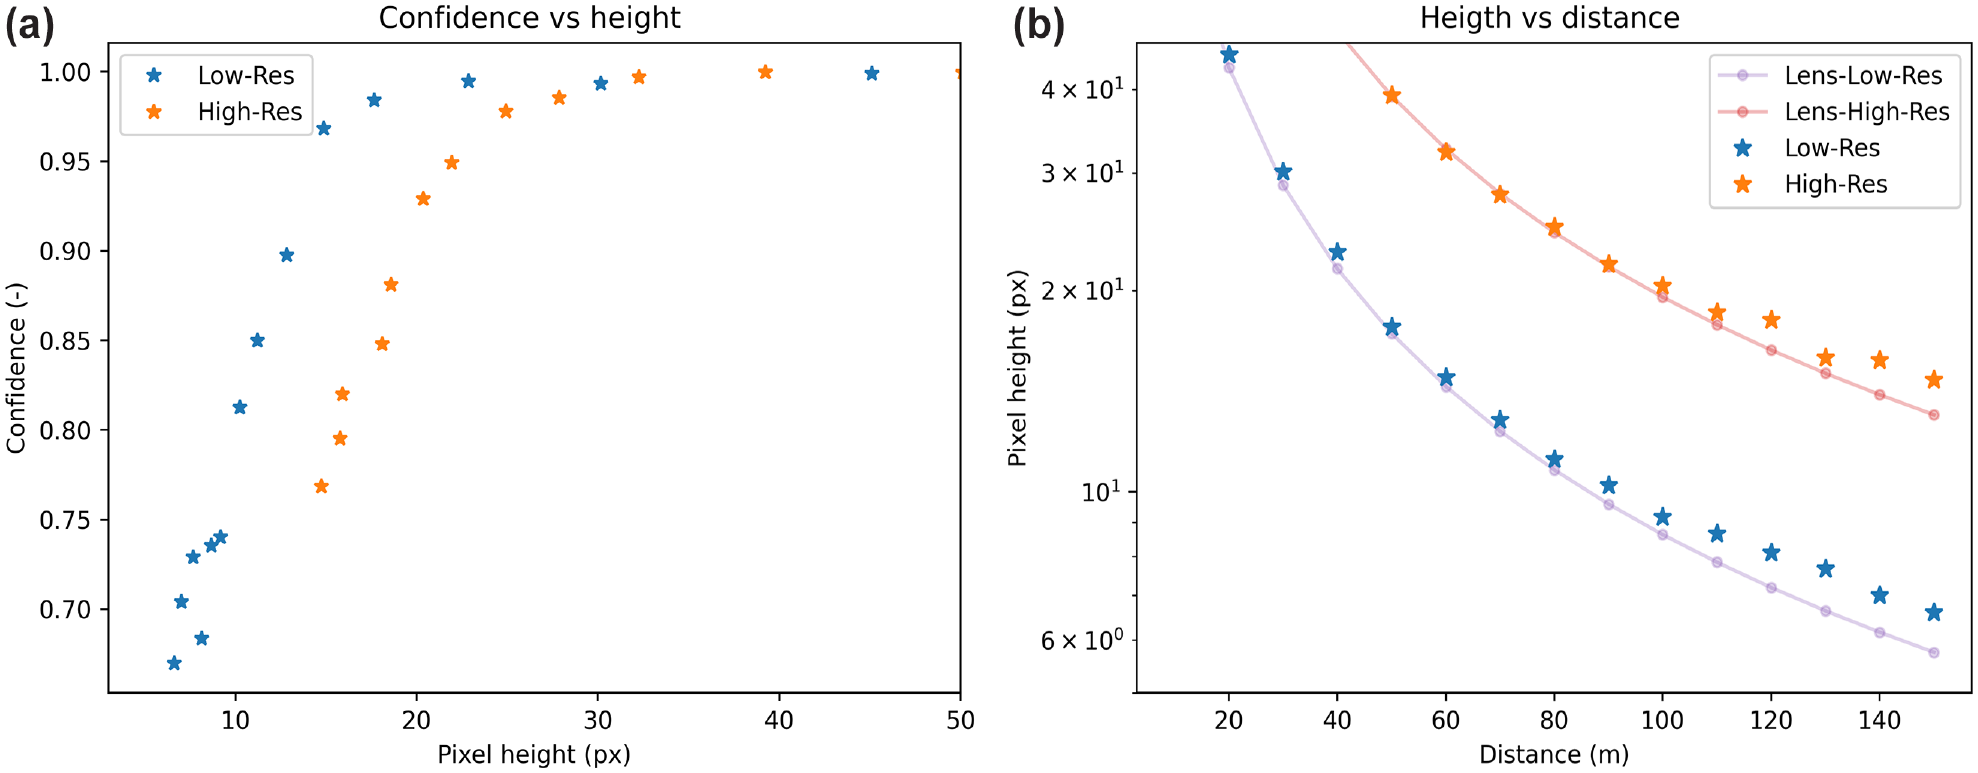
(a) Confidence detection versus size of the pedestrian in the frame and (b) pixel height versus distance.
From the data collected, the lower-resolution camera is found to be slightly more efficient in utilizing the pixels available by returning a higher confidence for a given pixel height. Notice, however, that for the same number of pixels, the pedestrian will be closer in the case of the lower-resolution camera. In fact, a 30-pixel-tall pedestrian is about 30 m away in the case of the low-resolution camera and 70 m away for the high-resolution one. Therefore, the dissipation of infrared radiation from the humidity present in the environment might have played a role in degrading confidence over very large distances, as noticed by Bertozzi et al. ( 28 ).
Nonetheless, both sensors are very efficient compared with visible cameras where a sub-30-pixel pedestrian would be considered as “far” according to the Caltech data set ( 29 ) and the corresponding detectors return very poor performance. Conversely, in the thermal domain, even 20 pixels will provide high confidence.
From Figure 10b, a good agreement between the analytical model and the measured VRU size can be denoted. Based on such findings it could be possible for practitioners to further tailor the lens/sensor combination depending on the use-case and on the needed detection range regardless of the effectiveness of any specific detection algorithm.
Detection Probability
We calculated the probability for the pedestrian to be identified as a function of the distance to the sensor. For each experiment, we computed the number of frames it took to detect the pedestrian with respect to the total number of frames corresponding to the experiment. Similarly, for the confidence evaluation, we computed the mean and variance of the probabilities for each distance, as shown in Figure 11.
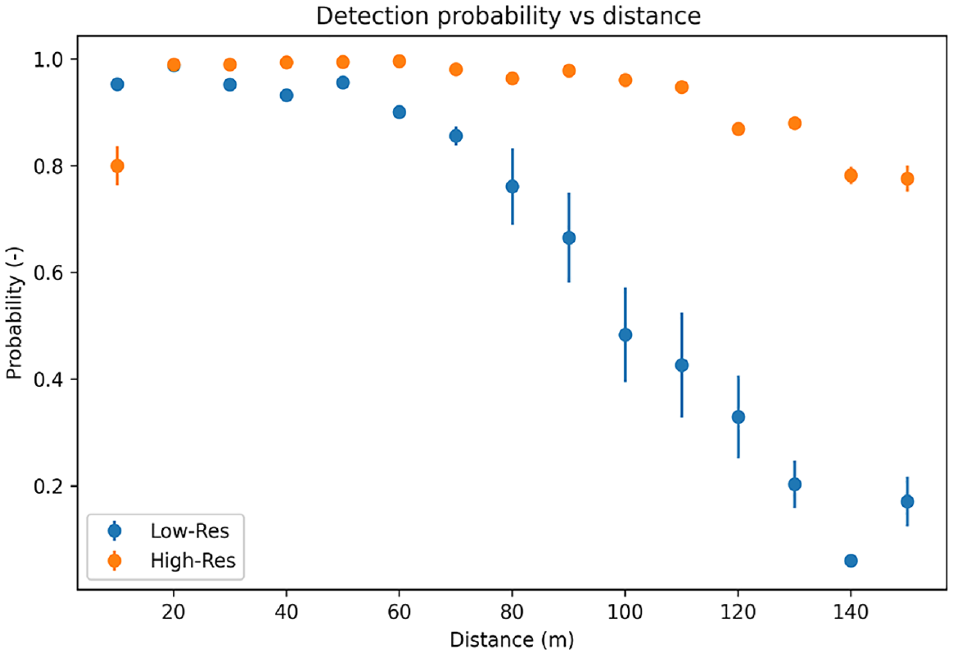
Detection probabilities versus distance for the low and high-resolution sensors.
The final assessment involves a comparison between the thermal sensors and the fusion-based system implemented on a commercially available vehicle. In this case, we considered the external illumination, and we divided the scenarios into daylight cases (1,000–10,000 lx), sunset cases (100–300 lx), and night cases (0–5 lx). As reference, for the commercially available passenger vehicle, we used the procedure summarized in the dedicated paragraph for assessing probabilities. The resultant trends are depicted in Figure 12.
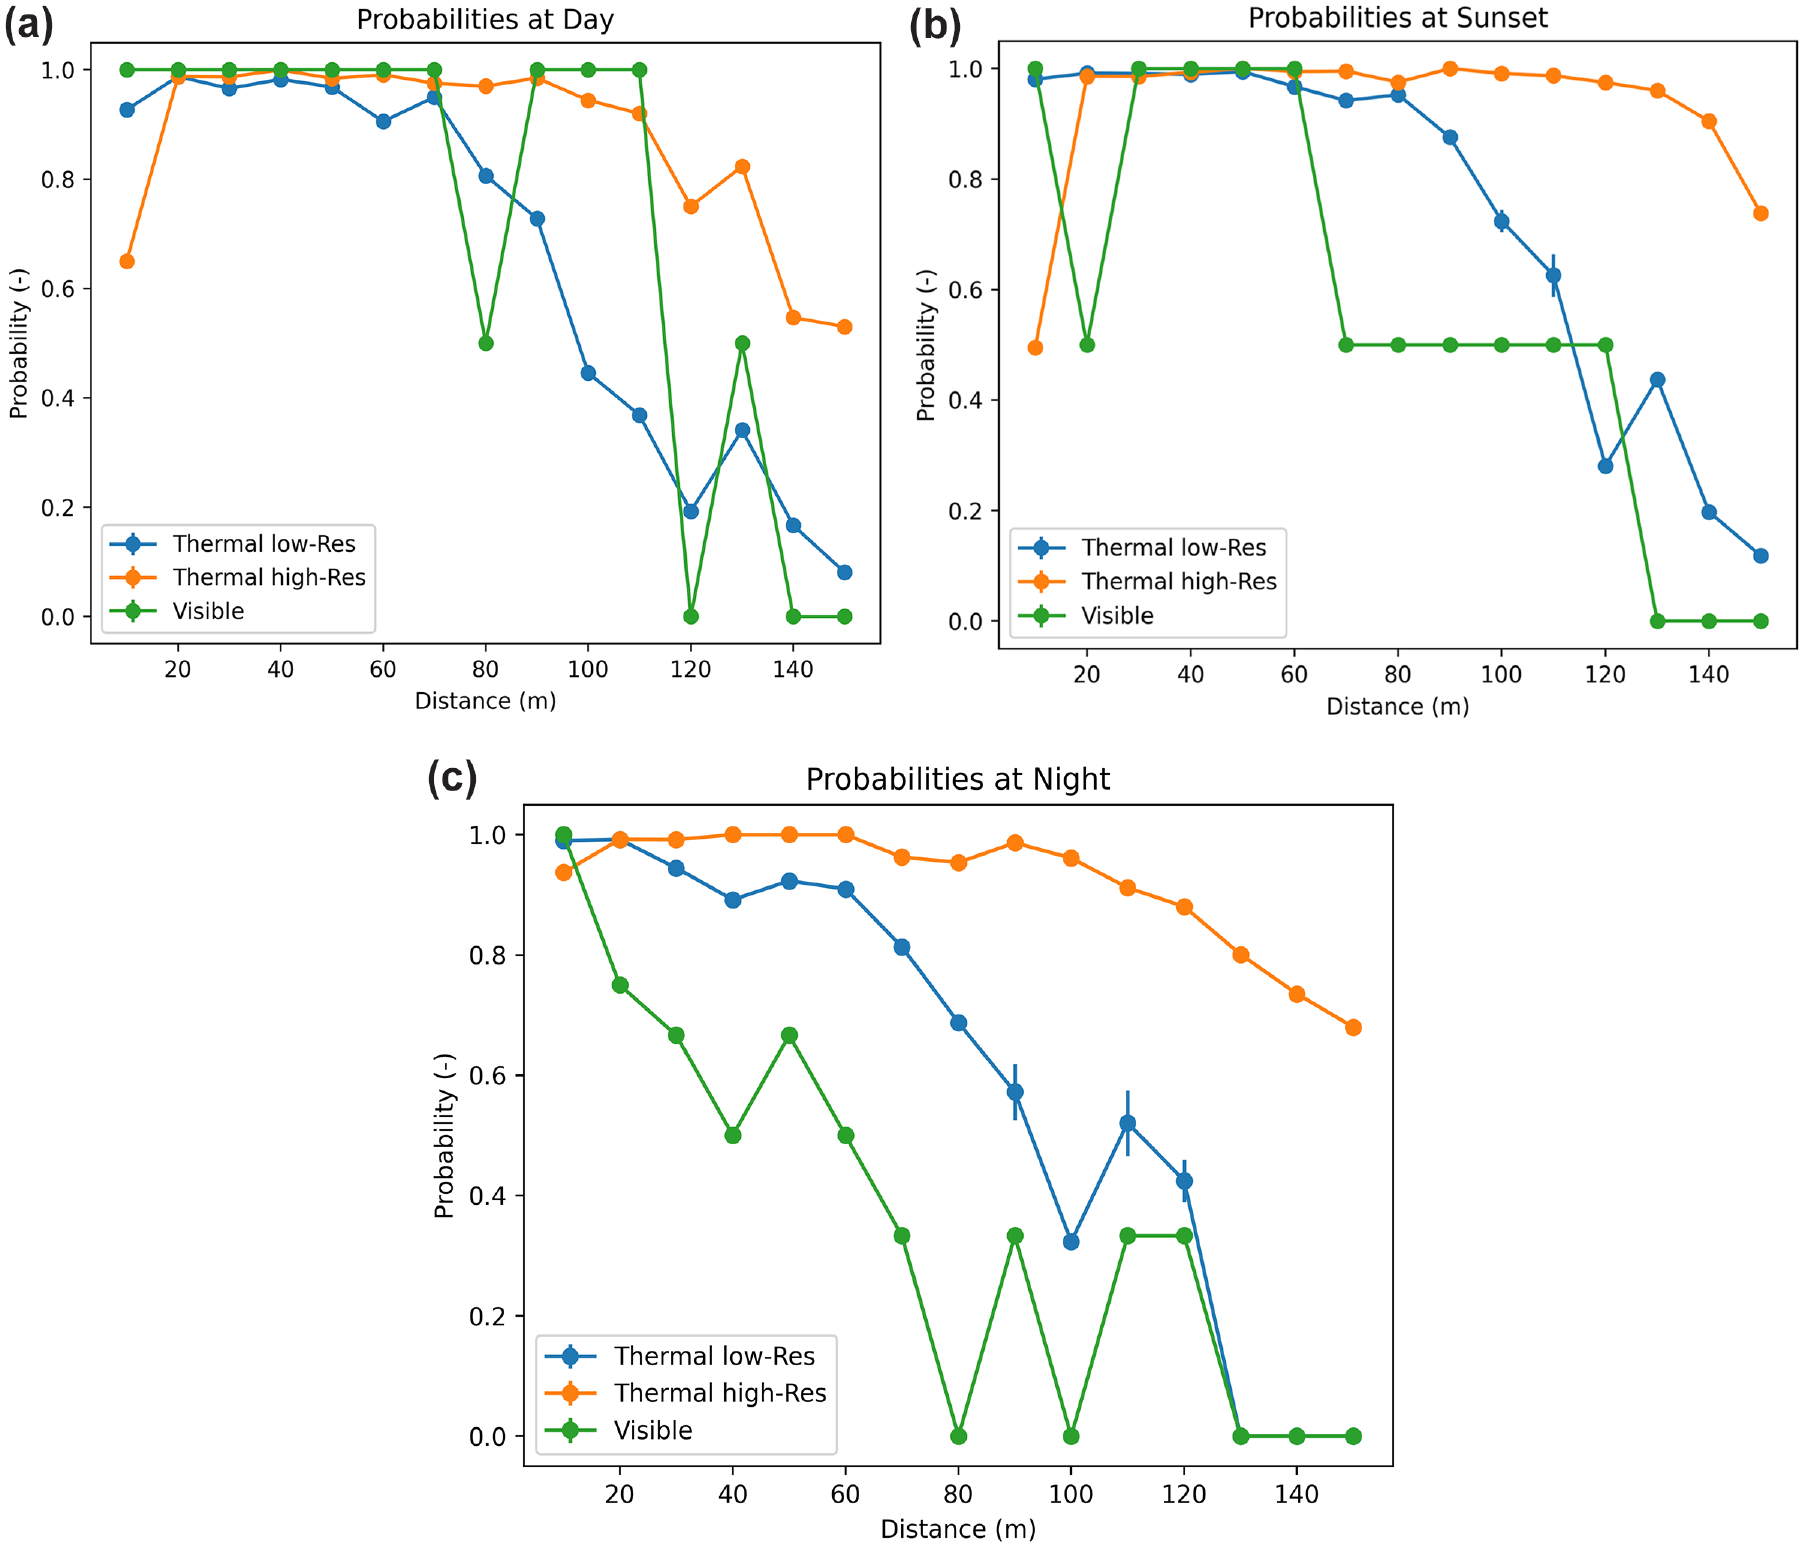
(a) Probabilities of detection in daylight conditions, (b) sunset, and (c) at night.
VRU Safety Implications
We computed the safety implications using FSSM coupled with probabilities, as in Figure 12.
Baseline Scenario
The baseline scenario (i.e., the case of perfect detection) is shown in Figure 13. In some cases, the initial distance is small compared with the initial speed of the vehicle. Therefore, if the space is too small, the vehicle cannot manage to come to a stop before colliding with the simulated pedestrian, even for a perfect detection. In Figure 13, those cases are presented with a blue dot. Moreover, the stopping distance considering the reaction time and the maximum deceleration is presented with a blue line. In this calculation, the jerk limitation is not considered. This explains the simulated crashes for cases that are above but close to the blue line. Moreover, in some extreme cases, the initial distance is so small compared with the initial speed that the crash occurs before the reaction time is passed, so there is no deceleration. The cases are presented with red “x” markers. The relevant theoretical line is represented by the dashed red line. Those represent the worst possible outcomes, as the speed difference during the crash is the highest. In the rest of the cases, there is some deceleration that could not avoid the collision but mitigate its impact.
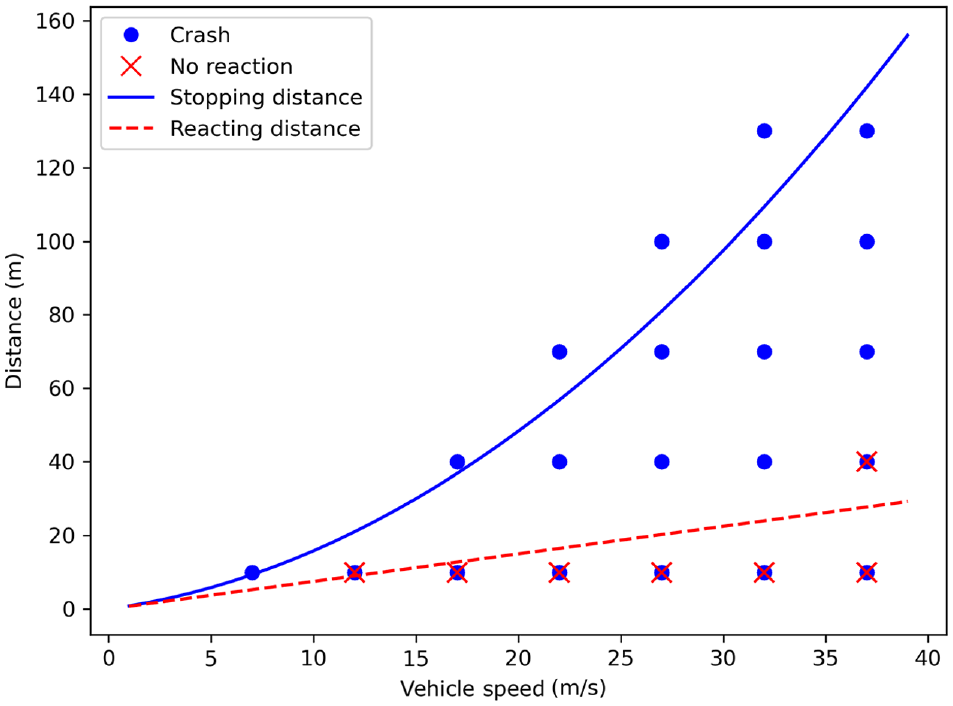
Baseline scenario with perfect detection.
Probabilities Fit
As the FSSM runs on a continuous time basis, a model is needed to evaluate the probability of detection as a function of the relative distance between the ego vehicle and the VRU for both the infrared sensors and the visible camera for the three illumination cases considered. We calibrated a second-order polynomial on the experimental data points. The resulting fitted line was limited to the [0,1] range, to be suitable to represent probabilities. Moreover, the line was not fitted to the exact points, as it is assumed that the probability should be decreasing relative to the distance, and small identification rates in small distances are caused by the experimental setup and not by camera capabilities. Therefore, for each point, we used the maximum rate of probability for the distance of reference or any other larger distance.
Infrared Vision
Figure 14 depicts the results of the infrared sensors. The crashes are depicted in Figure 14, a and c , for the low and high-resolution cameras, respectively. Similarly, in Figure 14, b and d , the cases where there was no deceleration are presented. The number of crashes is represented by the size and the color of the dot, for each one of the speed–distance combinations, with the larger red dots denoting a high number of cases. Using the high-resolution cameras, there were no additional crashes to the baseline scenario with perfect detection. For a few cases, in which the speed was 32 m/s and the initial distance was 40 m, there was no mitigation, which is a negative result compared with the base scenario. On the other hand, for the low-resolution cameras, there is an increased number of crashes and cases where there was no mitigation of the impact speed. However, all such cases occurred for speeds above 15 m/s. Therefore, for urban speeds, a low-resolution camera is sufficient. For higher speeds, there have been avoidable cases, according to the baseline, for which the vehicle did not even manage to decelerate to mitigate the crash. It should be noted that the performance of the thermal cameras is also affected by the neural network, which is not industrially produced and could be improved.
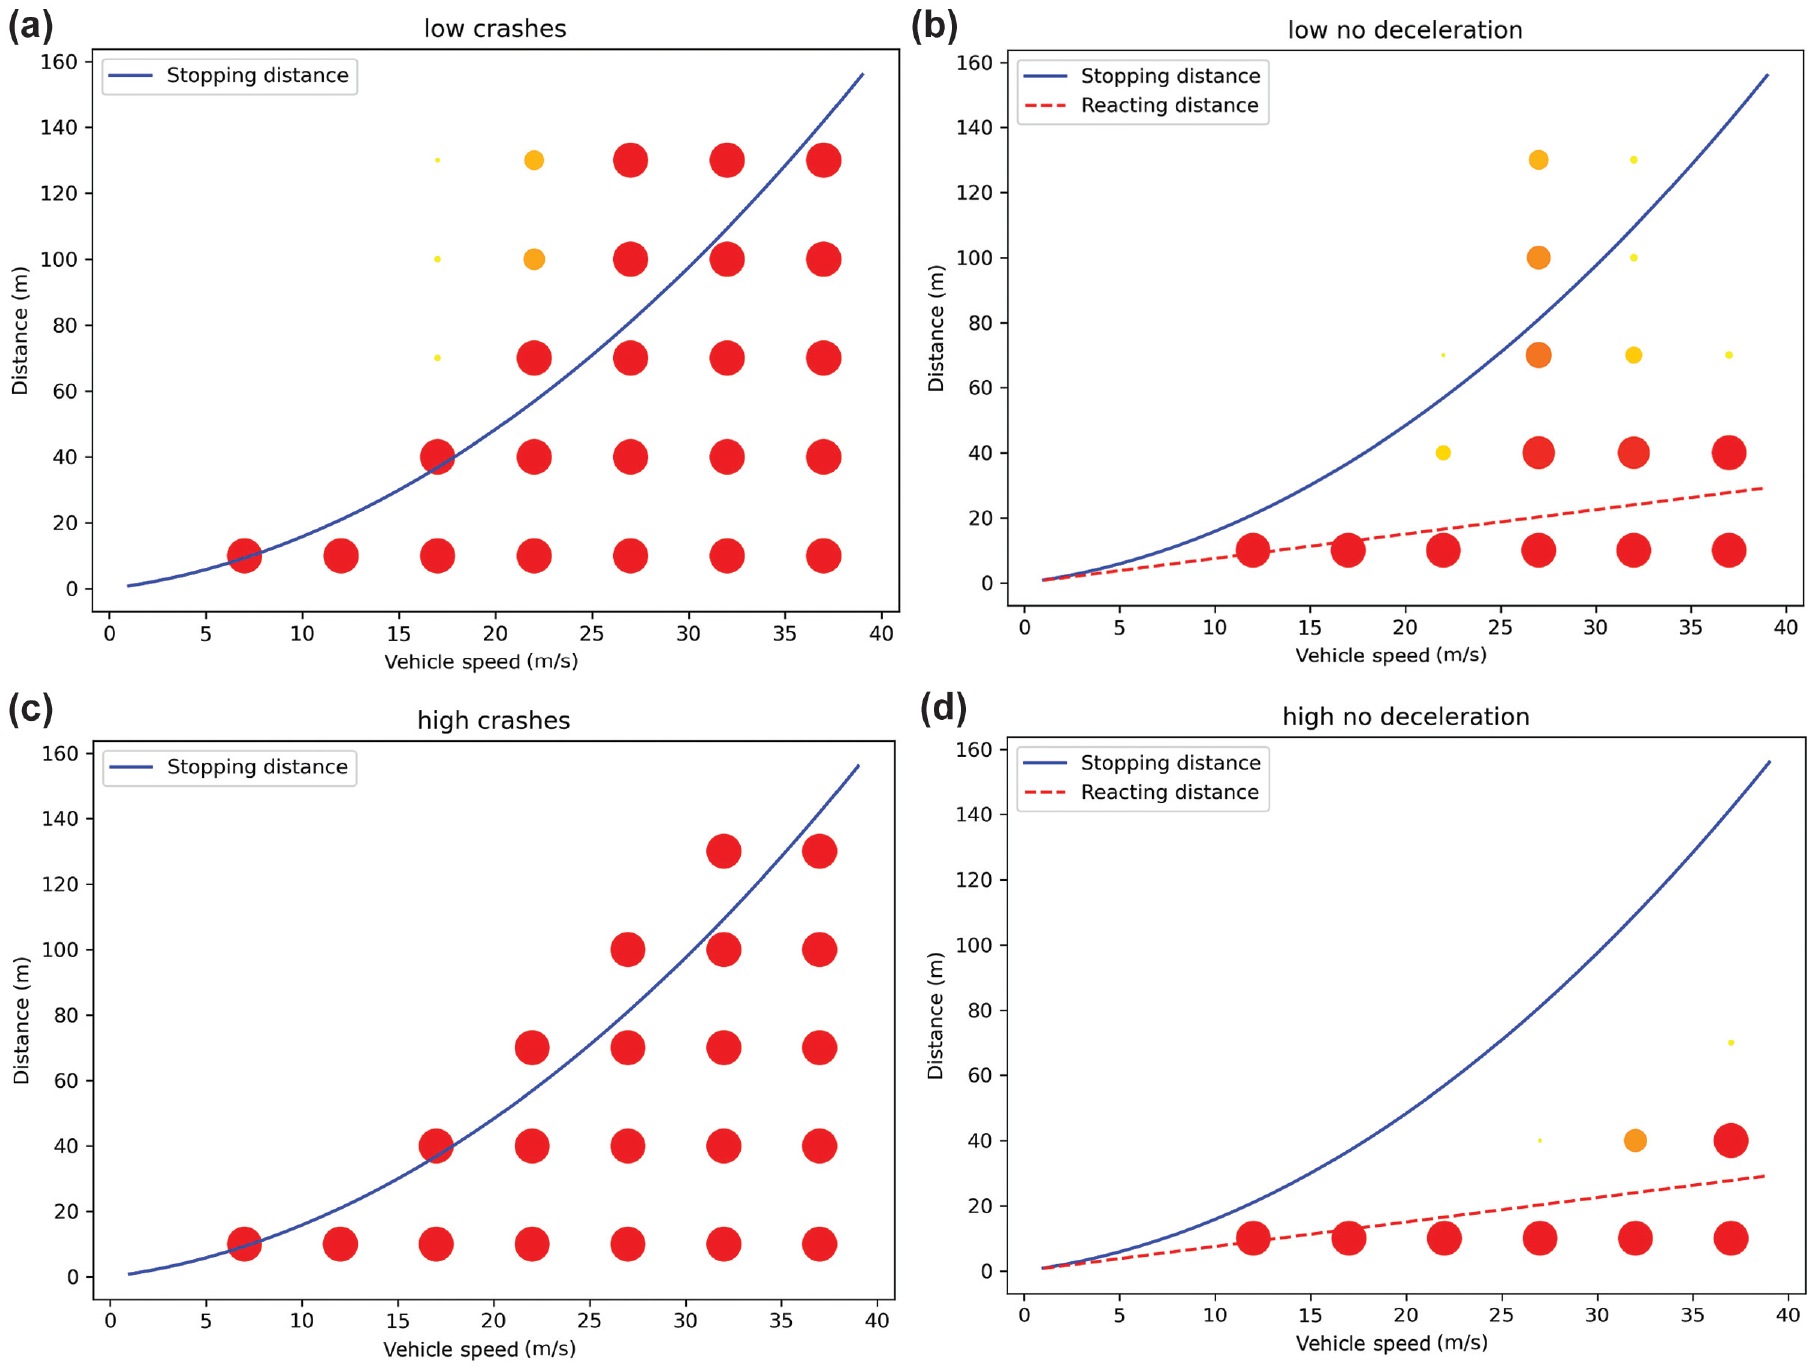
Thermal cameras results: (a, b) low resolution and (c, d) high resolution; (a, c) simulation outcome crash and (b, d) no attempt to decelerate.
Visible Camera
Figure 15 depicts the results of the visible camera. The resulting crashes are shown in Figure 15, a , c , and e , for the daylight, sunset, and night conditions, respectively. Similarly, the number of cases in which there was no deceleration is presented in Figure 15, b , d , and f . For daylight conditions, the performance of the visible camera is shown to be sufficient. There are a few additional crashes to the base scenario, and all of them are recording for initial speeds higher than 20 m/s, that is, for speeds exceeding typical urban scenario speed limits. Although this is an important result, it can be argued that for highway conditions, pedestrian safety systems may be of limited necessity. However, it is also true that higher functional class urban roads with speed limit of 70 km/h do exist. In such cases, avoiding accidents would require the identification of a pedestrian from a larger distance (or with a more robust probability) than currently possible with the existing technology and based on the methodology adopted. The very small frequency of use of such systems for highway speeds may suggest that pedestrians at large distances may even be identified by the system during daylight, but not shown on the dashboard, assuming their presence is not important for the driver.
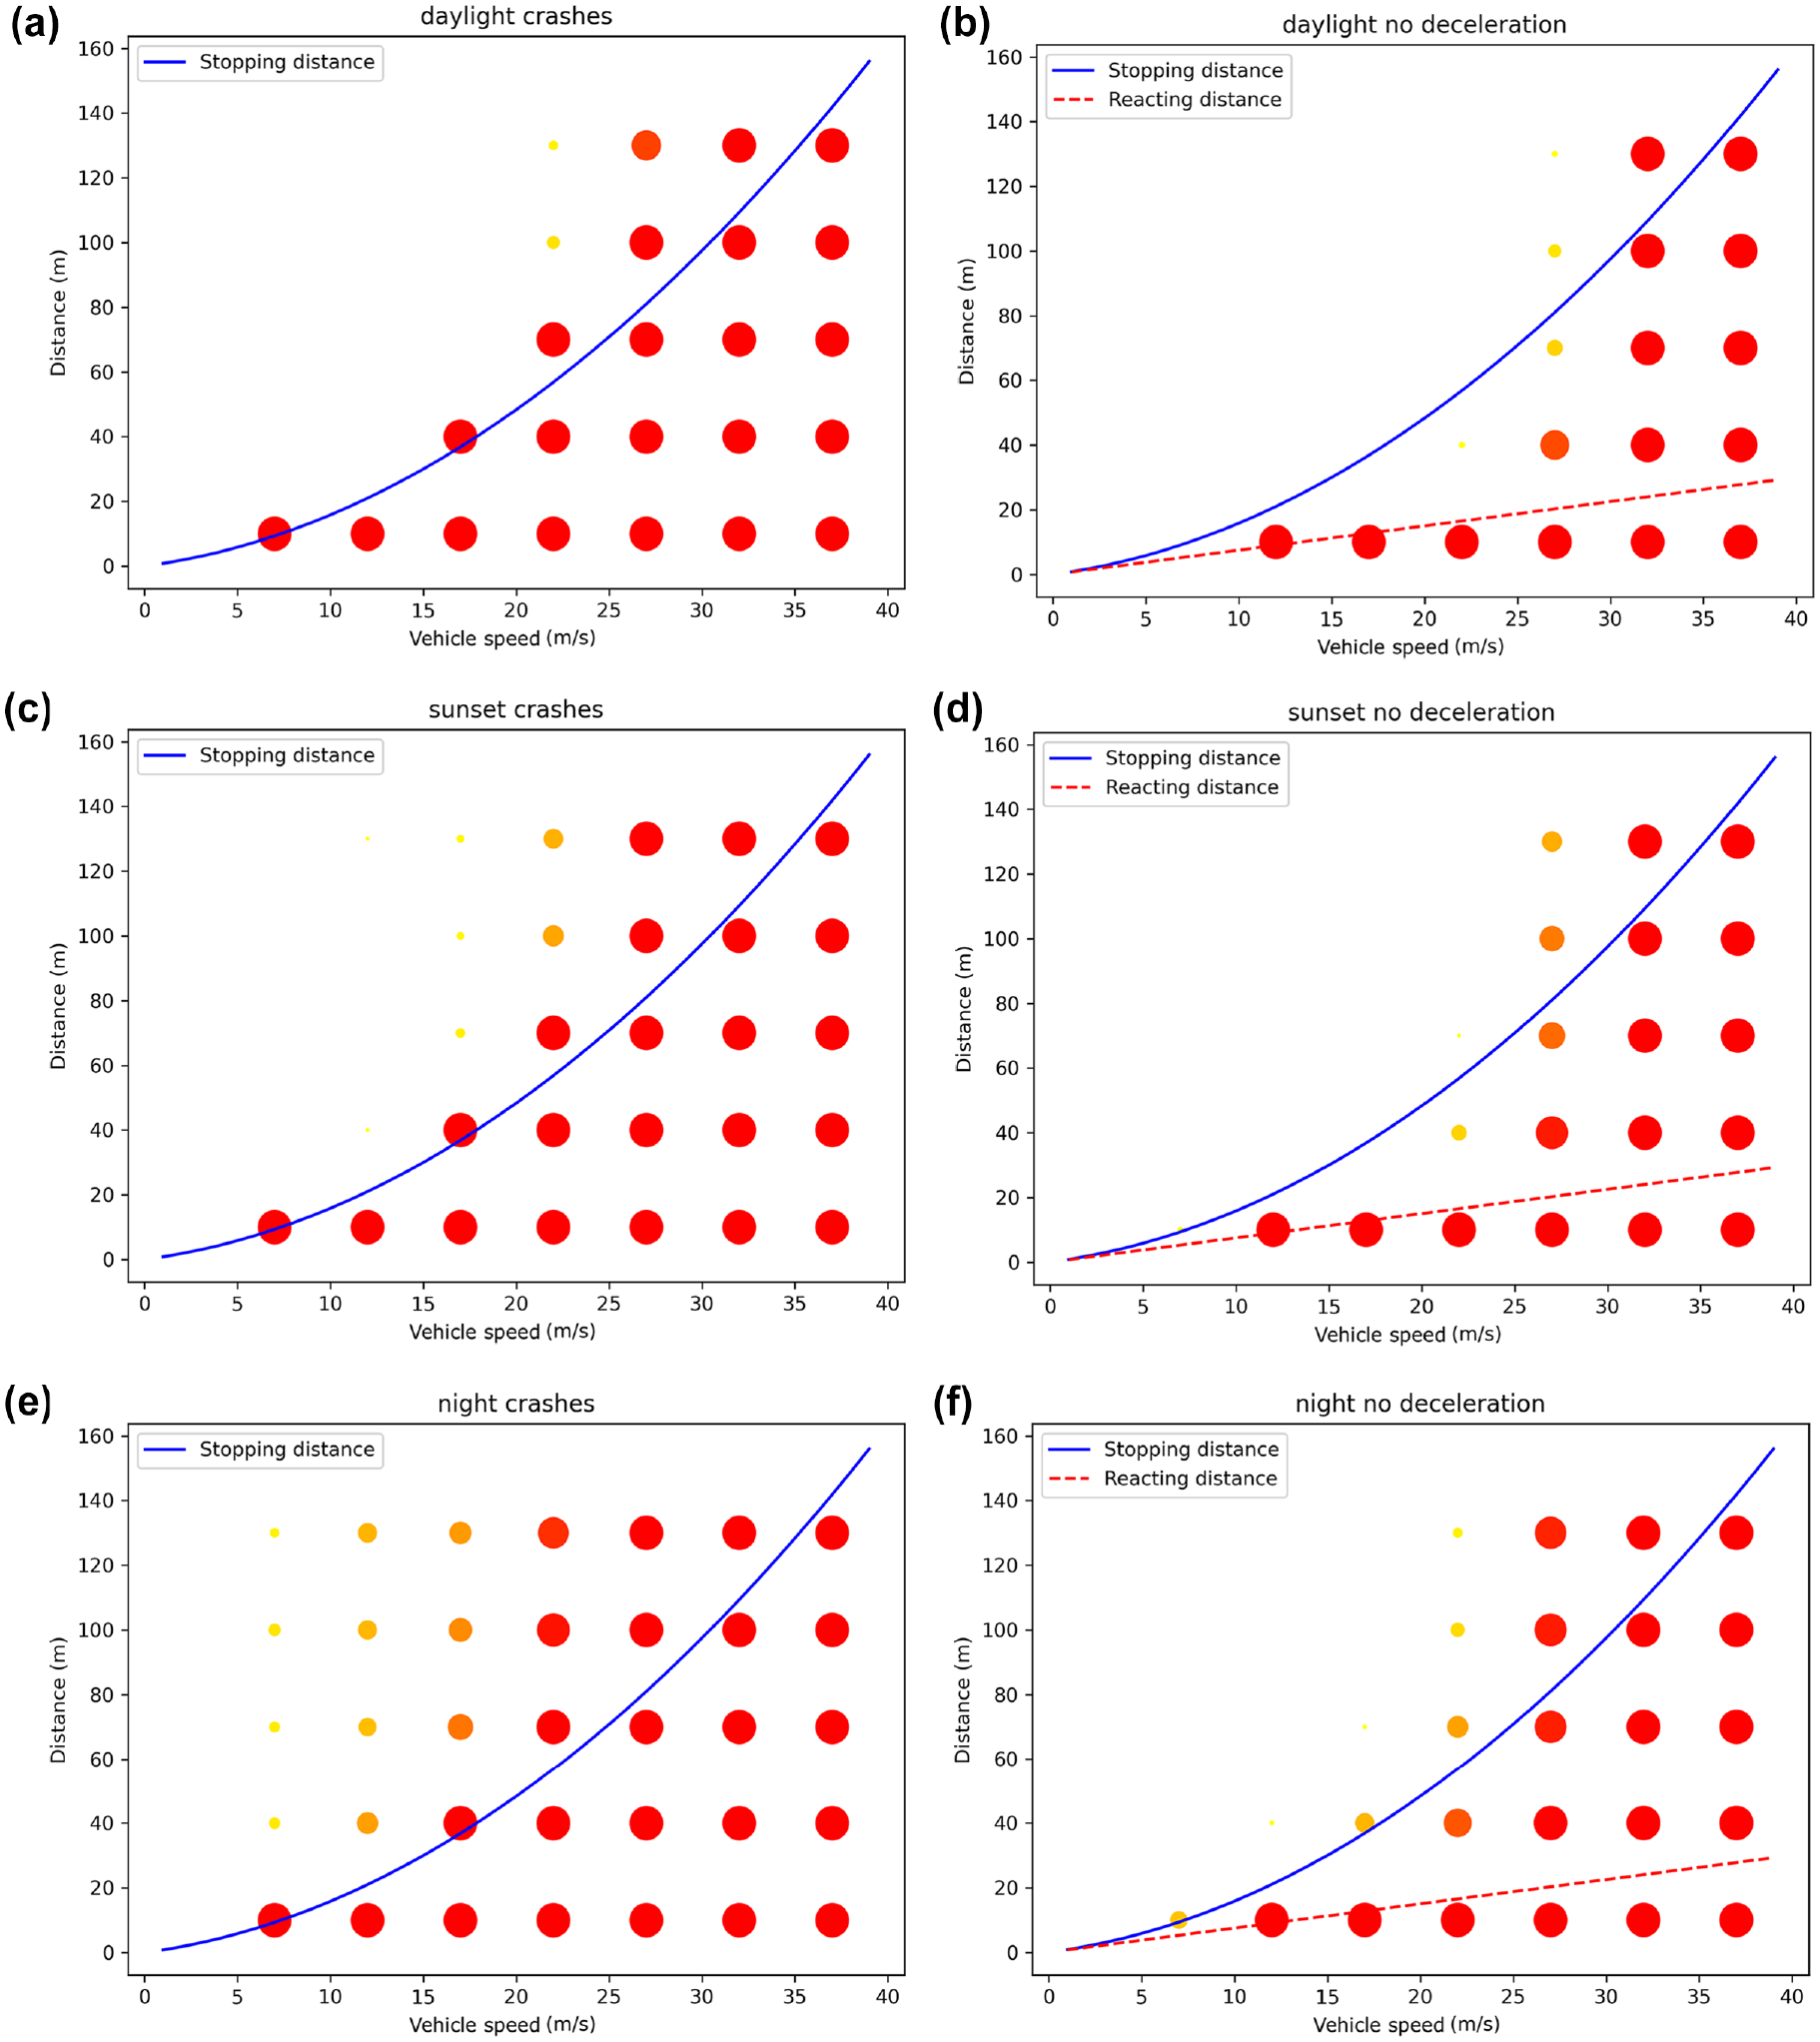
Visible cameras results: (a, b) daylight, (c, d) sunset, and (e, f) night; (a, c, e) simulation outcome crash and (b, d, f) no attempt to decelerate.
For sunset conditions, the performance is similar to that of the low-resolution camera for the number of crashes. In both cases, there is a small number of crashes for a speed range from 15 to 20 m/s, which could potentially be encountered on some rural roads. The main advantage of the low-resolution cameras is shown for the cases of no mitigation, at high speeds, where the sunset conditions degrade the performance of the visible cameras.
Finally, for night conditions, there are no crashes for an initial speed of 2 m/s. However, there are simulated crashes for any other speed, from 7 m/s and above. Moreover, there are several cases with no mitigation of the impact in the speed range from 15 to 25 m/s, which can be possible in some rural roads that would not always be well illuminated during the night. Overall, the safety performance of the visible cameras is shown to decrease significantly, even for urban conditions, and completely degrade at higher speeds.
For a better comparison of the results between the low-resolution thermal camera and the visible camera during sunset conditions, Figure 16, a and b , presents contour plots of the average impact speed for the whole range of experiments, with the red color denoting the higher impact speeds and the yellow color signifying no crashes or simple fender benders. For the higher initial distances, the difference is more evident. Moreover, for medium speeds and distances, the rate of increase of the impact speed is higher for the sunset case. Overall, the area of the red zone for the sunset conditions is significantly larger.
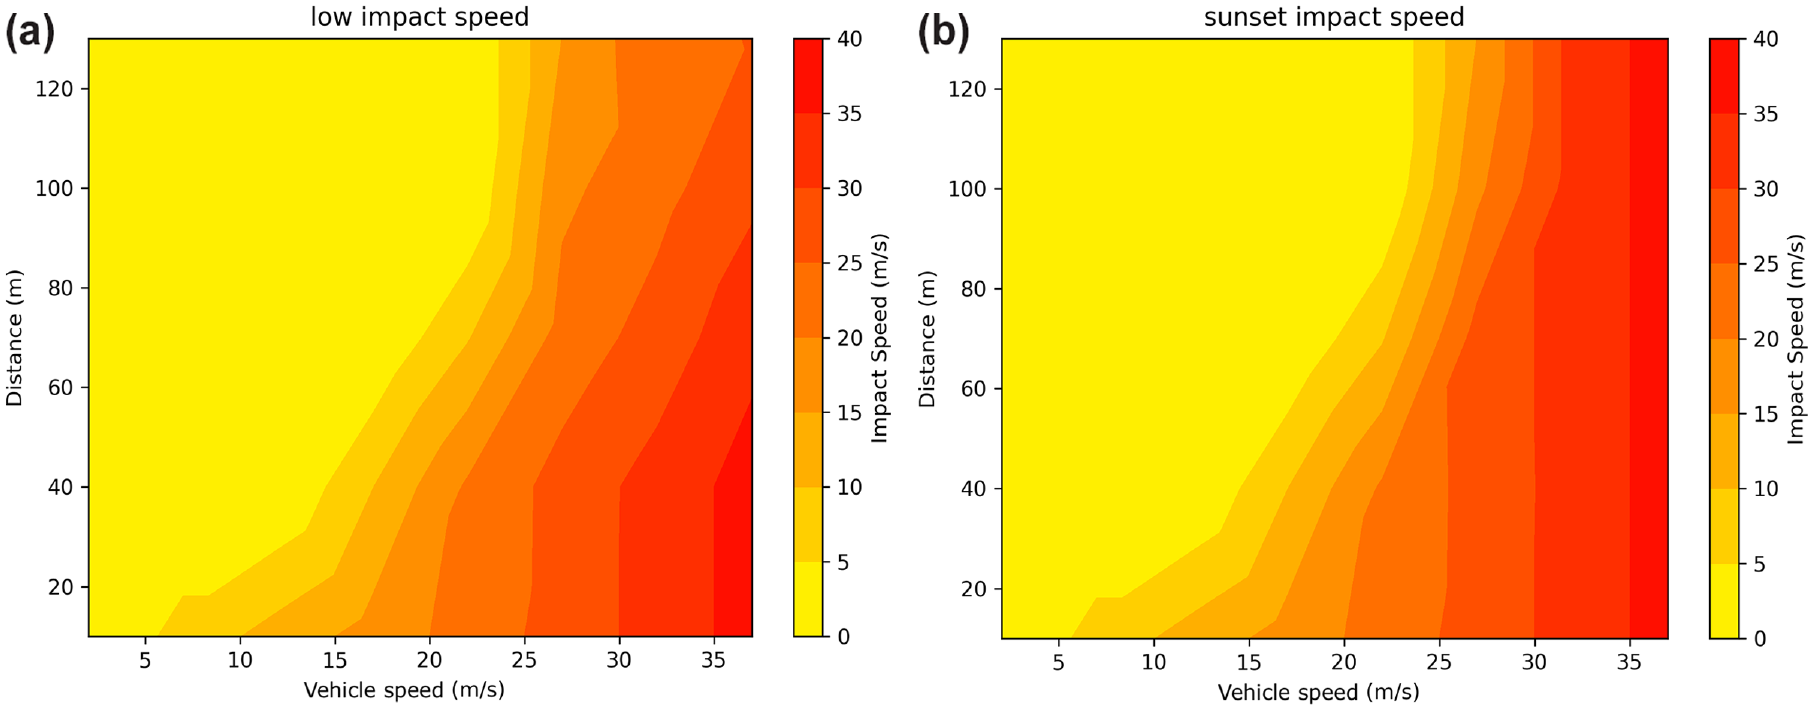
Impact speed contour for (a) low-resolution thermal and (b) visible during sunset conditions.
The initial speed and distance affect the speed reduction possible in the simulation and are important for the comparisons drawn. The average percentage of speed reduction is presented for all different solutions, for different initial distances, and for low (<50 km/h), medium (between 50 and 80 km/h), and high (>80 km/h) initial speeds in Figure 17, a –c, respectively. In low-speed conditions, the speed reduction is close to the baseline for all different perception technologies, except for the visible camera during night conditions. Moreover, for initial distances longer than 10 m, the speed reduction reached 100% signifying that the collision is avoided. For medium and higher speeds, the success rate is smaller. Indeed, the proper reaction for those cases may be evasive steering to avoid the collision, as highlighted by Donà et al. ( 30 ). It is only for higher speeds that the impact of the high-resolution thermal camera is substantially better than all other solutions. Additionally, for higher speeds, because of the increased detection range of the low-resolution thermal camera, it even outperforms the visible light camera during daylight conditions. However, it remains to be more thoroughly investigated whether the improved range of the thermal camera is a physical characteristic or whether the HMI of the commercial vehicle limits the information on the driver’s dashboard and pedestrians far from the vehicle are ignored.
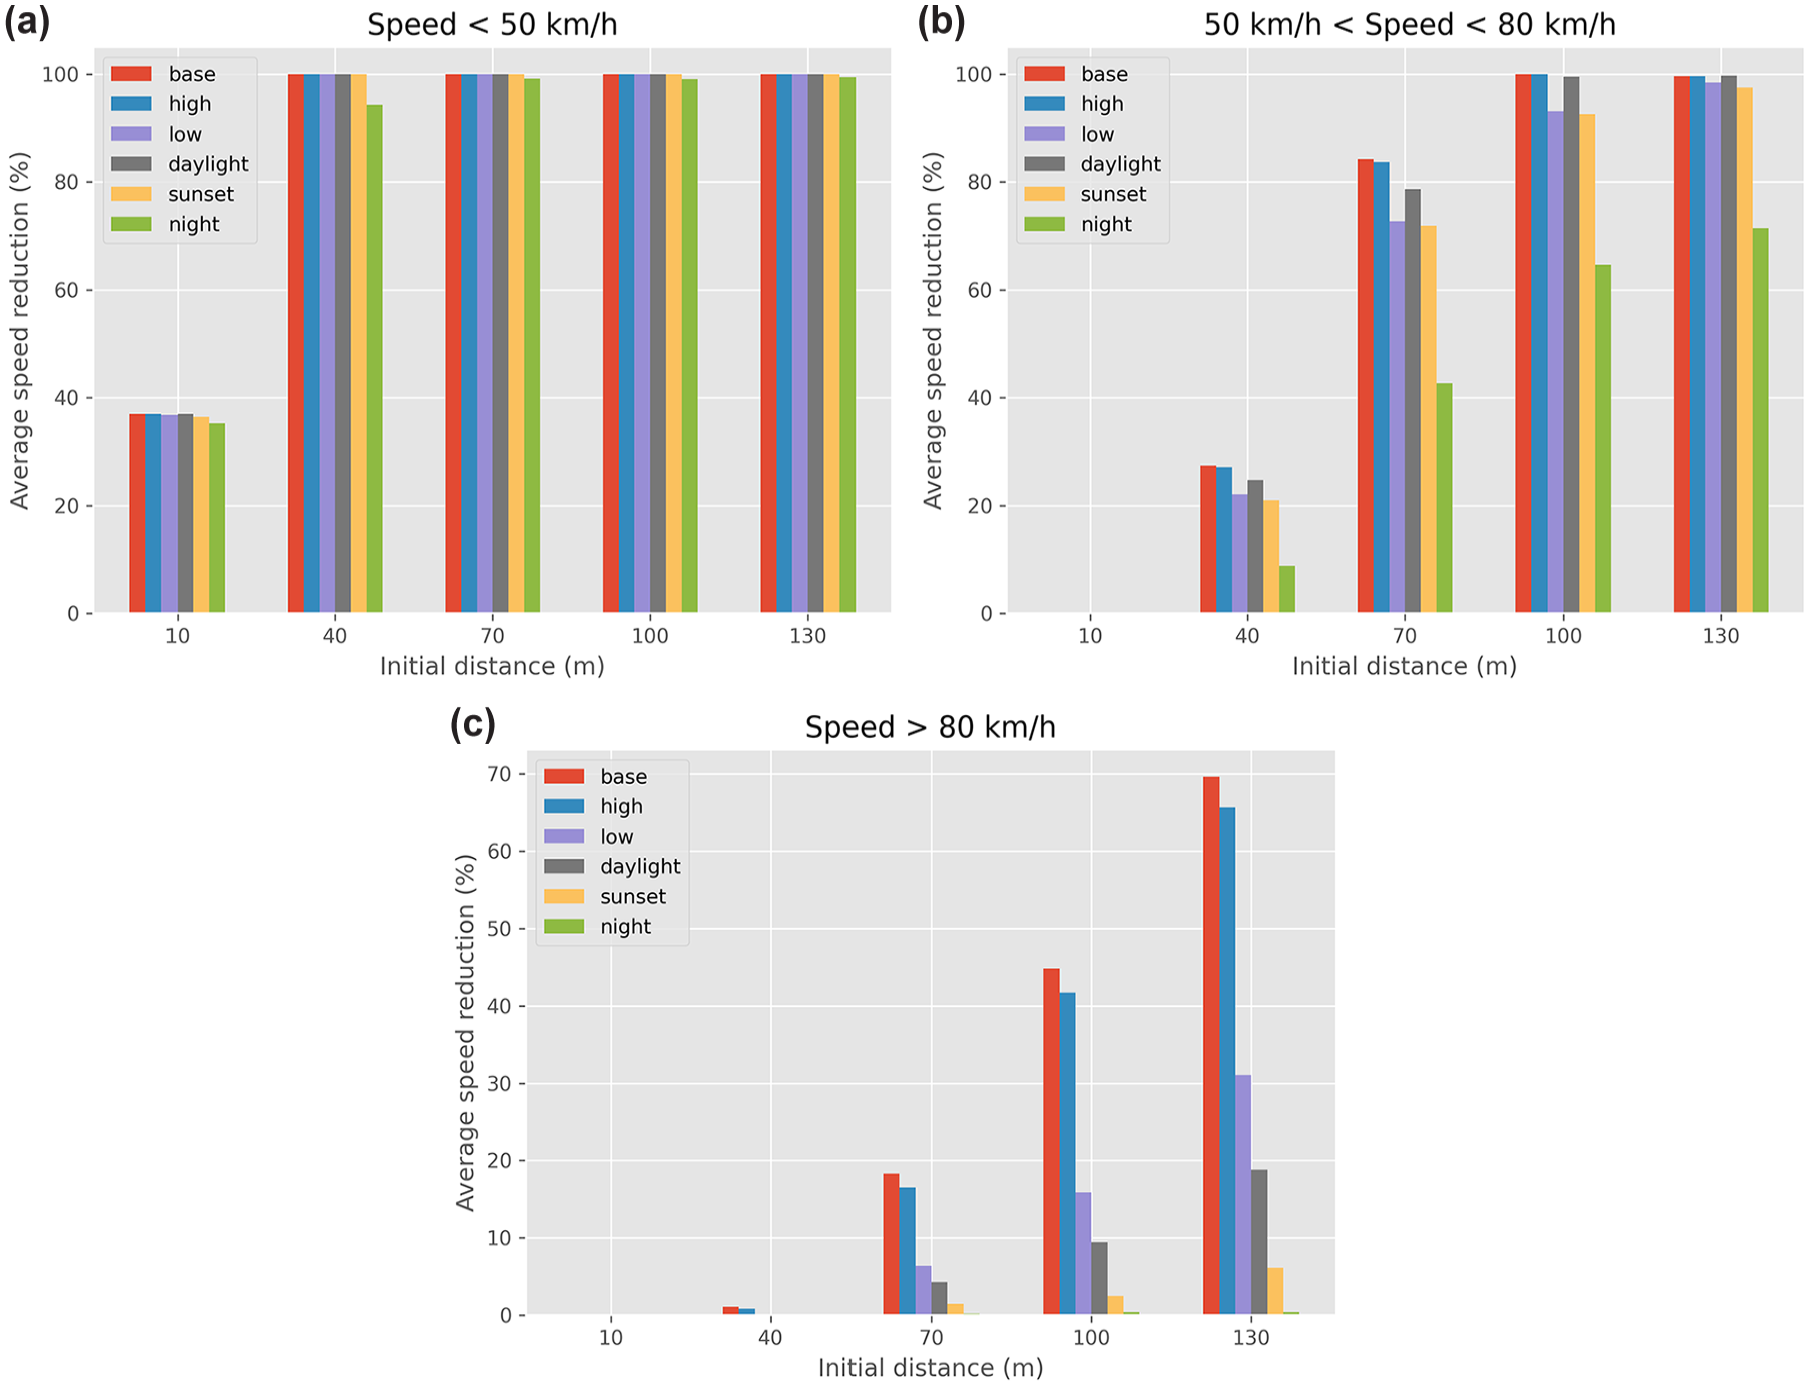
Average speed reduction percentage of all simulations for different speed bins: (a) low, (b) medium, (c) high, and for different initial distances.
Discussion
The thermal sensors returned noteworthy capability to detect pedestrians up to 150 m for the high-resolution camera. At such a distance, the average pedestrian is around 15 pixels tall. Thus, the detection algorithm is capable of detecting a pedestrian occupying only 15 pixels in the frame in the vertical direction. The low-resolution sensor provided good performance up to 80 m, where the size of the pedestrian falls below 10 pixels. Therefore, moving from 320 × 240 pixels to 640 × 480 pixels, which equals multiplying by four times the number of pixels available, shows tangible improvements to the detection distance and consistency of the measurements. An additional benefit is the capability of the higher resolution sensor to streamline the neural network detection effort that returns a larger separation between the true positives and discarded false negatives. Based on these findings, we can claim that additional pixels of the VGA sensors are effectively exploited. Conversely, the analysis validated that the external illumination conditions do not affect the infrared sensor detection in a statistically significant way, corroborating that a thermal-based VRU identification system might be effective at night. On the contrary, as illumination degraded, the visible camera started to be less effective. Therefore, infrared sensors bring an additional safety benefit at sunset and in night conditions. Eventually, the detection capability resulted in being unaffected by the areas (i.e., urban versus rural environments). The disturbing elements in the more crowded urban settings did introduce a statistically significant detection degradation. It should additionally be noted that an industrially produced neural network may lead to even better results.
For safety, we validated the degradation of the benefits of the visible camera in night conditions. Even considering the uncertainty of what the industrial system is really capable of perceiving, as the information used comes from the driver’s dashboard, there have been cases of the pedestrian not being perceived for small distances. The simulation results show that this can have an important safety impact, with pedestrian collisions not being avoided or even mitigated even for urban speeds. Therefore, the use of thermal cameras can have significant impacts on safety. Especially for the case of the high-resolution thermal camera, the safety conditions are even better than the normal camera during daylight conditions. The low-resolution camera has been shown to be sufficient for avoiding and mitigating most collisions at urban speeds. However, for higher speeds, its performance is worse than the high-resolution camera. The safety benefit can be unequivocally grasped in Figure 17 for different speeds and distances. Indeed, the high-resolution thermal sensor showed mitigation capabilities close to the baseline case with perfect detection, which are especially valuable as the speed is increased.
The results point to different suggestions for different levels of driving automation and different types of systems. For ADAS, and particularly AEBS functions, it is worth considering that their application is already limited at higher speeds. Therefore, for lower speeds, there is a clear benefit in using thermal cameras, especially to counter the degradation of the capabilities of visible cameras during night conditions. As such, low-resolution cameras could be suitable for ADAS applications. Moreover, the results suggest that thermal cameras have better capabilities for long distances. This can bring benefits to forward collision warning systems. Such systems do not intervene at the last moment as the AEBS but warn the driver in advance. The difference between using a high- or low-resolution thermal camera could affect the result; however, forward collision warning systems are not automated driving applications, and the driver is still required to actively perform the whole driving task.
Although a low-resolution camera can be considered to be sufficient for active pedestrian safety systems and similar ADAS, the requirements are stricter for highly automated systems. For example, even if the chances of finding pedestrians on highways are slim, when it happens, it is possible that there is a specific reason for that, and this is something a human driver can often deduce by observing the surroundings. For an ADS, if it is able to operate during night conditions, performance similar to that of the high-resolution sensors is necessary, as such deduction will not always be possible. From a policy perspective, it is important to document the performance of the high-resolution cameras, as it can set the baseline and be useful for manufacturers that are willing to use other combinations of sensors.
Conclusions
In this study, experiments have been conducted to acquire data for the performance of thermal and visible cameras in perceiving pedestrians. The experiments are run in different locations (urban, rural) and under different illumination conditions (daylight, sunset, night). The data collected were analyzed to understand the detection capabilities of these cameras. To the best of the authors’ knowledge, this is the first study detailing the role of confidence degradation over distance, which can have a significant effect on safety. Furthermore, the results of this analysis have been used to set up simulation experiments to estimate the safety effects for a wide range of different conditions.
The use of low-resolution thermal cameras can be effective for low-speed (urban) conditions and can be beneficial for ADAS applications in pedestrian safety. It remains to be seen whether a more complex neural network could bring better results, even for low-resolution cameras for large distances. Otherwise, for ADS systems, high-resolution thermal cameras can be considered necessary, if nighttime operation is inside the operational design domain, especially for ADS systems that operate at higher speeds.
Nonetheless, the comparison with the visible cameras will need additional research as a proper assessment of the detection capability was not possible because of the original equipment manufacturer restrictions on the signals that can be accessed via onboard diagnostic. Thus, only a heuristic estimation could be provided based on the HMI indications. We plan to perform additional tests during the summer season to investigate whether warm weather and higher humidity might degrade the performance of thermal camera.
Footnotes
Acknowledgements
The authors are grateful to JRC colleagues who supported the testing campaign, Antonio Migneco and Germana Trentadue.
Correction (November 2024):
Article updated to include a Declaration of Conflicting Interests statement; for further details see the Declaration of Conflicting Interests at the end of the article.
Author Contributions
The authors confirm contribution to the paper as follows: study conception and design: K.M., R.D., G.D., J.M., S.T., B.C.; data collection: K.M., R.D., S.V., G.D., J.M.; analysis and interpretation of results: R.D., K.M., G.D., J.M.; draft manuscript preparation: R.D., K.M. All authors reviewed the results and approved the final version of the manuscript.
Declaration of Conflicting Interests
The author(s) declared the following potential conflicts of interest with respect to the research, authorship, and/or publication of this article: Authors Riccardo Donà, Konstantinos Mattas, Sándor Vass, and Biagio Ciuffo are employed by the funder, Joint Research Centre, European Commission, Ispra, Varese, Italy. The opinion expressed in the manuscript are those of the authors and should in no way be considered to represent and official opinion of the European Commission. Mention of trade or commercial products does not constitute endorsement or recommendation by the authors or the European Commission.
Funding
The author(s) disclosed receipt of the following financial support for the research, authorship, and/or publication of this article: The work was supported by the Joint Research Centre for the European Commission as part of the Living Lab project.