
Abstract
Winter storm severity, road surface conditions, traffic volume, and vehicle speed can influence the risk of winter-related vehicular crashes. The severity of a winter storm depends on many climatic factors, including precipitation type, intensity and duration of the storm, wind speed, air temperature, and pavement surface temperature. The rapid growth of snow and ice layer thicknesses on the road surface significantly reduce the grip between tires and the road surface, leading to hazardous travel conditions. Our investigation shows that vehicular crash rates in winter months have an inverse linear relationship with the 10th percentile grip statistics, which is a function of how quickly the road was plowed and salted and the bare pavement conditions regained. We found a logarithmic relationship between the ice and snow layer thicknesses and the grip loss. We developed a new model for forecasting ice layer thickness growth rate as a function of the relative humidity, dewpoint temperature, and pavement temperature. Real-time monitoring and forecasting the spatial and temporal variability of the grip on a road network can help road authorities to better optimize the salt application strategy for a given winter storm event and prioritize the timing and frequency for the deployment of their fleet of winter maintenance vehicles on different salt routes to minimize vehicular crash rates.
Keywords
Winter storms can cause significant traffic delays and disruption and increase the rate of vehicle crashes because of the reduced road surface traction (grip) on snow and ice-covered roads ( 1 , 2 ). The application of de-icing salts and brine effectively prevents ice formation on roads before or after snow removal and improve safety especially on roads with high traffic volume and greater speed limit by increasing grip. (3–5).
Winter weather conditions can reduce the tire grip on road surfaces, increasing the risk of crashes (6–8). Several factors can affect the road grip, including the pavement surface material and age, the rubber quality and the age of the tires, the contact pressure between the tire and the road, and the water, ice, and/or snow layer thicknesses (9–12). Roy et al. ( 13 ) investigated the impact of road geometry, grip, vehicle body types, and road surface conditions on crash frequencies using the development of crash prediction models as safety performance functions. The measurement of grip is essential for assessing road conditions and ensuring safe driving ( 7 , 14 , 15 ).
Generally, the measurement of pavement friction (e.g., the British Pendulum Tester and the Dynamic Friction Tester) is based on determining kinetic energy lost in a laboratory or in a field at low speed ( 16 ). Some countries have adopted friction measurement guidelines for acceptable grip to ensure road safety related to different average annual daily traffic (AADT) and speed limits ( 17 , 18 ). There is a strong relationship between increased crash rates and low friction. For example, the crash rate of 0.2 vehicle crashes per million vehicle miles travelled (VMT; note: 1 mi = 1.609 km or VMT = 1.609 vehicle kilometers travelled) at a road surface grip of around 0.35–0.44 (unitless same as coefficient of friction) can increase fourfold when grip falls below the critical threshold of 0.15 ( 9 , 17 ). Similarly, the crash risk is four times higher for a snowy or icy road surface compared to a bare road surface ( 19 ). However, driving safety are related to various factors such as weather, road surface characteristics, vehicle conditions, and the skills of the driver on roads with poor friction ( 17 , 20 , 21 ).
McCarthy et al. ( 22 ) demonstrated the importance of grip in crash rates through evaluating crash rates as a function of AADT and grip, and they emphasized the critical role of road surface conditions in winter weather, such as ice and snow, in influencing road safety outcomes. According to the Ministry of Transportation of Ontario (MTO) in Canada, the maximum annual crash rates range from 0.37 to 0.45 collisions per million VMT, but the maximum values for winter crash rates range from 0.58 to 0.71 collisions per million VMT for major highways in Ontario ( 23 ).
Weather conditions, tire properties, pavement texture, and ice/snow/water thickness can dramatically reduce grip ( 12 , 24 ). Both snow and ice layer thicknesses are significant factors in reducing a vehicle’s grip on a road surface during and after winter storms (25–28). Researchers have also investigated grip experimentally under various slippery surface conditions. The skid resistance of icy pavement exhibits a sharp decline under wet and low-temperature conditions when compared to wet or dry pavement surfaces ( 21 , 29–31). Table 1 shows an overview of studies on road grip based on various influencing factors using empirical, experimental, theoretical, and statistical models.
Summary of Developed Studies on Grip
The ice growth rate can be an order of magnitude faster under specific climatic conditions conducive to rapid ice growth and can catch road authorities off guard and expose the public in hazardous low-grip driving conditions. The existing studies have developed grip models based on weather factors with complicated methods such as experimental and physical models. Despite the importance of grip for road safety, there is no practical method for forecasting grip to help road authorities better prioritize the timing/frequency for the deployment of winter maintenance vehicles on different salt routes within their road network. Today’s road weather information systems (RWIS) can forecast meteorological variables but does not necessarily forecast road grip.
Therefore, the main objective of this research is to show the relationship between grip and traffic crashes, advance our knowledge on the key climatic factors that influence the ice layer thickness growth rate, and take advantage of mobile road surface monitoring and RWIS forecasts for real-time mapping of grip conditions on a road network during a winter storm event. Real-time mapping of grip on a road network can help road authorities better prioritize the timing and frequency of the deployment of the fleet of salt trucks to different salt routes and determine salt application rates to achieve acceptable grip conditions.
Methodology
Road Surface Monitoring
Winter maintenance supervisors monitor snow and ice conditions using various technologies, including RWIS, to improve road friction and to ensure road safety. Haavasoja et al. ( 36 ) used Vaisala ROSA Road Weather Station to measure ice layer thickness and compared it with laboratory tests of the vehicle’s grip, and they showed that an ice layer thickness of 0.05 mm is the lowest threshold value for slippery conditions.
There are several installation types for road monitoring systems. Some systems have the sensors embedded directly into the road (e.g., Lufft IRS31 and Vaisala DRS511). Other systems use non-invasive sensors which are installed on the side or over roads (e.g., Lufft NIRS31, Vaisala DSC111, Vaisala DSC211, and Vaisala DST111). Mobile systems use sensors that are installed on various types of vehicles (i.e., Lufft’s MARWIS, Teconer’s RCM411, High Sierra’s Mobile IceSight, and Vaisala’s DSP310). These mobile sensors can monitor important measurements such as status of road surfaces, ice/snow/water layer thicknesses, and road surface temperature ( 14 , 15 ). A network of Vaisala DSC111 instruments has been installed along the Finnish road network to monitor prevailing friction conditions. The instruments measure the thickness of water, snow, and ice layers on the road surface ( 25 ).
Haug and Grosanic ( 14 ) investigated water film thickness and road surface conditions using embedded and non-invasive sensors. Li et al. ( 8 ) monitored pavement temperature and layer thickness of ice and snow using Vaisala MD30, and they used the T2Go tester for grip. As demonstrated in northern Idaho, the integration of sensor technology with anti-icing programs resulted in substantial reductions in winter maintenance labor hours and lower crash rates ( 37 ).
Data Collection
In this study, road weather observation datasets on, for example, ice/snow/water layer thicknesses, grip, surface temperature, and dewpoint temperature, were obtained from several sources, including Finnish Meteorological Institute (FMI) and from Fintraffic in Finland, and the University of Vermont Transportation Research Center and the Colorado Department of Transportation in the United States. In addition, the University of Guelph research team has collected road weather datasets as a pilot study for selected salt routes within the city of Guelph, which is in southern Ontario, Canada. Table 2 provides a summary of the road weather data collected for this study.
Summary of Study Data Characteristics from Non-Invasive and Mobile Sensors
Note: RWIS = road weather information systems.
We used traffic volume and winter traffic crash datasets to calculate the winter vehicle crash rate per million VMT. The traffic volume datasets were obtained from the Colorado Department of Transportation, the online Finish Transport Infrastructure Agency website, and the Vermont Open Geodata Portal. The traffic crash open datasets were obtained from the Colorado Department of Transportation, Vermont Agency of Transportation tool, and PxWeb Statistical databases for Finland. A summary of the online websites studied can be found in Table 3.
Summary of References Studied for Calculation of Crash Rate
Note: RWIS = road weather information systems.
Our research partners in Finland, Vermont, and Colorado have outfitted their RWIS fixed stations with non-invasive sensors, which allow for measuring road surface conditions (Figure 1a). Our research team installed the Vaisala MD30 on selected City of Guelph salt trucks as a pilot study, and plan to install it on city transit busses that continuously roam city streets (Figure 1b).
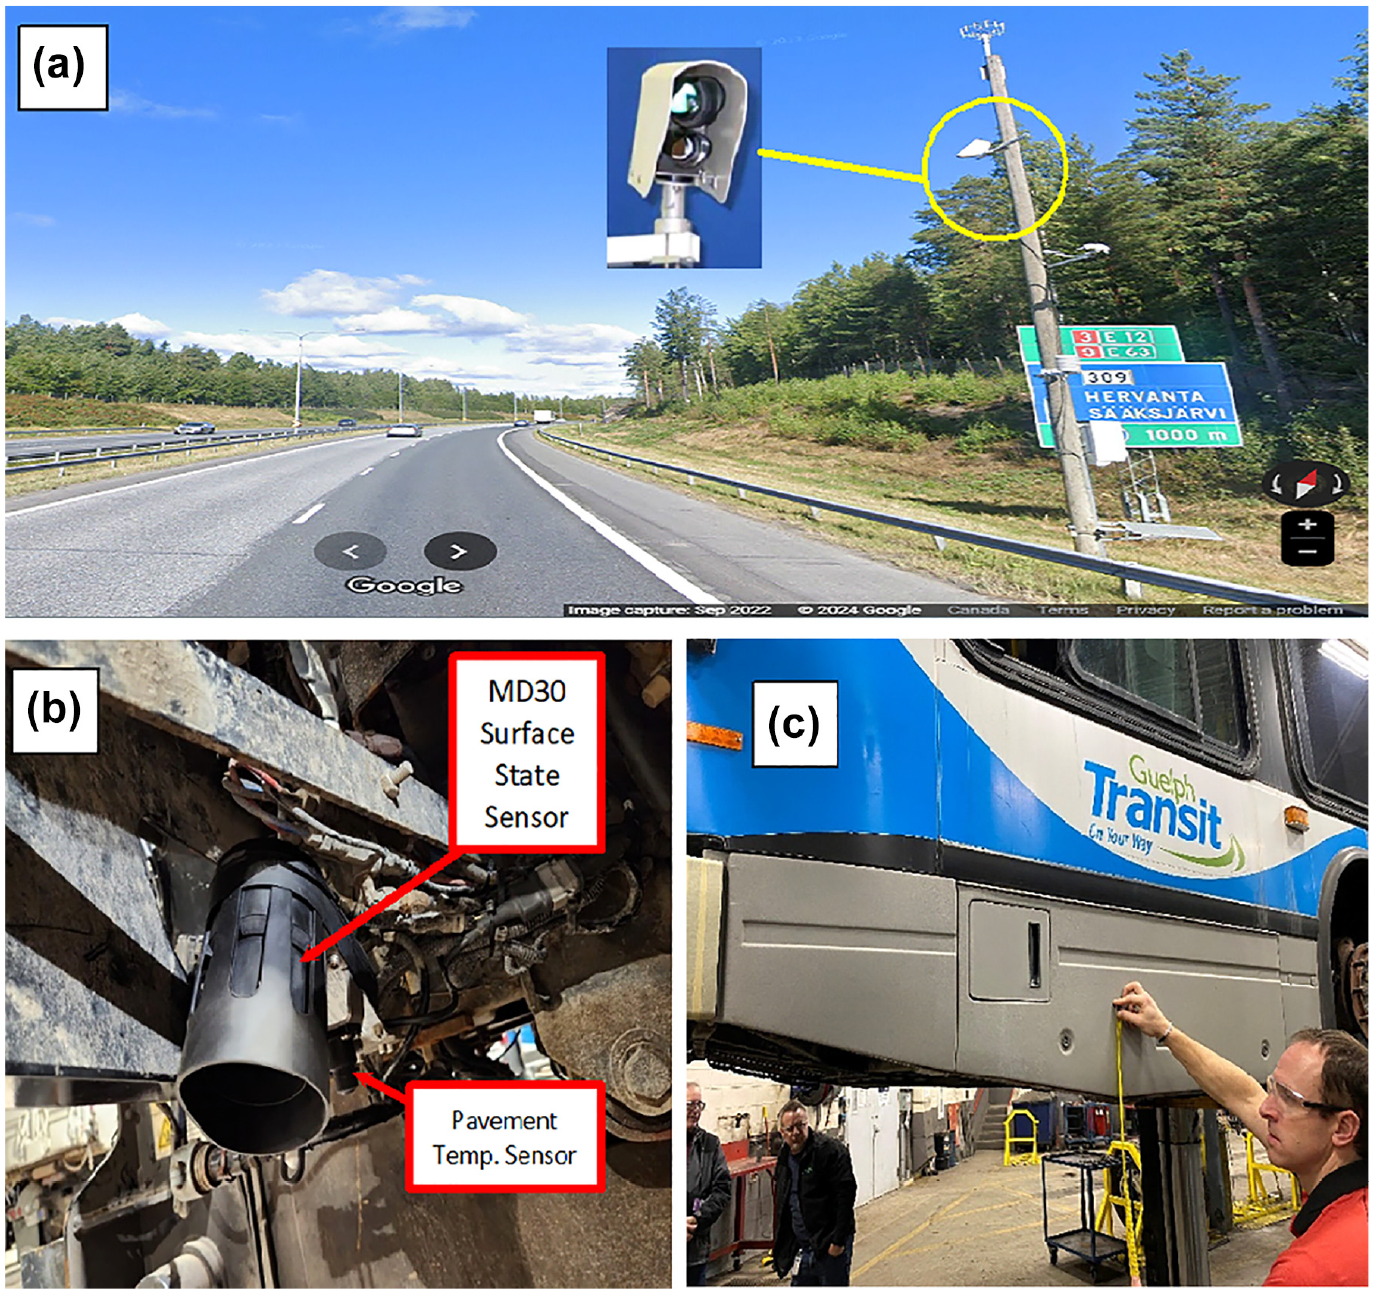
Road surface condition monitoring sensors: (a) RWIS fixed station in Finland, (b) MD30 mobile detector installed underneath the city of Guelph salt trucks, and (c) city of Guelph transit busses where the mobile detectors are being installed.
El-Rayes and Ignacio ( 38 ) highlight the advantages of the mobile RWIS compared to the fixed RWIS, stemming from the limitations of stationarity. McCaa ( 39 ) evaluated the forecast and measured road condition using a Vaisala MD30 mobile, remote road surface infrared sensor with an accuracy of roughly 88% during snowfall for winter road maintenance.
Table 4 shows the spatial and temporal variability of the climatic factors, and the road surface conditions for one of the primary salt routes in the city of Guelph, for which took about 2 h to complete the plowing and salting on the January 12, 2024, winter storm event. This salt route includes six road segments. The ice and snow layer thicknesses varied significantly both spatially, for different road segments within the city, and temporally during this dynamic winter storm event.
Summary of Measured Factors by MD30 For a Given Primary Salt Route in the City of Guelph on the January 12, 2024, Winter Storm Event
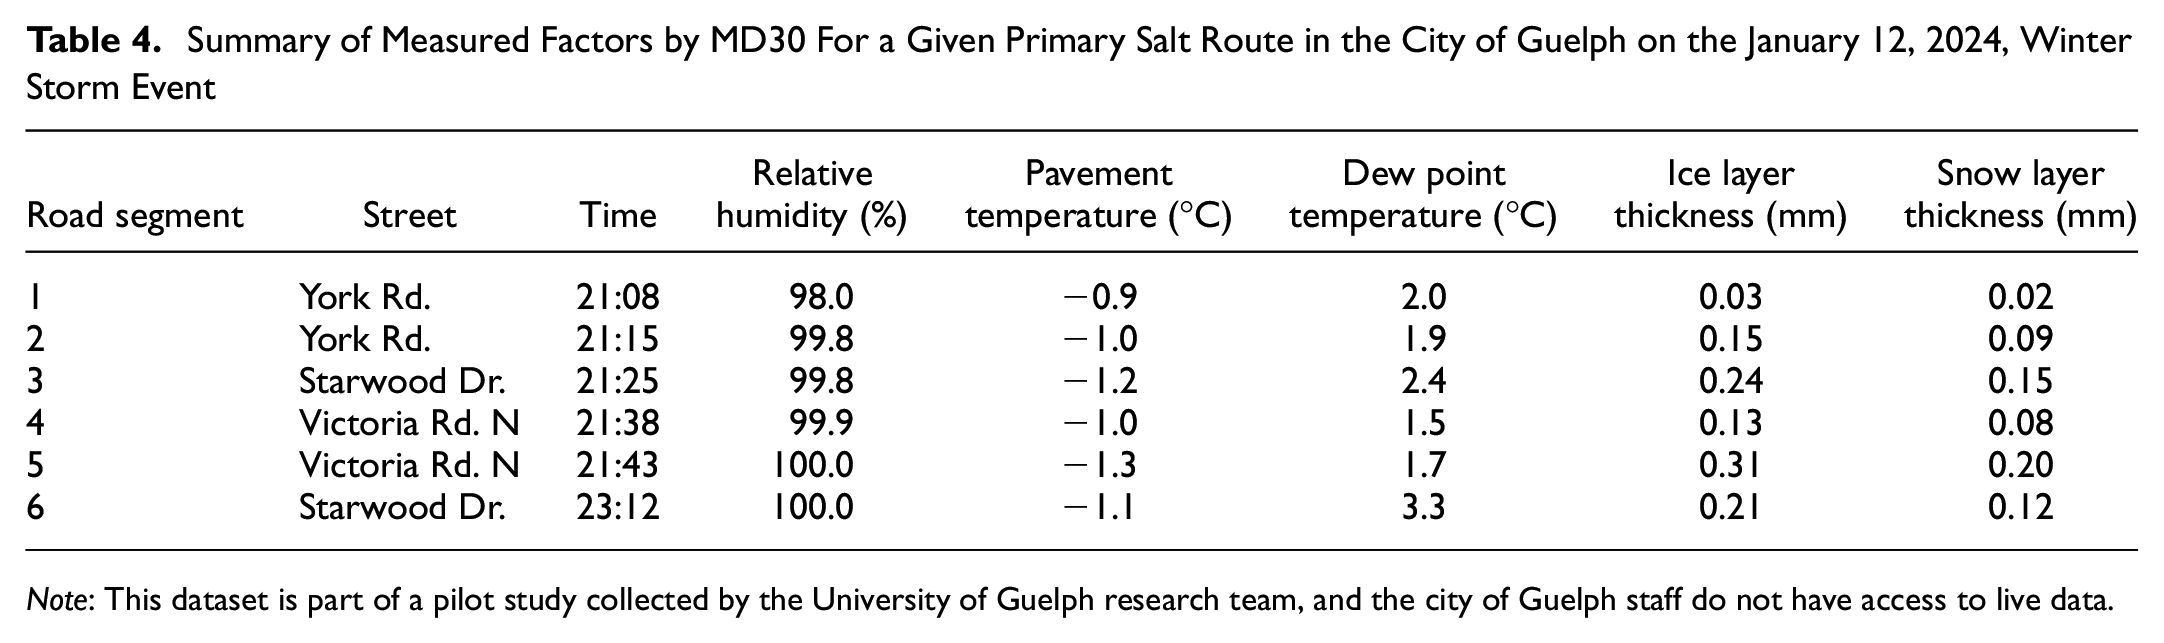
Note: This dataset is part of a pilot study collected by the University of Guelph research team, and the city of Guelph staff do not have access to live data.
In the future, smart salt trucks can benefit from road surface monitoring to optimize salt application rates based on road surface conditions to achieve higher road safety with precision salt application and better protect salt-vulnerable areas.
Group Method of Data Handling (GMDH)
The group method of data handling (GMDH), as one of the self-organizing networks, has been presented by Ivakhnenko ( 40 ) for solving complex relationships between variables in hydrology problems based on polynomial networks. Studies showcase GMDH’s effectiveness in diverse applications, such as flood prediction, which emerges as a crucial strategy for mitigating economic losses, predicting peak flows, and forecasting reservoir water levels ( 41 , 42 ). These applications demonstrate GMDH’s superiority over traditional methods and its capability to provide accurate predictions ( 43 ).
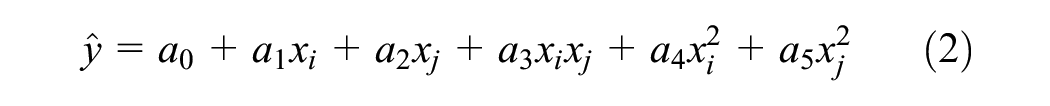
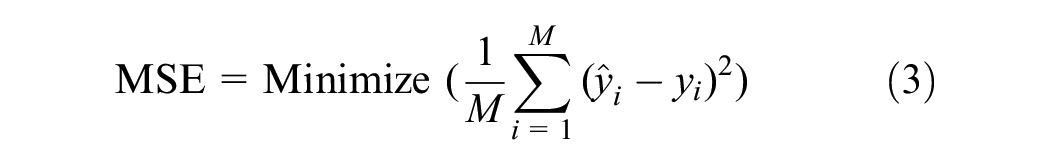
The Volterra series is presented in Equation 1, and its simplification as a second-order polynomial with two independent variables is presented in Equation 2. The GMDH creates a model with the relationships between variables using the combinations of the second-order polynomials. In the GMDH, the best fit between observed values was selected by minimizing the objective function in Equation 3 with M values, and is obtained based on the mean square error (MSE) representing the square of the difference between the actual (y) and estimated (
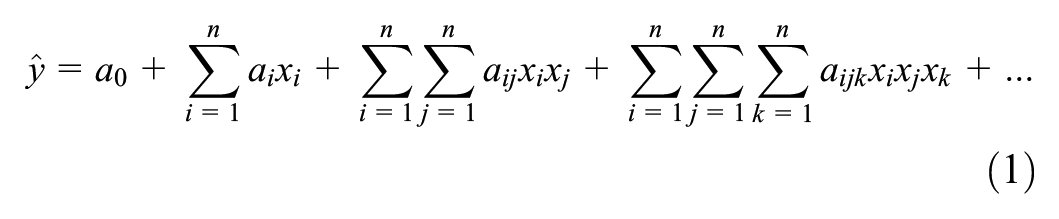
where (xi, xj, xk, …) represents input vector variables, n is the number of input, and (
Four input variables were considered in the GMDH model to predict an accurate ice growth rate (mm/h), which was trained using Vermont datasets and tested using Finland datasets. The input dataset for the ice growth rate model included relative humidity (%), dewpoint temperature (°C), pavement surface temperature (°C), and snow layer thickness (mm). The flowchart of the methodology is presented in Figure 2.

The flowchart of the model development methodology.
Discussion of Results
Effect of Grip on Winter Season Crash Rates
Grip as a performance measure is employed in some countries, such as Finland, to achieve the level of service (LOS) standard for different road classes. The risk of vehicle crashes is a non-linear function influenced by three key factors: speed limit, AADT, and grip loss. Figure 3 presents the grip non-exceedance curve based on 90 days of recording, from January 1 until March 31, 2023 (typical winter maintenance season) to find the 10th percentile grip for case study highways, and Figure 4 presents a strong correlation between the 10th percentile grip and the winter season crash rate per million VMT.
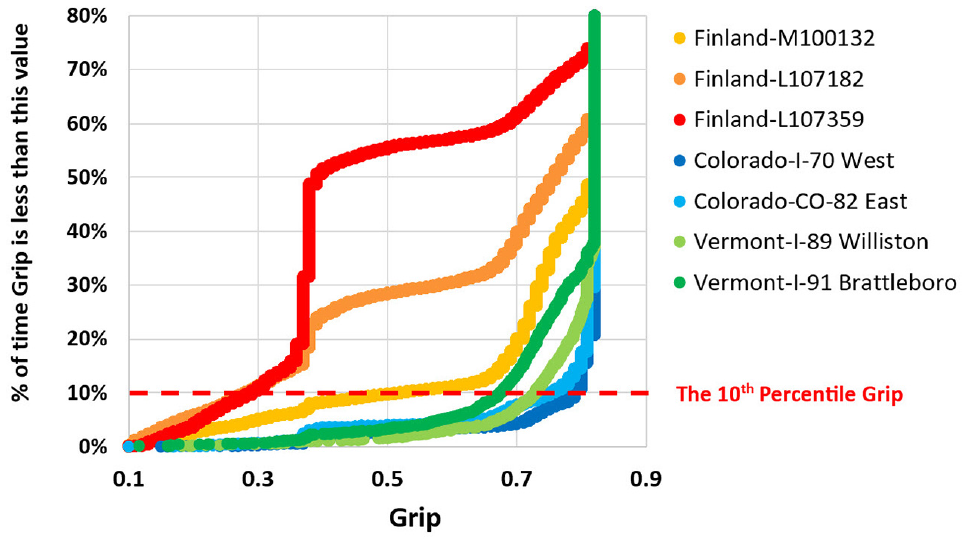
Grip non-exceedance curve based on January 1st to March 31st record.
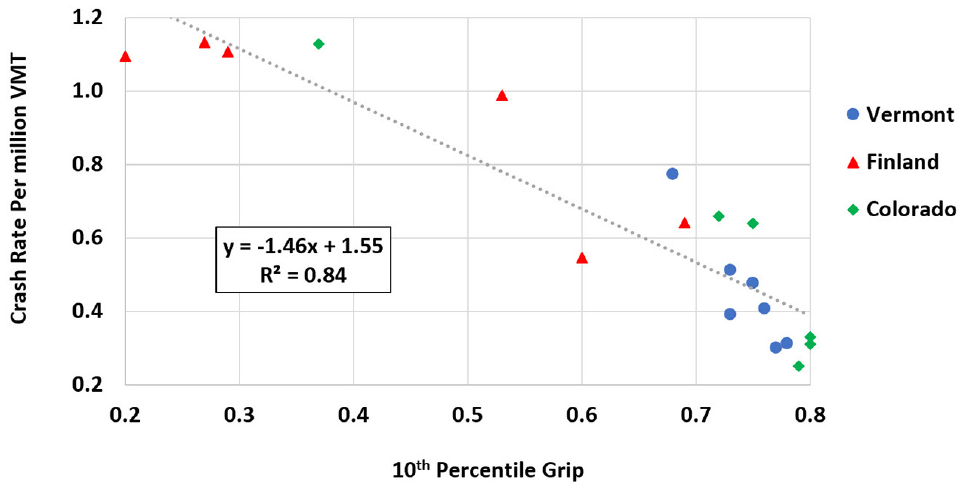
Winter season 10th percentile grip versus vehicular crash rates.
The 10th percentile grip is calculated using the grip distribution non-exceedance curves shown in Figure 3 during the 90-day period, and the numbers of vehicle crashes are provided from the online website in Table 4.
Finland-L107182 and Finland-L107359 are lower traffic volume areas, and the LOS is lower than the other highways shown on Figure 3.
The risk of car crashes would increase significantly depending on how low the grip would drop during a winter storm event and for how long the lower grip value persists until the salt truck arrives and restores the safe bare pavement grip conditions. The 10th percentile grip matches the expected LOS standards for measuring the performance of winter maintenance. For example, the MTO’s service commitment is to achieve the bare pavement standard after winter storms 90% of the time on an average basis.
Effectiveness of Layer Thicknesses on Grip Loss
Dowds and Minge ( 15 , 46 ) indicated that a grip range between 0.81 and 0.82 indicates dry surfaces with maximum friction. Figure 5 shows that rapid ice growth and the thicker ice layers on the road surface occur when the pavement temperature is between 0 and −3°C. When air and pavement temperatures are much colder than −5°C, precipitation is mainly in the form of dry powdered snow, and ice does not accumulate as quickly.
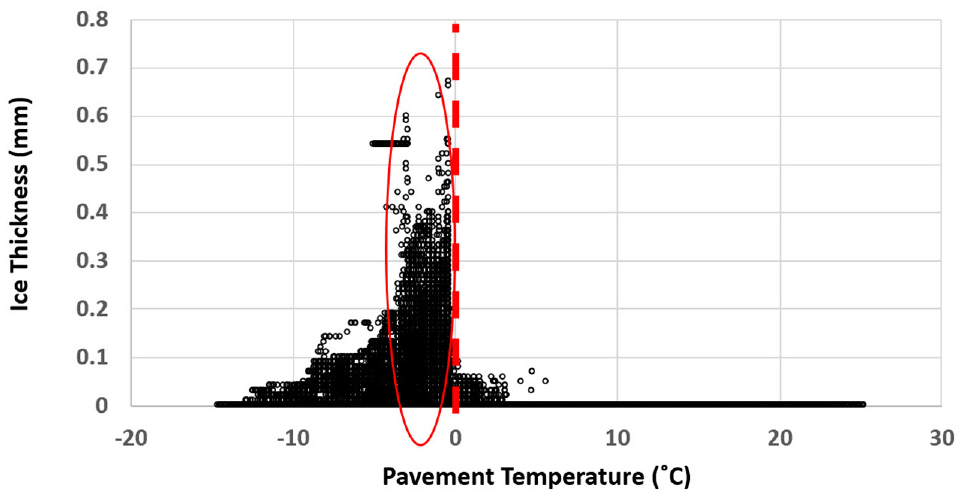
The relationship between ice layer thickness and pavement temperature.
Table 1 provides various factors influencing grip through empirical, experimental, theoretical, and statistical models. These existing models rely on experimental (field or lab) and physical relationships based on weather factors, while this study presents the impacts of two factors of snow and ice layer thicknesses on the grip, using a simple model based on reverse engineering. A non-linear function of ice and snow layer thicknesses with grip was trained using Vermont datasets, and, subsequently, it was tested and validated using datasets from Finland, as shown in Equation 4.
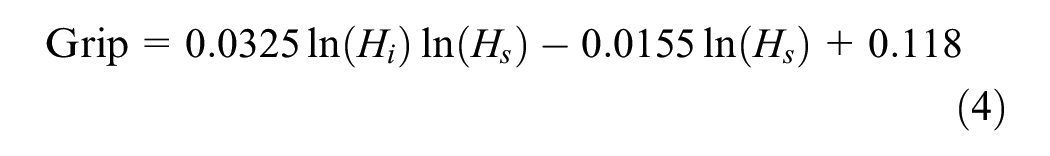
where
Figure 6 shows Equation 4, with the ice layer thickness holding constant. Grip drops most quickly when the ice layer thickness is relatively high, confirming the importance of ice layer thickness on grip. This finding indicates that the ice growth rate can be an effective predictor of grip loss.
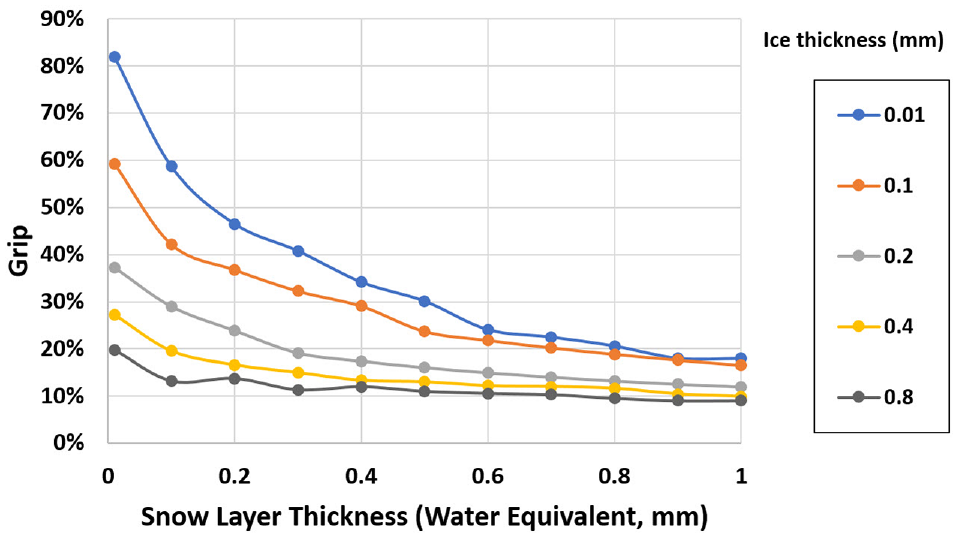
Grip as function of ice and snow layer thicknesses.
Ice Growth Rate Forecast Model
The ice growth rate was measured for the Finland and Vermont datasets. Figure 7 shows how the ice growth rate was calculated for a given winter storm event on the route of Interstate 91 in Vermont on January 13, 2018, by measuring the slope of the tangent line to the measured ice thickness at the beginning of the event (before the arrival of the salt trucks).
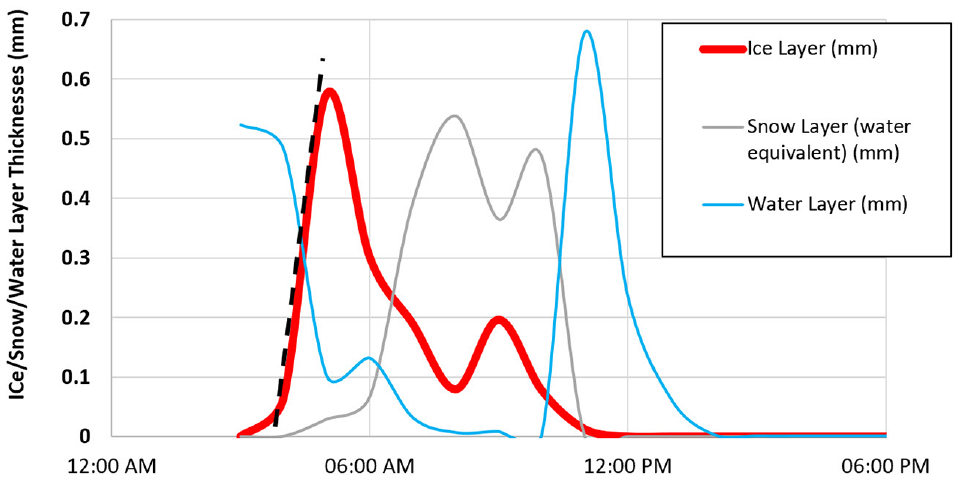
Measuring the growth of the ice layer thickness (dashed line).
The ice growth rate equation was developed using the GMDH model in this research. The rate of ice growth is influenced by four variables: relative humidity, dewpoint temperature, surface temperature, and snow layer thickness. The simplified ice growth rate equation is shown in Equation 5:
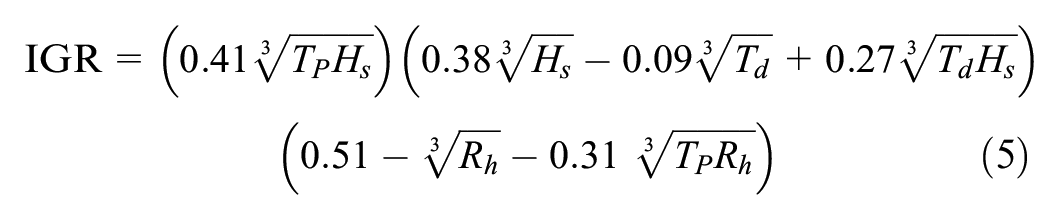
where IGR is ice growth rate (mm/h),
The existing studies have discussed the influence of snow on ice layer thickness ( 3 , 6 ). The snow layer thickness is an important factor in determining the rate of ice growth. When the dewpoint temperature is near zero the snow layer thickness can be a source of water for the ice to grow faster, whereas at very cold dewpoint temperatures, when a thick layer of snow covers an ice surface, it significantly reduces the heat loss from the underlying ice to the cold air above, slowing down the ice growth rate.
Figure 8a demonstrates the effects of dewpoint temperature and snow layer thickness on the ice growth rate. It indicates there is more moisture content in the air when the dewpoint temperature rises, and it positively affects the ice growth rate. However, the effect of snow layer thickness on ice growth rate varies depending on the dewpoint temperature.
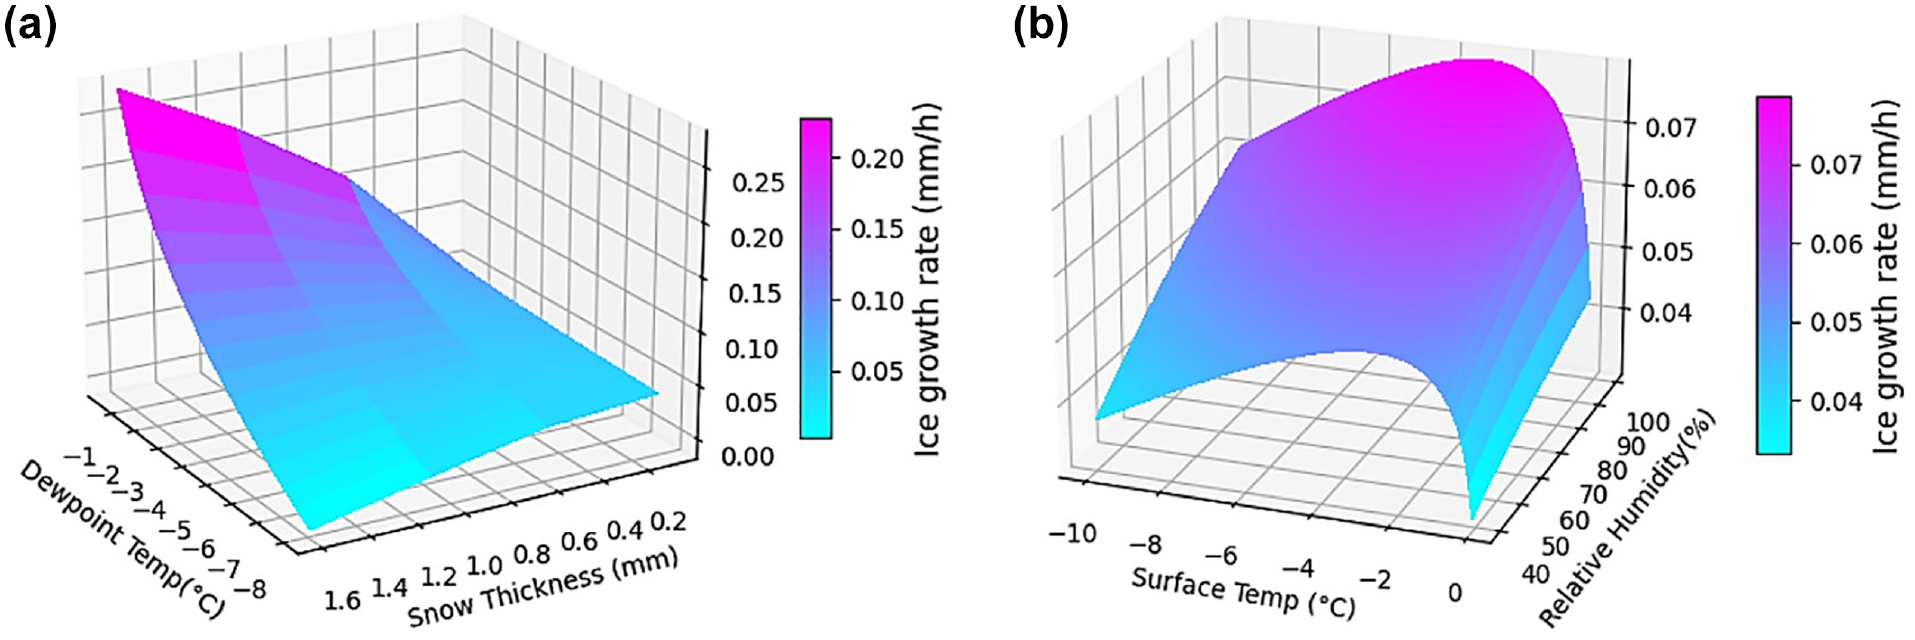
The effects of the different variables on ice growth rate: (a) dewpoint temperature versus snow layer thickness and (b) surface temperature versus relative humidity.
The impacts of surface temperature and relative humidity on the ice growth rate are shown in Figure 8b. The relative humidity influences the ice growth rate less than the pavement surface temperature. The highest ice growth rate occurs when the pavement surface temperature is around −2°C, resulting in the parabolic shape. The data shows that the melting point of ice has been reduced to −2°C because of the influence of de-icing salt applied on a road, and the rate of ice growth decreased when the pavement surface temperature remains below the melting point of ice.
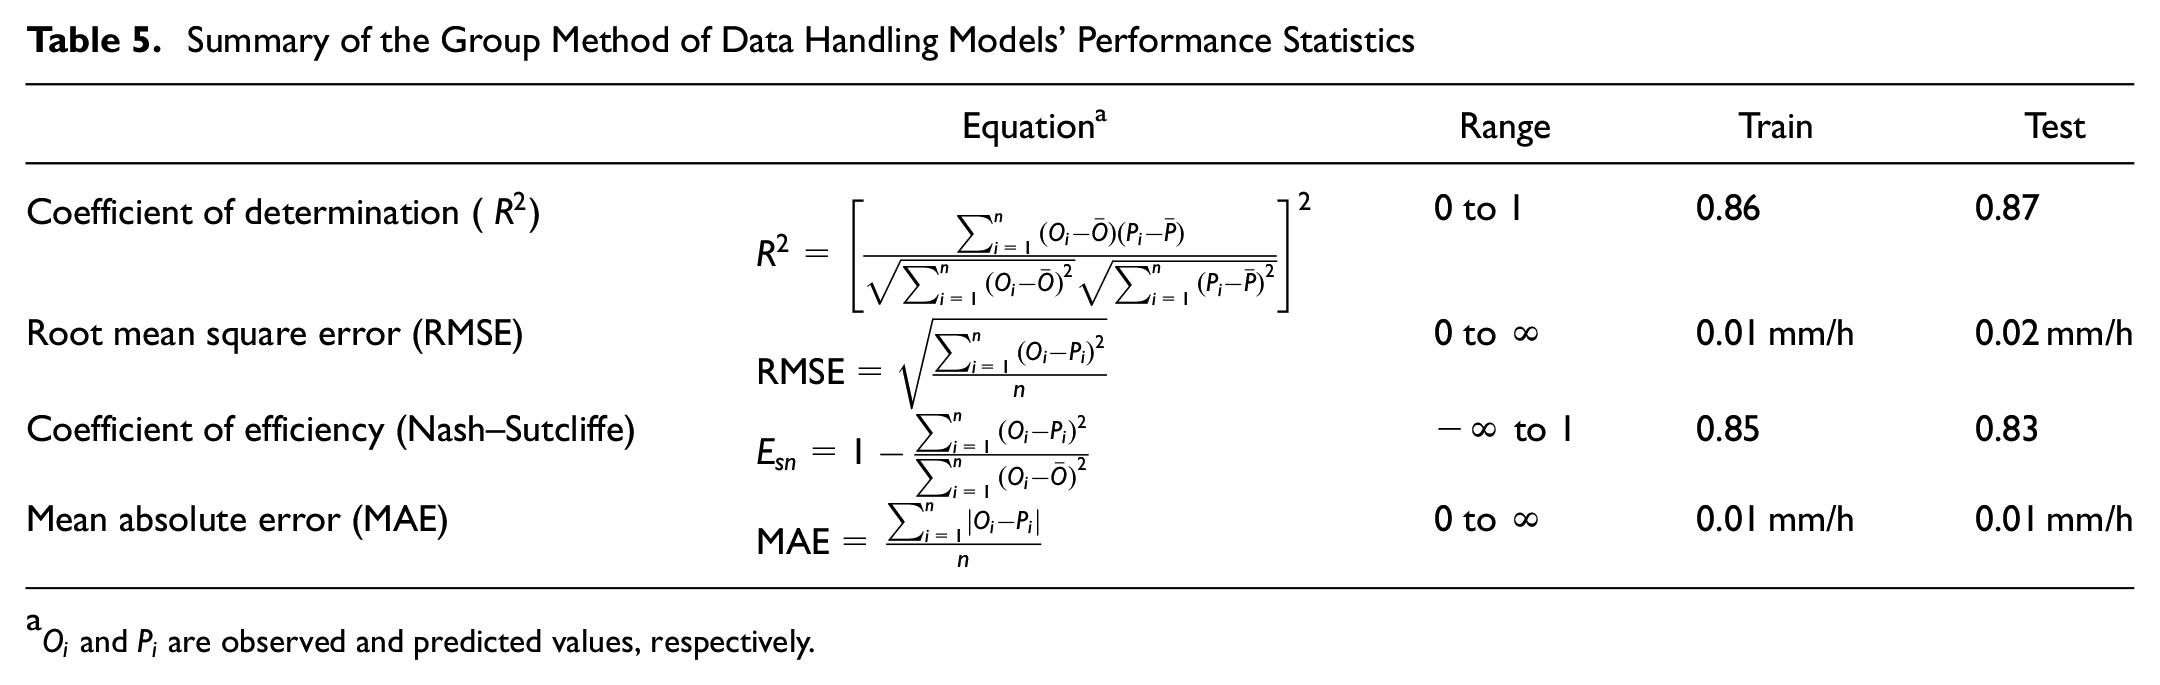
The GMDH non-linear regression model for hourly ice growth rate forecasts (Equation 5) was trained using 208 ice growth events (hourly measurements) from the Vermont highway datasets and tested using 197 events (hourly measurements) from the Finland highway datasets. The accuracy of the model has been determined using the statistical error indices for both the training and testing and reported in Table 5.
Summary of the Group Method of Data Handling Models’ Performance Statistics
In addition, Figure 9 displays the observed ice growth rate values and the range of lower and upper bounds, with a 95% probability being plotted for Vermont and Finland’s ice growth rate datasets.
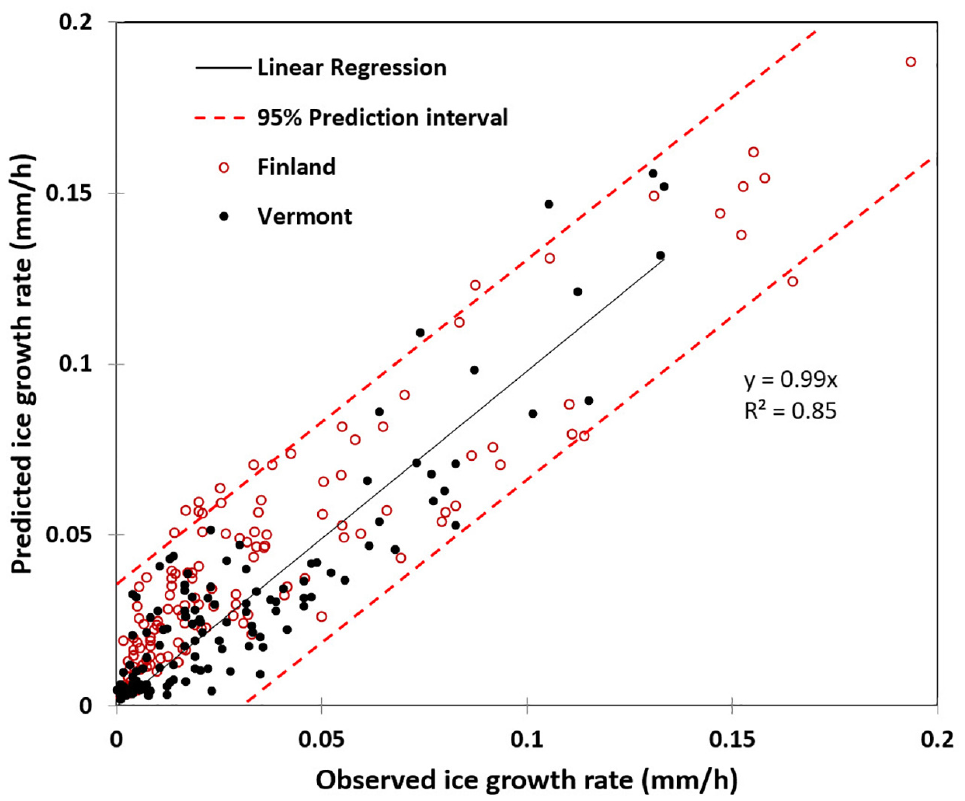
The relationship between observed and predicted ice growth rate.
As shown in Figures 8 and 9, the ice growth rate can vary significantly, depending on the relative humidity, dewpoint temperature, and the pavement temperature, from values as low as 0.02 mm/h to values as high as 0.2 mm/h. That is, under specific favorable climatic conditions for ice growth, when pavement temperature is hovering around −2°C, if there is snow on the pavement and moisture in the air (relative humidity of 100%) and the dewpoint temperature is hovering near 0°C, the ice layer thickness on the road can grow rapidly and catch road authorities and the commuters by surprise. Alerting winter maintenance supervisors and issuing early warnings to the public through a website that would map the grip conditions and forecasts on the road network to potential dangerous icy road conditions can reduce vehicular crashes, save lives and prevent property damages.
We developed the ice growth forecast model using GMDH to create a simple and easy-to-use but accurate non-linear regression model. We selected the GMDH because of its open and transparent final calibrated regression model that can be easily shared with road authorities to use with ease with Microsoft Excel and implement in their operations. For example, agencies could create an alert system based on ice growth rate that can predict upcoming loss of grip, rather than simply alerting drivers after grip is already lost.
Conclusions
Road authorities continuously work on improving road safety to reduce the risk of vehicular crashes, especially during major winter storm events and on roads with higher speed limits and greater traffic volume. However, road pavement surface texture (e.g., new versus aged asphalt, or concrete), pavement surface temperature, meteorological variables (e.g., solar radiation, wind speed, air temperature, storm duration, precipitation type [such as freezing rain, dry snow, wet snow]), accumulated precipitation, and precipitation intensity are all important factors that affect the build-up of ice and snow on a road surface.
The advancements in road surface monitoring sensors play an important role in real-time accurate measurement of snow and ice layer thickness and road grip, and in determining warning the public of slippery conditions, prioritization of the deployment of the salt trucks, salt application rates based on the road surface conditions, and LOS for a given road class.
Winter storm events can cause significant spatial and temporal variability of ice/snow/water layer thicknesses and loss of grip on the road network, depending on topography, wind speed, and direction. Also, tall buildings, forests, and different landforms can cause wind sheltering and shading. As a result, additional data is required to cover more varied conditions in the city. Accordingly, the Vaisala MD30 mobile road surface-monitoring sensors were installed as part of a pilot study on selected city of Guelph salt trucks and are planned to be installed on transit busses. In addition, we are exploring options to upload the data for real-time pavement temperature, ice/snow/water layer thicknesses, and the road surface traction (grip) before, during, and after the winter storms. Having a real-time map of the grip on the road network could help road authorities mobilize the fleet of plow and salt trucks on each route at the optimum time during a dynamic major winter storm event.
Our study indicates that during winter months, the frequency of crashes is inversely correlated with the 10th percentile grip statistics, which is a function of how quickly the road was plowed/salted and the bare pavement conditions returned. Additionally, we observed a logarithmic equation between the thickness of ice and snow layers and the decrease in road surface grip.
Subsequently, we developed a predictive model to forecast the ice layer thickness growth rate using climate data from road weather information systems (RWIS), including relative humidity, dewpoint temperature, snow layer thickness, and pavement temperature. This valuable insight can assist road authorities in implementing real-time monitoring and prediction of ice and snow layer thicknesses and grip levels during winter storms across their road networks.
The ice growth rate can be an order of magnitude faster under specific climatic conditions conducive to rapid ice growth, which can catch road authorities off guard and expose the public in hazardous low-grip driving conditions. However, by continuously monitoring and forecasting the spatial and temporal variations in grip levels across an extensive road network, road authorities can enhance the efficiency of salt-application strategy during a major winter storm event and optimize the scheduling of winter road maintenance operations on various salt routes to minimize the risk of car crashes.
Footnotes
Acknowledgements
This study has received funding from the Ministry of Transportation of Ontario (MTO) and the Natural Sciences and Engineering Research Council of Canada (NSERC). The authors would like to thank the Colorado Department of Transportation, the University of Vermont Transportation Research Center, and the Finnish Meteorological Institute (FMI) for the valuable datasets, as well as the City of Guelph, Flodraulic Controls and the Ontario Good Roads Association as our research partners. The authors are also grateful to the Undergraduate Research Assistant, Jennifer Elizarov, for all her help during this project.
Author Contributions
The authors confirm contribution to the paper as follows: Conceptualization (SET, HF and BG); dataset preparation (SET, and BG); methodology (SET, HF and BG); modelling (SET and BG); resources (BG); writing—original draft preparation (SET, HF, MH, JS, and BG); writing—review and editing (SET, HF, MH, JS, and BG); visualization (SET); supervision (HF and BG); funding acquisition (BG). All authors have read and agreed to the published version of the manuscript.
Declaration of Conflicting Interests
The author(s) declared no potential conflicts of interest with respect to the research, authorship, and/or publication of this article.
Funding
The author(s) disclosed receipt of the following financial support for the research, authorship, and/or publication of this article: This research was funded by the Ministry of Transportation of Ontario (MTO), and the Natural Sciences and Engineering Research Council of Canada (NSERC), Alliance Grant # 401643.
Data Accessibility Statement
The datasets used in this study have been received from the University of Vermont Transportation Research Center, Finnish Meteorological Institute (FMI), and the Colorado Department of Transportation.