
Abstract
The role of engineering, through infrastructure design, is known to influence safe driving behavior generally, yet the areas of possible intervention that could improve safe outcomes for teens are less understood. It is critical to identify interventions specific to teens, as they have different driving risk factors than more seasoned drivers, and motor vehicle crashes are the second leading cause of death among teens in the United States. We examined 5,210 fatal crashes from 2015 to 2019 in Ohio using Fatality Analysis Reporting System data. We employed multinomial logistic regression to associate the likelihood of fatal crashes involving younger teens (16 to 17 years old) or older teens (18 to 19 years old) relative to adults (20 years and older) with built environment, socioeconomic, and roadway characteristics at crash locations. Separating crashes into the two groups of teens allowed us to distinguish the possible impact of training, as younger teens are mandated to undergo driving education and behind-the-wheel training under Ohio’s graduated driver licensing laws. We found that compared with neighborhood socioeconomics, built environment factors were more significant predictors of the likelihood of fatal crashes involving younger teens compared with adults. Specifically, fatal crashes at locations with lower road density and more diverse land use were more likely to involve younger teens. Although these results could be related to a mix of younger teen driver behavior and exposure factors, the finding highlights that improving the safety of local roads in urban and rural settings could help stem teen driving fatalities.
Outside of the densest cores in the United States, the automobile is often the key to transportation accessibility as activities tend to be less collocated in one’s home region and transit service tends to be limited. Transportation provides critical access to economic, educational, and social opportunities; this is particularly true for America’s teens, whom, without a driver’s license, might be forced to forgo employment or even educational opportunities ( 1 ). Yet these opportunities come at a safety cost: motor vehicle crashes are the second leading cause of death in teens, with seven teens in the United States dying, on average, per day in vehicle crashes ( 2 , 3 ). Teen drivers are also less likely to respond to pedestrians and cyclists in an urban setting, and therefore are more likely to pose a safety risk to nonmotorized travelers ( 4 , 5 ). As framed by the foundational work of Frank Haight, teen driving is a moment in which mobility and economic freedom are in direct conflict with individual and community safety ( 6 ).
With the criticality of teen automobility and the public health crisis of teen driving fatalities, transportation planners have focused on investigating interventions to support teen driving safety. Planners’ influence can be framed by the four E’s of safety interventions—engineering, education, emergency response, and enforcement ( 7 )—and a temporal aspect (pre-, during-, and post-crash) of each intervention category, as introduced by the Haddon Matrix. Transportation planners have expertise, influence, and jurisdiction over two proactive, precrash interventions: engineering and education. Education has been a main focus of intervention since the 1970s, when driver education first started to be researched for its efficacy ( 8 ). Recent scholarship found that younger teens living in a state with graduated driver licensing (GDL) laws that require them to engage in formal driver education to secure early licensure—consisting of classroom or online driver education courses, informal practice, and behind-the-wheel training provided by licensed instructors—exhibit safer outcomes than older teens who are not required to engage in such education to secure licensure starting at 18 years old (older teens and adults) ( 9 ). Although this finding points to the value of education, there is a segment of teens who are resistant to learning safe driving skills, and remain aggressive drivers even after driver education programs ( 10 ). Driver education is therefore an important but incomplete solution; as transportation planners strive to identify and enact interventions that promote equity in mobility, it is incumbent on them to consider targeted, precise engineering approaches to address teen driver safety.
Although global and U.S. examples have shown that roadway redesigns can yield a significant reduction in overall crashes ( 11 – 13 ), the role of the built environment in teen crashes specifically is less well understood. Given the distinct behavioral patterns and developmental stages of teen drivers, it is imperative to explore how specific elements of built and socioeconomic factors in their driving environments influence their risk of crashes. As interventions hinge on an understanding of the role of the built environment on teen safety outcomes, this is the central goal of the study here. To understand the relationship between safe driving outcomes for teens and the built environment, we investigated the associations between fatal crashes that involved teen drivers and a series of neighborhood socioeconomic, built environment, and roadway characteristics using the state of Ohio as the study area. After reviewing the literature to understand the state of knowledge, we correlated the incidence of fatal crashes of younger teens (16 to 17 years old), older teens (18 to 19 years old), and adults (20 years or older) with variables describing the socioeconomic, built environment, and roadway characteristics at crash locations. To do so, we used a multinomial logistic regression model, which allowed us to relate our dependent variable, fatal crash outcomes, in three discrete age groups with our independent variables. For vulnerability measures, we chose actionable variables, such as roadway design types, location characteristics, and economic quartiles over race or other proxies for vulnerability ( 14 ). By including socioeconomic characteristics, we intended to control the contexts of the crash locations and identify structural issues related to the driving environment that influence teen driver crashes. We were able to conclude the types of urban environments and roadways that are correlated with a higher incidence of teen-driver-involved fatal crashes compared with adult-driver-involved fatal crashes. Our findings could facilitate the directing of planners toward infrastructure interventions and modification of driver education modules that will help to improve teen driver safety.
Literature Review
A large body of scholarship in teen driving safety, using diverse methods including driving simulation, surveys, observation, and crash data, has focused on teen driver behavior and the developing teen brain. Teens have been found to lack driving skills ( 15 , 16 ), specifically in hazard perception and management ( 17 – 19 ), and exhibit risk-seeking behaviors ( 20 – 23 ) compared with their adult counterparts. These findings have ultimately provided motivation for policies focused on teen driver education and license restriction to impart teens with the driving skills and experience they lack, as well as to address aggression behind the wheel. These policies take the form of GDL laws across the United States. Whereas the GDL laws vary from state to state ( 24 , 25 ), they generally incentivize or require teens to engage in driver training and, thus, gain safe driving skills with the promise of early licensure (typically defined as before 17 or 18 years old), if they engage in formal, behind-the-wheel training with a licensed instructor as well as in-person or online classroom instruction and independent practice with a licensed adult ( 26 ). Although the efficacy of driver education and GDL on the whole has been debated in the literature ( 27 – 30 ), recent studies have found that teens who completed the GDL requirements—including formal training—were less likely to crash than older teens who were not required to engage in formal and informal training ( 9 , 27 ).
Yet despite GDL laws, with which the United States has over 20 years of experience, there are shortcomings in their efficacy, as evidenced in the persistently high rates of teen crashes and fatalities. These shortcomings may be a result of the efficiency of driver education (such that the curriculum materials are specific to teen risk factors) ( 8 , 9 ), the financial and physical accessibility of driver education to teens ( 31 , 32 ), or both. The authors found that teens facing financial and physical accessibility constraints are less likely to engage in driver education and obtain early licensure ( 31 ). As a disproportionate percent of the high-poverty population and minorities live in areas with less financial and physical access to driver education ( 32 ), the accrual of safety benefits appears deeply inequitable, as it is focused on the least vulnerable. Moreover, scholars have noted that safety gains from GDL could be the result of suppressing and restricting early licensure ( 33 , 34 ).
A more equitable approach to addressing teen driver safety that does not rely on restricting teen mobility to ensure safe outcomes could be to focus on the engineering approach, or the modification of infrastructure to encourage safe outcomes. Yet, the answer to the question of specifically how a transportation planner might enhance safety infrastructure is opaque and geographically specific. Whereas it is well known from scholarship that the built environment is related to crashes and crash severity, the literature is conflicting. Urban environments have been found to be correlated with more crashes and with less devastating crashes ( 35 , 36 ), as have different roadway geometries ( 37 ). Yet other scholars have found that teens are more likely to crash in rural environments ( 38 – 41 ); more of these crashes could be fatal than urban crashes owing to speed, or fewer of them could be fatal because of fewer obstacles surrounding the roadway ( 42 ). It is possible that either higher crash or death incidences in urban or rural locations could be from exposure to traffic, but few studies include mileage counts in the comparison and analysis of teen crashes ( 43 ).
Specific to roadway design, scholars have used various data sources including the National Motor Vehicle Crash Causation Survey and the Strategic Highway Research Program 2 Naturalistic Driving Study to investigate scenarios under which teens are more likely to crash, finding that teens are more likely to crash at intersections and during left-turn movements ( 44 – 46 ) than their adult counterparts. Several models of crashes involving teens compared with adults based on a wide range of factors including vehicle design, personal factors, time of day, weather conditions, and roadway characteristics found a relationship between all the factors above and teen crashes ( 47 ).
Although there appears to be a link between the built environment and roadway characteristics and teen crashes, the topic needs more nuanced information at the built environment level. Current research primarily concentrates on two aspects: the general urban or rural nature of crash sites, or the specific maneuvers leading up to a crash, such as left turns versus straight travel ( 38 , 39 , 48 , 49 ). In addition, a substantial body of research concentrating on nonmotorized travel modes investigates how road design elements (like intersection types and road function classes), land use (including density and transit availability), and overall built environment (considering factors like road network connectivity and population density) influence pedestrian or cyclist–vehicle crashes ( 47 , 50–53). However, these studies often provide limited insights for formulating precise, targeted intervention strategies tailored to teen drivers. Age is frequently treated as an independent variable in these studies, aimed at understanding demographic differences and the exposure of vulnerable groups near crash locations ( 52 , 53 ), or to analyze the characteristics of those involved in crashes, particularly children and the elderly ( 51 ). Few have examined how the associations between fatal crashes and the characteristics of crash locations differ across driver age groups. We fill the gap in the literature by focusing on correlating the incidence of fatal crashes of young teens, older teens, and adults with variables describing the socioeconomic, built environment, and roadway characteristics at crash locations. Thus, we shed light on the role of increasing density of buildings, people, and roadways, as well as the detailed roadway classification and socioeconomic factors on the likelihood of teen drivers’ involvement in fatal crashes compared with older drivers.
It is important to note that our analysis uses individual fatal crashes as the unit of analysis, rather than aggregate fatal crashes by geography. Thus, our interpretation focuses on the likelihood of a fatal crash involving younger teen drivers relative to adult drivers. Because we do not have data representative of location-based rates, a finding that teens have a higher likelihood of crashing in an area with lower job density could mean that teens cannot navigate such areas as deftly as adults, or it could simply mean that more teens drive through areas with lower job densities. Either way, the ultimate interpretation—that fatal crashes are more likely to involve teens than older drivers in certain areas—is worthy of investigation and intervention in these areas. In doing so, we aim to prepare transportation planners and policy makers to engage in focused interventions to enhance the built environment.
Study Area
This paper investigates teen driver fatal crashes in the state of Ohio, focusing on its legislative restrictions on the driving privilege of teen drivers through GDL laws, similar to those in several other U.S. states. Under the Ohio GDL laws, teen drivers must hold a temporary permit and probationary driver’s license that are subject to safety restrictions for an extended period before obtaining a full license without restrictions at the age of 18 ( 54 ). Teen drivers are additionally subject to mandatory classroom or online driver education courses and behind-the-wheel training with a licensed instructor before obtaining a probationary driver’s license. New drivers aged 18 and above are exempt from these requirements. Geographically, Ohio encompasses densely urbanized cities (e.g., Cincinnati, Cleveland, and Columbus), suburban areas, and rural lands. The variety of typologies makes Ohio a robust study area for understanding how various geographic contexts may influence teen driver safety. Furthermore, the state of Ohio has an interest in developing driver education scholarship programs ( 55 ) and implementing innovative virtual driving assessments in the assistance of licensing exams for safety screening ( 56 ). Understanding Ohio teen drivers’ risks in fatal crashes would inform these efforts by expanding the knowledge of teens’ transportation safety and health outcomes.
Figure 1 shows the spatial distribution of all 5,210 fatal crashes that occurred in the state of Ohio from 2015 to 2019. In general, fatal crashes in Ohio are clustered in densely populated areas. Among them, 207 fatal crashes involved younger teen drivers (16 to 17 years old), and 308 involved older teen drivers (18 to 19 years old). Although many more fatal crashes involved teenagers as passengers or pedestrians, this study focuses on the fatal crashes where teenagers were the drivers.
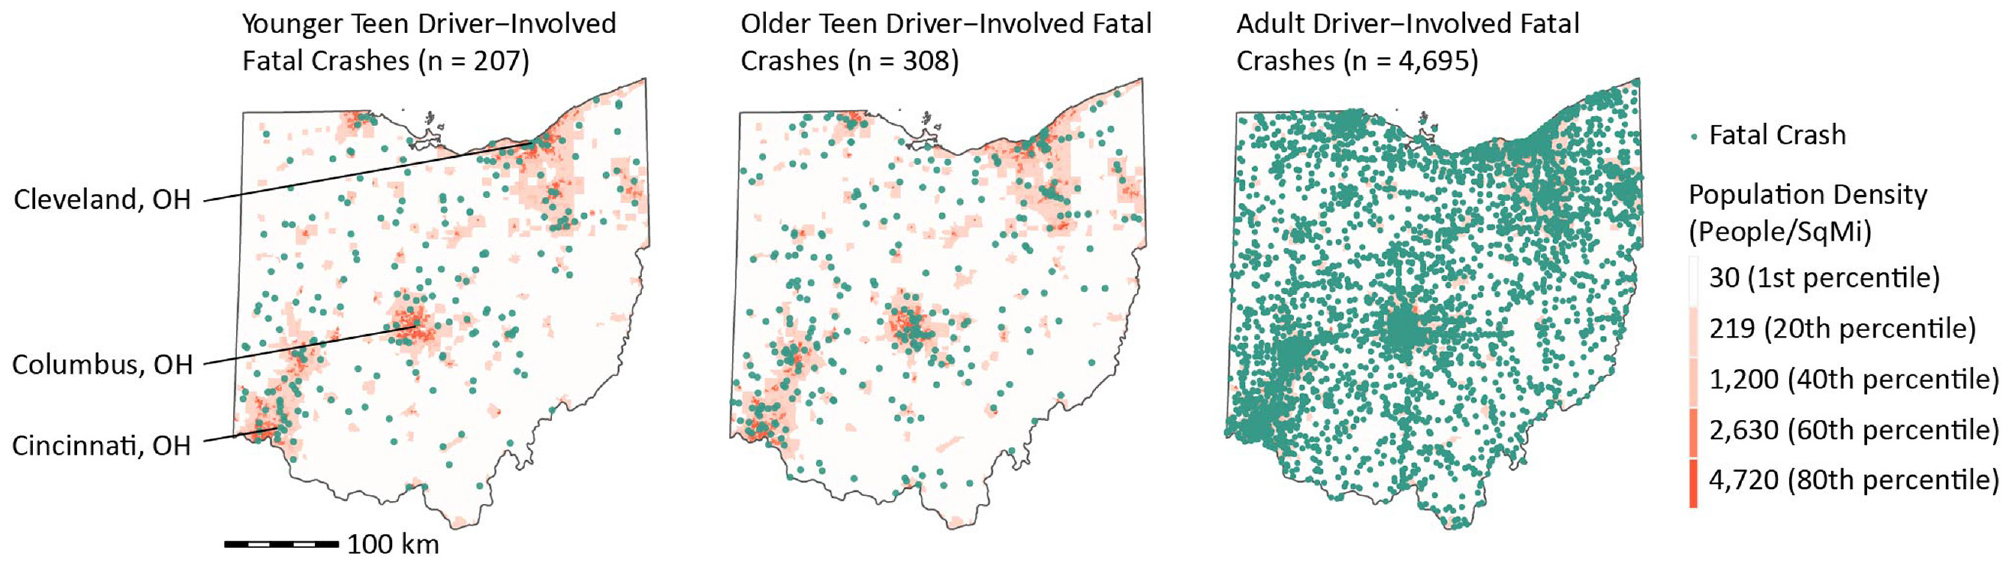
Spatial distribution of fatal crashes and teen-driver-involved fatal crashes overlayed on population density by census tract in Ohio, 2015 to 2019.
Research Framework and Method
This study investigated the likelihood of fatal crashes involving teen drivers versus adult drivers as they are related to a series of neighborhood socioeconomic, built environment, and roadway characteristics in Ohio. We focused only on locations where fatal crashes took place, as opposed to all street segments and/or intersections in the areas of interest, as in several previous studies on traffic crashes ( 57 – 59 ). This approach enabled us to examine whether fatal crashes are more likely to involve teens than older drivers in certain areas. This section introduces the conceptual framework, data, and modeling approach of the study.
Data Sources and Variables
This paper uses publicly available databases, including NHTSA’s Fatality Analysis Reporting System (FARS) data, American Community Survey (ACS) 5-year estimates data, and the U.S. Environmental Protection Agency (EPA) Smart Location Database.
Information about the contexts of fatal crashes (e.g., GPS XY coordinates, weather, lighting condition, roadway function class, land use, manner of collision) and individual characteristics of the involved persons (e.g., age, drug use, alcohol use) came from FARS, a nationwide census of yearly data for fatal injuries resulting from motor vehicle traffic crashes. The individual crashes can be linked with involved persons using the case identifier and crash year provided in the FARS data. Using the age and person type (one of the following categories: driver of a motor vehicle in-transport, passenger of a motor vehicle in-transport, occupant of a motor vehicle not in-transport, unknown occupant type) information provided by FARS, we categorized fatal crashes into three categories: crashes that involved at least one under-18-year-old driver on the day of the crash (younger-teen-driver-involved), crashes that involved at least one 18- to-19-year-old driver and no under-18-year-old drivers (older-teen-driver-involved), and crashes that involved only above-19-year-old drivers (only adult-driver-involved). The three-class categorization separates the young driver holding a temporary permit and probationary driver’s license (under 18 years old) from those who have newly obtained a full license without restrictions under GDL laws (at 18 to 19 years old). This categorization controls for the young drivers’ different driving restrictions and behaviors resulting from Ohio’s GDL laws while recognizing newly licensed young drivers’ vulnerability compared with older, more experienced adult drivers.
We processed other crash-related variables in the FARS data that might be associated with the involvement of teen drivers in fatal crashes. Road function classes correspond to the configuration of roadways and serve as an estimate for road width and traffic volume. Relationship to intersection is a binary variable with “yes” indicating the crash occurred at an intersection of roadways and “no” indicating the crash occurred on roadways. We also included speed limit and traffic control device to provide further information on the crashes. In the FARS data, speed limit is reported as the speed limit of the roadway on which each involved vehicle was traveling at the time of the crash. In cases in which the vehicles involved traveled on roadways with different speed limits (5% of the cases), we used the higher speed limit. The FARS data report the traffic control device of the roadway on which each vehicle was traveling at the time the crash occurred. To reduce the number of categories, we reclassified the 19 categories of traffic control device at the crash site into three larger groups: traffic signal, regulatory and other sign, and no traffic control. Traffic signals offer the highest level of traffic control. In cases in which the vehicles involved were traveling on roadways with different traffic control devices, we used the higher level of traffic control device. Finally, we removed unreported and unknown values in traffic control device, road function class, and relationship to intersection from the analysis.
Since the FARS crash data include only limited information about the built environment, we used Smart Location data to evaluate the built environment contexts of the crash locations. EPA’s Smart Location Database is a comprehensive geographic data source that assesses location efficiency on a national scale ( 60 ). With over 90 attributes, it summarizes various features, including housing density, land use density, neighborhood design, accessibility to destinations, availability of transit services, employment opportunities, and demographic information. These attributes are accessible for almost every census block group (CBG) across the United States ( 60 ). For this study, we used five built environment variables measuring density, land use, and urban design: population density (people/acre), job density (jobs/acre), land use diversity, road network density (road facility miles per square mile), and intersection density (intersections per square mile). Land use diversity is an entropy value of employment and households, ranging from 0 to 1. It assesses the evenness of the distribution across households and the types of employment in each CBG, including office jobs, retail jobs, industrial jobs, service jobs, entertainment, accommodation, and food services jobs (Smart Location Database Technical Documentation and User Guide Version 3.0). As the land use diversity approaches 1, the CBG has more diverse land use with a roughly equal share of households and each employment category. As the land use diversity approaches 0, the CBG has one type of activity (employment category or household) that accounts for most activities, indicating less diverse land use. To highlight the degree of change in land use diversity, we multiplied it by 100 to create a new variable on the scale of 0 to 100. In the rest of this paper, one-unit change of the rescaled land use diversity variable equals one hundredth change of the actual land use diversity.
Socioeconomic statuses (SES) of the crash locations came from the U.S. census. We calculated the poverty and vacancy rates using the total population, population below the federal poverty level, total housing units, and total vacant housing units provided by the ACS 2015 to 2019 estimates. Instead of using the SES characteristics of the drivers’ residency neighborhoods, this study focused on the crash locations’ built and socioeconomic environments to identify driving-related structural issues. We retrieved the ACS data at the CBG level using the tidycensus package in R ( 61 ).
We transformed population density, job density, and road density to the logarithmic scale to mitigate skewness. To account for the potentially nonlinear relationship between fatal crashes, poverty rates, and vacancy rates, we categorized the poverty rate and vacancy rate of the crash locations’ CBGs into quartiles. Table 1 presents the summary statistics for the variables included in the analysis. Categories that do not add up to 100% are the result of unreported/unknown data.
Summary Statistics of Explanatory Variables Selected for Multinomial Logistics Regression Models
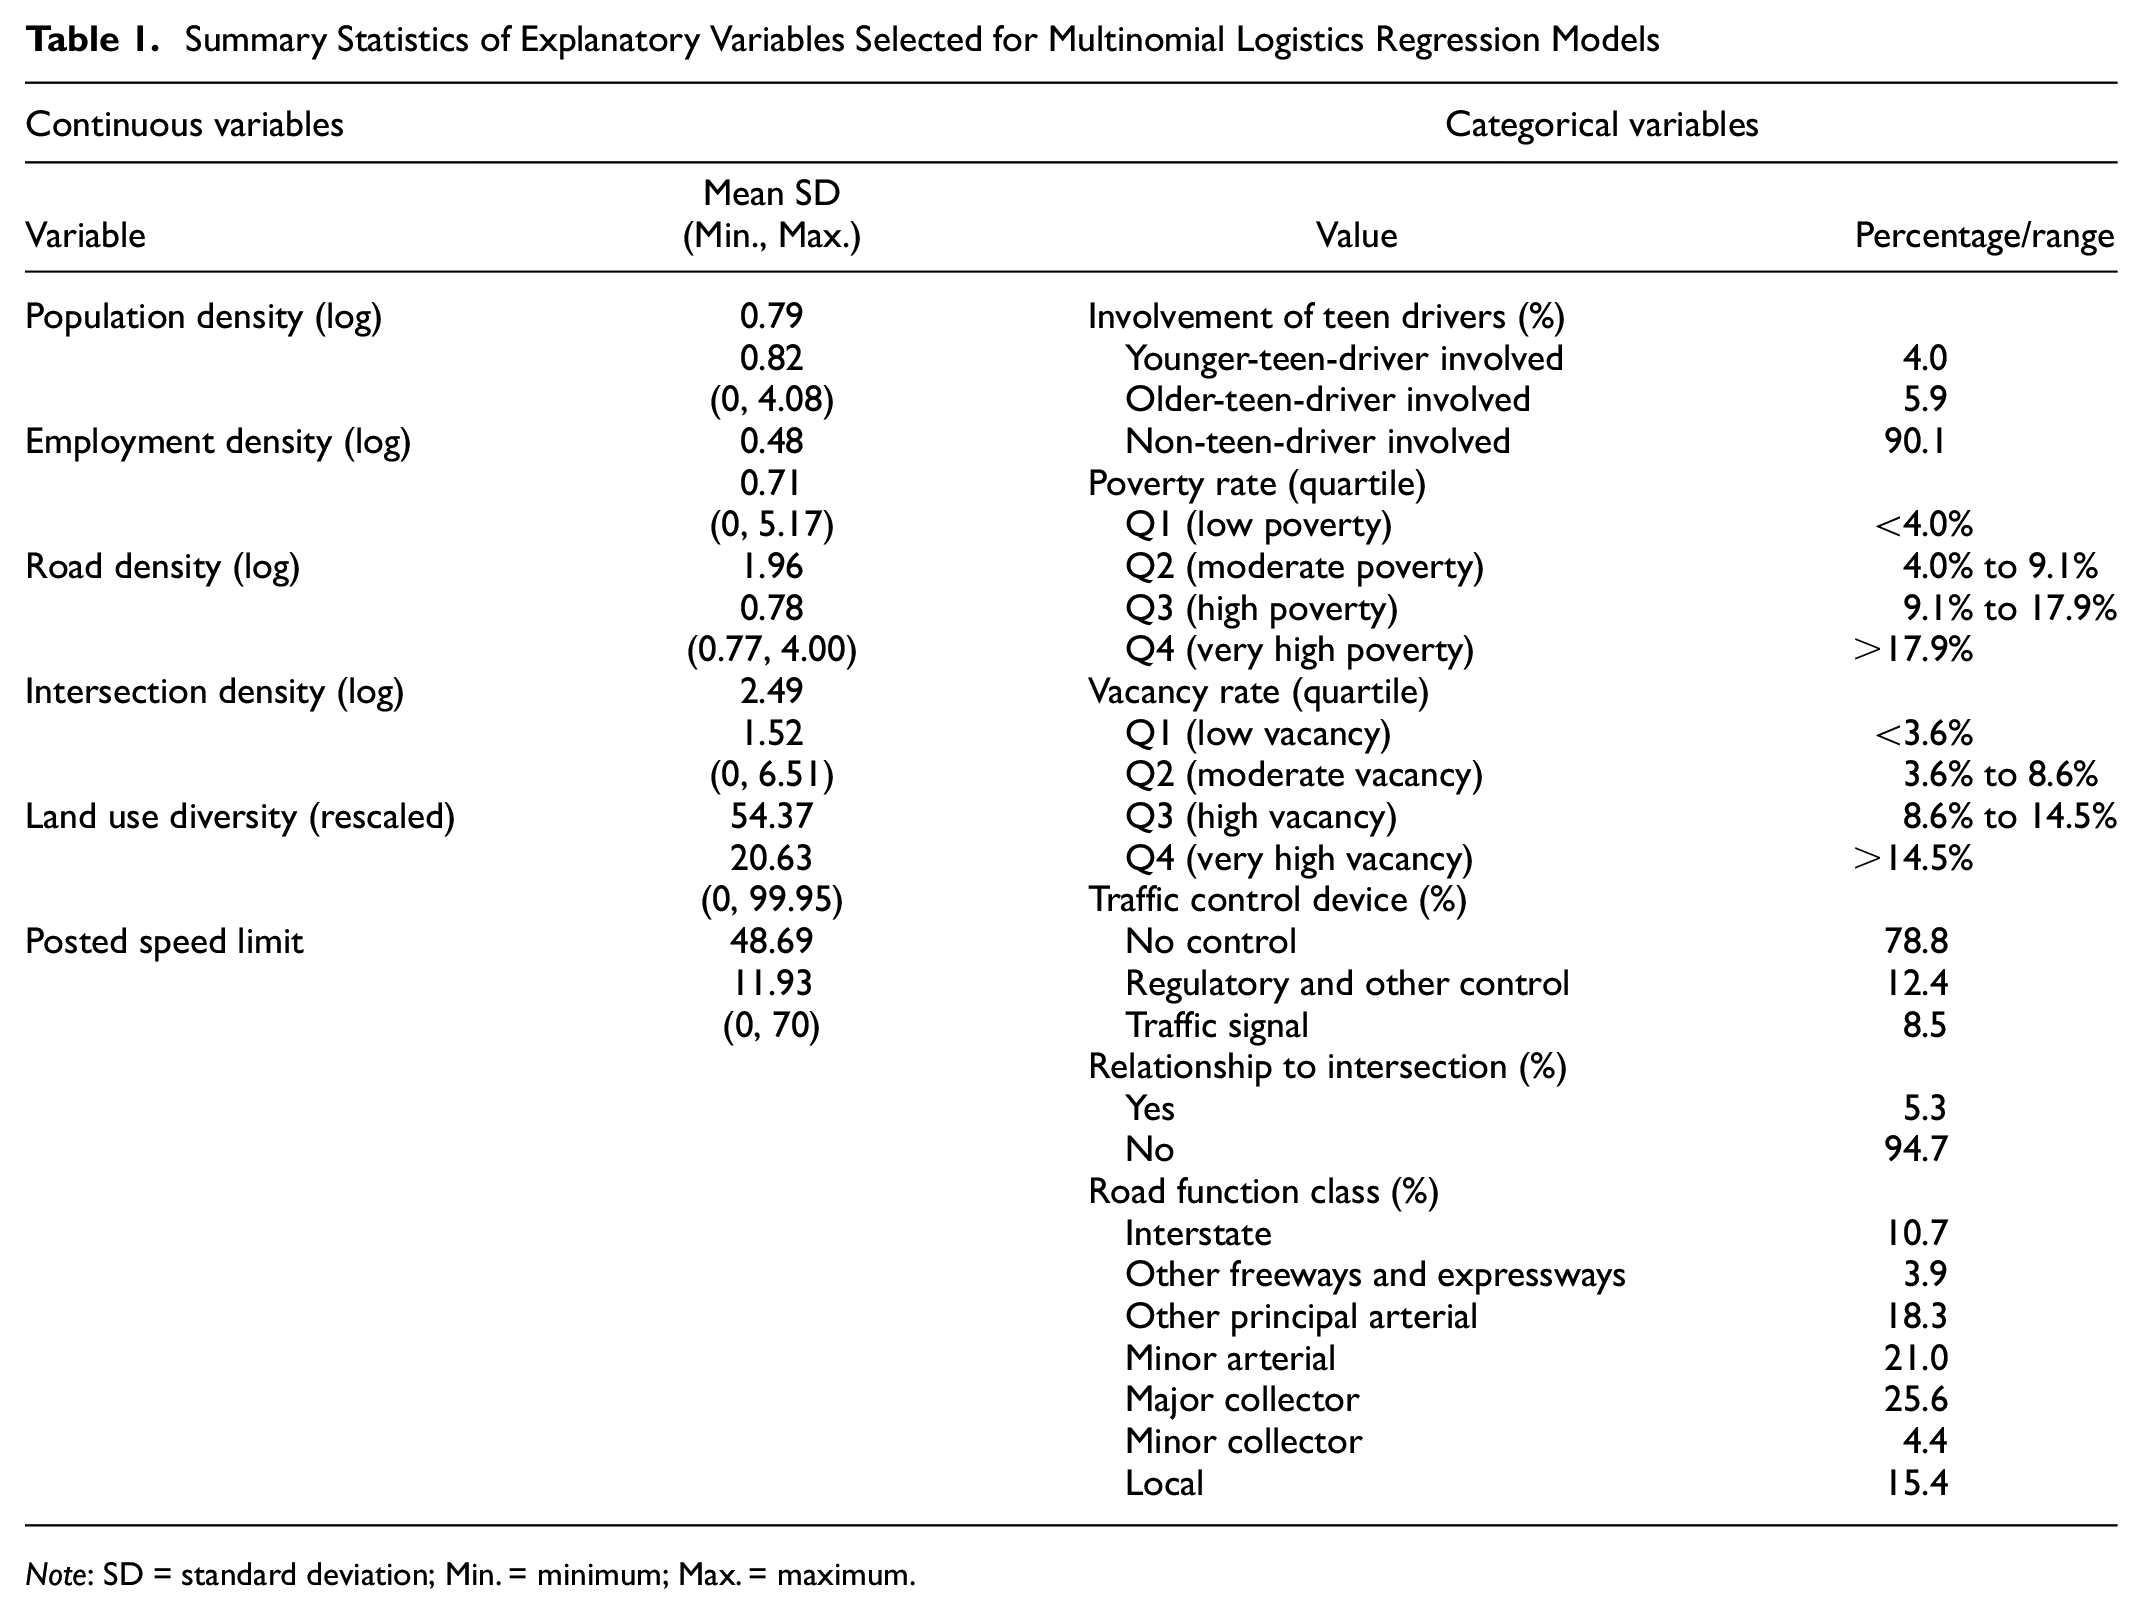
Note: SD = standard deviation; Min. = minimum; Max. = maximum.
Model Framework and Specification
We sought to correlate the incidence of fatal crashes of younger teens, older teens, and adults with variables describing the socioeconomic, built environment, and roadway characteristics at crash locations, to understand how different age groups are associated with built-environment-related crash risks differently. To do so, we used a multinomial logistic regression model to relate our dependent variable, fatal crash outcomes in three discrete mutually exclusive age groups (<18 years old for younger teen drivers, 18 to 19 years old for older teen drivers, and >19 years old for adult drivers), and our independent variables. We did not choose ordered logistic regression because the three categories in the dependent variable might not necessarily indicate gradual changes in degrees, and their relationships with the independent variables might not be purely a matter of the level of magnitude. The model included independent variables that measure the socioeconomic, density, and urban design factors of the crash locations’ CBGs, including population density (log), job density (log), land use diversity (rescaled), road density (log), poverty rate (quartile), and vacancy rate (quartile). The model also controlled for the complexity of traffic and lighting conditions of the crashes by including roadway function class, lighting condition, posted speed limit, relationship to intersection, and traffic control device. The final parameters of logistic regression models were estimated with the nnet package in RStudio ( 62 ), which uses a feedforward neural network to fit the multinomial logistic regression model. Figure 2 shows the data and method workflow of this paper.
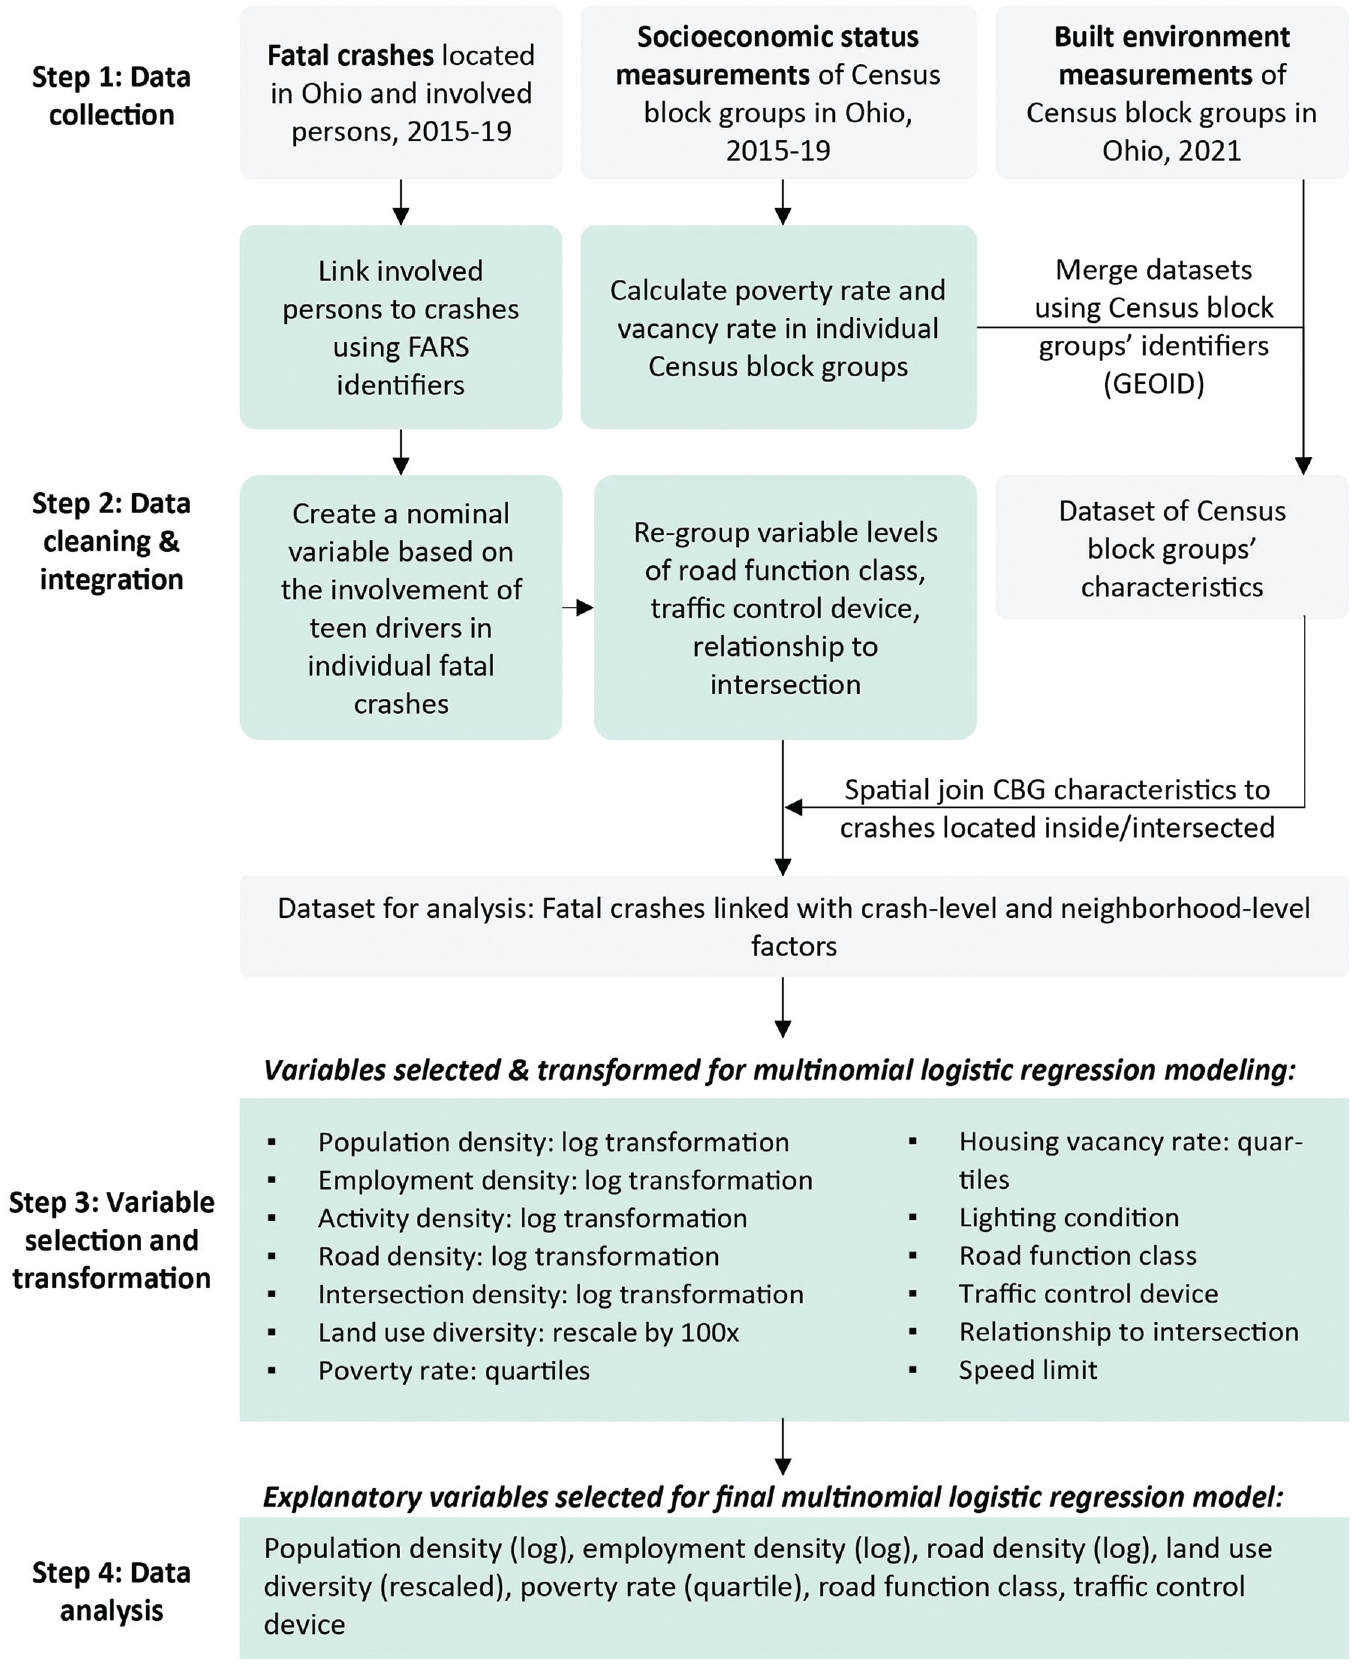
Workflow of the analysis.
Results
In the multinomial logistic regression model, we estimated the probability of a fatal crash involving different age-group drivers using the selected socioeconomic, built environment, and roadway characteristics. We specified fatal crashes involving adult drivers (>19 years old) to be the reference category.
Table 2 displays the final logit regression modeling estimates. We first estimated a model with all explanatory variables presented in Table 1. We found that activity density, intersection density, housing vacancy rate, speed limit, light condition, and relation to intersection had weak to no explanatory power, and thus, in the interest of focusing on meaningful correlations, we removed these variables from the reported model. The experimental results are available on request.
Multinomial Logistic Regression Modeling Estimates. The Outcome Variable is the Level of Younger Teen-Driver (Top) and Older Teen-Driver (Bottom) Involvement in a Fatal Crash
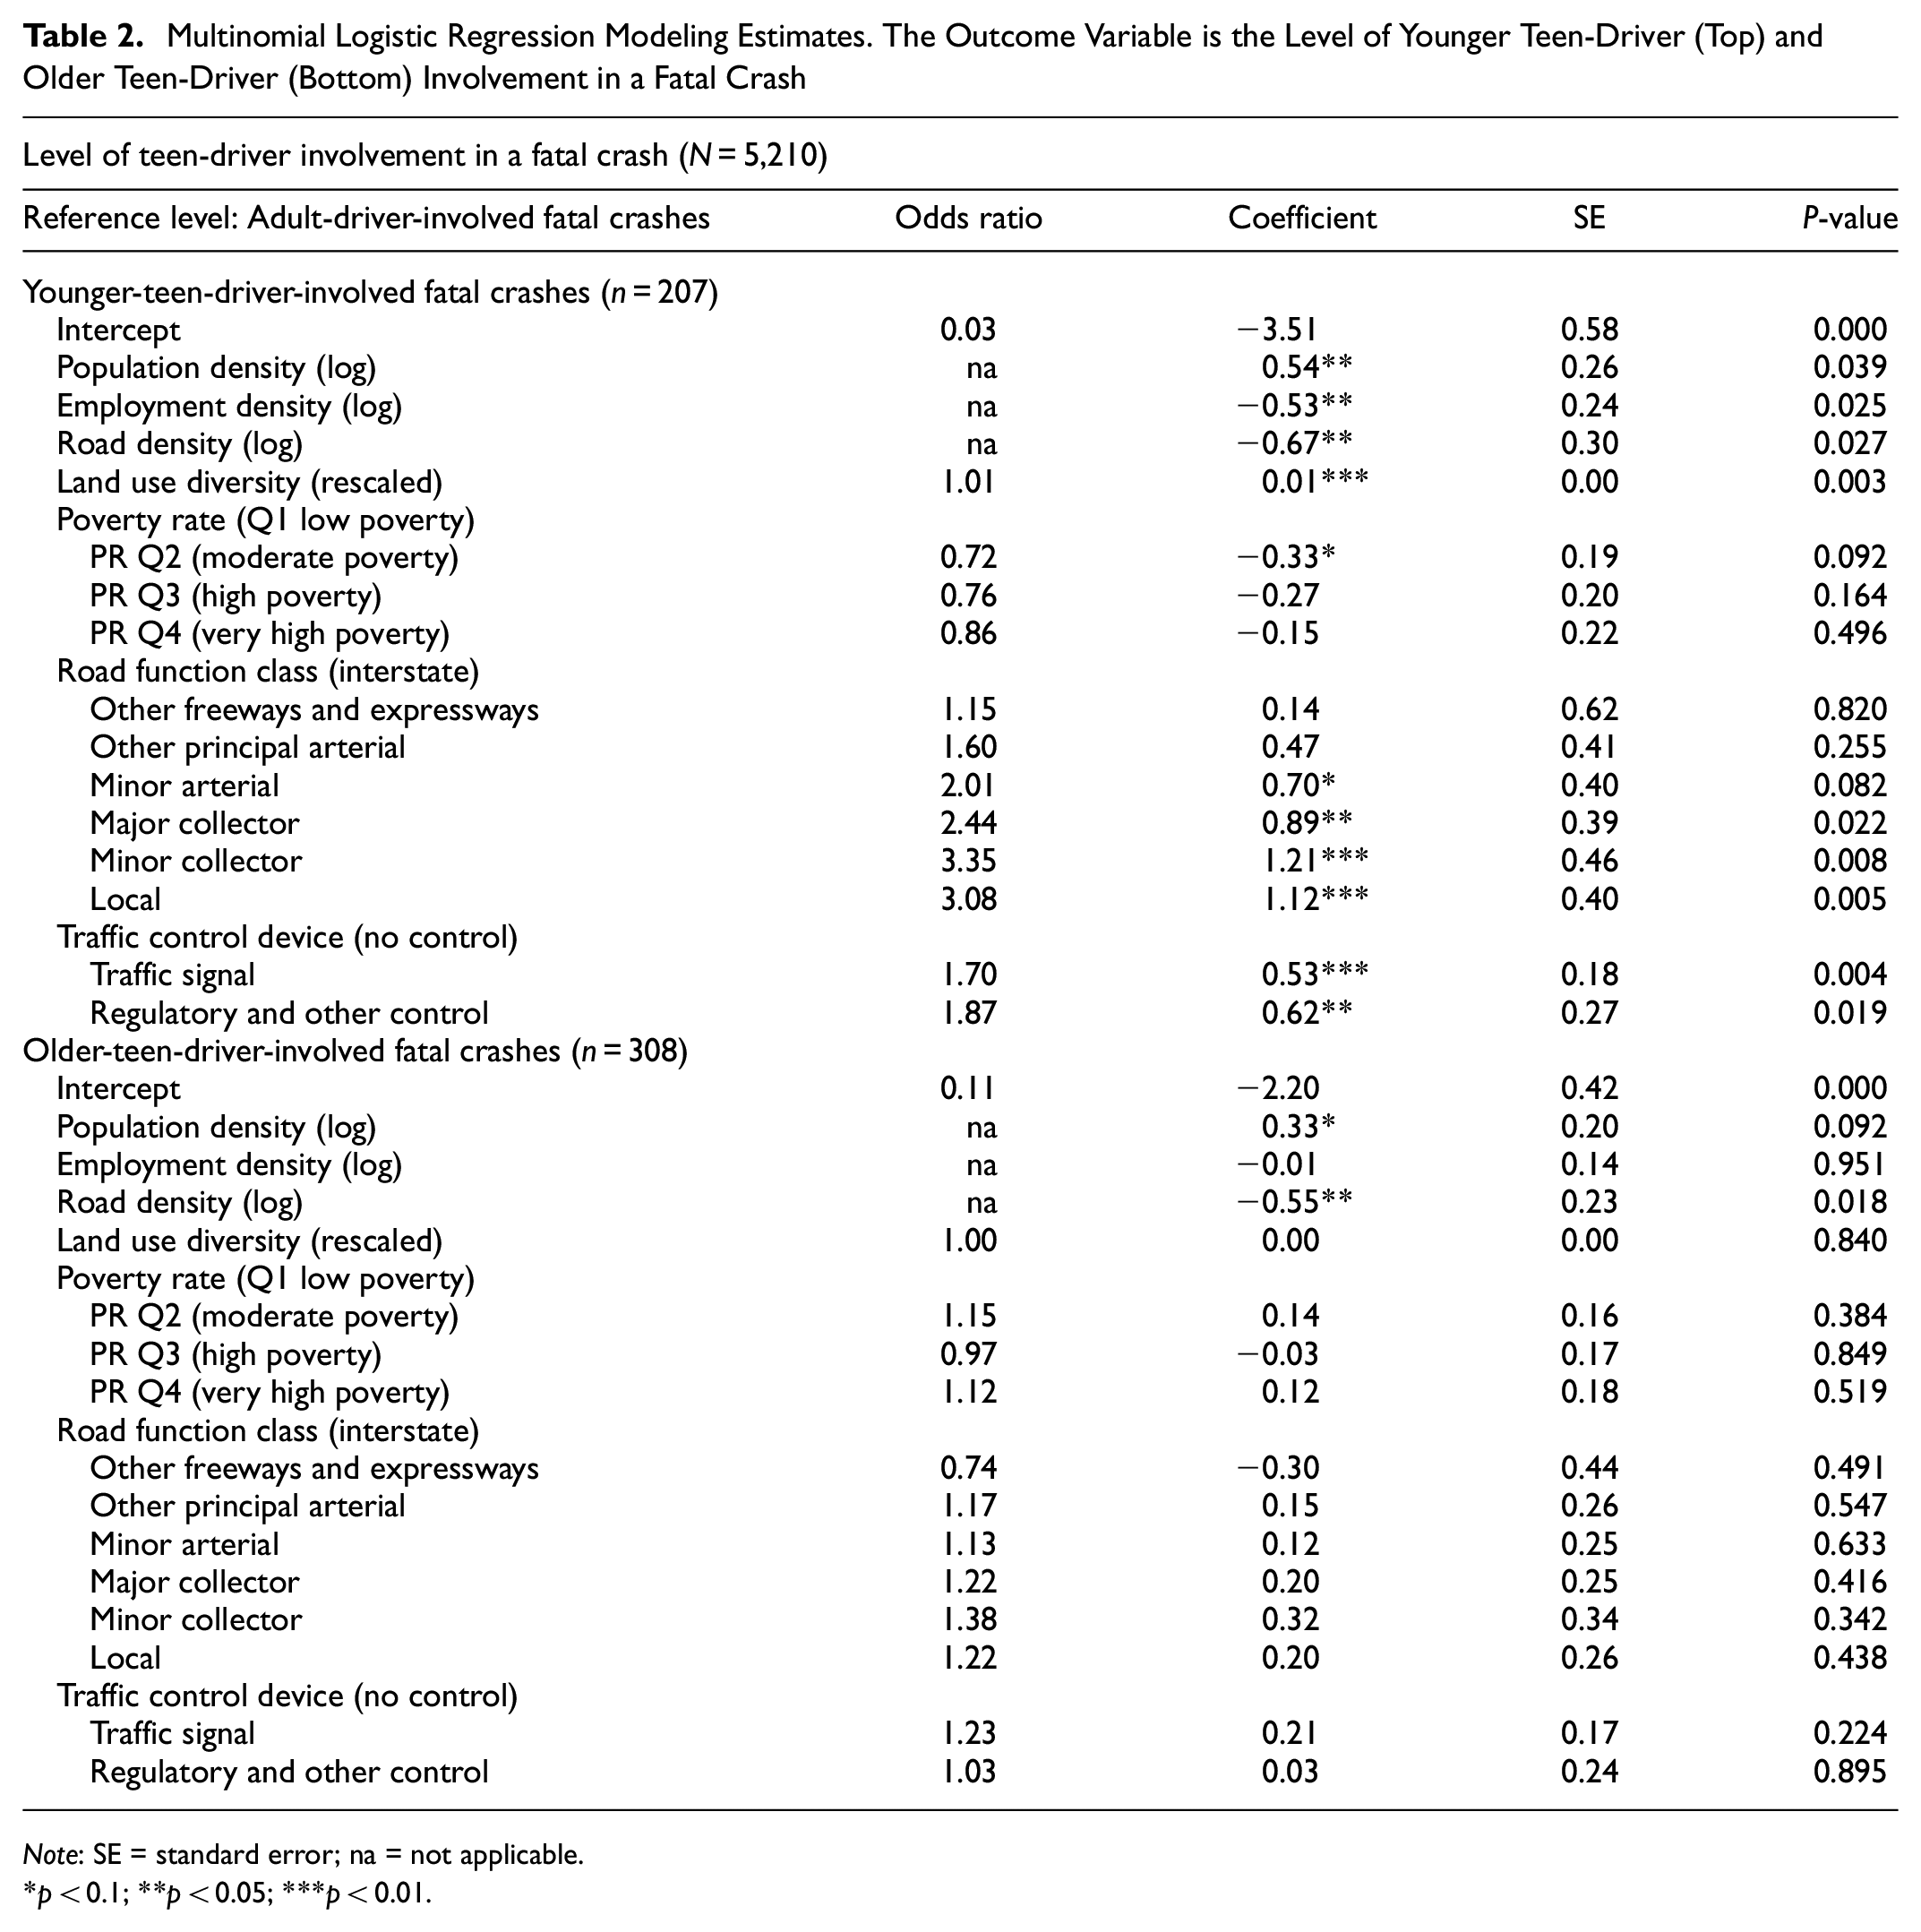
Note: SE = standard error; na = not applicable.
p < 0.1; **p < 0.05; ***p < 0.01.
For variables on the original scales, the exponentiated coefficients are interpreted as odds ratios. For example, on average, a one-unit increase in land use diversity corresponds to a 1% higher odds of a fatal crash involving a younger teen driver than an adult driver, all things being equal (the exponent of the coefficient 0.01 − 1). Log transformed variables can be interpreted as elasticity: for example, a 1% increase in population density corresponds to 0.54% higher odds of a fatal crash involving a younger teen driver than involving an adult driver.
Population density and employment density had more significant associations with the likelihood of a fatal crash involving younger teen drivers relative to adult drivers compared with older teen drivers. Compared with fatal crashes that involved an adult driver, a 1% increase in population density was associated with 0.54% higher odds of a fatal crash involving a younger teen driver on average and 0.33% higher odds of a fatal crash involving an older teen driver. Employment density showed a negative relationship with the probability of a fatal crash involving a younger teen driver compared with fatal crashes that involved an adult driver. On average, a 1% increase in employment density corresponded to 0.53% lower odds of a fatal crash involving a younger teen driver than a fatal crash involving an adult driver, all things being equal. The model found no significant associations between employment density and fatal crashes involving an older teen driver compared with fatal crashes involving an adult driver.
Denser road networks were associated with lower odds of a fatal crash involving a younger teen driver or an older teen driver than involving an adult driver. Relative to a fatal crash that involved an adult driver, a 1% increase in road density corresponded to 0.67% lower odds of a fatal crash involving a younger teen driver and 0.55% lower odds of a fatal crash involving an older teen driver, all things being equal. The model also found more diverse mixes of jobs and households (land use diversity) to correspond to higher probabilities of a fatal crash involving a younger teen driver than an adult driver. The model found no significant associations between land use diversity and fatal crashes involving an older teen driver relative to fatal crashes involving an adult driver.
In general, relative to fatal crashes that involved an adult driver, those involving younger teen drivers were more likely to occur on smaller roads with fewer lanes, slower speeds, and lower traffic volumes, as indicated by the ascending odds ratio for the road function class variable in Table 2. Compared with the interstates, local roads and minor collectors had three times the odds of a fatal crash involving a younger teen driver relative to an adult driver, all things being equal. The odds of a fatal crash involving a younger teen driver (as opposed to an adult driver) on major collectors and minor arterials were found to be more than double those on interstates, holding all other factors constant. By contrast, roadway function classes showed no statistical significance for older teen drivers. In other words, the likelihood of fatal crashes involving older teen- and adult drivers was not statistically different across road classes.
With regard to traffic control devices, fatal crashes at places with traffic signals or regulatory or other signs were more likely to involve younger teen drivers relative to adult drivers. Compared with crashes at locations with no traffic control device, those at locations with traffic signals had 70% higher odds of involving younger teen drivers than adult drivers. Similarly, fatal crashes at locations with regulatory or other signs had 87% higher odds of involving a younger teen driver than an adult driver compared with fatal crashes at places with no traffic controls. The impacts of traffic control devices were not significant for fatal crashes involving older teen drivers compared with those involving adults.
The model found limited associations between the age group of the drivers involved in fatal crashes and the poverty rate of the neighborhood (CBG) where the crashes occurred. Compared with fatal crashes that occurred in a low-poverty neighborhood, those that occurred in neighborhoods with moderate poverty rates had 28% lower odds of involving a younger teen driver than an adult driver. High and very high-poverty neighborhoods were also found to be associated with lower odds of fatal crashes involving younger teen drivers than adult drivers compared with low-poverty neighborhoods, but the associations were not statistically significant. The model found no significant associations across neighborhood poverty rates between fatal crashes that involved older teen drivers and those that involved adult drivers.
Discussion
Understanding teen drivers’ interactions with the environment is critical for transportation planners and policy makers to target certain infrastructure for development when designing improvement strategies for teen driver safety. Using multinomial logistic regression, this study investigated the socioeconomic, built environment, and roadway factors that are associated with the likelihood of fatal crashes involving younger teen drivers relative to adult drivers, and how these associations differ between younger and older teen drivers. We have structured the study’s implications for policy and future research around three main findings from the statistical analysis.
First, compared with adult-driver-involved fatal crashes, teen-driver-involved fatal crashes were more likely to occur in places with higher population density, lower employment density, lower road density, and more diverse land use. In general, places with higher population density and more diverse land use tend to be urban areas, whereas places with lower employment density and lower road density are usually found in less urban, more suburban, or even rural areas. These nuanced findings challenge the idea that a simple rural–urban classification used in existing research (e.g., based on population density or roadway designation) can fully explain the relative risk of fatal crashes for teen drivers ( 38 , 63 ). The different associations between density, land use, and fatal crashes involving different age groups remind planners and policy makers that younger teen drivers, and to a certain extent, older teen drivers, might interact with their surroundings differently from older and more experienced drivers across typologies. When data become available, researchers should consider conducting longitudinal analyses to investigate the causes of the different interactions with the surroundings across age groups, and how these interactions change as teen drivers age.
Second, fatal crashes that involved younger teen drivers were more likely to occur on more local roads with fewer lanes, slower speeds, and lower traffic volumes compared with fatal crashes that involved adult drivers. As roads became wider, faster, and more heavily trafficked, as indicated by road function class, the difference in the probabilities of fatal crashes involving younger teen drivers and those involving adults became smaller. For example, findings showed that fatal crashes that occurred on collectors and local roads were much more likely to involve younger teen drivers than adult drivers compared with highways and interstates. The finding that fatal crashes on minor roads were more likely to involve younger teen drivers relative to adult drivers indicated that younger teen drivers might experience increased crash risks on such roads. Intervention strategies such as traffic calming have proved to reduce crashes and lower traffic-related injuries and fatalities ( 64 , 65 ). Our findings suggest that implementing such strategies on minor roads could be particularly beneficial for improving the safety of younger teen drivers. Additionally, discrepancies in the safety outcomes indicate that younger teen drivers might navigate different types of roads differently from older teens and adults. It is possible that the younger teens’ higher crash risk on smaller roads could be attributed to their relatively higher exposure and greater presence on minor roads compared with other road typologies. Nonetheless, the potential higher exposure of younger teens further highlights the importance of implementing strategies to improve safety for younger teen drivers on minor roads. In the future, policy makers and researchers might find merits in conducting observational studies and behavioral analyses of how younger teen drivers navigate minor, local roads to identify areas for improvement in driver education courses and formal driver training to help younger teen drivers safely navigate roads on which younger teen drivers travel most often.
Third, compared with neighborhood socioeconomics, built environment factors are more significant predictors of the likelihood of fatal crashes involving younger teen-, older teen-, and adult drivers. In contrast to the significant associations between fatal crashes and density, land use, and road class, our analysis found no significant relationships between neighborhood poverty rate, vacancy rate, and the age group of drivers involved in fatal crashes. Moreover, we found that the lack of significant associations between poverty rate, vacancy rate, and the age group of drivers in fatal crashes persisted in models that did not control for built environment factors. Previous studies found that lower income areas have more crash fatalities ( 66 , 67 ). Our findings suggest that, at least in the study area, the likelihood of fatal crashes involving younger teen drivers, older teen drivers, and adult drivers was similar across neighborhoods with different socioeconomics. By contrast, factors that were more directly related to driving, such as roadway configuration, predicted the age group of drivers involved in fatal crashes better.
Finally, our analysis on fatal crashes across age groups has provided more nuances relating to the findings in vehicle crash fatality research. Population density, for example, has been found to correspond to fewer overall fatal crashes ( 57 ). Our study showed that the associations between population density and fatal crashes might not be uniform across age groups. By capturing additional information that is generally not available in aggregate analyses, crash analyses that investigate the associations between built environment factors of crash locations and crash outcomes involving drivers of different age groups may help planners and policy makers design and implement targeted physical countermeasures to improve teen driver safety.
Limitations
Three study limitations provide opportunities for future research on crash analysis of teen drivers. First, our analysis focused on the quantitative associations between the age group of drivers involved in fatal crashes and a series of factors. Additional qualitative research is needed to understand how teen drivers make travel decisions based on the built and socioeconomic environments, and why teen drivers’ interactions with the surrounding environments might be different from those of older drivers. Second, because of the low occurrence of fatal crashes, it is possible that the associations between crash outcomes and built environment and socioeconomic factors were subject to unsystematic variance. As more data become available, future research should continue to investigate the factors associated with crash outcomes across age groups and compare the results with findings from the present analysis. Third, limited by the lack of drivers’ spatial travel data, this analysis did not account for the differences in exposure across driver age groups. Given the large size of the study area and the relatively small share of drivers aged 16 to 18 years in the location, it is unlikely that teen drivers had a disproportionate presence in certain areas so as to bias the model estimates significantly. Associations between crash outcomes and built environment factors that might have been subject to the effect of higher teen drivers exposure could serve as a reminder of the need for physical improvements to certain types of roadways that have greater teen driver presence to enhance safety for teen drivers. Lastly, our study focused on the risk of younger drivers’ involvement in fatal crashes compared with older drivers using individual fatal crashes as the unit of analysis. Thus, our analysis did not capture locations with zero fatal crashes. Future research could consider using aggregate crash counts by street segment or other geographic units to correlate socioeconomic, built environment, and roadway factors directly with the number of crashes for each age group. Such analyses would provide additional insights into how the impacts of the various contributing factors to fatal crashes differ across driver age groups. The findings from these analyses would validate the significance of our identified risk factors and enable effective interventions to be designed to improve road safety for younger drivers.
Conclusions
Through an investigation of fatal crashes across age groups, this study found that teen drivers performed differently in certain built and socioeconomic environments compared with adult drivers. The multinomial logistic regression model indicated that built environment and roadway-related factors, including population density, job density, road density, land use diversity, poverty rate, road function class, and traffic control device, helped to explain the likelihood of fatal crashes involving younger and older teen drivers relative to adult drivers. Specifically, we concluded from our findings that younger-teen-driver-involved fatal crashes are more likely to occur in places with 1) higher population density, lower employment density, lower road density, and more diverse land use, and 2) on smaller, slower roads, and at locations with traffic signals or regulatory or other signs. These findings will enable us to focus on interventions that directly address the challenges teens might face in navigating urban/suburban environments and urban roads (as compared to freeways). The finding that, compared with neighborhood socioeconomics, built environment factors were better predictors of the age group of drivers involved in fatal crashes further emphasizes the criticality of focusing on engineering and infrastructure design toward addressing teen driver safety. Planners could use this information to 1) inform driver education modules focused on navigating specific locations, and 2) develop infrastructure interventions specifically focused on traffic control device–controlled locations, urban roads, and areas with diverse land uses.
Footnotes
Acknowledgements
The authors would like to acknowledge Li (Kerry) Fang, for comments on the initial proposal and drafts. We also extend thanks to the Center for Injury Research and Prevention at the Children’s Hospital of Philadelphia for their valuable input during the course of this research.
Author Contributions
The authors confirm contribution to the paper as follows: study conception and design: J. S. Wu, X. Dong, J. Green, M.S. Ryerson; data collection: J. S. Wu; analysis and interpretation of results: J. S. Wu, X. Dong, M.S. Ryerson; draft manuscript preparation: J. S. Wu, X. Dong, J. Green, M.S. Ryerson. All authors reviewed the results and approved the final version of the manuscript.
Declaration of Conflicting Interests
The authors declared no potential conflicts of interest with respect to the research, authorship, and/or publication of this article.
Funding
The authors received no financial support for the research, authorship, and/or publication of this article.