
Abstract
Unsignalized pedestrian crossing accommodations can improve pedestrian safety, yet their quality of service for pedestrians remains understudied. The present study explored whether and how pedestrians’ satisfaction with crossing unsignalized crossings varied according to the type of crossing accommodation used, that is, the rectangular rapid-flashing beacon (RRFB) with median island, median island alone, marked crosswalk, and unmarked crosswalk. The research team collected intercept survey and video observation data from 358 pedestrians across a total of 40 sites in two different cities. Structural equation models illustrated how pedestrians’ crossing-oriented satisfaction was shaped by their positive perceptions of safety and low levels of delay in the act of crossing the street. Crossing satisfaction also varied by unsignalized crossing accommodation type. Pedestrians perceived RRFBs with medians and median islands by themselves as comparably safer, more time efficient, and thus more satisfying than marked crosswalks without RRFBs or raised medians or at unmarked crosswalks. These findings could inform efforts to provide higher quality of service to pedestrians.
Walking is perhaps the most basic mode of transport. It delivers several social, individual, and environmental benefits in the form of improved health and air quality ( 1 ). The healthiest, wealthiest, most sustainable communities in cities around the world are unique in many ways, but they all share one element in common: they all produce and maintain highly walkable places ( 2 ). Despite the myriad benefits of walking, planning efforts have historically focused attention and resources on advancing motorized transportation ( 3 ).
In this paper, our research team focuses on pedestrians’ experiences using different unsignalized crossing accommodations. The paper begins with a review of the academic and trade literature on how the operationalization of road user experience, including drivers and pedestrians, has evolved over time. It then provides a description of the team’s data collection processes, including the development of the intercept survey instrument, the procedure for selecting unsignalized crossing sites at which to collect survey and observational data, and the types of data gathered via observation. Presented next are the results from descriptive analyses depicting the population and crossing sites studied, an exploratory ordinary least squares regression model assessing associations between participants’ walking trip characteristics and their level of crossing satisfaction, and structural equation models (SEMs) illustrating mediated relationships between crossing accommodations and participants’ crossing satisfaction. Finally, study discussion, limitations, and practical conclusions are proffered.
Literature Review
One primary means of accommodating the growing population of motorists in the United States was to enhance motorists’ sense of comfort and convenience while driving in various contexts. Toward realizing this goal, in 1965, traffic engineers developed the Highway Capacity Manual (HCM), which introduced a “level of service” (LOS) concept as “a qualitative measure of the effect of a number of factors, which include speed and travel time, traffic interruptions, freedom to maneuver, safety, driving comfort and convenience, and operating costs” ( 4 ). In practice, the operationalization of motor vehicle LOS meant assigning one of six letter grades (A to F) to a road facility’s volume-to-capacity ratio, driver delay, and prevailing motor vehicle operating speeds ( 5 ). As such, facilities that supported higher vehicle operating speeds, abundant capacity for unhindered vehicle throughput, and lower vehicular volumes would score higher than facilities that were frequently congested and incurred travel delays for motorists.
Consideration of the experiences of road users traveling outside of motor vehicles was reflected in the publication of the third edition of the HCM in 1985 ( 6 ). This HCM introduced the concept of pedestrian level of service (PLOS), which provided analyses of walkways, crosswalks, and street corners. PLOS adapted motor vehicle LOS to pedestrian travel, indicating that “the characteristics of pedestrian flow parallel those for vehicular flow” ( 6 ).
Fifteen years later, the 2000 or fourth edition of the HCM expanded the scope of the PLOS methodology through its examination of various types of pedestrian facilities, including sidewalks, pedestrian queueing areas (e.g., signalized intersections), shared off-street paths, and crosswalks ( 7 ). In the 2000 HCM, quality of service along pedestrian walkways was a function of the interaction between the square meters of available space per pedestrian and pedestrians’“flow rate” or the number of pedestrians who passed through a given space per unit of time ( 7 ). This “pedestrian crowding” conceptualization of PLOS was applied to queueing areas, with adjustments made for pedestrian platooning. At signalized intersections, PLOS was conceptualized as a function of pedestrian wait time or delay and a qualitative assessment of the likelihood of pedestrian noncompliance with traffic signals. The HCM published in 2010, the manual’s fifth edition, introduced an integrated multimodal approach to the analysis and evaluation of urban streets from the points of view of automobile drivers, transit passengers, bicyclists, and pedestrians evaluating tradeoffs in allocating urban street right-of-way among the modes and how motor vehicles affect bicyclists’ and pedestrians’ delay ( 8 ). The sixth edition of the HCM, published in 2016, incorporated methods for analyzing off-street pedestrian and transit facilities, orienting practitioners to consider relationships among pedestrian volume, effective path width, and average pedestrian speed on typical off-street pedestrian facilities ( 9 ).
More recent studies have assessed PLOS at unmarked crossings, urban greenway intersections, sidewalks, and signalized intersections (1,10,11,). In a systematic review of PLOS models developed between 1971 and 2016, Raad and Burke discovered that 22 of the 58 studies conducted over the 45-year period were produced after 2013 ( 12 ). In general, they observed how earlier work applied methods used to determine automobile LOS to measuring PLOS, whereas more recent approaches have incorporated a wide range of factors with little consistency across studies ( 12 ).
Increasingly, qualitative measures have been employed alongside traditional volume and roadway measures to assess PLOS. In a recent review of academic literature on sidewalk PLOS from 1971 to 2019, Nag et al. advanced a three-factor framework for depicting PLOS and the pedestrian environment, combining measures of traffic flow characteristics, the built environment, and users’ perceptions ( 13 ). These authors concluded that although half of the studies they reviewed incorporated both qualitative and quantitative data in developing PLOS models, none used all three factors to evaluate PLOS. More circumscribed uses of PLOS have combined intercept surveys and video observation to evaluate PLOS at crosswalks. For example, results from an intercept survey conducted at signalized intersections in Shanghai, China revealed that several factors directly affected PLOS, such as travel purpose, single-stage crossing, nearside crossing, and conflicts with left-turning vehicles ( 14 ).
Despite the broad range of factors seemingly germane to PLOS, recent work is coalescing around the notion that pedestrian delay negatively affects PLOS ( 14 , 15 ). Such work has revealed that when mean wait times exceed 30 s, pedestrians become increasingly less likely to comply with signal indications ( 14 , 15 ).
Most prior work on PLOS has focused on sidewalks and signalized intersections ( 13 , 16 ). Examining unsignalized crossing experience is important because those factors used to evaluate the PLOS at unsignalized crossings, specifically pedestrian perceptions of safety, may manifest differently than those at signalized crossings. For example, at unprotected midblock crossings, pedestrians need to discern suitable gaps in traffic to safely cross the road ( 17 ). Thus, assessing pedestrian delay at signalized crossings may not adequately capture PLOS at unsignalized crossings ( 18 ). As an example, Kadali and Vedagiri evaluated PLOS at unsignalized crossings and discovered that PLOS diminished when pedestrians had to alter their travel speed to avoid collisions with motorists or were in the presence of higher speed traffic ( 17 ). In another study involving field surveys, Zhao et al. found that higher motor vehicle volumes and greater distances between marked and unmarked midblock crossings were significantly and negatively associated with PLOS ( 19 ).
Research Objective
The present study aims to augment collective understanding of PLOS at unsignalized crossing locations. Specifically, the research team aimed to explore whether and how rectangular rapid-flashing beacons (RRFBs for brevity) with median islands and marked crosswalks, and median islands with marked crosswalks (median island for brevity)—increasingly employed countermeasures that can significantly improve pedestrian safety when implemented appropriately and used as designed ( 20 – 22 )—affect pedestrian satisfaction with respect to crossing without signalized protection (i.e., marked crosswalk only, and unmarked crosswalk only). This effort was made possible through the National Cooperative Highway Research Program (NCHRP) 17–87 project with the intent of updating the PLOS methodologies in the HCM.
Data Collection
Intercept Survey Development
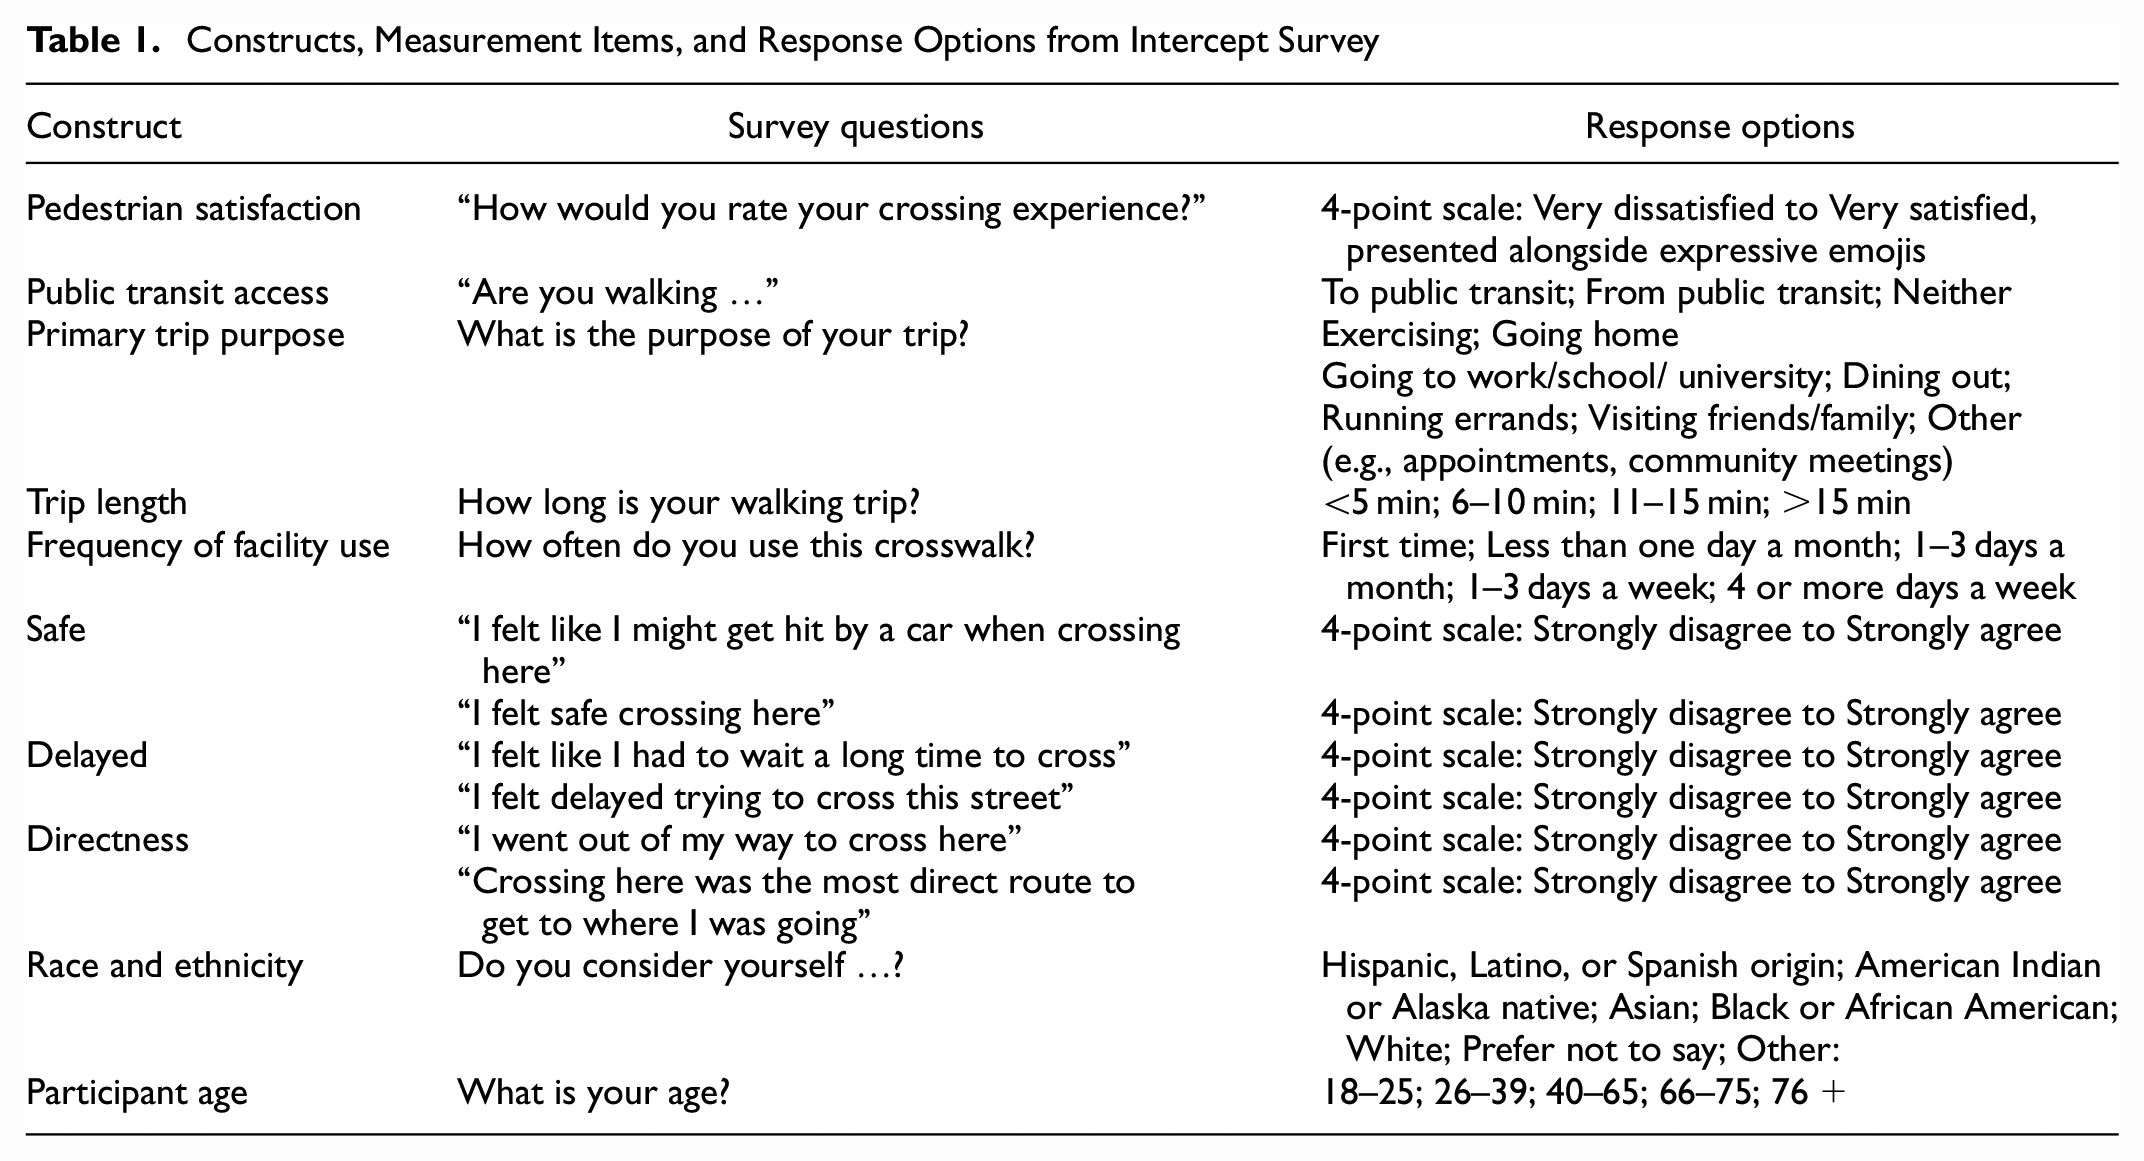
To assess how the unsignalized crossing accommodations of interest (i.e., RRFB, median island, marked crosswalk, and unmarked crosswalk) have an impact on pedestrians’ satisfaction with the crossing task, the research team designed a 13-item unsignalized crossing intercept survey. Informed by prior work on utilitarian walking behavior (23, 24) and preferences for different types of pedestrian crossings (23, 25), the instrument captured information on participants’ demographics, as well as the characteristics of the trip within which the crossing was embedded (Table 1). As seen in Table 1, participants’ satisfaction with the crossing task was operationalized using a single item that measured stated satisfaction. Pedestrians’ perceptions of the safety, delay, and route directness associated with crossing study sites were each indicated by two items and placed on a 4-point Likert scale of agreement. The team incorporated these perceptual measures because these constructs have been shown to be meaningfully associated with PLOS in previous studies (19, 26, 27). Scales consisted of four points, as the incorporation of neutral midpoints (e.g., via a 5-point Likert scale) can increase the chances of central tendency and social desirability biases, and decrease the interpretability of responses, such as when “neutral” or “neither” truly represents “no opinion” ( 28 , 29 ).
Constructs, Measurement Items, and Response Options from Intercept Survey
Site Selection
Study data were collected across 40 unsignalized crossing sites divided between Chapel Hill, NC (16 sites) and Portland, OR (24 sites). Twenty of the “case” sites divided in two groups of 10 each featured RRFBs with median islands, marked crosswalks without median islands, or median islands with marked crosswalks. Each RRFB with median island, marked crosswalk without median island, and median island with marked crosswalk site was matched with a “control” site that featured either marked or unmarked crosswalks, both without median islands. To the extent possible, the team matched sites according to geometric and operational factors including posted speed limits, one- or two-way traffic directionalities, number of through lanes, presence of center turn lanes, and traffic volume (i.e., annual average daily traffic [AADT]). This matching was carried out not to directly compare case and control sites, but rather to ensure sufficient variability in characteristics across our study sample of 40 crossings (Table 2).
Characteristics of Unsignalized Crossing Accommodations in the Study (N = 40)
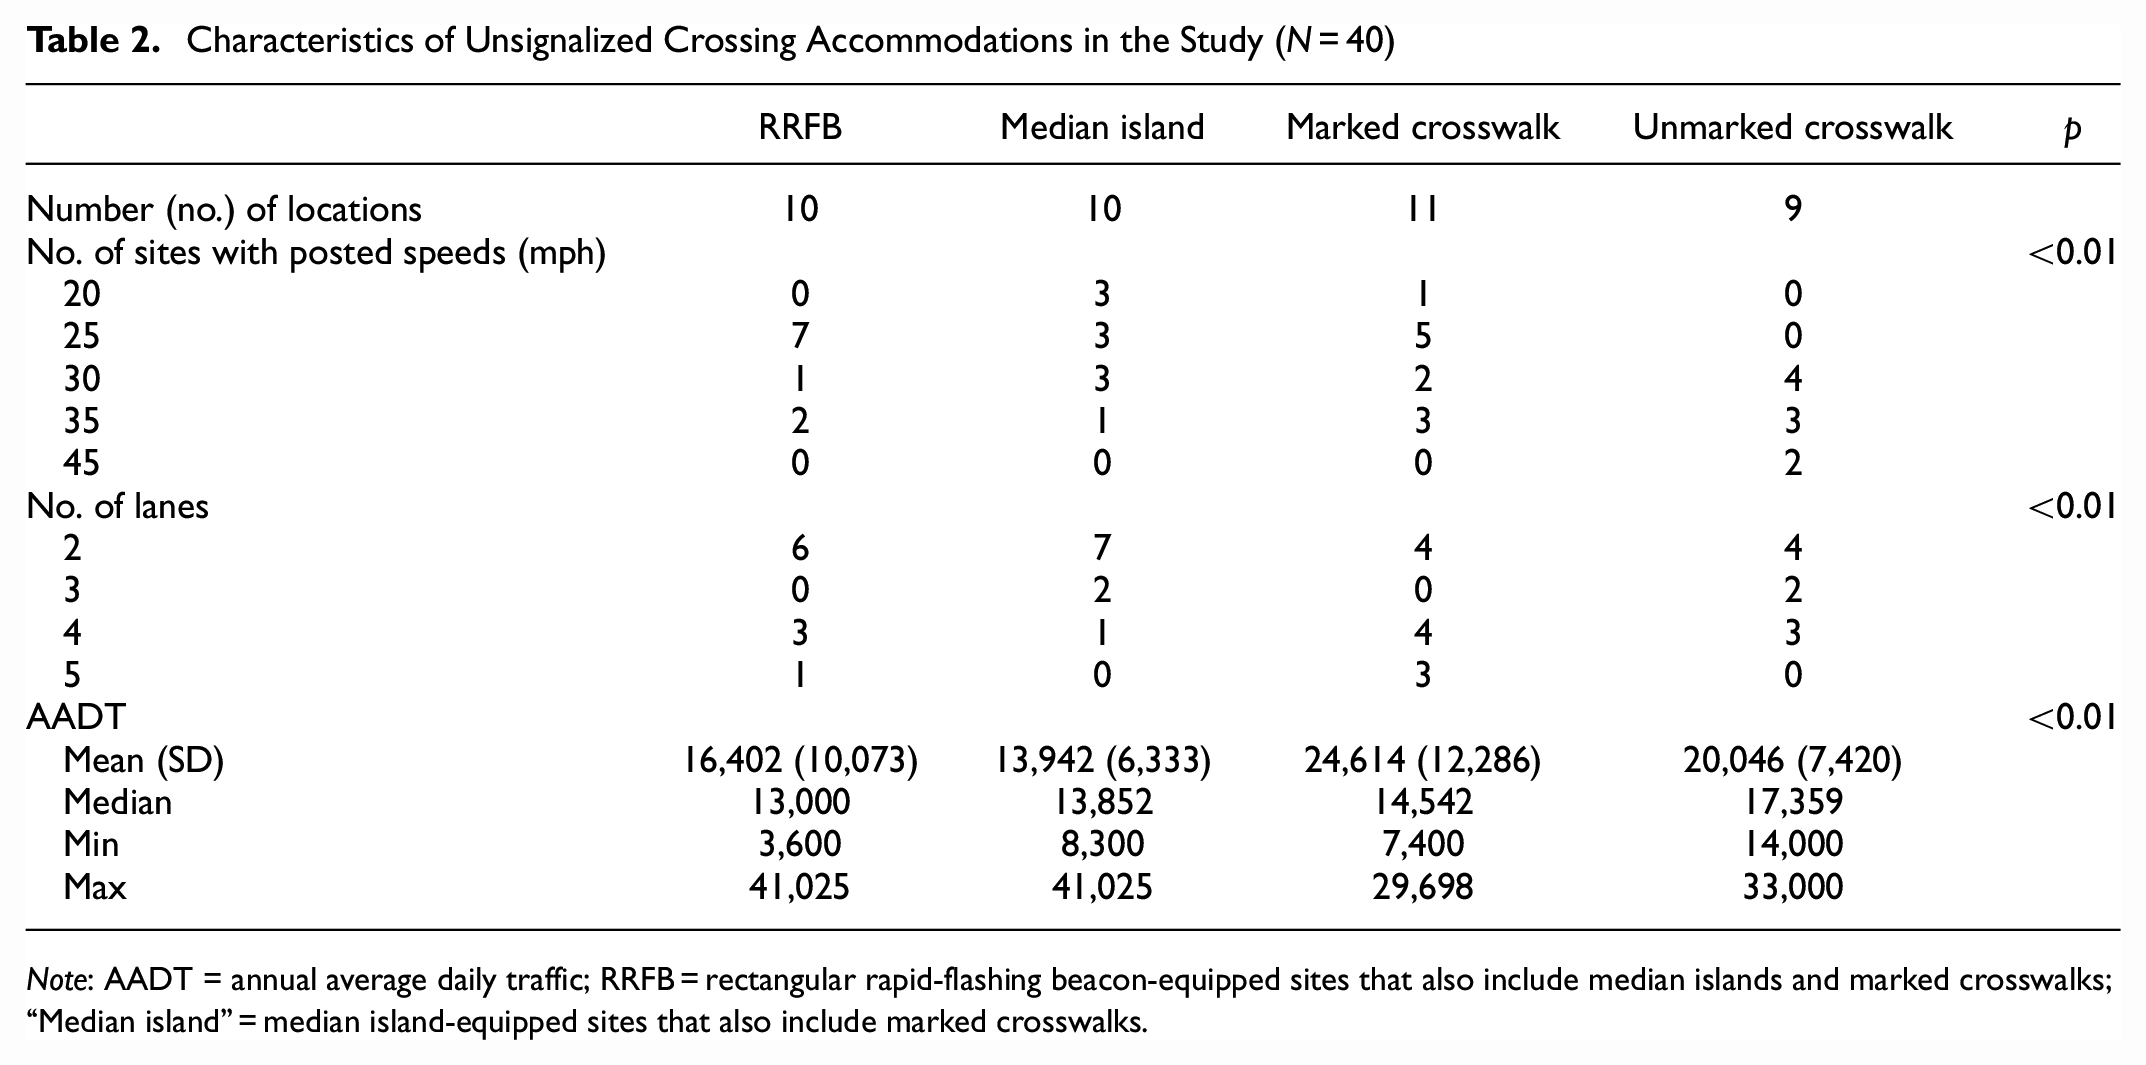
Note: AADT = annual average daily traffic; RRFB = rectangular rapid-flashing beacon-equipped sites that also include median islands and marked crosswalks; “Median island” = median island-equipped sites that also include marked crosswalks.
Additional site selection criteria included the presence of nearby bus stops, avoidance of locations near primary or secondary schools, as only those 18 years or older could be interviewed per Institutional Review Board requirements, and the exclusion of locations that predominantly served joggers or bicyclists, as the study focus was on utilitarian walking. Finally, the team prioritized sites where higher pedestrian volumes were expected, based on the research team’s knowledge of the site locations and consultations with city planning staff. In several cases, study sites were located on the same or adjacent corridors, which helped minimize potential confounding factors between case and control sites. Table 2 presents a summary of study site characteristics, and Figure 1 displays street-level images of the types of sites featured in this study.
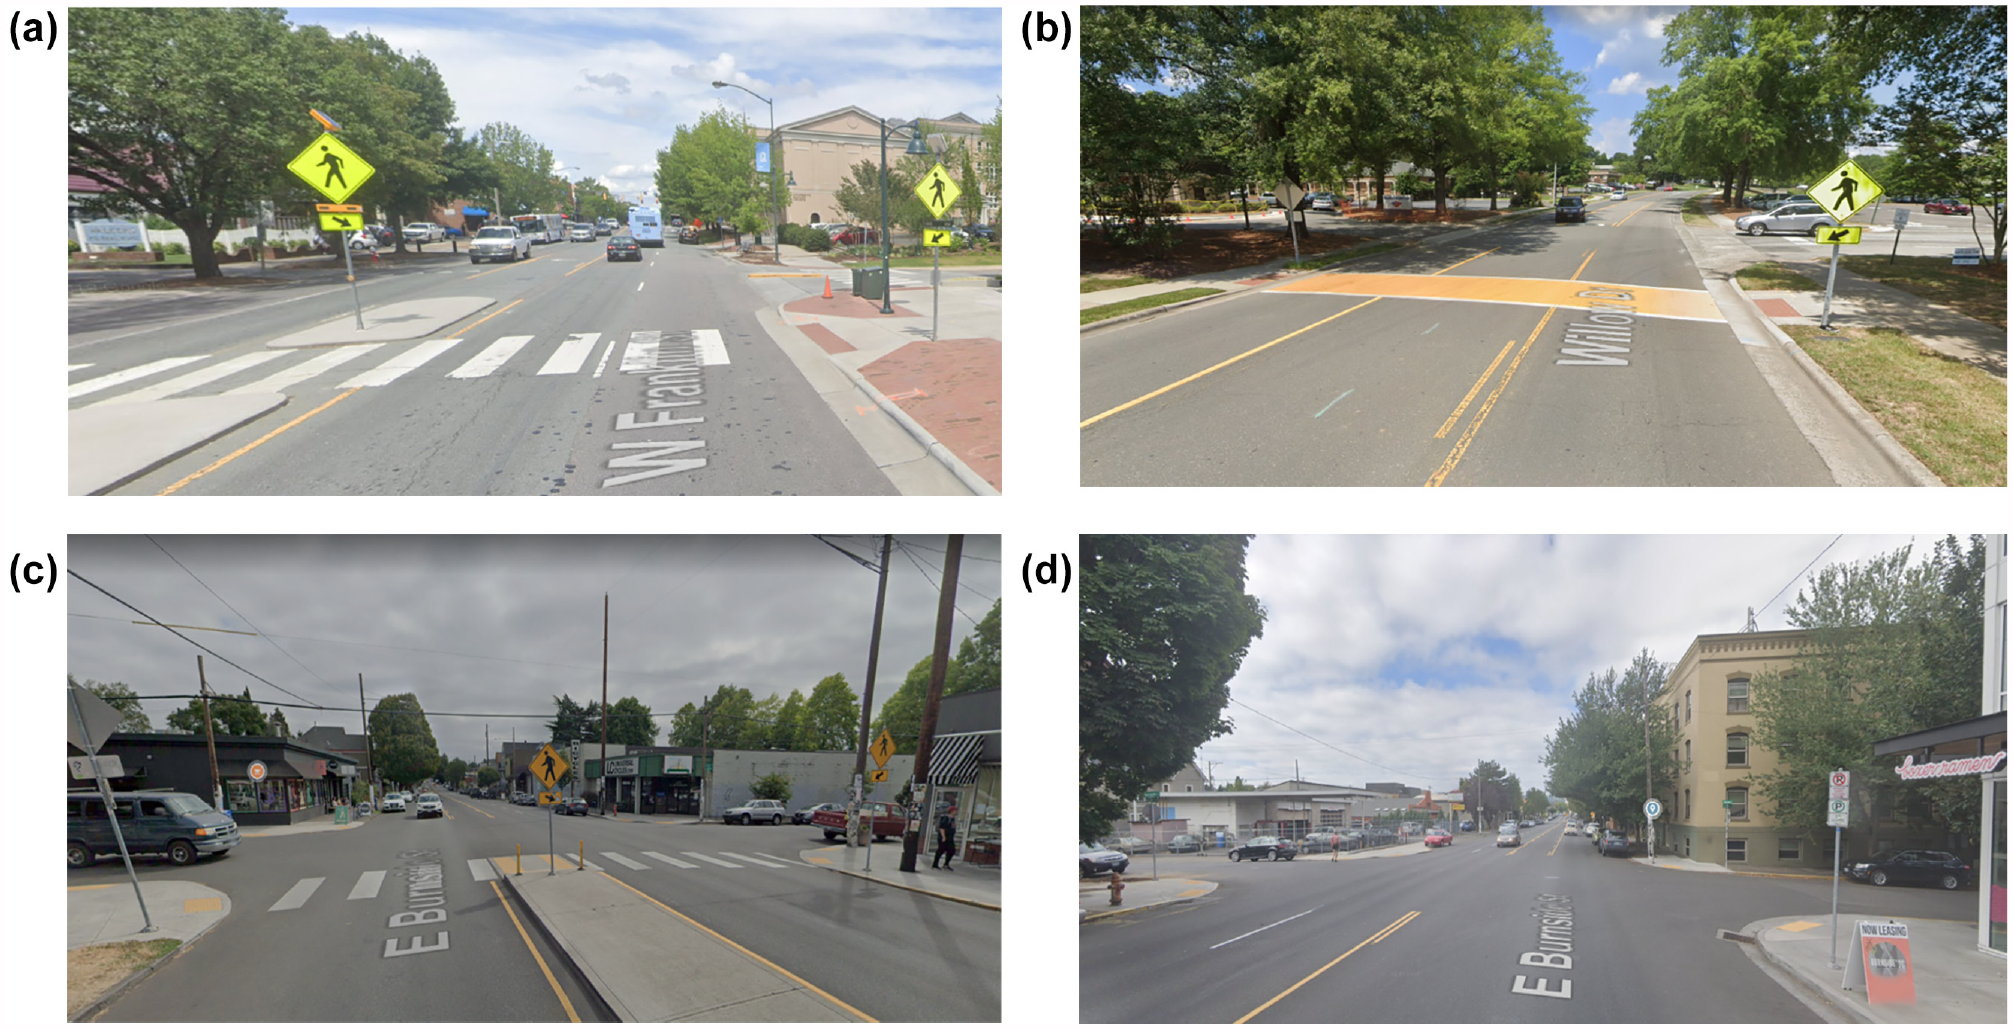
2019 Google Street View©: (a) West Franklin Street, Chapel Hill, NC (RRFB with median island and marked crosswalk, facing east); (b) Willow Drive, Chapel Hill, NC (marked crosswalk, facing north); (c) East Burnside Street Portland, OR (median island with marked crosswalk, facing east); and (d) Burnside Street Portland, OR (unmarked crosswalk, facing west).
As seen in Table 2, most of the study’s unsignalized crossing sites featured posted speed limits at or below 35 mph, four or fewer travel lanes, and mean AADT levels between 16,000 and 25,000 motor vehicles. Nonetheless, likelihood ratio chi-square tests revealed that marked and unmarked crosswalk sites tended to possess higher posted speed limits, X2(3) = 31.690, p <0.01, and number of travel lanes, X2(3) = 59.139, p <0.01 than RRFB- and median island-equipped sites. Moreover, a one-way analysis of variance indicated that traffic (i.e., AADT) was often higher at marked and unmarked crosswalk sites than sites featuring RRFBs with median islands and marked crosswalks and median islands with marked crosswalks, F(3, 355) = 20.710, p <0.01.
Survey Administration and Pedestrian Observations
Considering climatic differences between the two cities and the desire to gather sufficient samples for analysis, the team administered surveys from March through June 2019 in Chapel Hill, NC and from June through August 2019 in Portland, OR. Two surveyors were positioned at each unsignalized crossing site to intercept pedestrians crossing in either direction. For each site, the research team identified an estimated peak pedestrian travel window, which included travel times of noon to 2 p.m. and 4 to 6 p.m. on weekdays, and once on a Saturday between noon and 2 p.m. At RRFB, median island, and marked crosswalk sites, surveyors stood on opposite sides of the street and close to the entrances to the crossings. For unmarked crossings, surveyors stood on the sidewalks close to crossing pedestrians, ensuring that surveyors’ positioning did not interfere with pedestrians’ crossing maneuvers.
To solicit survey responses, surveyors approached pedestrians after they had finished crossing the street. On verbally consenting to participate, participants were handed an iPad to complete an online, 13-item survey built using Qualtrics© software (Provo, Utah). After completing the survey, the participant handed the iPad back to the surveyor who then recorded whether the participant had crossed within the crosswalk. Surveyors also documented refusals to participate.
Another element of data collection involved video observations of survey participants’ behaviors and interactions with motorists and cyclists. Video data allowed the surveyors to capture additional behaviors that were difficult to record live, such as whether the pedestrian slowed down while crossing. Each survey respondent was identified in the video to further examine interactions between pedestrians and other road users. Across all unsignalized crossings, the team captured data on interactions with motorists and cyclists and pedestrian group size, and apparent pedestrian sex.
In collecting video data, the Chapel Hill, NC team used a Mobius Action Camera ( 30 ), whereas the Portland, OR team used a GoPro Hero Black 5 camera ( 31 ). All cameras were attached to 24-ft multipurpose telescoping Doca Poles from Docazoo ( 32 ). Video data were recorded on a 64-GB SD card within each camera. The cameras were charged and powered by an external battery pack. Figure 2 depicts some of the equipment used in this study.
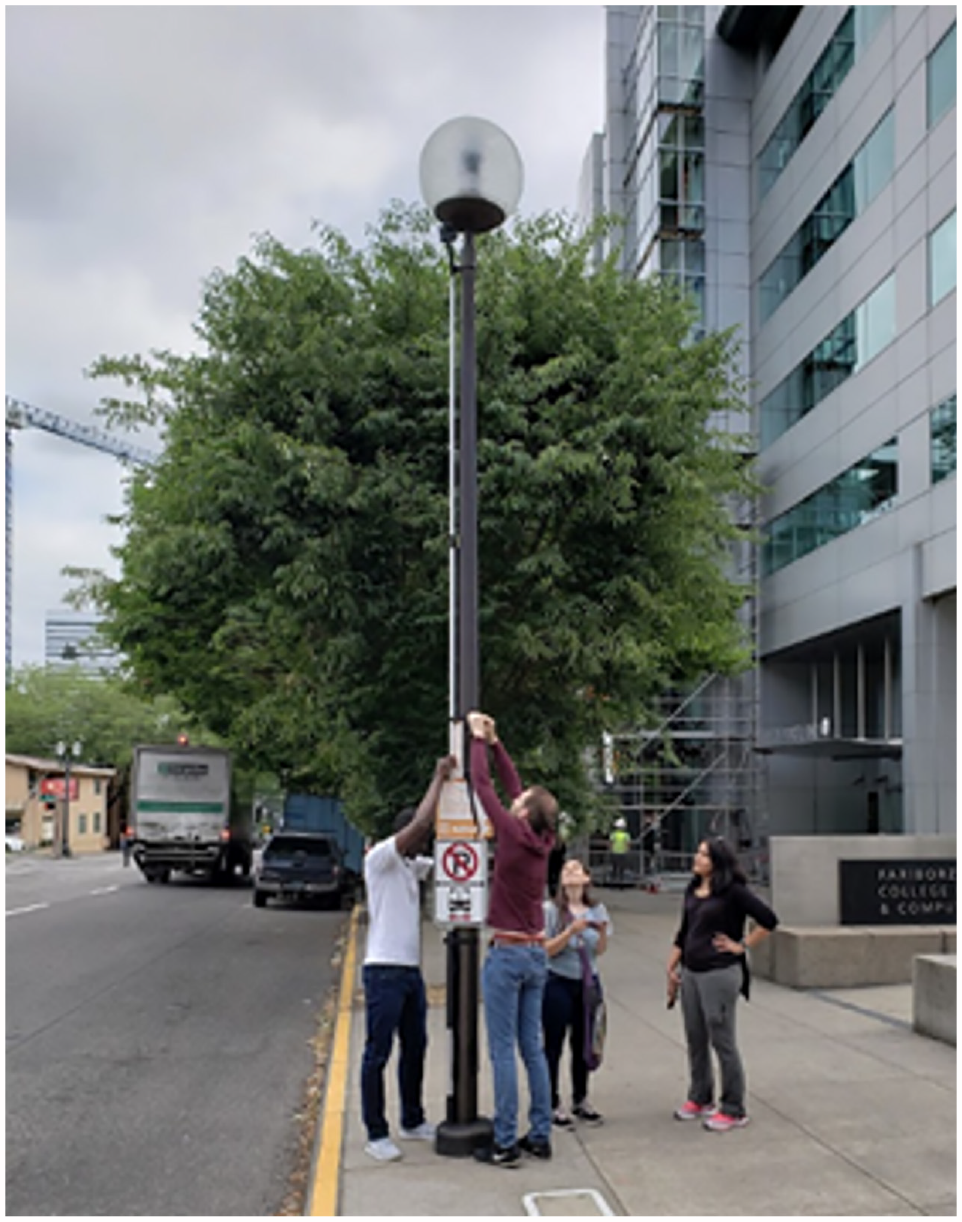
Members of the Portland, OR team installing a pole-mounted Go Pro 5 camera. Image: research team.
One camera pole was used at each of the 40 observation sites. In the field, the research team affixed the camera pole to utility poles or other available infrastructure. The poles were extended vertically to 15 to 20 ft to capture desired characteristics of the sites. Target visibility criteria for the RRFB, marked control, unmarked control, and median island crossing video setup included
Full length of crosswalk,
Shark’s teeth markings, or other roadway markings that indicate where drivers should yield or stop, on both motor vehicle approaches,
Pedestrian approaches on both sides of the street,
Push buttons on both pedestrian approaches (where applicable), and
RRFB beacons (where applicable) (Figure 3).
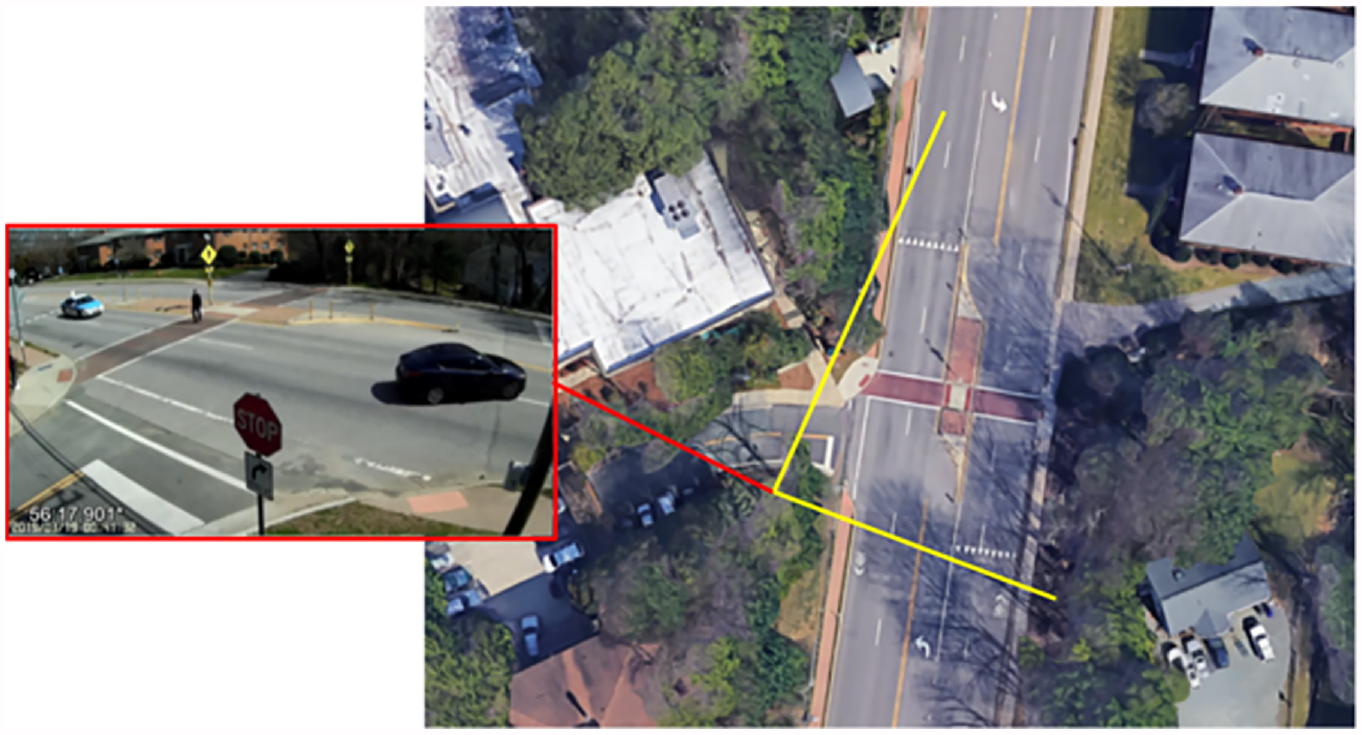
Camera angles and view of an RRFB crossing on Martin Luther King Jr Blvd in Chapel Hill, NC. Image sources: University of North Carolina Highway Safety Research Center (left); © 2019 Google (right).
Results
Descriptive Analysis and Results
More than half of the pedestrians approached agreed to respond to the survey (50.8% response rate), representing a total of 437 consenting participants across the 40 sites, and a mean of nearly 11 responses per site. Complete responses were collected from a total of 358 respondents, as indicated by participants who responded to more than half of the 13 survey questions. Sample size requirements focused on the four studied types of crossing accommodation (i.e., RRFBs, median islands, marked crosswalks, and unmarked crosswalks). Considering that each crossing accommodation type averaged 89.5 participants, the team calculated an estimated 95% confidence level of achieving a precision of +/–10% satisfaction per crossing accommodation type (see Rej [ 33 ]).
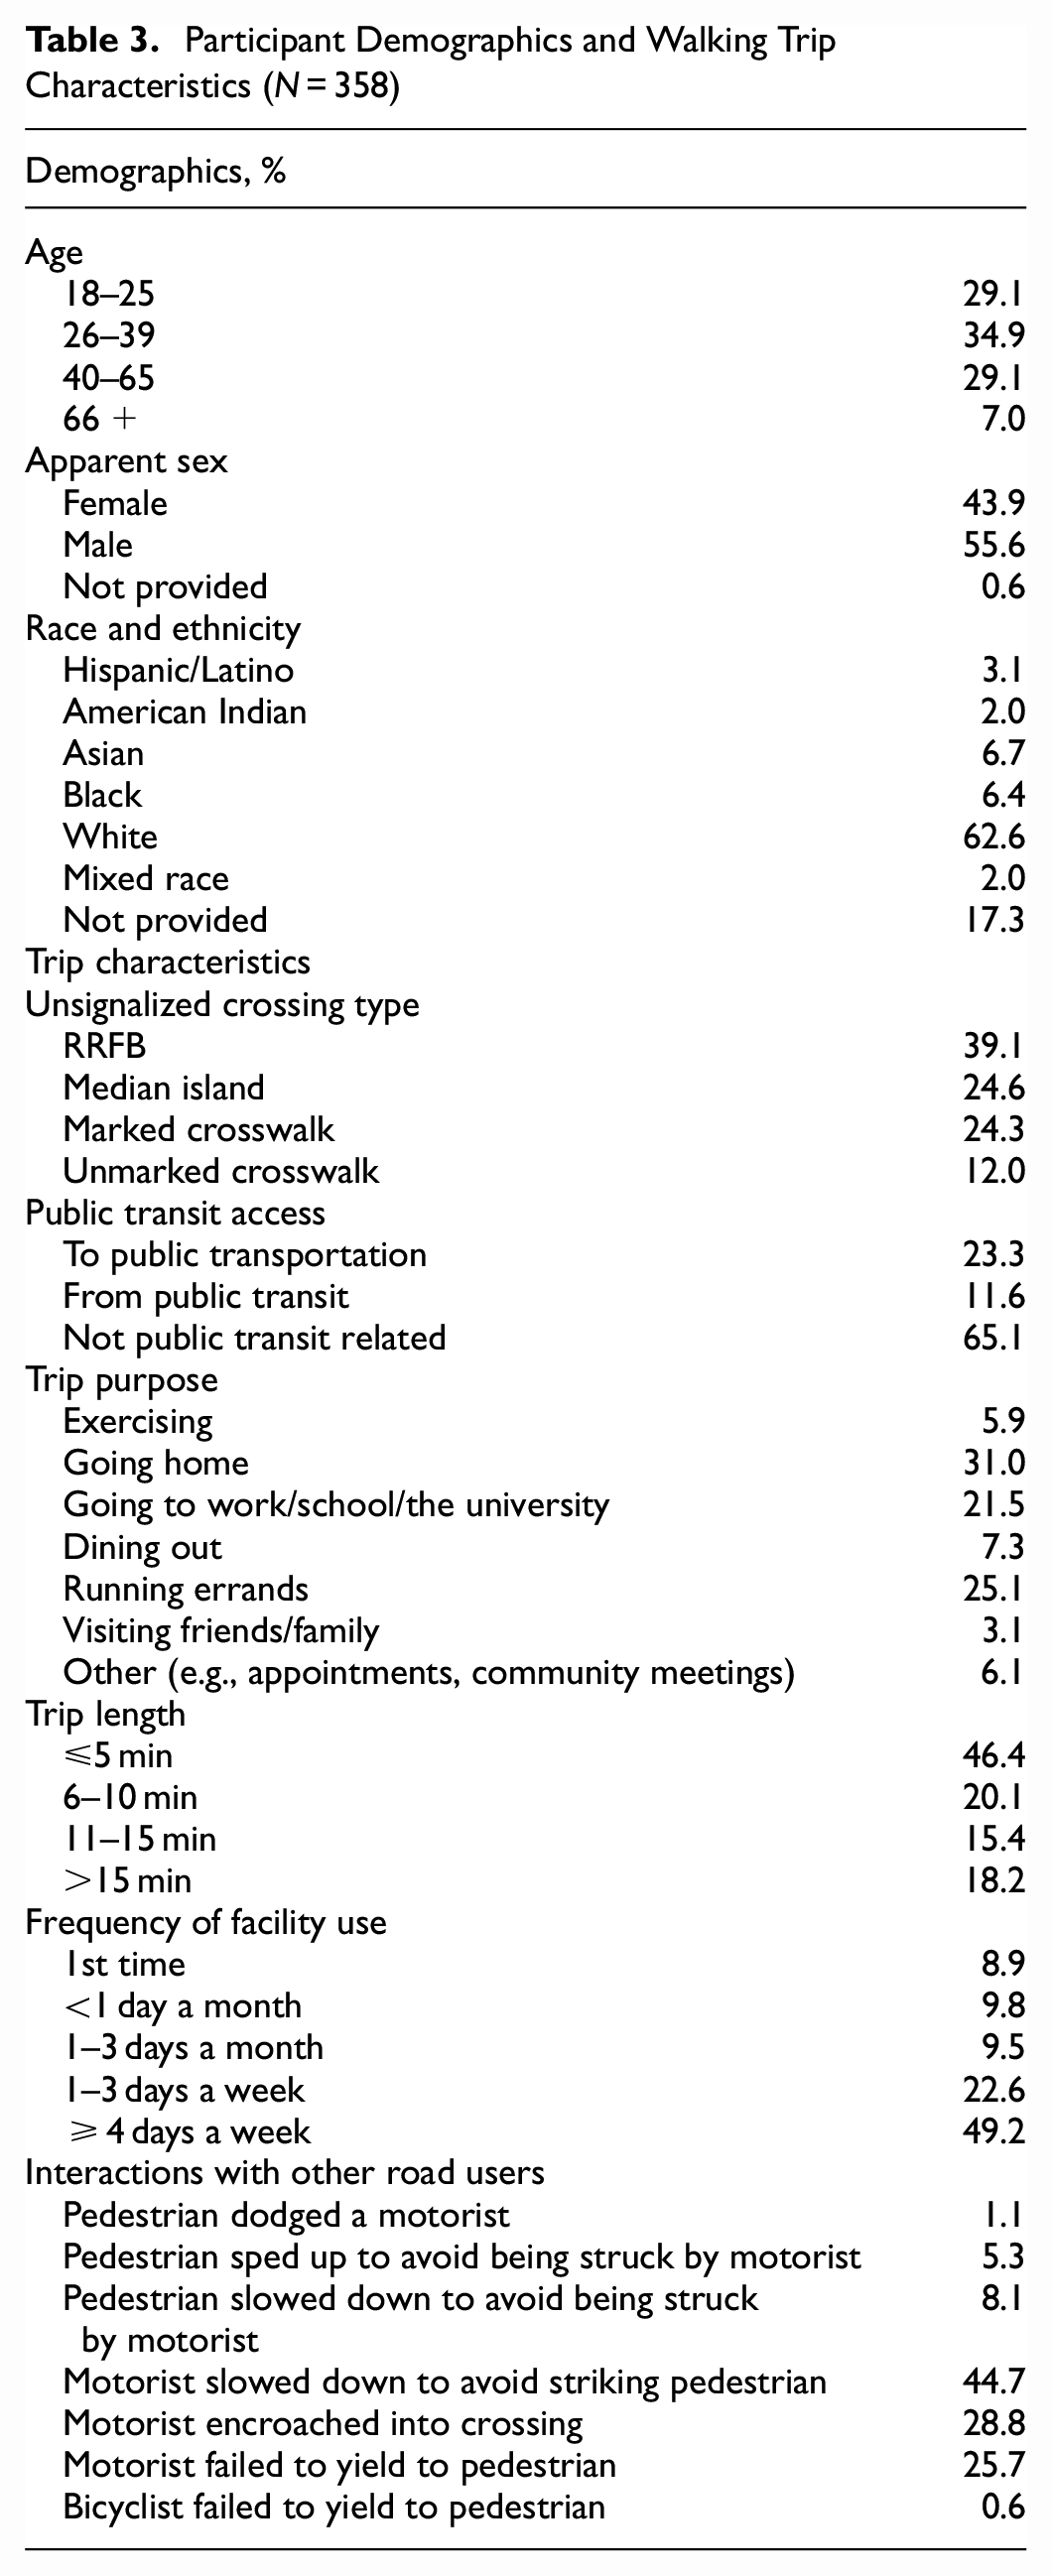
A total of 140 surveys were collected at RRFB-equipped sites, 87 at marked crosswalk sites, 88 at median island sites, and 43 at unmarked crosswalk sites. The 358 participants were evenly distributed among 18–25, 26–39, and 40–65 age categories, with between 29% and 35% of the sample falling into each of these categories, and 7% not responding to this question. The sample featured more male than female respondents (55.6% and 43.9%, respectively). White participants comprised 62.6% of the sample, with Asian and Black respondents each comprising between 6% and 7% of the sample, and Latino and American Indian respondents representing 3% and 2% of the sample, respectively (Table 3). More than 17% of participants did not respond to the race/ethnicity item. Overall, study participants were slightly older, more likely to be male, and less likely to be White and Asian than the Chapel Hill, NC and Portland, OR populations ( 34 ).
Participant Demographics and Walking Trip Characteristics (N = 358)
Regression Analysis Results
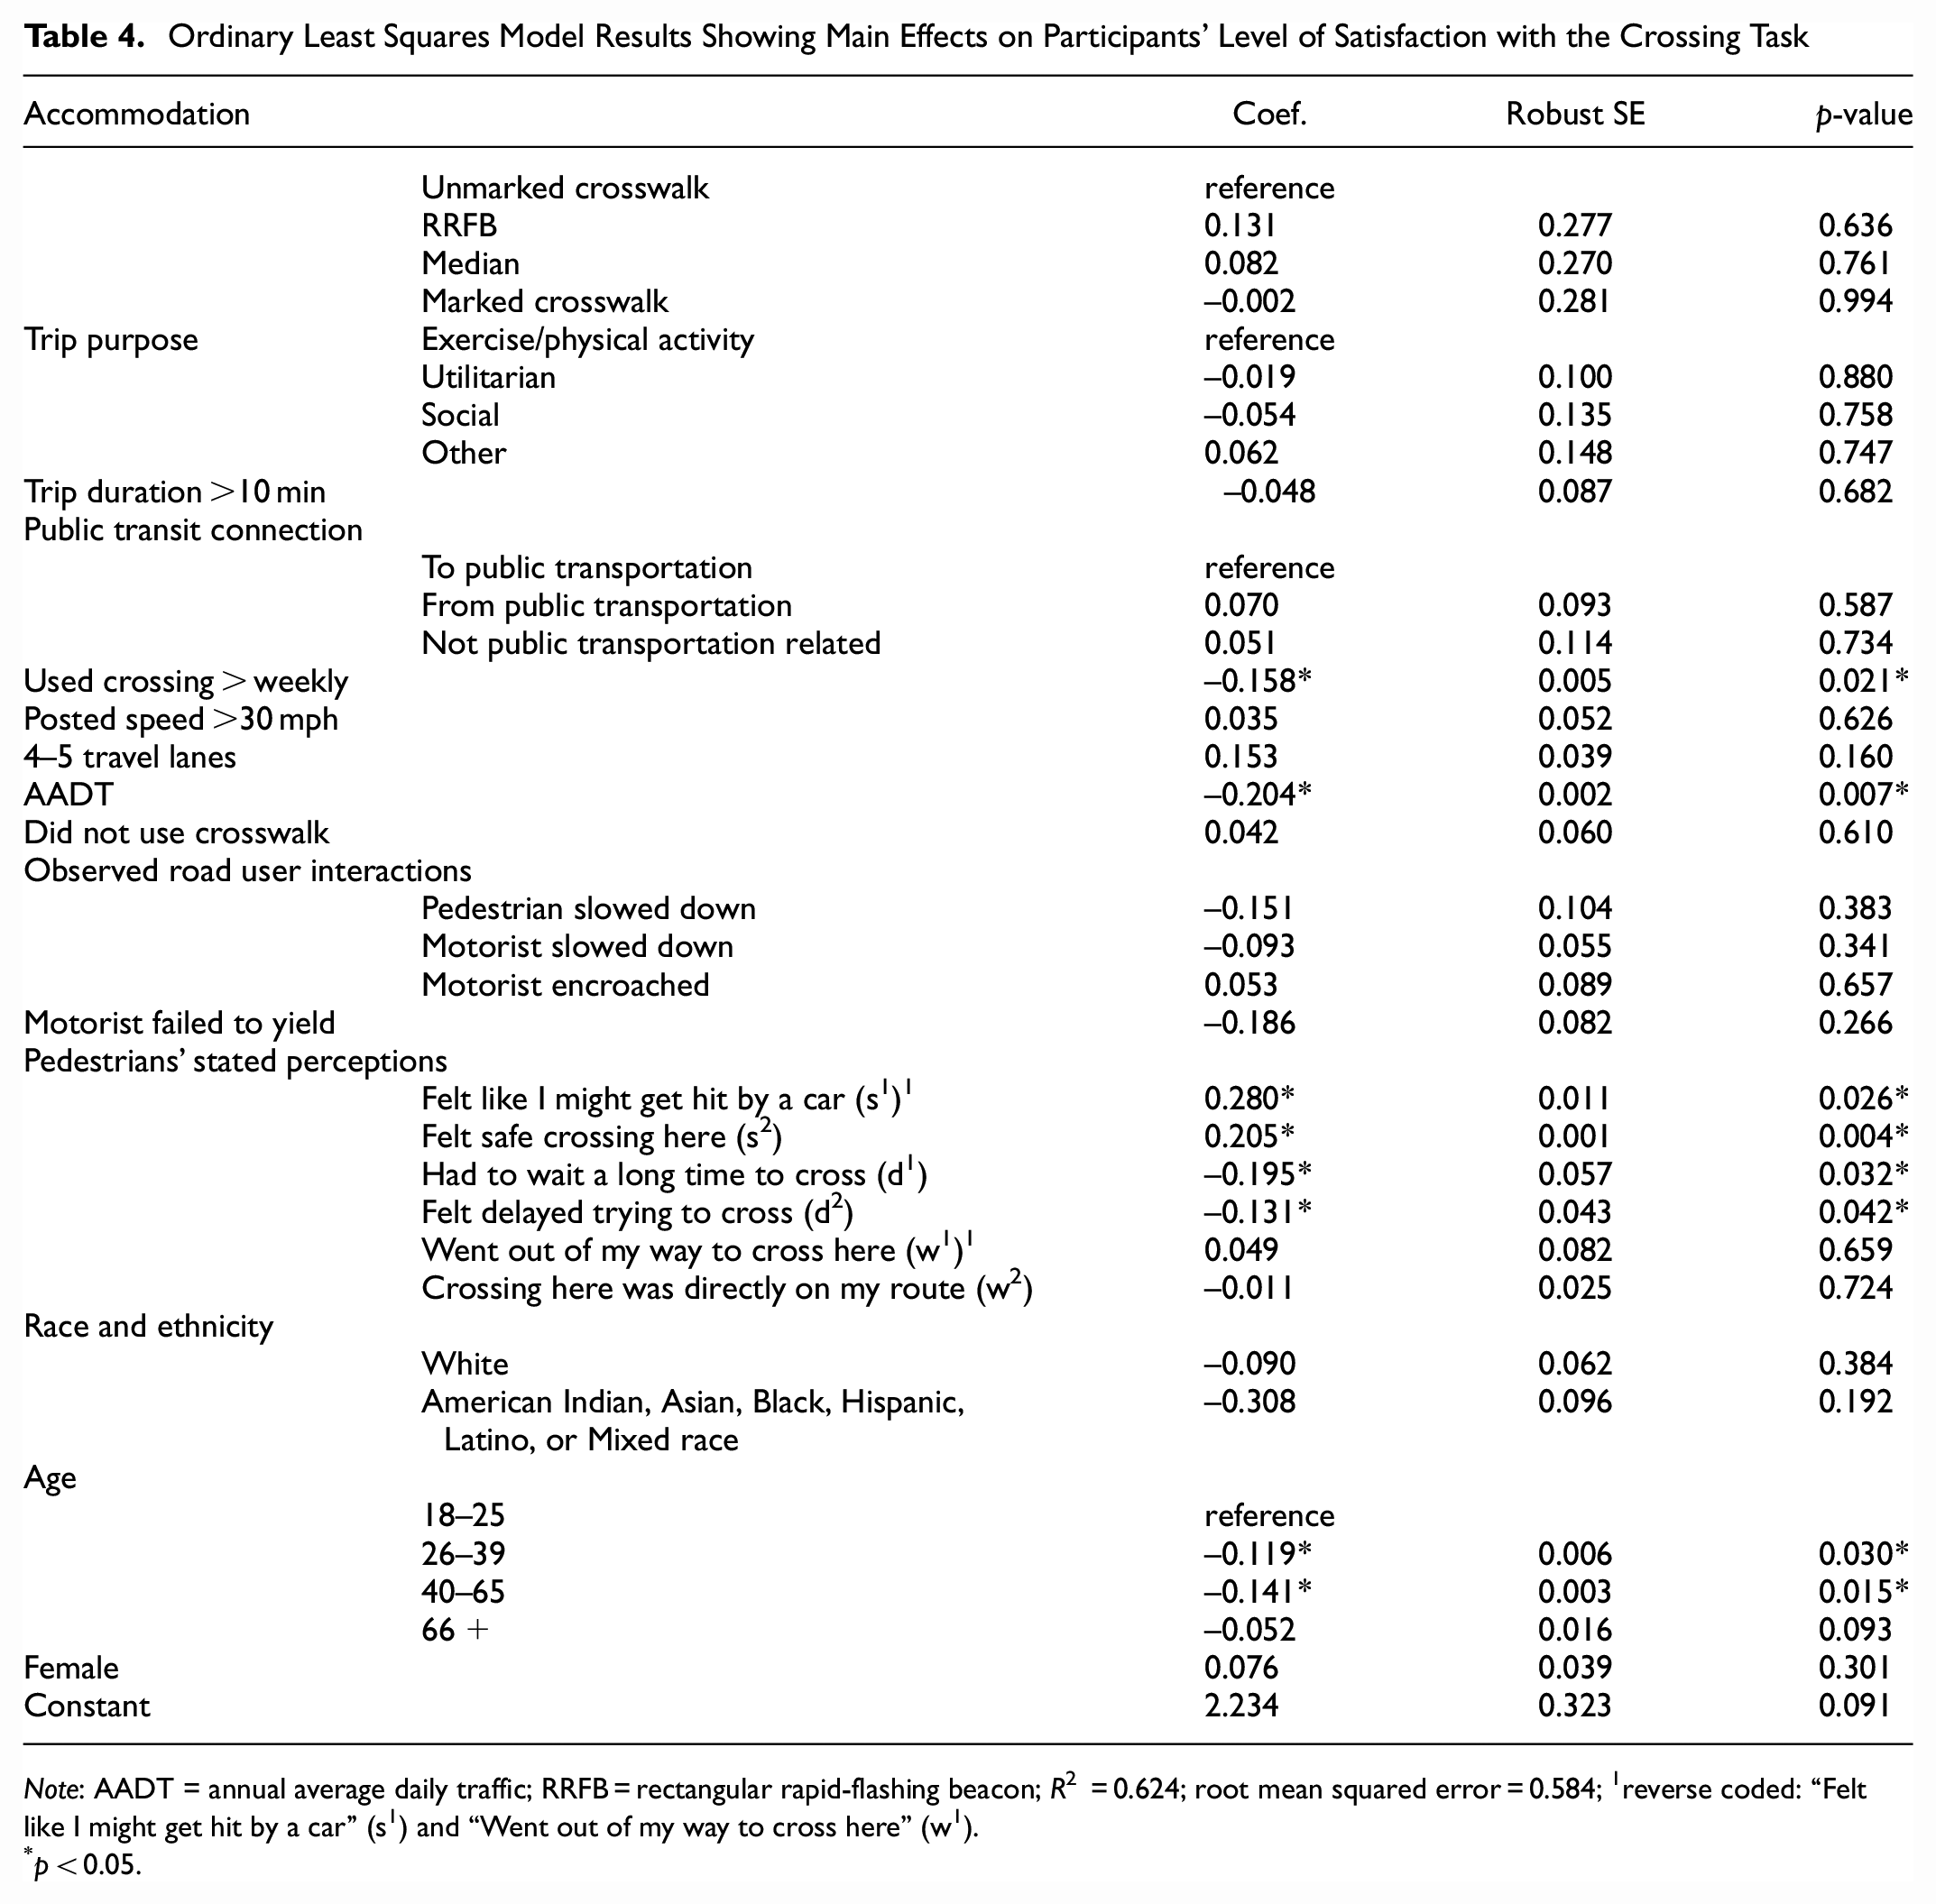
The next step in this study was to discern which accommodations and walking trip characteristics were statistically associated with pedestrians’ satisfaction with the crossing task. To explore direct effects of these variables on pedestrians’ satisfaction, the team estimated ordinary least squares (OLS) regression models by regressing pedestrians’ satisfaction with the crossing task onto a matrix of regressors. We considered clustering responses by the city in which the intercept surveys were collected (i.e., Chapel Hill, NC and Portland, OR), yet decided not to on learning that participants’ reactions to using the studied unsignalized crossing accommodations did not vary between cities. That is, the 200 participants in Portland had a mean satisfaction rating of 2.82 (SD = 0.92), whereas the 158 participants in Chapel Hill had a mean average satisfaction rating of 2.96 (SD = 0.90). The effect of participants’ city was not statistically significant, F(1, 357) = 1.78, p = 0.14. OLS models were estimated given the normal distribution of participants’ satisfaction with the crossing task (M = 2.88, SD = 0.91) (Table 4).
Ordinary Least Squares Model Results Showing Main Effects on Participants’ Level of Satisfaction with the Crossing Task
Note: AADT = annual average daily traffic; RRFB = rectangular rapid-flashing beacon; R2
p < 0.05.
As seen in Table 4, OLS regression results indicated that pedestrians’ satisfaction with the crossing task was negatively associated with crossing specific sites on at least a weekly basis, crossing streets with higher traffic volumes (AADT), and being between 26 and 65 years of age. Crossing satisfaction was positively associated with perceptions of feeling safe and not delayed while crossing. These OLS models did not detect significant differences among unsignalized crossing accommodation types and pedestrians’ satisfaction with the crossing task, a key research question in this study.
Given this finding, the team hypothesized that crossing accommodations may have indirectly affected pedestrians’ satisfaction with the crossing task. More specifically, it was thought that accommodations may differentially afford pedestrians feelings of relative safety and unhindered crossing. As described next, the team sought to examine potentially mediated relationships between crossing accommodation types and pedestrian satisfaction and thus looked to structural equation modeling to explore these causal relationships.
Structural Equation Modeling Approach and Results
To test the hypothesized mediated effects of crossing accommodation type on pedestrians’ satisfaction with the crossing task, the team estimated SEMs using Stata version 16 ( 35 ). Considering the results of the OLS model described earlier, the team theorized that participants’ perceptions of their safety and perceived delay in crossing nearly fully mediated relationships between crossing accommodations (i.e., RRFB, median, marked, and unmarked crosswalks) and crossing satisfaction. We also surmised that there would be a correlation between the error terms of perceived safety and delay in crossing, as we employed a reverse-worded item to measure perceived safety and delay, and the items indicating the perceived safety and delay constructs were strongly negatively correlated (Table 5). Moreover, as the OLS regression and goodness of fit indices suggested, we omitted the directness factor in the interest of producing more parsimonious and better fitting models. Whereas the OLS model helped the team discern how frequent use of crossing accommodations, AADT, and perceptions of safety and delay might shape pedestrians’ satisfaction with the crossing task, SEMs allowed the team to explore the mechanisms underlying the crossing accommodation–crossing satisfaction relationship (Figure 4; Tables 5 through 8). Moreover, the team hypothesized that each crossing accommodation would be uniquely associated with perceptions of safety and delay in crossing. As such, each SEM possessed an N of 358 whereby we estimated structural relationships between each crossing accommodation compared with all other crossing accommodations, and participants’ satisfaction with the crossing task.
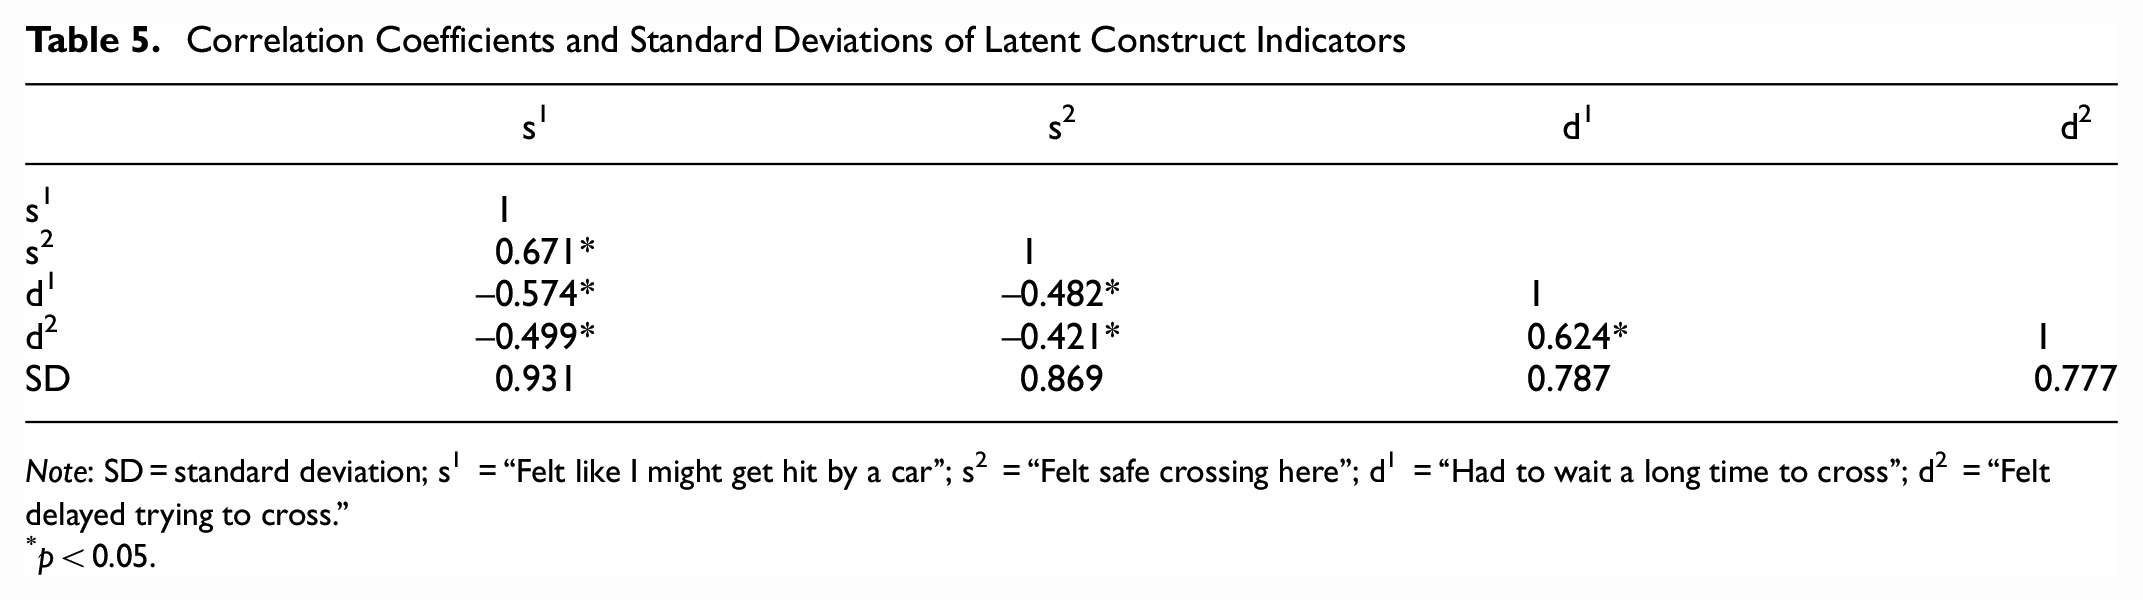
Correlation Coefficients and Standard Deviations of Latent Construct Indicators
Note: SD
p < 0.05.
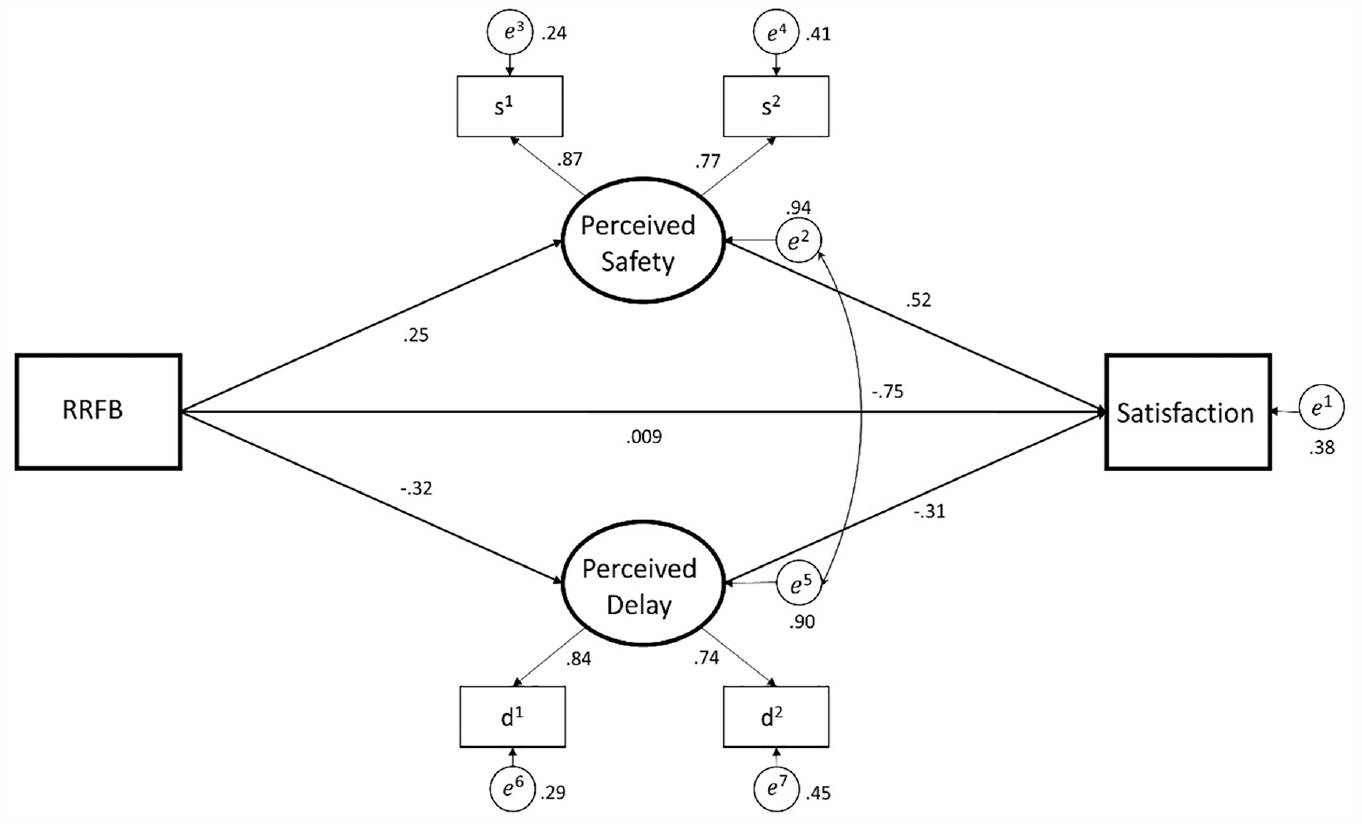
Illustration of direct and indirect effects of RRFBs with median islands and marked crosswalks on pedestrians’ crossing satisfaction.
Figure 4 illustrates the mediated relationship between RRFB with median island-equipped sites and pedestrians’ satisfaction with the crossing task.
Table 5 displays the Pearson correlations among the indicators of the perceived safety (s1 and s2) and perceived delay (d1 and d2) constructs, as well as each indicator’s SDs from the mean. As indicated in Table 5, items designed to measure perceived safety (s1 and s2) and perceived delay (d1 and d2) were strongly and positively correlated with one another. Furthermore, perceived safety items were strongly and negatively correlated with perceived delay items and vice versa.
Table 6 depicts the main results of the measurement model. Factor loadings are products of the structural equation modeling’s confirmatory factor analysis and together with the Pearson correlations in Table 5, provide evidence of the measurement model’s convergent and discriminant validity. Whereas convergent validity references how closely some variables are related to other variables designed to measure the same construct, discriminant validity requires that variables measuring one construct do not correlate with variables measuring a dissimilar construct ( 36 ).
Loadings of the Measurement Model
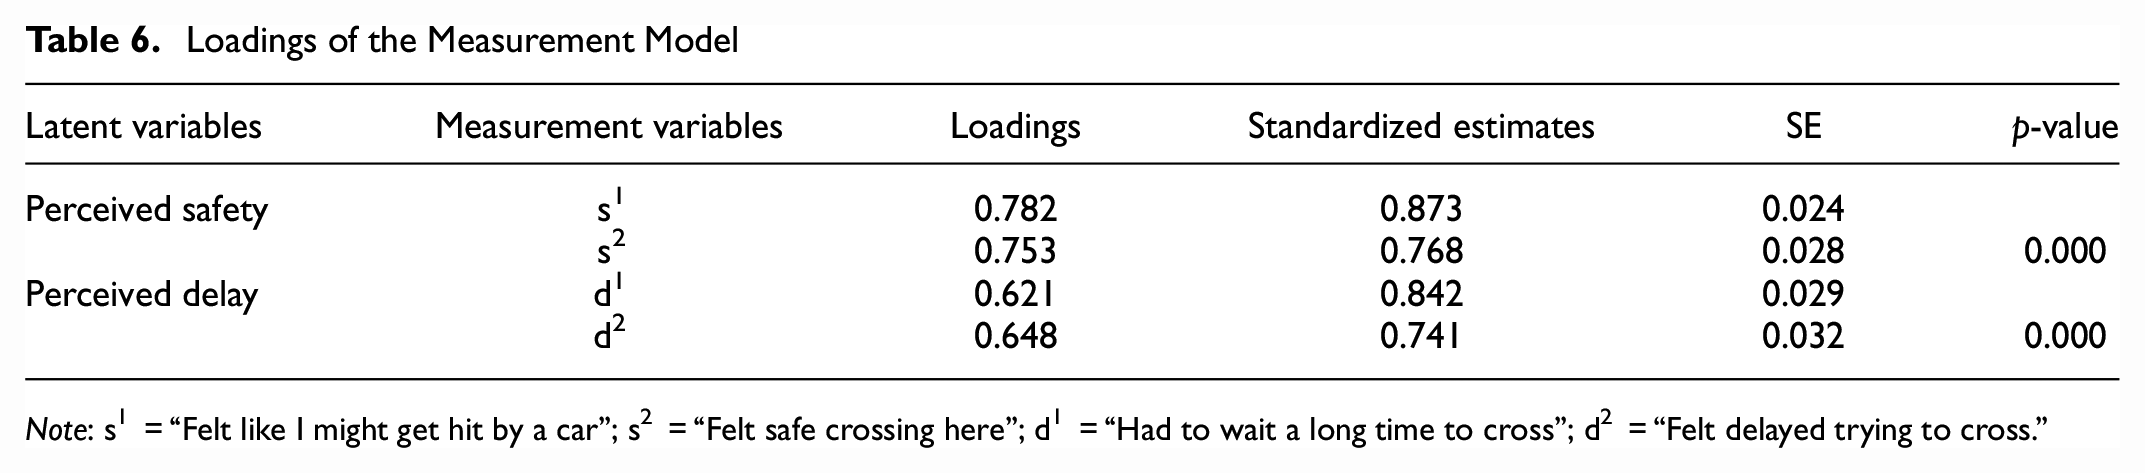
Note: s1
Table 7 provides standardized coefficients for each of the crossing accommodation types and their effects on pedestrians’ perceived safety and delay in crossing.
Direct Effects of Crossing Accommodations on Perceived Safety and Perceived Delay in Crossing
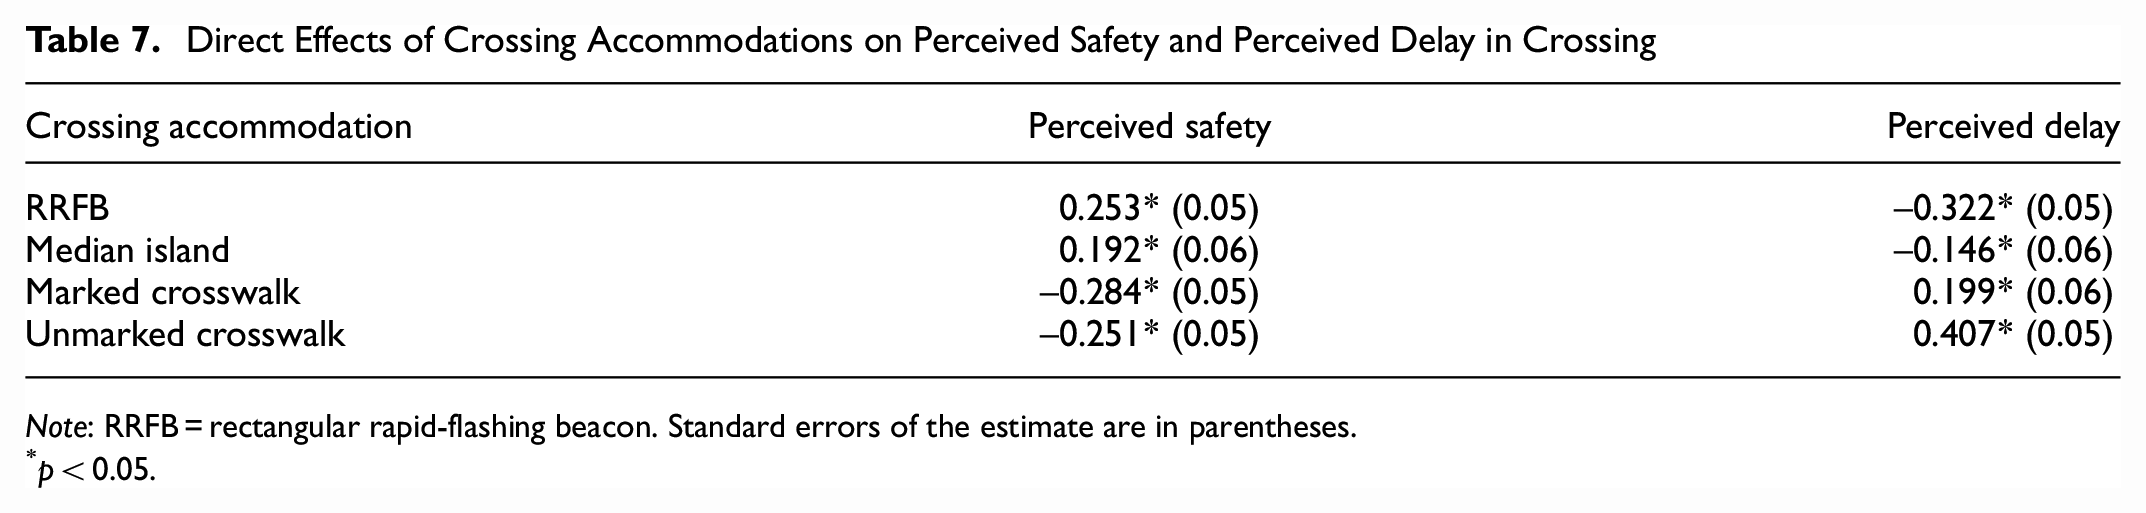
Note: RRFB = rectangular rapid-flashing beacon. Standard errors of the estimate are in parentheses.
p < 0.05.
Table 8 provides standardized coefficients for each of the crossing accommodation types, as well as the covariances of the correlated error terms associated with the perceived safety and perceived delay latent constructs.
Direct, Indirect (Mediated), and Total Effects in the Preferred Structural Model
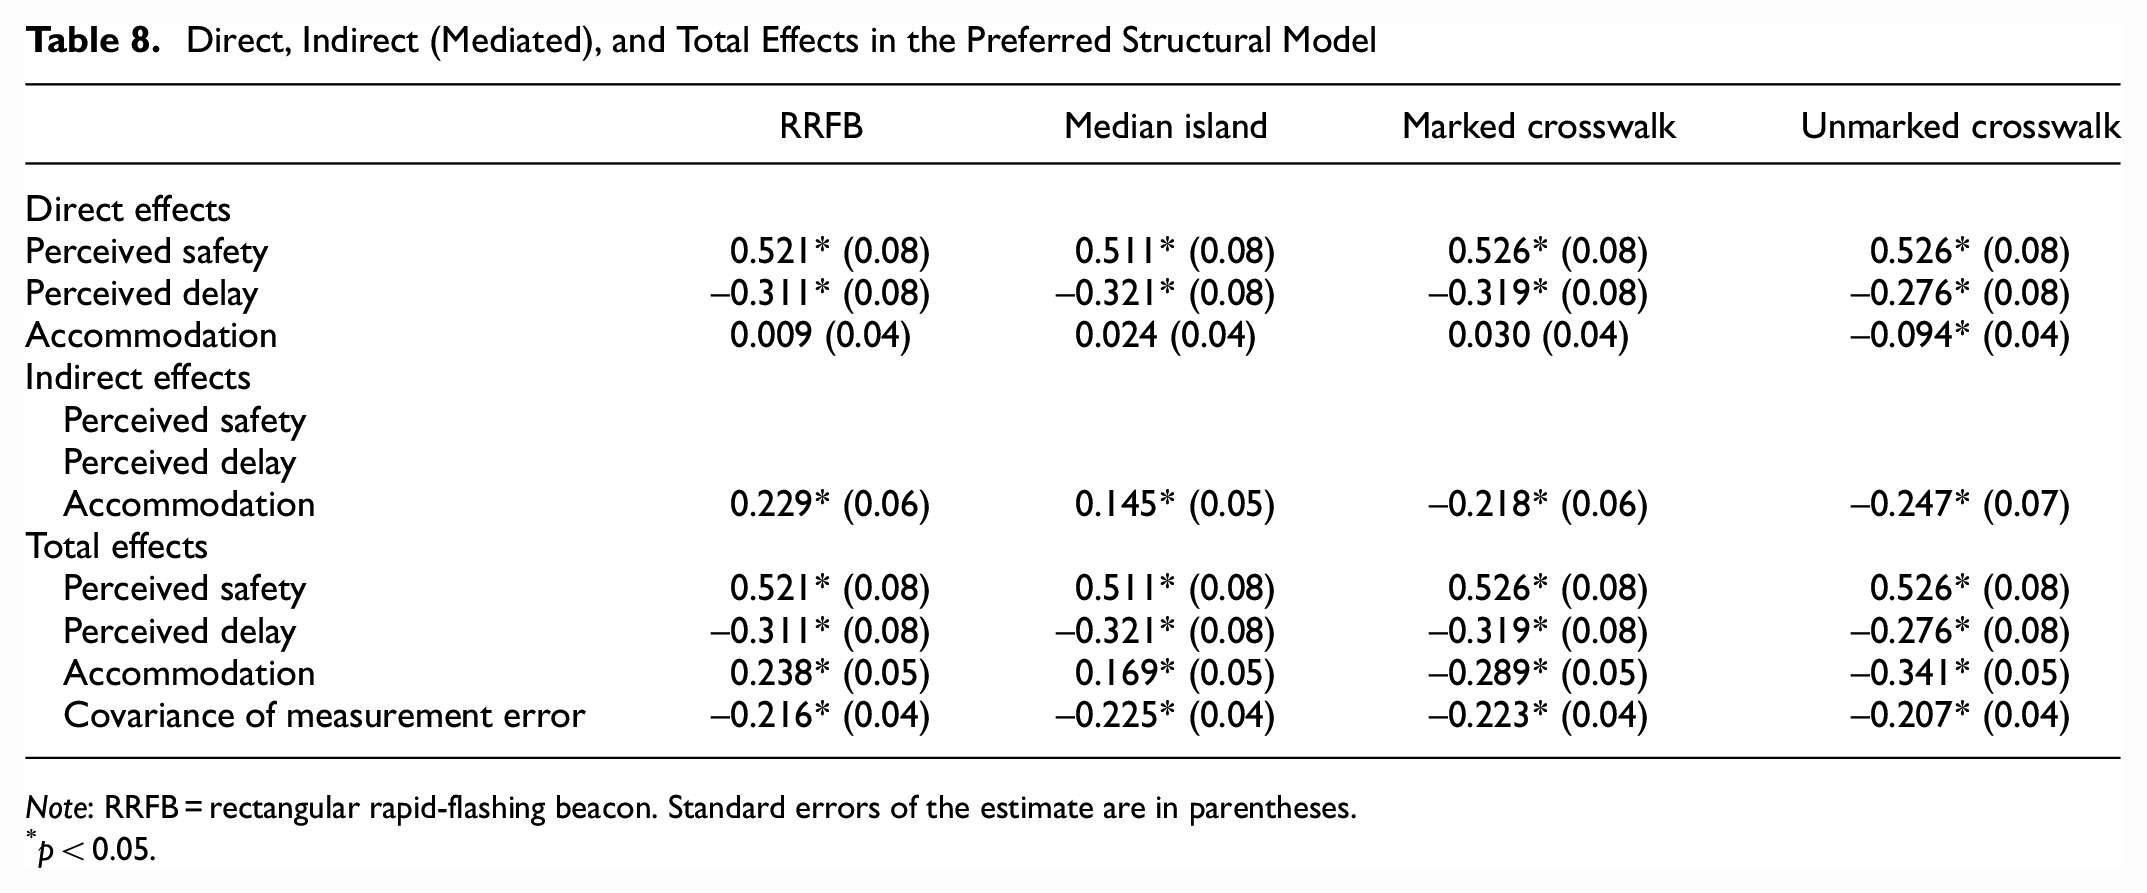
Note: RRFB = rectangular rapid-flashing beacon. Standard errors of the estimate are in parentheses.
p
Applying the following interpretive recommendations by Hu and Bentler ( 37 ), that is, root mean square error of approximation (RMSEA) ≤ 0.06, comparative fit index (CFI) ≥ 0.95, and Tucker–Lewis index (TLI) ≥ 0.95, we see that the practical fit indexes displayed in Table 9 suggest that the SEMs applied to the mediated accommodation–crossing satisfaction relationship fit the data well. RMSEA provides an average amount of misalignment for a model per degree of freedom relatively independent of sample size; CFI is an indicator of relative noncentrality between a hypothesized model and the null model of modified independence (i.e., a model where only error variances are estimated); and the TLI rewards for model parsimony and penalizes for model complexity ( 38 ). Models that differed from the preferred SEMs illustrated in Figure 4 and Tables 7 and 8 included covariates that possessed statistically significant relationships with crossing satisfaction in the final OLS model (as displayed in Table 4, i.e., participant age, at least weekly use of the studied crossing, and AADT). However, the referenced goodness of fit statistics indicated that these alternative SEMs fit the data relatively poorly compared with the preferred SEMs, thus, the preferred SEMs featured in Table 7 were retained.
Model Goodness of Fit Indexes
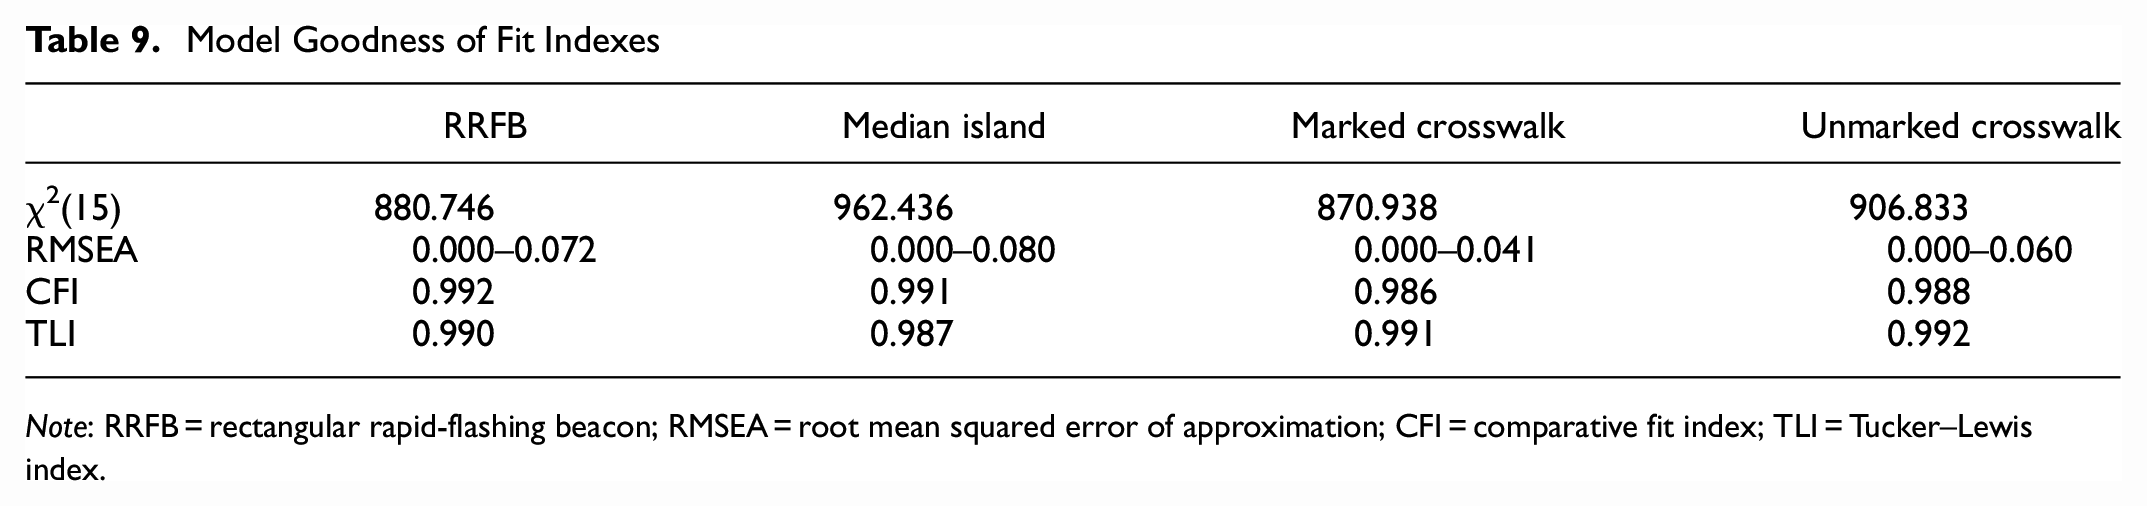
Note: RRFB = rectangular rapid-flashing beacon; RMSEA
Within Accommodation Types
RRFBs with Median Islands and Marked Crosswalks
RRFBs with median islands and marked crosswalks were positively associated with perceptions of safety (standardized coefficient
Median Islands with Marked Crosswalks
As with RRFBs with median islands and marked crosswalks, median islands with marked crosswalks were positively associated with feelings of safety (standardized coefficient = 0.19, SE = 0.06, p < 0.05) and negatively associated with perceptions of delay (standardized coefficient = –0.15, SE = 0.06, p < 0.05) during the act of crossing the street. As displayed in Table 8, the size of the effect of median islands on perceptions of safety and delay were slightly attenuated when compared with the effects of RRFBs on these perceptions. Indirect effects of median islands on pedestrians’ crossing satisfaction were 0.145 (SE = 0.05), and their total effects on satisfaction were 0.169 (SE = 0.05).
Marked Crosswalks
Unlike RRFBs with median islands and marked crosswalks or median islands with marked crosswalks, sites featuring only marked crosswalks were negatively associated with perceptions of safety (standardized coefficient = –0.29, SE = 0.05, p < 0.05) and positively associated with perceptions of delay (standardized coefficient = 0.20, SE = 0.06, p < 0.05) when crossing. The indirect effect of marked crosswalks on pedestrians’ satisfaction with the crossing task, as operated through pedestrians’ perceptions of safety and delay in crossing, was –0.218 (SE = 0.06) and marked crosswalks’ total effect on pedestrians’ crossing satisfaction was –0.289 (SE = 0.05).
Unmarked Crosswalks
Unmarked crosswalks, representing the absence of a crossing accommodation, possessed a direct, negative effect on participants’ crossing satisfaction. And as expected, unmarked crossings were negatively associated with feelings of safety (standardized coefficient = –0.25, SE = 0.05, p < 0.05) and positively associated with perceptions of delay (standardized coefficient = 0.41, SE = 0.05, p < 0.05). Beyond their influence on perceptions of safety and delay, unmarked crossings imparted a unique and negative effect on pedestrians’ satisfaction with crossing the street. The indirect effect of unmarked crosswalks on pedestrians’ satisfaction with crossing as operating through pedestrians’ perceptions of safety and delay was –0.247 (SE = 0.07) and their total effect on satisfaction was –0.341 (SE = 0.05).
Across Accommodation Types
As Table 8 indicates, the only crossing accommodation that imparted a direct effect on crossing satisfaction was the unmarked crosswalk. None of the others imparted direct effects on participants’ satisfaction with crossing. However, all accommodations exhibited indirect effects on crossing satisfaction as mediated by participants’ feelings of safety from being struck by motorists and not feeling delayed in crossing. Further, whereas RRFBs and median islands were positively associated with participants’ satisfaction with the crossing task, marked and unmarked crosswalks were negatively associated with participants’ crossing satisfaction.
The perceived safety and perceived delay constructs had positive and negative direct effects on participants’ crossing satisfaction, respectively. Feeling safe from being struck by a motorist demonstrated the strongest direct effect on crossing satisfaction, with feelings of being delayed when attempting to cross demonstrating a significant though weaker negative effect on crossing satisfaction. Across all crossing accommodation types, the error terms of the perceived safety and -delay constructs were modestly and negatively related (rs ranging from –0.207 to –0.225, p < 0.05; Table 8).
Discussion
In this study, the research team explored pedestrians’ experiences using different accommodations at unsignalized street crossings in Chapel Hill, NC and Portland, OR. The team discovered that pedestrians’ perceptions of crossing-related safety, delay, and satisfaction varied as a function of the unsignalized crossing accommodation type, with RRFBs with median islands and median islands alone offering pedestrians greater perceptions of safety and unhindered travel than marked and unmarked crosswalks. SEMs validated the structural integrity of the latent perceived safety and perceived delay constructs and illustrated the indirect relationship between accommodation type (i.e., RRFB, median island, marked, and unmarked crosswalks) and pedestrians’ satisfaction with the crossing task. As indicated by the SEMs, pedestrians’ satisfaction was largely a function of feeling safe and not being delayed when crossing the street.
Aside from the provision of no crossing accommodation—that is, unmarked crosswalks, which directly and negatively affected crossing satisfaction in our SEM—none of the other studied accommodations directly influenced crossing satisfaction. Conceptually, this finding seems logical. By their nature, marked crosswalks, median islands, and RRFBs with medians are designed to achieve slightly different ends. Marked crosswalks delineate pedestrian crossing space and communicate to drivers where to expect pedestrians and yield the right-of-way to them ( 39 ). Median islands, on the other hand, augment marked crossings with a physical refuge from motor vehicle traffic. Adding RRFBs to median-equipped crossings provides additional benefits, such as inducing higher rates of drivers yielding or stopping ( 40 , 41 ), as well as the ability to indicate one’s desire to cross the street. Theoretically then, it can be said that crossing accommodations, such as median islands and those equipped with RRFBs, facilitate the act of crossing by making it cognitively less demanding, emotionally less anxiety-ridden, and potentially competence-inducing (i.e., in the case of RRFBs, providing pedestrians a modicum of control over when their crossing commences).
Regression analysis results suggested that street characteristics such as posted speed limits and the number of travel lanes were not significantly associated with pedestrians’ satisfaction with the crossing task. Moreover, as observed by Kadali and Vedagiri, trip characteristics, including trip length, purpose, and integration with transit were all unassociated with crossing satisfaction ( 27 ). Nonetheless, higher motor vehicle volumes (operationalized as AADT) were associated with lower satisfaction.
It is worth noting that distances between marked crosswalks predicted pedestrians’ sense of safety and convenience in other studies (e.g., Zhao et al. [ 19 ]). It is not clear why this study failed to detect perceived route directness effects on crossing satisfaction. Indeed, participants’ feelings of directness to access a surveyed crossing—perhaps the conceptually closest measure to Zhao et al.’s “convenience” construct ( 19 )—was not meaningfully associated with crossing satisfaction. Our inability to indicate a significant route directness–crossing satisfaction relationship may be an artifact of our operational definition of route directness (i.e., manifested as participants agreeing that they traveled “out of their way” to access a crossing site). It could be that this “out of the way” concept may be more closely linked to time or mental constructs other than “directness” in people’s minds. It could also be that few of the pedestrians surveyed at unmarked crossing locations would be willing to venture out of their way to use an unmarked crosswalk.
That crossing accommodations themselves failed to directly affect crossing satisfaction might reflect pedestrians’ crossing-related “expectancies”—people’s appraisals of the perceived likelihood of gratifying their desires ( 42 ). That is, on approaching an unmarked crossing, pedestrians may expect some degree of delay and lack of protection from being struck by a driver. In such a circumstance, a successful crossing may evoke feelings of gratitude and relief with crossing the street unfettered. On the other hand, a pedestrian who actuates the button at an RRFB-equipped crosswalk may expect drivers to yield the right-of-way to them. A successful crossing at an RRFB-equipped location may simply meet pedestrians’ expectation of a safe, unhindered crossing. Indeed, the OLS results illustrated how using specific crossings at least weekly was associated with lower crossing satisfaction, suggesting that the pedestrian perception–crossing facility relationship may be nonlinear, especially with repeated use. Relevant here is the notion that accommodation type may not directly affect pedestrians’ satisfaction with the crossing task; instead, it likely affords them experiences of safe and unhindered passage, which in this study were the experiences most predictive of crossing-related satisfaction.
The relative simplicity and brevity of the present unsignalized crossing satisfaction scale lends itself to use in the field. Surveyors can administer each survey in less than 5 min and depending on participation levels, can quickly discern the relative functioning of individual crossing sites vis-a-vis comparable sites in the transportation network. Agencies could additionally carry out before–after studies on unsignalized crossing facility change to assess whether and to what degree pedestrians’ crossing satisfaction shifts in response to the changes. Transit agencies could conduct similar studies, especially where their stops and stations feature unsignalized crossings.
Limitations
Despite this study’s robust statistical approach and simple, intuitive operationalization of unsignalized pedestrian crossing satisfaction, it possesses several notable shortcomings. For one, the research team surveyed adult pedestrians crossing only during peak travel times, between noon and 2 p.m. and between 4 and 6 p.m. and not near primary or secondary schools. This means that our study design did not capture school-, child-, or family-oriented travel, nor did it assess pedestrians’ perceptions while crossing during earlier or later times of the day. The exclusion of nighttime crossing perceptions is unfortunate, as three-quarters of serious pedestrian injury in the United States occurs during times of darkness ( 43 ). Thus, this study provides little meaningful information on how different crossing accommodations function in relation to pedestrian satisfaction near schools or during darker or less traveled times of the day. Secondly, the uneven distribution of observations collected across crossing accommodation types may have skewed the results in favor of more equipped sites and dampened the external validity of the results gathered at unmarked crossing sites. Thirdly, we measured apparent sex via data collectors’ appraisals instead of asking participants to report their sex or gender, which may have misclassified some participants. A fourth shortcoming of this study relates to its cross-sectional design. Though the team collected between-site data on potential influences on pedestrians’ satisfaction with the crossing task (e.g., number of travel lanes, AADT, posted speed limits), we did not account for factors that may have systematically and differentially influenced pedestrians’ experiences across sites (e.g., the presence and placement of sharks teeth markings, distance to an unsignalized intersection, distinction between high-visibility versus parallel line crosswalk markings, the condition of crosswalk markings, nor the use of advance or overhead signs to alert motorists to upcoming crossings). Ideally, the present research would have incorporated a between- and within-site design, thereby controlling for some unobserved confounders across sites, such as land development or adjacency to other facilities. Future work should consider administering the intercept survey during different times of day, especially nighttime, and at additional types of crossing locations (e.g., ones equipped with pedestrian hybrid beacons, raised crossings).
Conclusion
In this exploratory study of pedestrians’ satisfaction crossing at unsignalized locations, the research team discovered that pedestrians’ satisfaction with the crossing task was largely determined by their perceptions of safety and delay in the act of crossing the street. Further, accommodations such as RRFBs with median islands and marked crosswalks, and median islands with marked crosswalks appeared to afford pedestrians greater feelings of safety and unhindered travel relative to sites equipped with only marked crosswalks or unmarked crossings. Not only that, perceptions of safety and being less delayed when crossing were associated with higher levels of satisfaction with the crossing task. Assuming expressed satisfaction with crossing roadways represents a reliable indicator of higher quality LOS for pedestrians, transportation professionals might benefit more pedestrians by providing them with RRFBs, median islands—especially where pedestrians must cross three or more travel lanes—and high-visibility crosswalk markings. In turn, enhancing pedestrians’ LOS with respect to crossing streets might contribute to increases in walking.
Footnotes
Acknowledgements
The authors thank the University of North Carolina at Chapel Hill and Portland State University research assistants who collected the intercept survey data and coded the video observation data used in this study, as well as Bill Rogers of NCHRP and the NCHRP 17–87 project panel for their valuable feedback. We also thank the reviewers for their thoughtful recommendations on improving this manuscript.
Author Contributions
The authors confirm contribution to the paper as follows: study conception and design: S. LaJeunesse, S. Kothuri, K. Nordback, N. McNeil; data collection: K. Nordback, S. Kothuri, N. McNeil; analysis and interpretation of results: S. LaJeunesse, W. Kumfer, S. Kothuri; draft manuscript preparation: S. LaJeunesse, W. Kumfer, S. Kothuri. All authors reviewed the results and approved the final version of the manuscript.
Declaration of Conflicting Interests
The authors declared no potential conflicts of interest with respect to the research, authorship, and/or publication of this article.
Funding
The authors disclosed receipt of the following financial support for the research, authorship, and/or publication of this article: This research is part of a National Cooperative Highway Research Program (NCHRP) project 17–87, which is part of the NCHRP. NCHRP is administered by the Transportation Research Board and funded by participating member states of the American Association of State Highway and Transportation Officials. NCHRP also receives critical technical support from the Federal Highway Administration, U.S. Department of Transportation.