
Abstract
Trip chaining and the use of travel time by commuters have long been the foci of considerable research interest. However, despite this attention, few studies have investigated the differences in behavior associated with daytime and nighttime travel. To fill this gap in the literature, the present study investigated the influence of time of day on trip chaining and travel time use. The analysis was based on a data set of residents of the Karlsruhe area who regularly commute both during the day and at night. The data set was analyzed both descriptively and through the application of a series of logistic regression models. The results indicated that nighttime had a significant influence on the formation of trip chains and the use of time during the commute. For example, both the number of trip chains formed and the number of activities performed during the commute are reduced at night. The reasons for forming trip chains also varied according to the time of day. Whereas most trip chains were formed for errands during the day, at night, the majority were formed to pursue leisure activities. In addition, activities such as working, telephoning, looking at the landscape, or reading were significantly reduced at night. The findings of this study contribute to a more in-depth understanding of commuter behavior, on the basis of which, innovative and efficient mobility strategies can be further developed.
Given the competing demands on a commuter’s time budget and that the commute itself is often perceived as a burden ( 1 , 2 ), commuters are seeking ways to both minimize their travel time and/or use it more efficiently ( 3 – 5 ). One such efficiency approach might be, for example, active use of the commute time for other activities. This can be achieved by completing tasks that would normally take up additional time in the daily schedule, such as answering emails or making phone calls, or through using the travel time for leisure activities or personal interests. In each of these cases, the time spent commuting loses its status as an isolated period of waiting or traveling, thus generating positive utility, and increasing overall travel satisfaction ( 3 , 6–8).
Another approach to minimizing and making more efficient use of commuting time is to strategically link a series of activities along a single route. During the course of a day, people usually carry out several activities to meet their needs. For example, they go grocery shopping, work, or take their children to school. Generally, these activities are tied to specific locations that can only be reached by traveling. Instead of traveling to these places one at a time and thus always returning to the origin point (e.g., the home), activities and places can be strung together and linked by a chain of individual trips. Such a sequence of trips with successive stops for different purposes is called a “trip chain.” Although there is no general definition of a trip chain, it usually starts from the place of residence, includes one or more intermediate stops at different locations of activity, and then ends back at the place of residence ( 9 , 10 ).
In recent years, several studies have analyzed the factors determining the formation of trip chains and the performance of activities during travel time. The results of studies such as by Primerano et al. ( 10 ), Bhat ( 11 ), Ye et al. ( 12 ), Liu et al. ( 13 ), Guan et al. ( 14 ), Daisy et al. ( 15 ), Huang et al. ( 16 ), and Schneider et al. ( 17 ) indicate that time of day is an important factor in this context. Interestingly, although the temporal dimension has been considered in these previous studies, one period is notable in its almost complete absence: the nighttime. The aim of the present study, therefore, was to fill this research gap by investigating the impact of nighttime on both performance of activities during the commute and the formation of trip chains while considering the purpose of each stop and controlling for a variety of variables. In doing so, the present study aimed to contribute to a more nuanced understanding of the influence of temporal factors and to promote more efficient mobility strategies, especially for people who regularly commute at night.
This paper begins with a brief literature review focusing on the identification of variables that have already been identified as influencing trip chain formation and travel time use. The next section describes the data, variables, and analytical approaches used the current paper and is then followed by the results of the research. The paper concludes with a summary of the key findings, including a critical evaluation of the methodology as well as recommendations for future research.
Literature Review
Trip Chaining
Several studies have shown that the frequency and complexity of a person’s trip chaining depends, among other things, on several sociodemographic, socioeconomic, and land-use factors. In particular, gender and age emerge as key characteristics in predicting trip chaining behavior. Existing research, including studies by Liu et al. ( 13 ), McGuckin and Murakami ( 18 ), Wang ( 19 ), and Grue et al. ( 20 ) consistently indicate that women are more likely to create trip chains than men. Scheiner and Holz-Rau ( 21 ) and Bautista-Hernández ( 22 ) note that this phenomenon may be attributed to women’s greater involvement in organizing and coordinating family life, that is, especially when they are involved in partnerships while simultaneously balancing various responsibilities such as childcare, housework, and employment. In relation to age, Bhat ( 11 ), Ye et al. ( 12 ), Liu et al. ( 13 ), Grue et al. ( 20 ), Xianyu ( 23 ), and Chen and Akar ( 24 ) have shown that the complexity of trip chains decreases significantly with age, and is especially low in older age groups. Xianyu ( 23 ) and Liu et al. ( 13 ) suggest that this may be attributed to a reduced physical ability to travel, as well as the existence of more flexible time–space relationships in retirement, that is, more time is available for individual trips.
Other characteristics identified as significantly contributing to the formation of trip chains include household income, household size, number of children in the household, urban structure, quality of access to public transport, and travel distance ( 15 , 20 , 22 , 24–26). However, of note here is that several studies also suggest that the influence of these characteristics varies depending on whether commuter or noncommuter trip chains are examined ( 12 , 27 , 28 ). In this light, and to increase the validity and comparability of the results within the current study, only research findings from studies specifically examining trip chaining in the context of commuting were considered.
Wang ( 19 ) and Bautista-Hernández ( 22 ), for example, using U.S. and Mexican data, found that household size is negatively correlated with the complexity of the commuting trip chain. Importantly, this effect was observed specifically with respect to the number of adults in the household. The authors explain the above effect by suggesting that adults are able to share the necessary errands among themselves. On the other hand, when children are present in the household, they result in a positive correlation with the complexity of the commute trip chain ( 13 , 19 , 29 ). In relation to mobility, children often rely on their parents’ support to, for example, travel to kindergarten, school, or to attend leisure activities. However, as they get older, they become more independent, and this effect diminishes. In addition, Bhat ( 11 ), Ye et al. ( 12 ), Liu et al. ( 13 ), Ma et al. ( 29 ), and Chowdhury and Scott ( 30 ) have demonstrated that individuals living in higher income households are more likely to form complex commute trip chains than individuals living in lower income households.
The observed effects of urban structure are, however, less consistent. Whereas Liu et al. ( 13 ) and Daisy et al. ( 15 ) conclude that higher population density is associated with an increased number of stops per commuter trip, Bautista-Hernández has claimed that higher population density reduces the number of additional stops ( 22 ). In their study, Ma et al. distinguish between population density at the place of residence and at the place of work ( 29 ). They found that higher population density at work leads to more stops during the commute, whereas higher population density at home leads to fewer stops. Wang also makes this distinction ( 19 ) but, in contrast to Ma et al. ( 29 ), did not find any significant correlations. With regard to the parameters of distance and type of employment, recent studies have identified them as having no or relatively little impact on the complexity of the commuting chain ( 12 , 19 , 22 ).
The significant impact of time of day on the formation of trip chains has been demonstrated by several studies including those by Primerano et al. ( 10 ), Bhat ( 11 ), Ye et al. ( 12 ), Liu et al. ( 13 ), Guan et al. ( 14 ), Daisy et al. ( 15 ), Huang et al. ( 16 ), and Schneider et al. ( 17 ). For example, using data from the 2011 Swedish National Travel Survey, Liu et al. showed that commutes made during the morning peak hours are less complex than those made during the off-peak hours ( 13 ). Schneider et al. obtained similar results in their analysis of the Netherlands Mobility Panel data, demonstrating that the majority of stops in commute trip chains do not occur in the morning, but rather after 4:00 p.m. ( 17 ). Both authors explain their findings by suggesting that commuters feel more time constrained before work than after work. In Xiaoshan, a district in Hangzhou, China, Guan et al. have examined the behavior of commuters in relation to their nonwork activities, including stops during the commute ( 14 ). They found that the earlier a commute takes place in the morning and the later it takes place in the evening, the less likely it is to include an additional stop. Bhat provides more precise time data, including an analysis of the purposes of the stops ( 11 ). By examining the travel behavior of workers during their evening commute using a sample from the 1991 Boston Household Activity Survey, people finishing work after 6:00 p.m. were found to be less likely to combine their commute with a stop for shopping or leisure than those finishing work between 4:00 and 6:00 p.m. In contrast, people who finish work before 4:00 p.m. were more likely to include a stop for personal business in their commute. Similarly, Primerano et al. examined the relationship between the time and purpose of stops ( 10 ). In their analysis of the 1999 Adelaide Urban Transport Household Survey, they found that during peak hours most stops are made for picking up and dropping off people. Interestingly, they also found that stops for other purposes were generally spread evenly throughout the day.
Although the above studies provide valuable insights into the relationship between time of day and trip chain formation, further research was needed to gain a more complete understanding of this relationship ( 12 , 18 , 22 ). In particular, the night period remains underexplored in the current body of research. Only Huang et al., using multiday smartphone-based GPS data from Shanghai residents, have presented findings related to nighttime commuting, demonstrating that leaving work after 9:00 p.m. is negatively correlated with trip chain complexity ( 16 ). Nevertheless, no study has, to the best of the current author’s knowledge, investigated the impact of late night and early morning hours on trip chain formation. The significance of this research gap becomes particularly apparent when considering that recent insights of a study based on German Mobility Data indicate that approximately 9% of all commutes take place during nighttime hours ( 31 ). The current study therefore contributes to a more differentiated understanding of the influence of time factors on commuters’ travel behavior.
Travel Time Use
In addition to the formation of trip chains, the use of travel time has increasingly become a focus of research interest. Over the last two decades, several studies have investigated the types of activities undertaken during travel and how they interact with the travel experience itself. Here, one of the key research concerns has been whether the effective use of travel time, either for work-related tasks or for recreation and personal “me time,” contributes to the perception of travel time as productive or valuable rather than worthless and burdensome (e.g., 3 , 5 , 7 , 32–36). Several studies have also examined the relationship between the performance of activities during travel and the value of travel time savings (VOTTS) (e.g., 5 , 35 , 37–41). Most of these studies agree that VOTTS tend to decrease when travelers use their travel time for activities.
Conducting a meta-analysis of 14 studies from 2003 to 2014, Tang et al. found that the activities most frequently examined within the literature include sleeping/snoozing, listening to music/radio/audio books, reading books/documents, eating/drinking, window gazing, people watching, and talking to other passengers ( 33 ). They also observed a concurrently growing focus on investigating work-related activities. As part of this development, the number of studies dealing with the work-related use of information and communication technologies (ICT) during commuting has particularly increased in recent years (e.g., Gripsrud and Hjorthol [ 4 ], Wang and Loo [ 34 ], Malokin et al. [ 40 ], and Choi and Mokhtarian [ 42 ]). For a detailed overview of the use of ICT and the role of digital activities in travel, see Pawlak ( 43 ).
A central concern of travel time use research is the identification of factors influencing the amount and type of activities undertaken and thus the overall travel experience. Although the majority of studies include common sociodemographic, socioeconomic, and mode-related variables (such as travel time, mode choice) in their models, temporal factors are often neglected, similar to studies on the formation of trip chains ( 44 ). However, the small number of studies that do consider the time of day in their investigations have shown that the morning commute is more likely to be used by commuters for work purposes ( 33 , 45 ) and computer use ( 32 ), whereas the evening commute is more likely to be used for leisure activities such as reading or listening to music ( 3 , 46 ). In addition, Gamberini et al. ( 47 ) have shown that there is significantly less talking during the morning commute than during the afternoon commute. Despite these findings, none of the studies cited has satisfactorily dealt with a time period later than 11:00 p.m. and earlier than 5:00 a.m. Therefore, once again, the nighttime period remains largely unexplored. A further aim of the present study, therefore, was to fill this research gap and to investigate how commuter activities differ between day and night.
Methodology
Data and Variables
The data for the analysis were collected in a two-phase survey. The first phase took place between July and October 2020 and the second phase between February and May 2021. The study area was limited to the city of Karlsruhe and the surrounding area.
In the first phase, the main aim was to interview people working in the typical sectors of the nighttime economy, such as restaurants, bars, and hotels. Unlike those working in large companies, these people are difficult to reach through trade unions or management, and therefore need to be visited and interviewed directly in their workplaces. To this end, students were deployed as on-site interviewers as part of a seminar. Before the survey, the students were trained to conduct a professional and standardized interview using the paper-and-pencil interview method.
The second phase of the survey focused on employees in larger companies and enterprises. The companies contacted were specifically selected according to the occupational sectors most frequently associated with night work in Germany as stated in the official data of the Federal Statistical Office and the Federal Institute for Occupational Safety and Health ( 48 , 49 ). In contrast to the first phase, the second phase of the survey involved contacting managers, works councils, and trade unions to ask them to distribute the questionnaires to employees. This approach was designed to reach as many employees as possible through a top-down process. Of the 11 companies contacted, three responded positively. These were a local transport company, an office of the state police department, and a large medical institution. The remaining requests were refused, either making reference to the COVID-19 pandemic situation occurring at the time of the study or without further justification. A detailed presentation of the problems that occurred during the analysis process in the context of the COVID-19 pandemic can be found in the conclusions. Within the participating companies, all employees were informed about the survey and asked to participate.
The questionnaire developed for the study was identical for both survey phases and contained a total of 45 questions. Although in the first phase the answers were recorded by the interviewers, in the second phase the participants completed the questionnaire independently. Participants could choose to fill in the questionnaire on paper or online. Owing to the method used, it was not possible to determine a response rate or draw conclusions about the overall sample. In total, data were collected from N = 756 people.
For the survey, people who regularly commuted at night were specifically selected. Night was defined in accordance with the Working Time Act ( 50 ) as the period between 10:00 p.m. and 6:00 a.m. A consequence of this definition is, however, that people who work a standard night shift, that is, from 10:00 p.m. to 6:00 a.m., do not commute during the night, but either before or after. These people were therefore not included in the survey. Instead, the survey focused on people who have a combination of daytime and nighttime commutes. For example, if a person starts work at 6:00 a.m., the outward trip takes place before this time, and therefore, during the night. The return trip would then take place after work during the day. The opposite is true for people who start work in the afternoon or evening and finish work at night. In this case the outward trip would take place during the day and the return trip during the night. This selection of participants allowed for data to be collected about both daytime and nighttime commutes, also enabling a comparison between the two.
Among other themes, questions were asked about the choice of transport, the subjective well-being of commuters, the working environment, and the sociodemographic and socioeconomic situation of the respondents. Similar to the diary method, the participants were also asked to complete a table of all their trips to and from work in the previous week, indicating the start and end times and whether the commute was an outward or return trip. Several other questions were then asked in relation to these trips. With regard to use of travel time, respondents were asked about the activities they did during their commute and whether these activities were more likely to take place on the outward trip to work, on the return trip from work, or equally on both trips. The preselected response options were working or studying, using social media, talking on the phone, chatting, listening to something (such as music or a podcast), reading, thinking in peace, looking at the countryside, and sleeping. Respondents were also given the opportunity to add their own entries to this list.
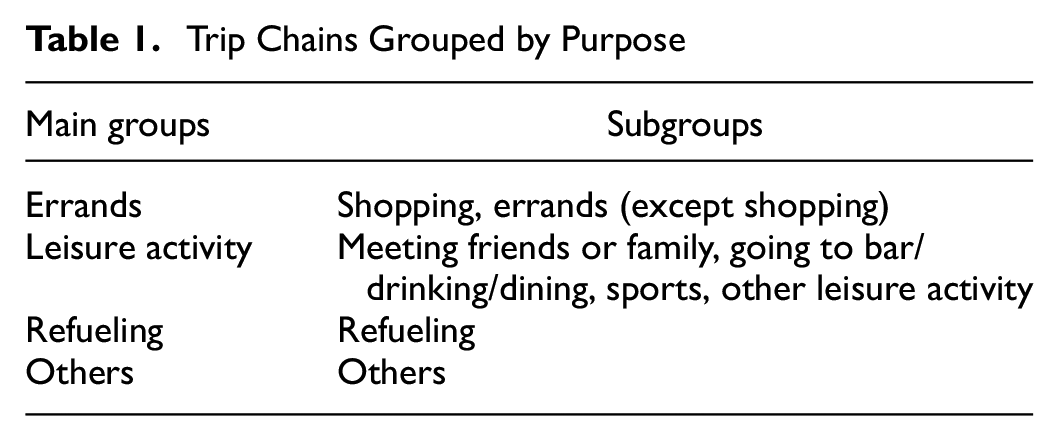
With respect to the formation of trip chains, two open-ended questions were asked, with multiple answers possible. First, respondents were asked whether at least one of the outward trips in the previous week had included an intermediate stop. If so, the purpose of the stop was then asked. The same questions were asked for the return trip. During postcoding, the responses were divided into four main categories with a total of eight subcategories, depending on the purpose of the intermediate stop. A detailed list of these categories and subcategories is given in Table 1.
Trip Chains Grouped by Purpose
In addition to the above, all recorded trips were divided into daytime and nighttime commutes based on the given start and end times. A trip was classified as a “nighttime commute” if at least half of the trip time was between 10:00 p.m. and 6:00 a.m. Otherwise the trip was classified as a “daytime commute.” On this basis, two dummy variables,
Table 2 shows the sociodemographic, socioeconomic, and spatial characteristics of the sample. The classification of occupational groups is based on the official Classification of Occupations 2020 of the Federal Employment Agency. The classification of region types is based on the official regional statistics of the Federal Institute for Research on Building, Urban Affairs and Spatial Development and reflects the respondents’ place of residence. With regard to the composition of the sample, more than 60% of respondents were male and just under half had a monthly net income of less than 1,000 Euros. Both characteristics were largely consistent with official statistics and other representative studies on nighttime mobility in Germany ( 31 , 48 , 49 ). However, in these findings, age was an exception. Although previous studies have shown that night commuters tend to be middle-aged to older ( 31 , 48 , 49 ), the data from the present study indicated that 54% of respondents were 34 years old or younger. A possible reason for this discrepancy could be an interviewer effect caused by the survey method. As the first phase of the survey was mainly carried out by students, and it can be assumed that they primarily approached people from their immediate environment, therefore also students, it is likely that this age demographic is overrepresented in the sample. Other indicators that suggest an above-average proportion of respondents as being students included the aforementioned low average monthly net income and the high proportion of persons without a vocational qualification (39%).
Sample Description
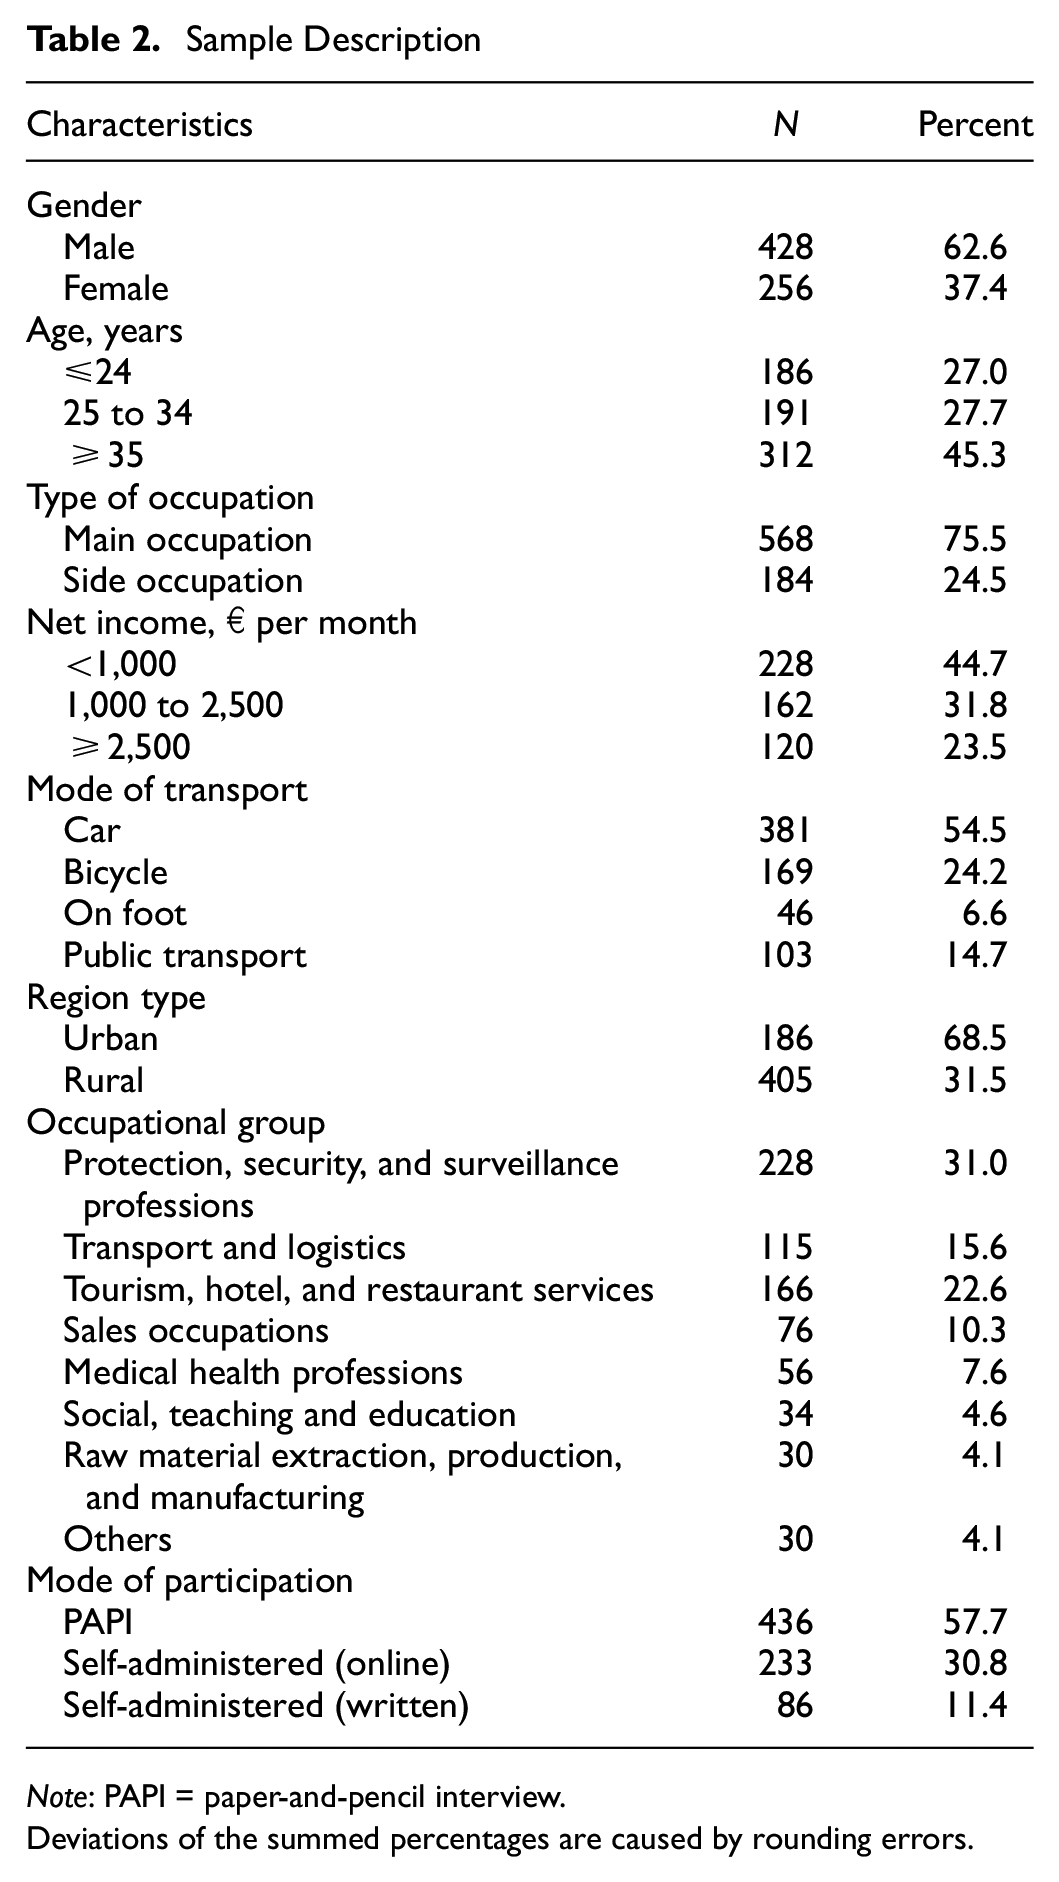
Note: PAPI = paper-and-pencil interview.
Deviations of the summed percentages are caused by rounding errors.
Analytical Approach
The data analysis performed was divided into a descriptive and a model-based section. The descriptive section of the study first analyzed the distribution of time use during commuting. To compare how time use differed between daytime and nighttime commuting, it was first checked whether the reported activity,
The author acknowledges that the method used here has specific limitations; however, as the survey only recorded whether the activities or trip chains were carried out on the outward or return trip, and not whether this was during the day or at night, this approach was the only way to compare the two periods of the day in a meaningful way.
The model-based section aimed to determine the probability of forming a trip chain under different conditions. As the formation of trip chains is based on a choice (e.g., forming a trip chain versus not forming a trip chain), various logit models are used for modeling. These models estimate the probability of an outcome from a certain set,
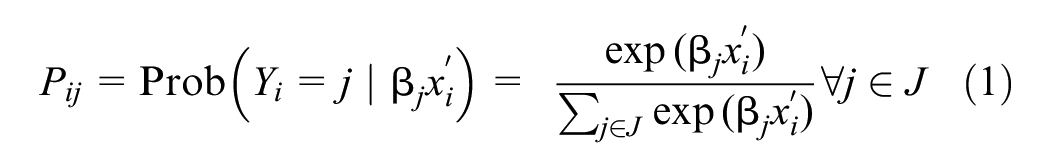
where
In this analysis, two sets of choice alternatives were examined. The first set included two alternatives: forming a trip chain and not forming a trip chain. As errands and leisure activities are among the main reasons for making an intermediate stop during a commute ( 53 ), the second set included the following alternatives: forming a trip chain for errands, for leisure, for both errands and leisure, for other purposes, and not forming a trip chain. In total, four binary and two multinomial logit models were fitted. Half of them examined the formation of trip chains on the outward trip, whereas the other half examined the formation of trip chains on the return trip. The logit models were estimated using the maximum likelihood method. Statistical analysis was performed using SPSS.
As gender, age, region type, type of occupation, mode of transport, and travel time all play pivotal roles in influencing the decision to form a trip chain, these factors were incorporated into the models as explanatory variables. Additional analyses were conducted on respondents’ monthly net income. However, owing to the lack of significance and the high number of missing values for this variable, it was ultimately removed from the final models. The influence of the night was measured in two ways: once using a dummy variable that separated the night period (10:00 p.m. to 5:59 a.m.) from the day period, and once using a categorical variable that divided the night into further periods of 10:00 to 11:59 p.m., midnight to 3:59 a.m., and 4:00 to 5:59 a.m. In this way, it was possible to precisely record and analyze the influence of different time intervals within the night on the decision to form a trip chain. The fit of the models was estimated using Nagelkerke’s pseudo-R2.
When modeling, it should be noted that the above function represents only one aspect within the trip chain, namely whether a trip chain was formed during the survey week and, if so, for what purpose. Therefore, it does not capture the actual number of stops within the trip chain. To model the entire trip chain holistically, it would be necessary to apply the model to each individual decision in the chain and multiply the probabilities for each of these decisions together to determine the probability for the entire trip chain. However, as the available database did not allow for such a detailed approach, the analysis method described was used, which nevertheless represents a reasonable, qualified, and satisfactory approach.
Results and Interpretation
Travel Time Use
Out of 704 people who completed the questions on use of travel time, 95% reported that they regularly use their time spent commuting for activities. Most of these people do not limit themselves to one activity but engage in several activities at the same time or staggered over a period of time. For example, some people look at the landscape while talking on the phone or use the commute time on one day to work and to read on another. Overall, almost 80% of respondents carried out two or more activities while commuting during the week of the survey. This result is in line with the research findings of Zhang and Timmermans (83% [ 54 ]) and Tang et al. (84% [ 33 ]), though these studies only investigated public transport users. Comparing the number of activities performed between day and night commutes, it becomes apparent that the variation in activities was significantly higher during the day than at night. Although more than 73% of respondents performed two or more activities during the day, only about 66% did so at night (Figure 1). Possible reasons for this decrease at night could be the darkness, which can make it difficult to perform certain activities that require good vision (e.g., reading), or that people tend to be more tired at night and therefore use their commute to relax rather than to perform several potentially demanding activities (e.g., working or phoning).
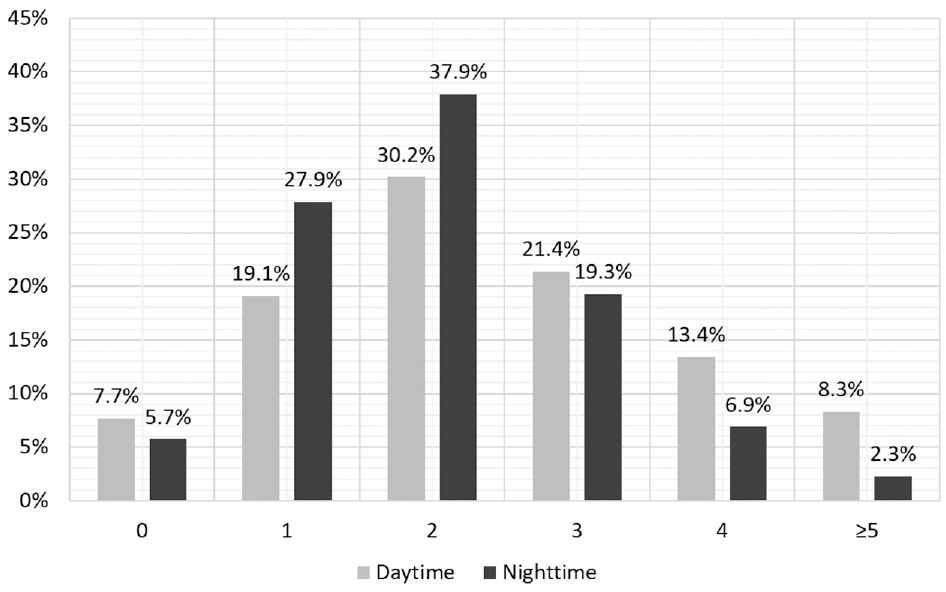
Distribution of activities (%) performed during daytime commute (n = 613) and nighttime commute (n = 348).
The most common activities while commuting were listening to something or thinking about something (Figure 2). Almost 83% of day commuters and almost 77% of night commuters spent their travel time listening to music, podcasts, or the like. Around 63% of commuters reported thinking about something, with almost no difference between whether the commute was made during the day or at night. In relation to using social media (around 21%) and talking to somebody (around 15%), the time of day also had little effect on the frequency with which these activities were carried out.
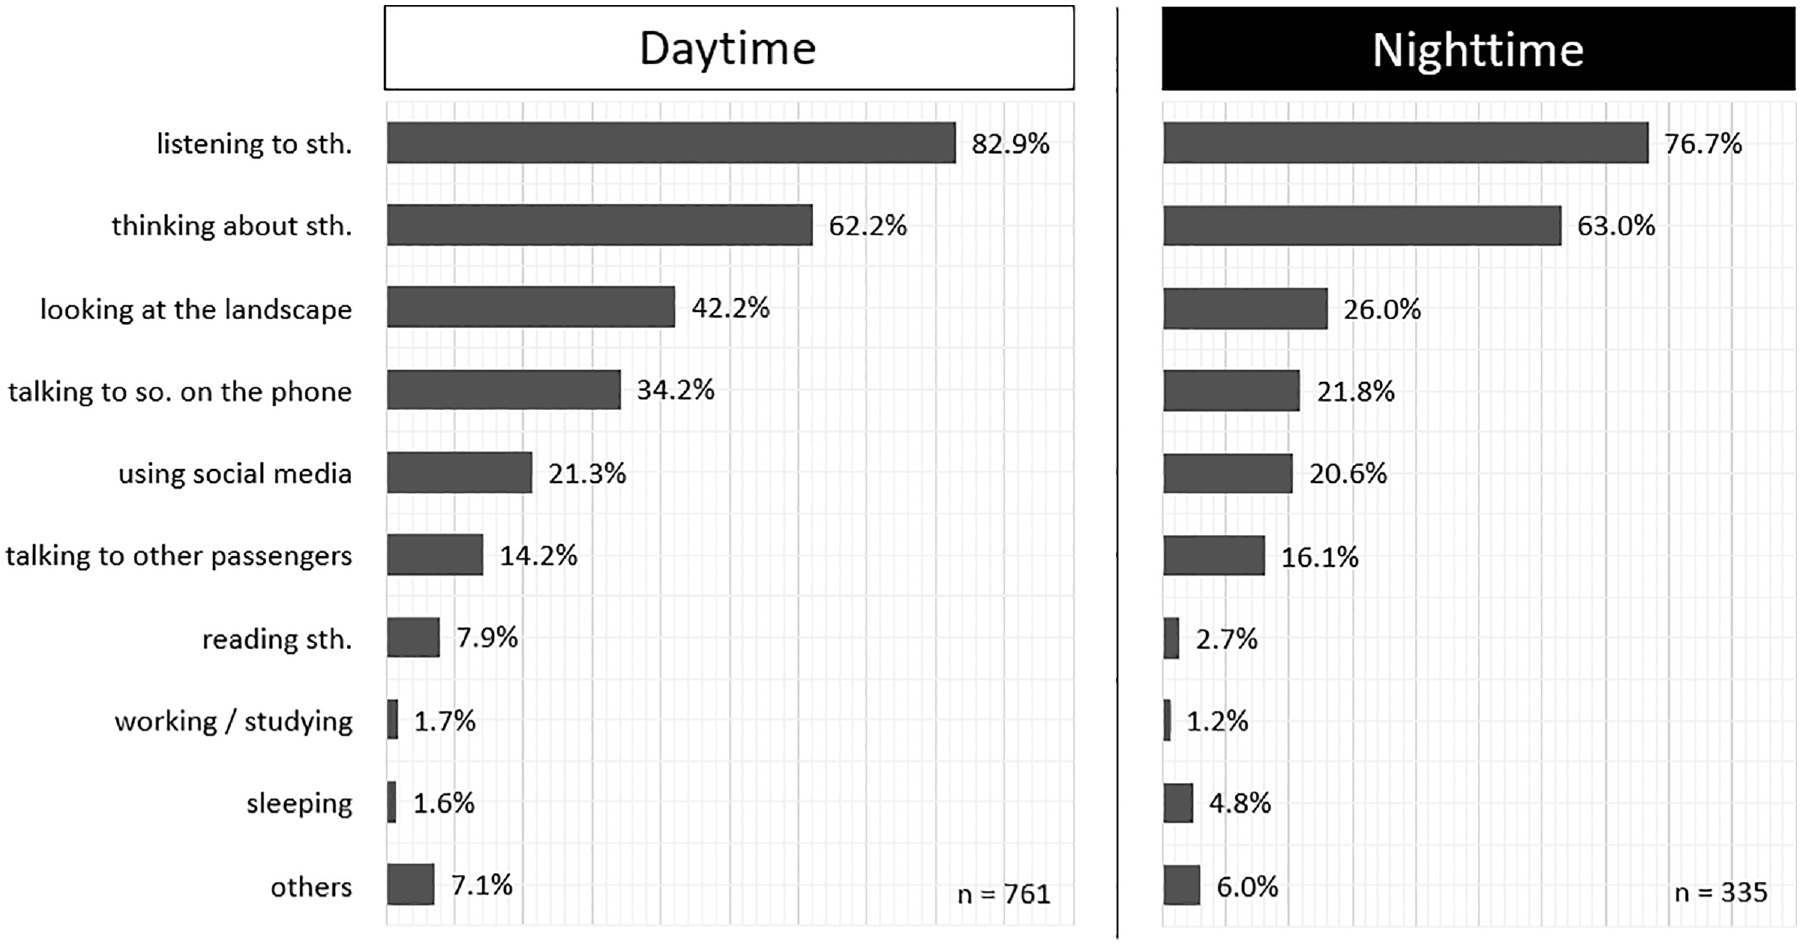
Distribution of activities carried out by commuters during the daytime and nighttime commute.
Interestingly, only around 1% to 2% of commuters used their commute for work or study. This was significantly lower than in comparable studies (e.g., Lyons et al. [ 3 ], Gripsrud and Hjorthol [ 4 ], Tang et al. [ 33 ], Wang and Loo [ 34 ], and Ettema and Verschuren [ 37 ]). The reasons for this were essentially twofold. Firstly, most of the aforementioned studies only considered people traveling by public transport, whereas the present study included all modes of transport in the analysis. As traveling by public transport does not require active participation in traffic, it is much more suitable for work than, for example, traveling by car, which is the main mode of transport for nighttime commuting ( 31 ). Secondly, the occupational activities that most night commuters performed are not suitable to be carried out during the commute, for example, specialized equipment or locations are required (see Table 2).
Clear differences between day and night can be seen in the activities of sleeping, reading, phoning and looking at the landscape. Whereas during the day about 2% of respondents occasionally used the commute to sleep, this proportion rose to almost 5% for the night commute. The difference was particularly pronounced for reading (8% versus 3%) and looking at the landscape (42% versus 26%). Both of these activities depend on good lighting, which is naturally much worse at night than during the day.
Trip Chaining
Overall, trip chaining was quite common: 54% of all respondents had formed a trip chain in their previous working week with at least one intermediate stop during their commute. Table 3 shows the percentage of all work trips with at least one intermediate stop, broken down by outward- and return trips as well as by daytime- and nighttime trips. This comparison indicated that the return trip was much more likely to be used for trip chaining than the trip to work, a result which is consistent with the literature (e.g., Yang et al. [ 25 ] and Ma et al. [ 29 ]). What is new is the finding that trip chaining was much less common on nighttime commutes than on daytime commutes. Whereas almost 42% of all commuters formed a trip chain during their daytime commutes, only around a quarter did so during their nighttime commutes.
Percentage of Trips with at least One Intermediate Stop, Broken Down by Outward Trips and Return Trips as well as by Daytime Trips and Nighttime Trips
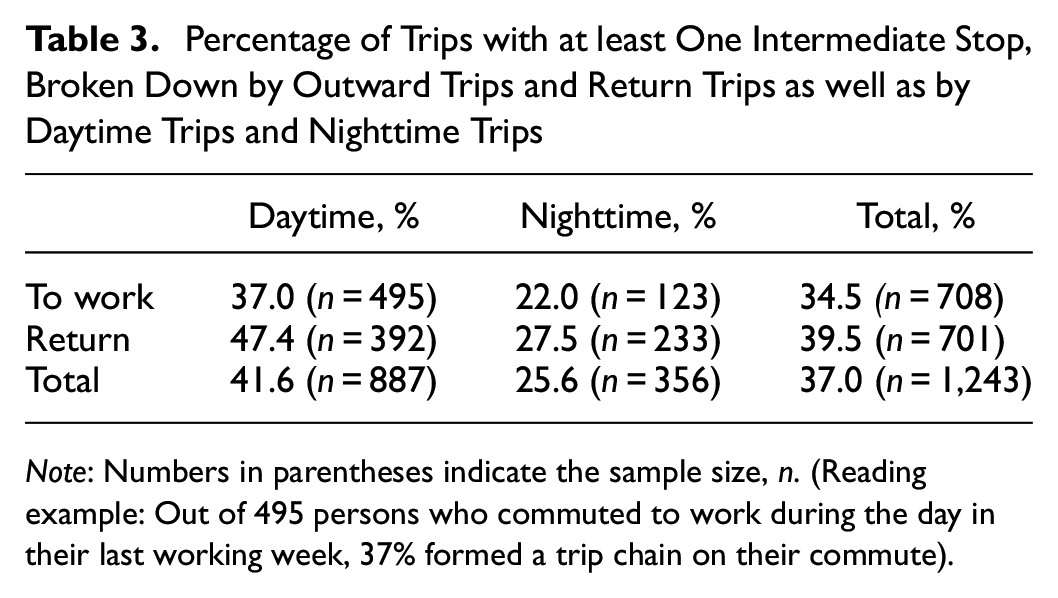
Note: Numbers in parentheses indicate the sample size, n. (Reading example: Out of 495 persons who commuted to work during the day in their last working week, 37% formed a trip chain on their commute).
Clear differences between day and night were also noted with respect to the purpose of the stops. Figure 3 shows the percentage of commuters who formed a trip chain for a specific purpose, separated into daytime and nighttime commutes. The results indicated that daytime trip chains were formed primarily for errands and shopping, whereas nighttime trip chains were formed primarily for social and recreational purposes. The differences were particularly pronounced for the purposes of shopping, meeting friends and/or family, and going to a bar/drinking/dining. For example, 68% of all commuters who formed a trip chain during their daytime commute did so for the purpose of shopping. For commuters who formed a trip chain during their nighttime commute, this only applied to around 39%. On the other hand, only about 2% made a stop during their daytime commute to go to a bar/drinking/dining, whereas 22% did so at night.
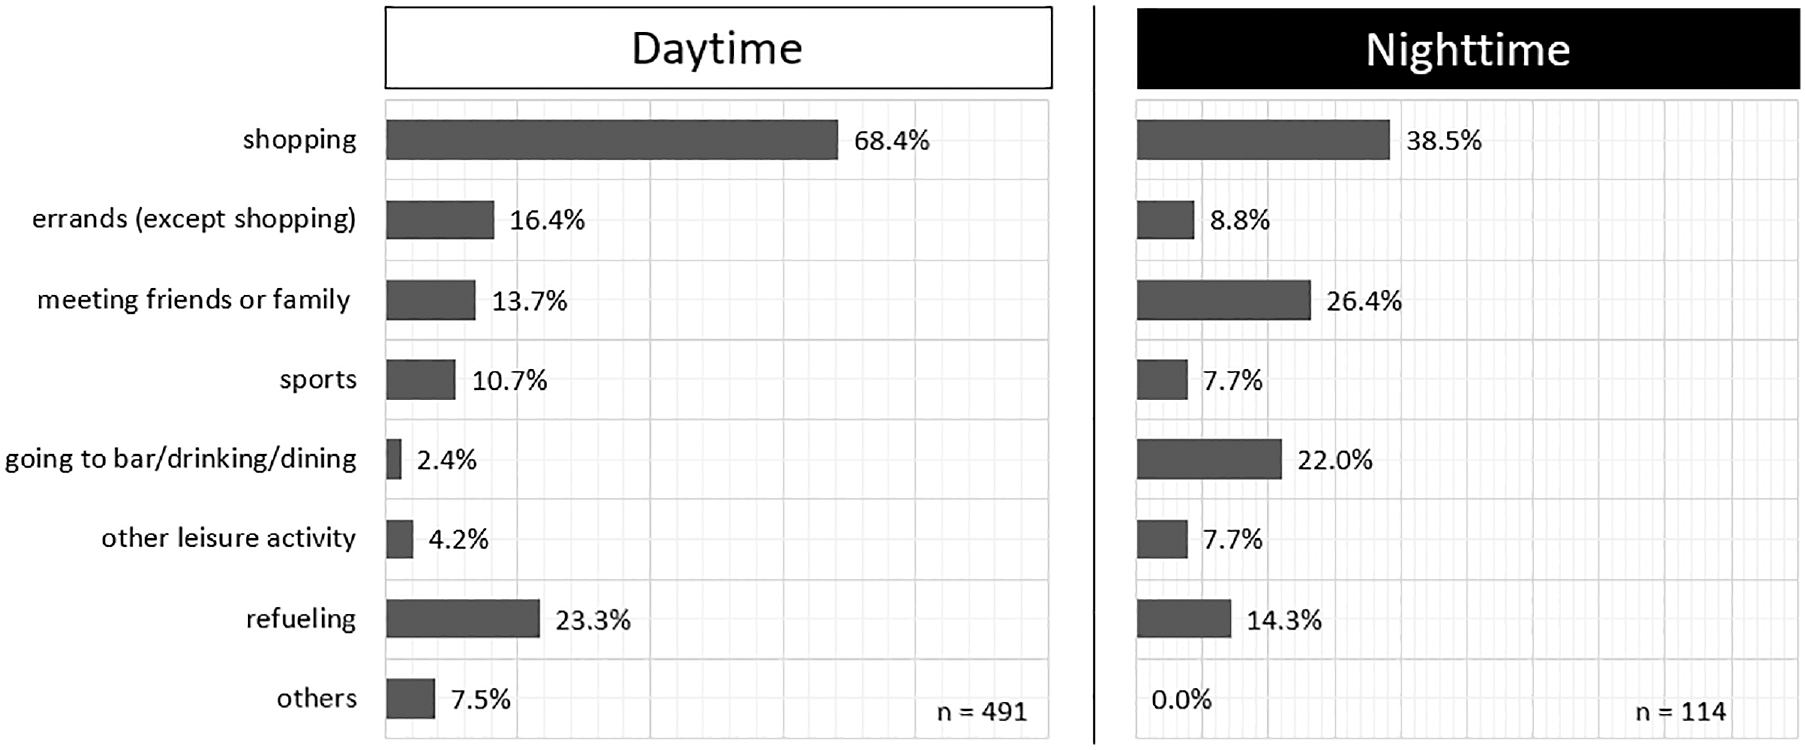
Percentage of commuters who formed a trip chain for a specific purpose, split into daytime and nighttime commutes. (Reading example: 68.4% of all commuters who formed a trip chain on their daytime commute during their last working week did so for the purpose of shopping).
Table 4 presents the results of the binary logit models, and Table 5 presents the results of the MNL models. Although the model fit was good to very good for the MNL models with pseudo R2 values of 0.202 and 0.254, the values between 0.101 and 0.139 for the binary logit models indicated a rather poor model fit ( 55 ). Nevertheless, all binary logit models—except for Model 3—passed the Hosmer–Lemeshow tests ( 56 ) and thus showed good performance. The average hit rates of correctly predicted cases ranged from 66.6% for Model 1 to 61.3% for Model 6.
Estimated Effects on the Formation of Trip Chains a
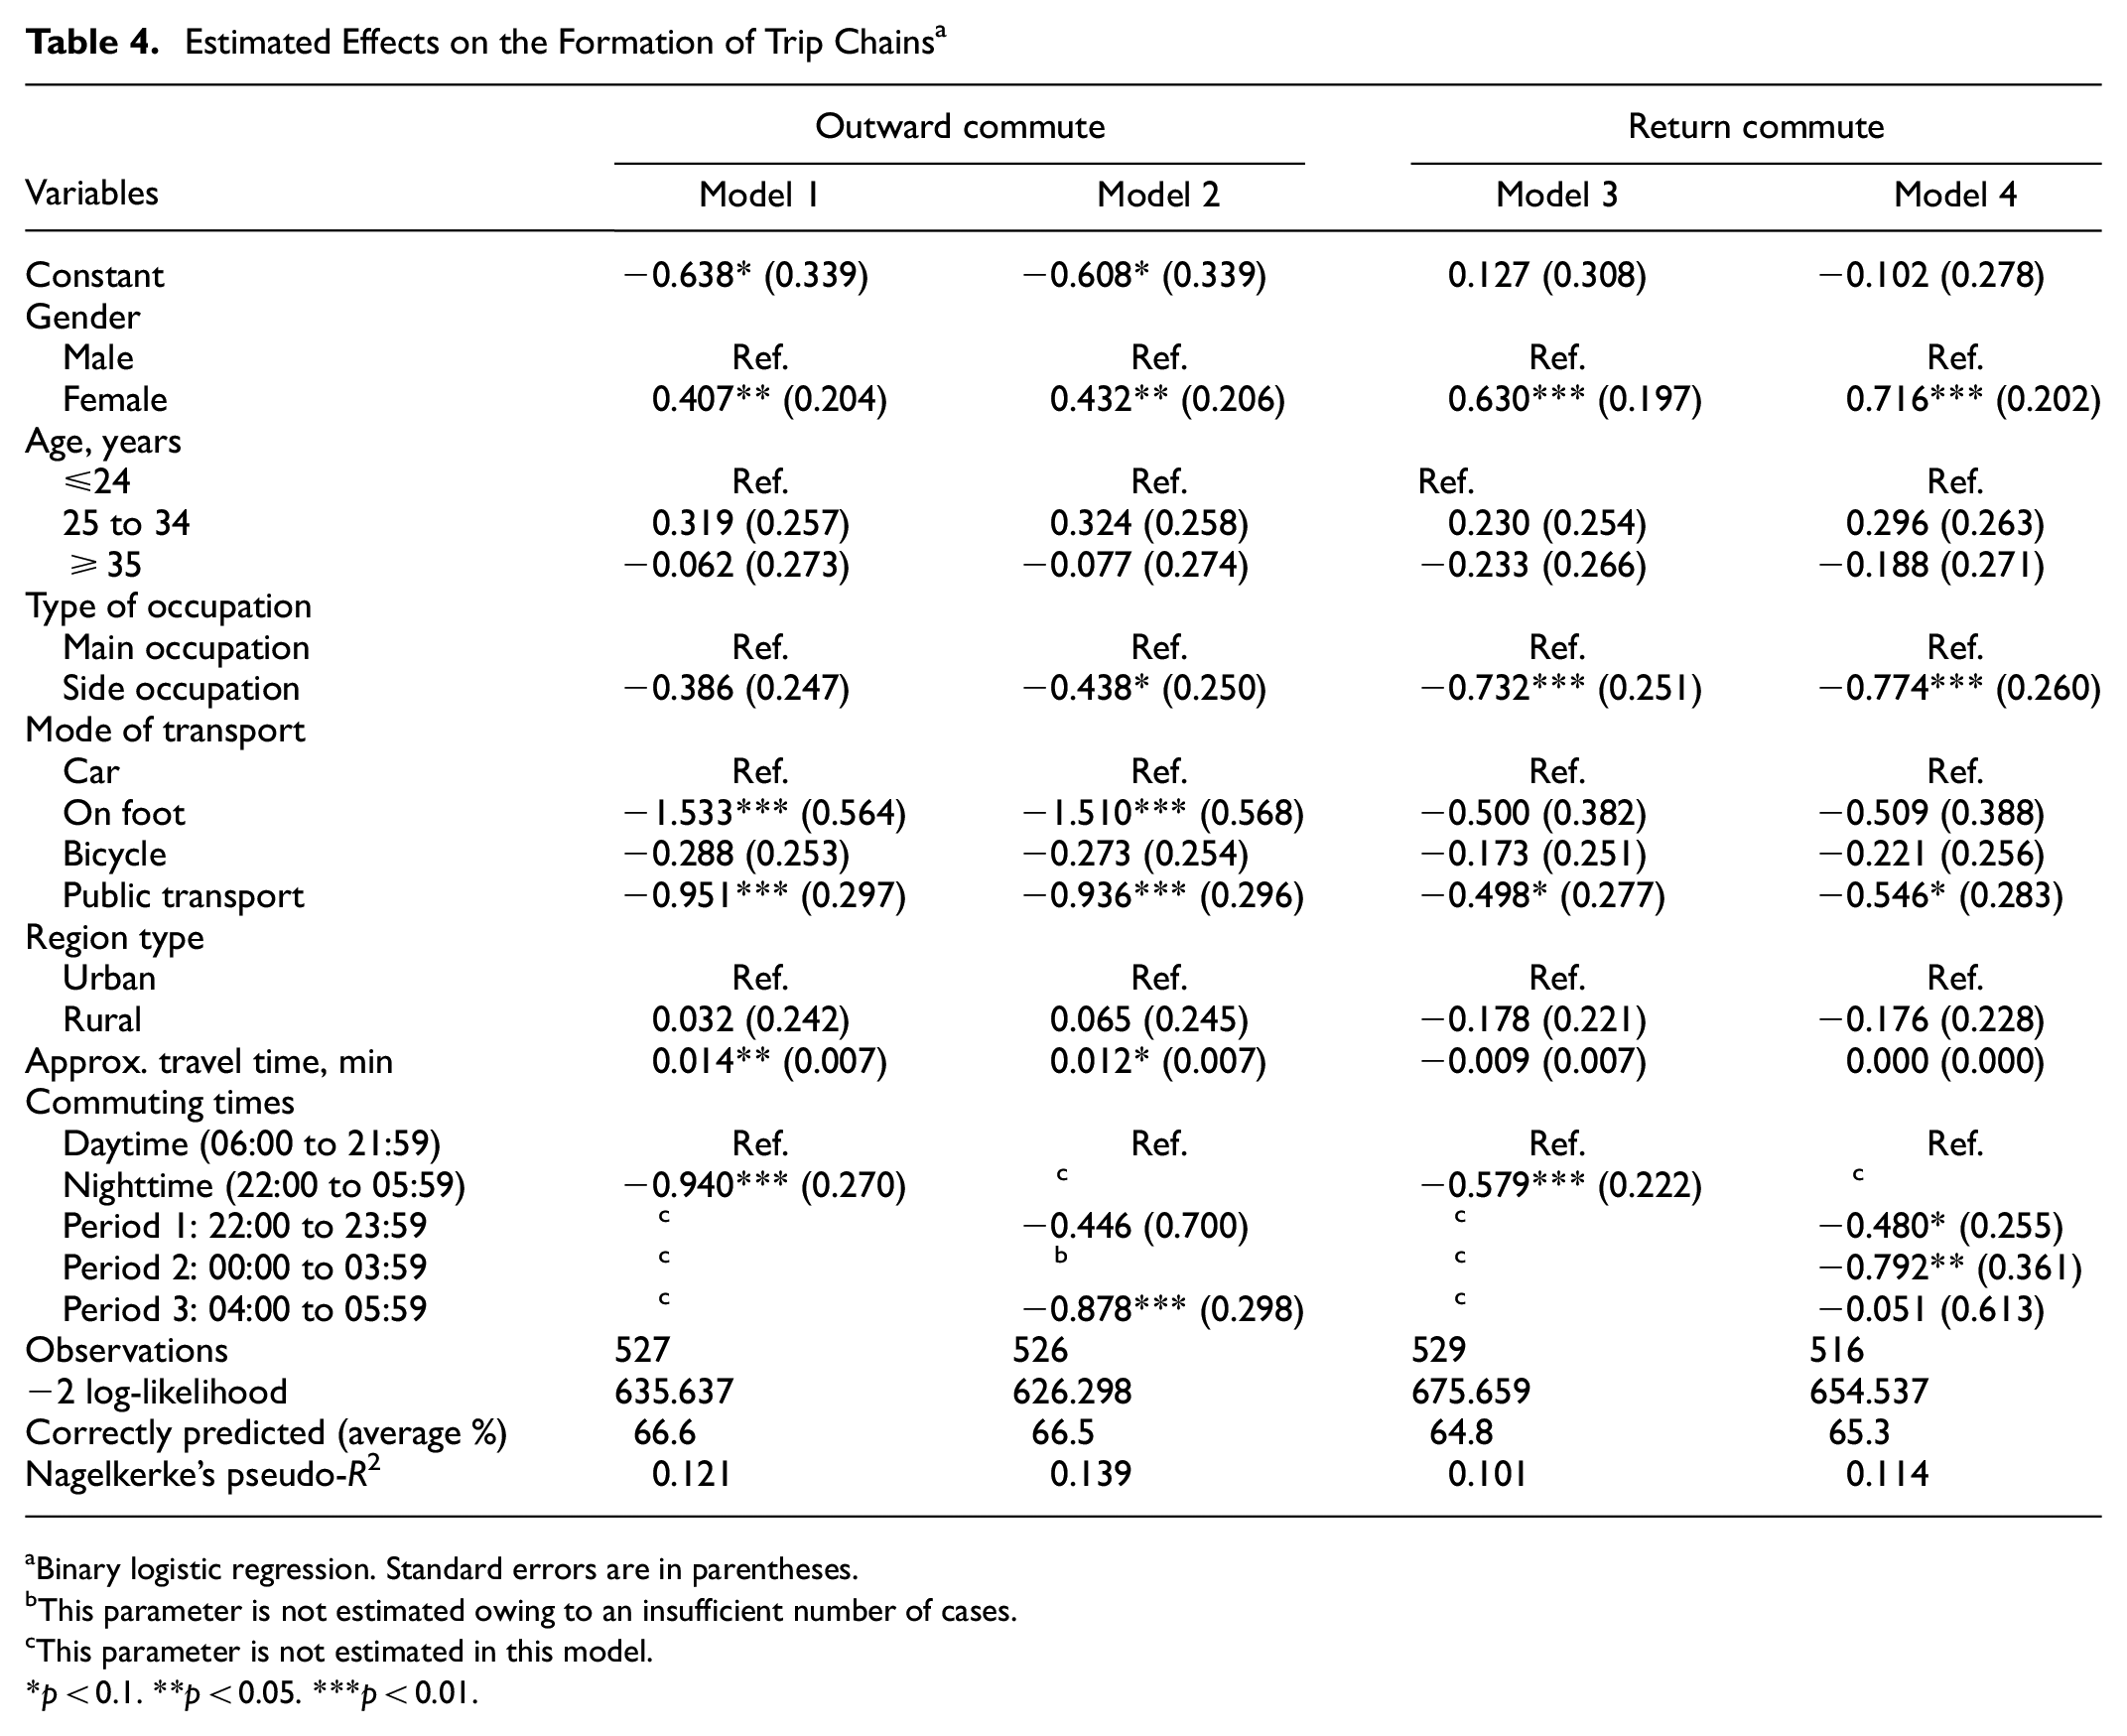
Binary logistic regression. Standard errors are in parentheses.
This parameter is not estimated owing to an insufficient number of cases.cThis parameter is not estimated in this model.
p < 0.1. **p < 0.05. ***p < 0.01.
Estimated Effects on the Formation of Trip Chains during the Outward and Return Commute by Purpose a
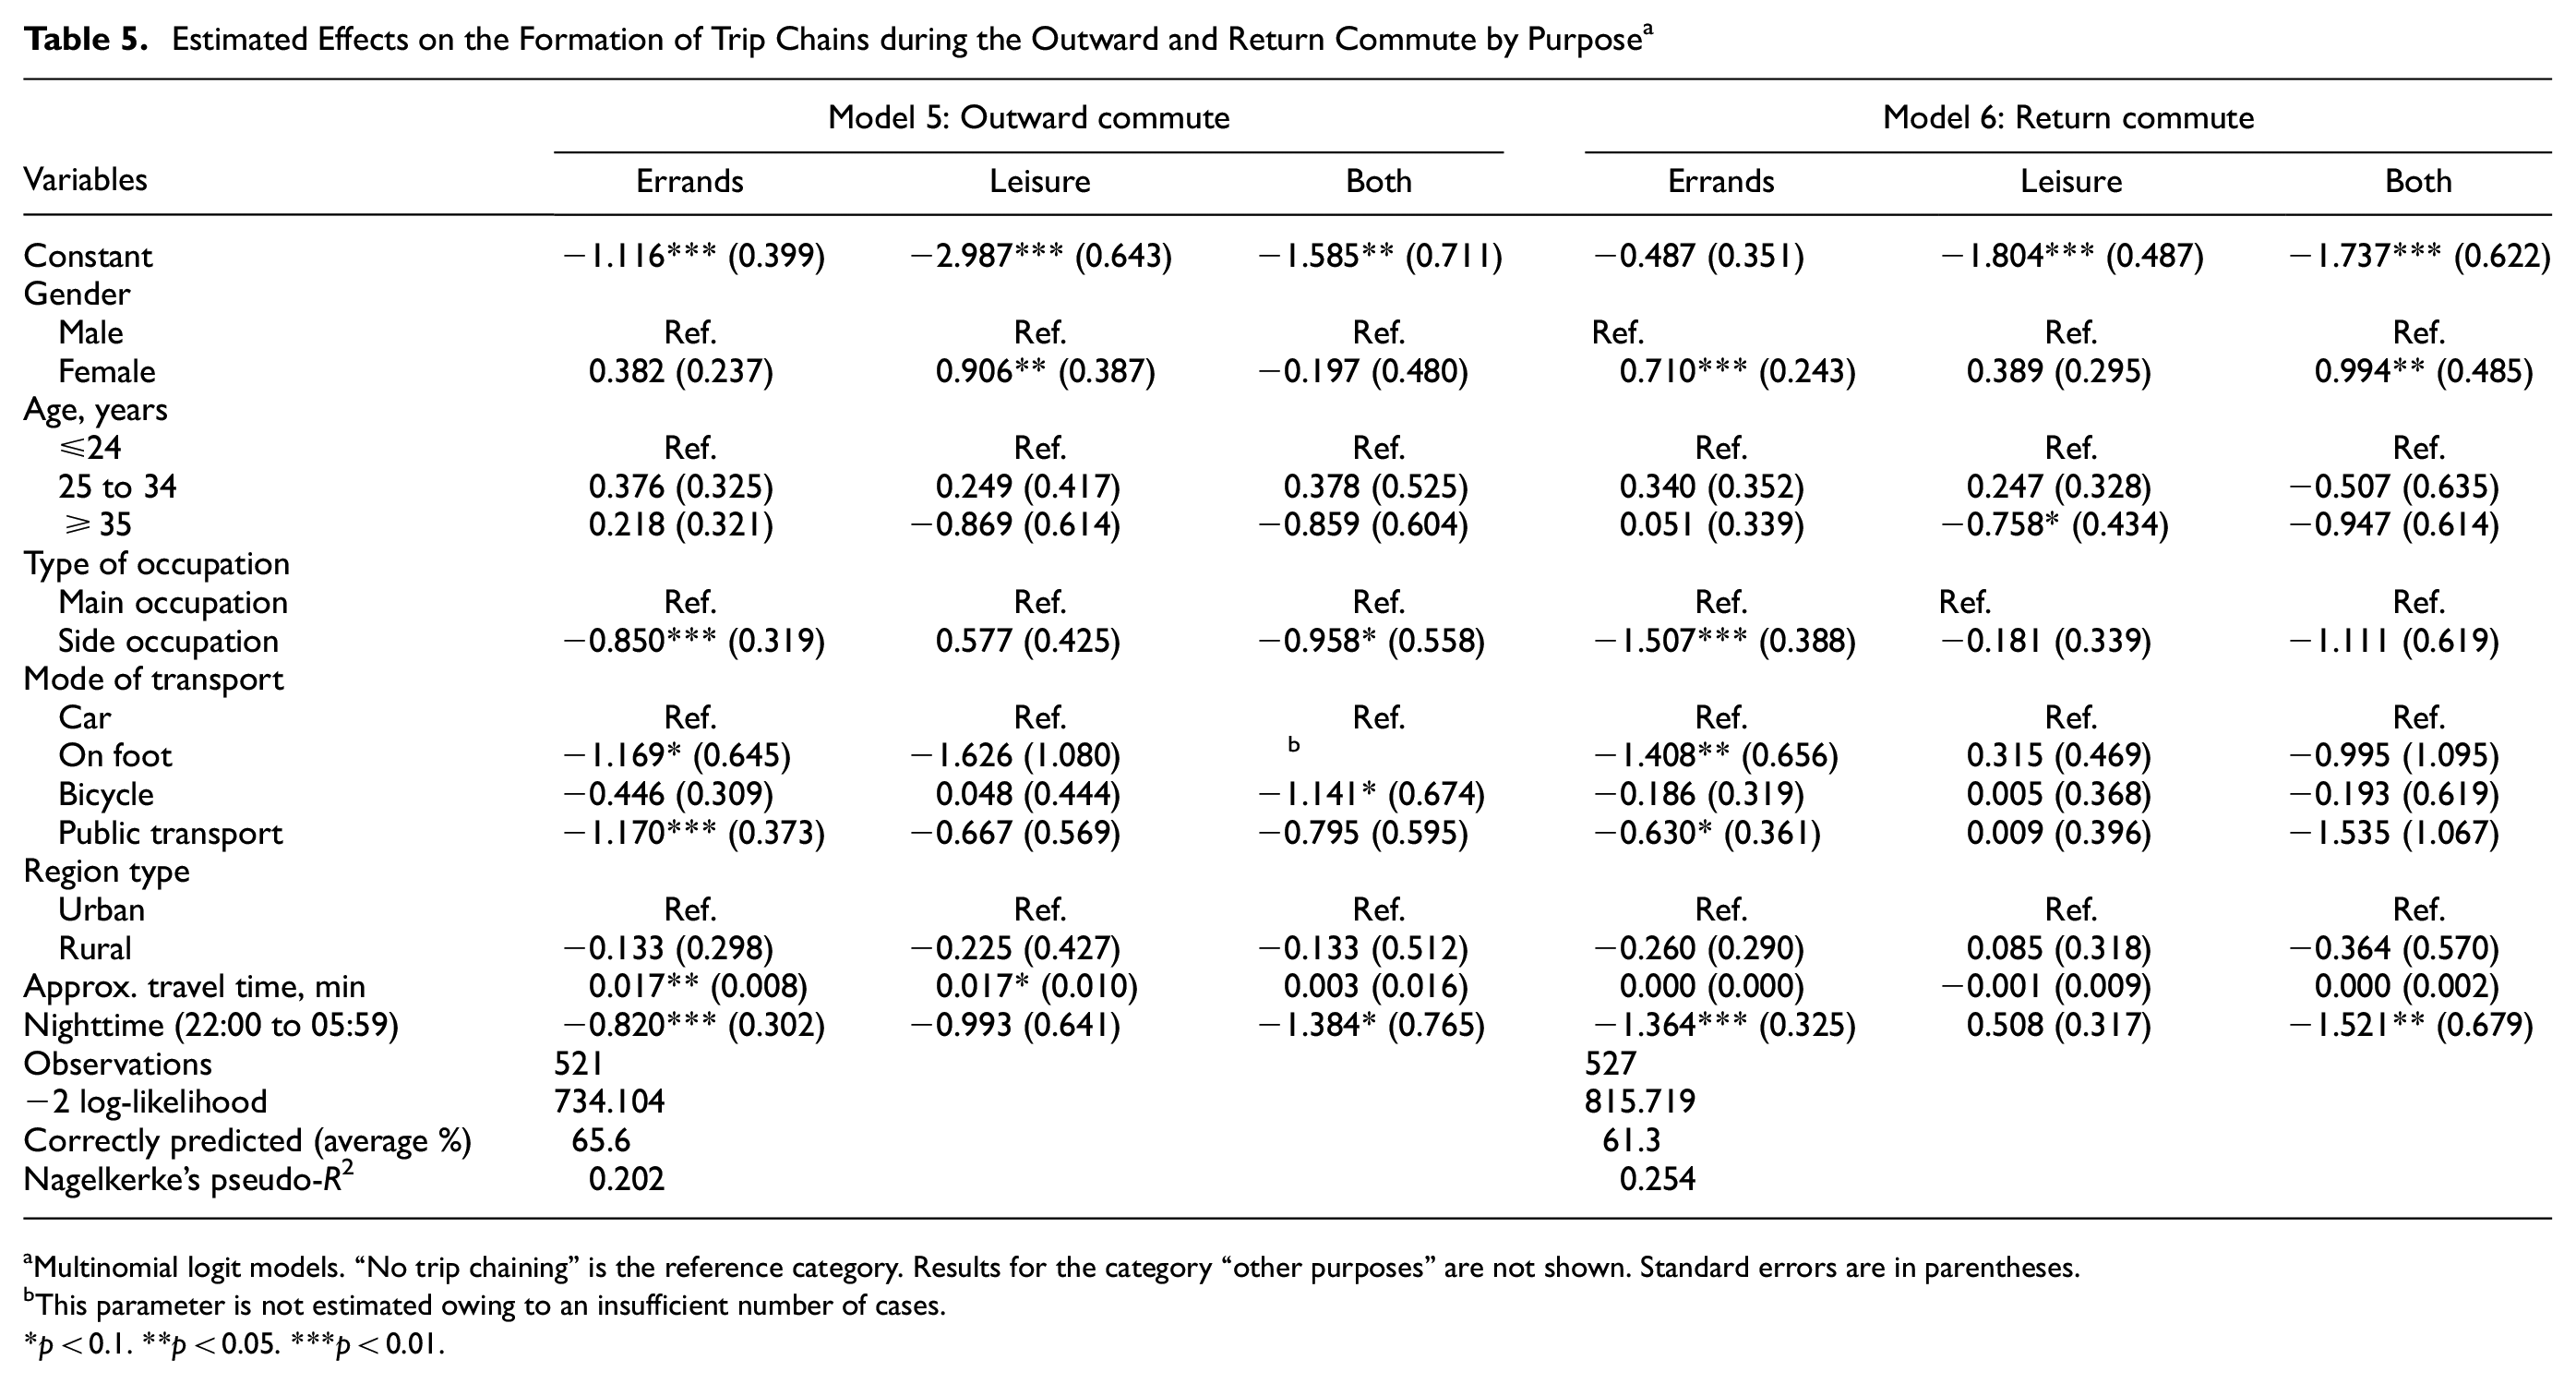
Multinomial logit models. “No trip chaining” is the reference category. Results for the category “other purposes” are not shown. Standard errors are in parentheses.
This parameter is not estimated owing to an insufficient number of cases.
p < 0.1. **p < 0.05. ***p < 0.01.
Taken together, the results indicated significant effects for gender, type of occupation, mode of transport, travel time, and time of day. However, these effects varied widely depending on the conditions considered by the respective models. With regard to gender the results confirmed the literature and indicated that women were more likely than men to form trip chains, regardless of whether it was an outward or return commute. Interestingly, the results from the MNL models showed that this effect was significant only for leisure-related stops on outward commutes and only for errand-related stops on return commutes.
With regard to the mode of transport, the models results for both the outward and the return commute indicated that the use of public transport significantly reduced the probability of trip chaining. Furthermore, the results of Models 1 and 2 indicated that walking significantly reduced the probability of trip chaining on the way to work. However, Models 3 and 4 failed to confirm this result for the return trip. Possible reasons for this discrepancy could be the poor predictive power of Model 3, or that pedestrians are actually more inclined to form trip chains on the return trip, as the time pressure to reach their destination is probably lower than on the outward trip and, therefore, there is more room for additional stops. The results of the MNL models showed that both walking and using public transport reduced the probability of forming trip chains for both the outward and return commutes, but only if the trip chain was formed for the purpose of errands.
With regard to time of day, the results of both the binary- and MNL models indicated that commuting at night significantly reduced the probability of trip chaining. Specifically, this was evident for the outward trip, especially between 4:00 and 5:59 a.m., and for the return trip between 10:00 p.m. and 04:00 a.m. (cf. Model 2, Model 4, and Table A3 in the Appendix). Consequently, the present results not only confirmed the findings of Guan et al. that early morning and late evening commutes are less likely to include additional stops than daytime commutes ( 14 ), but also extended this observation to the entire nighttime period. With regard to the purpose of the trip chaining, it can be observed that the nighttime mainly influenced the formation of trip chains for errands. A significant impact on the formation of trip chains for leisure purposes was not apparent.
The reasons why trip chains are less likely to be formed at night than during the day can be manifold. Certainly, the opening hours of shops, service providers, or public facilities play a role. Although most of these businesses are open and offer their services almost continuously during the day, they are almost always closed at night. As a result, the number of possible stops on night commutes is reduced, which in turn reduces the probability of trip chaining.
Further reasons why fewer trip chains are formed at night than during the day could be safety concerns, limited transport options, or lower motivation because of fatigue. In addition, night commuters often followed a different daily rhythm to that of their social environment ( 57 , 58 ). Their very late or early commutes and atypical working hours often clashed with the schedules of friends and family, thus making it much more difficult to coordinate and organize a social gathering before or after work. As a result, the number of trip chains at night was reduced.
Conclusion and Discussion
Taken together, the results indicate that the time of day has a significant influence on both the formation of trip chains and the use of commuting time. Whereas during the day a wide variety of activities were carried out during the commute, this was reduced during the night. In particular, darkness and the associated low level of human activity meant that activities such as working, telephoning, looking at the landscape, or reading were carried out much less frequently during night commutes than during day commutes. There were also clear differences between day and night in the formation of trip chains. One of the key findings in this respect was that, in general, fewer trip chains were formed at night than during the day. However, when trip chains were formed, it was mainly for leisure purposes such as meeting friends and family or going out, rather than for errands such as shopping or refueling.
Based on these results, two main conclusions can be drawn. Firstly, the differing results between day and night with regard to the formation of trip chains and the use of travel times illustrate the need for a differentiated analysis of mobility behavior depending on the time of day. For future research, it will be important to integrate temporal factors more comprehensively into the analyses, to further improve the validity of the model calculations as well as to more completely investigate and better understand the causes of these diurnal differences. Secondly, the significantly lower occurrence of trip chains at night, especially for errands, underlines the key logistical challenges faced by night commuters. Whereas the daytime commute can usually be used in a (time) efficient manner, for example, making additional stops for errands or appointments, this option is usually not available to night commuters because of limited opening hours and reduced service availability. As a result, they are forced to postpone necessary errands to other times and accept additional journeys. This limits night commuters’ time resources and reduces their flexibility. In this case, it is up to employers to offer more flexible working time models, and urban planners or service providers to offer increased digital solutions. Examples of this could include digital consultations with doctors, more online services from public authorities, a growing number of automated smart stores, or the possibility of preordering goods on the internet and then collecting them from special (e.g., refrigerated) parcel or pick-up stations. The results of the present study represent a first step in this direction and clearly identify the crucial importance of taking more account of temporal factors, and in particular, the importance of extending the field of research to include the nighttime period.
Further research on specific aspects that could not be fully explored in the present study is also necessary, for example, extending the model approaches to include further explanatory variables. As can be seen from the literature, aspects such as household size, children in the household, or access to public transport are important factors that influence the formation of trip chains. However, owing to a lack of information, these variables could not be included in the models of the present study. Inclusion of these factors in future models will significantly improve their quality and therefore strengthen their predictive power. In addition, extending the analysis to other models such as the nested- or the mixed logit model would provide further refinement and significance to the findings. It is also necessary to extend the investigations to other spatial units. As this study’s data were limited to the Karlsruhe area, the results can only be transferred to other regions to a limited extent owing to possible differences in demographic, social, and infrastructural conditions.
Furthermore, the author considers it important to critically reflect on the database used and to point out possible areas for improvement. First of all, it should be noted that, as mentioned, the sample is most likely characterized by an overrepresentation of students. As students tend to have different characteristics and behaviors from the general population with regard to demographic status, economic situation, and daily rhythm, a bias in the results cannot be completely ruled out. To assess the extent of this bias and the reliability of the results, an additional calculation was made using a data set adjusted for the proportion of students. Comparing the estimates from these model calculations with those from the full models showed that the directions of the effects were consistent and the significances remained almost constant (see Tables A1 and A2 in the Appendix). This suggests that the overrepresentation of students in the sample is unlikely to have had a major impact on the conclusions drawn from the models. Nevertheless, to improve the validity of the results, it is recommended that future studies expand the database both quantitatively and in relation to the cross section of the population.
In addition, it should be borne in mind that both survey phases took place during the COVID-19 pandemic. Although there were hardly any restrictions within the study area during the first survey phase, especially at the beginning of the second phase, life in Karlsruhe was characterized by strict measures to contain the pandemic. Therefore, potential biases have to be taken into account, especially with regard to the formation of trip chains for leisure purposes. It can be assumed that both the fear of infection that was prevalent at that time and the prevailing measures to contain the pandemic, such as the closure of clubs and discos, as well as the social distancing guidelines in various public areas, especially in the hospitality sector, contributed to a reduction in the number of leisure trip chains compared with the prepandemic period. Moreover, consideration should be given to a possible change in mode of transport and its implications. In particular, the use of public transport was widely discussed as presenting an increased risk of infection. Individuals who used public transport for commuting in the prepandemic era may have been influenced by this discourse and consequently changed their mode of transport in favor of alternatives such as driving, walking, or cycling. As a change in mode of transport leads to a change in the organization of the commute, it can be assumed that individuals who changed their mode of transport as a consequence of the pandemic situation may also have adjusted their activities during the commute as well as their behavior in forming trip chains. By using a more recent data set from the postpandemic period, this bias could be corrected, thus improving the knowledge gained.
In summary, this paper makes an important contribution to ongoing research on trip chaining and time use in commuting. The findings contribute to a more in-depth understanding of the complex relationships between commuting behavior, time management, and everyday activities. In future studies, it will be important to address the criticisms identified, to further increase the validity and applicability of the findings and to advance research in this area. In particular, a stronger focus on the temporal dimension may help to provide a more comprehensive understanding of future commuting behavior and provide possible stimuli for the development of innovative and efficient mobility strategies.
Supplemental Material
sj-pdf-1-trr-10.1177_03611981241265843 – Supplemental material for Time Matters: Analyzing the Impact of Nighttime on Commuter Trip Chaining Behavior and Travel Time Use in Karlsruhe, Germany
Supplemental material, sj-pdf-1-trr-10.1177_03611981241265843 for Time Matters: Analyzing the Impact of Nighttime on Commuter Trip Chaining Behavior and Travel Time Use in Karlsruhe, Germany by Jonas Kapitza in Transportation Research Record
Footnotes
Acknowledgements
The author would like to thank Prof. Dr. Caroline Kramer and Dr. Thomas Wieland of the Karlsruhe Institute of Technology (KIT) for their assistance in preparing the paper and Jeff Burrowes of the Martin-Luther University Halle-Wittenberg for proofreading the submitted version.
Author Contributions
The author confirms sole responsibility for the following: study conception and design, data collection, analysis and interpretation of results, and manuscript preparation.
Declaration of Conflicting Interests
The author declared no potential conflicts of interest with respect to the research, authorship, and/or publication of this article.
Funding
The author received no financial support for the research, authorship, and/or publication of this article.
Supplemental Material
Supplemental material for this article is available online.
References
Supplementary Material
Please find the following supplemental material available below.
For Open Access articles published under a Creative Commons License, all supplemental material carries the same license as the article it is associated with.
For non-Open Access articles published, all supplemental material carries a non-exclusive license, and permission requests for re-use of supplemental material or any part of supplemental material shall be sent directly to the copyright owner as specified in the copyright notice associated with the article.