
Abstract
The goal of this research is to support prioritizing safety on the Muni system from a gender equity lens. This work is specifically aimed to inform the Safety Equity Initiative of the San Francisco Municipal Transportation Agency (SFMTA). Using a mixed-method approach, we surveyed Muni transit riders (n = 1,613) to explore their travel behaviors, experiences with gender-based harassment, and perceptions of safety while riding Muni. We find that the pervasiveness of gender-based harassment on the Muni public transit system is significant, with 67% of our sample reporting that they have experienced harassment in the last six months. Perceptions of safety are also quite low, with 68% always or often feeling safe while riding Muni during the daytime and only 32% feeling safe at nighttime. We found that certain populations are disproportionately victimized while riding transit with statistically significant differences across both perception of safety and experiences of harassment between women versus men, gender minorities versus cis gender people, transit dependent riders versus those who have access to a private vehicle, and white versus non-white riders. Based on these findings we provide transformative recommendations to address the high rates of harassment among certain groups of Muni riders. The recommendations are organized into three categories: service changes, infrastructure improvements, and campaigns and advocacy. This work adds to the existing knowledge about gender-based harassment in the transit environment while also specifically informing the Safety Equity Initiative of the SFMTA.
Sexual harassment, which disproportionately affects women and gender minorities, causes transit riders to feel unsafe while walking to, waiting for, and using public transportation. These feelings and experiences of unsafe conditions influence riders’ travel behavior and comfort while using transit. Harassment and safety issues on transit can cause women and gender-expansive people, who don’t conform to traditional gender roles, to shift their travel behavior by traveling at different times of day, choosing longer routes where they feel safer, or using rideshares or private vehicles when they can afford to do so ( 1 ). Women and gender minorities are often the victims of sexual harassment and reluctant or unaware of how to report these incidents. This underreporting of safety incidents leads to continuous fear of sexual harassment and, in turn, limits mobility for specific population segments, particularly those dependent on transit.
This research presents findings from a survey that gathered data from riders of the San Francisco Municipal Transportation Agency’s (SFMTA’s) Muni system about their perceptions of safety and experiences of harassment on Muni. As part of the SFMTA’s Safety Equity Initiative, which launched in August 2022, the SFMTA supported this research to better understand Muni riders’ experiences and develop safety recommendations, tools, and policies aimed at preventing harassment and assault on Muni. As of 2022, only 42% of Muni riders feel safe from crime while onboard and waiting for Muni, a decline from 2019 when only 48% felt safe and secure on board and 50% felt safe at transit stops (SFMTA, 2023) (2). This research is particularly important to support the safety of those who do not have access to private vehicles and rely on Muni to get to work or school and run errands. Ensuring that transit dependent women and gender minorities feel safe is an important objective.
Literature Review
While transit crime is well studied, gender-based harassment in transit environments received little research attention until the 1980s ( 2 ). Over the years since, various scholarly studies on the topic of gender-based crimes in transit environments have been published ( 3 ). This research is playing an important role in increasing awareness about sexual harassment on public transportation systems. However, the collection of data and information about gender-based harassment on transit is limited. There are two main factors contributing to this; the underreporting of incidents by victims and crime statistics often not differentiating sexual harassment incidents as a separate category ( 3 ). Typically for research purposes, sexual harassment is categorized into three categories: verbal, non-verbal, and physical ( 3 ).
Verbal harassment refers to sexual comments, being called unwanted names, being asked for sex, sexual remarks, or obscene language, and so forth.
Non-verbal harassment refers to unwanted gestures, public masturbation, being shown pornographic images, stalking, indecent exposure, and so forth.
Physical harassment refers to unwanted kissing, being groped or touched inappropriately, rape, and so forth.
This literature review provides a review of the research on this topic to date, specifically examining research that has been done on the topic in California; perceptions of safety and rates of sexual harassment and gender-based harassment among women and gender minorities; underreporting of incidents; and suggested policies and interventions to address gender-based harassment in transit environments.
Research Conducted by California Transit Agencies on Gender-Based Harassment
To date, only a few California transit agencies have conducted research and collected data on gender-based harassment on their systems. But with the recent passage of SB 1661 in February 2022, the largest agencies in the state will now be required to document harassment incidents by “gender, sexual orientation, race, ethnicity or otherwise, and also to start developing policies to make riders feel safer” (Herson, 2022). This legislation is a key next step in addressing harassment of all kinds in transit environments and will play a large role in helping to identify targeted interventions to address gender-based harassment on transit systems across California.
In 2019, LA Metro conducted a study titled “Understanding How Women Travel,” which documented the current barriers to mobility that women face in Los Angeles to identify strategies to better meet the needs of traveling women. The report included several sections on safety and harassment. The research found that 60% of female riders feel safe on transit during the day but only 20% feel safe at night ( 1 ). Additionally, 25% of female bus riders and 33% of female rail riders reported experiencing sexual harassment in the past six months ( 1 ). Those who identified as non-binary were found to be the most likely to have been harassed while riding the bus in the past six months ( 1 ).
Interestingly, those who ride transit in Los Angeles perceive it to be safer than those who do not ride transit, and safety concerns center around harassment and personal security ( 1 ). Women also reported changing their travel behavior because of safety concerns, such as choosing different routes that are often longer, switching to more expensive modes of transportation in the evenings (often choosing to use rideshare after 8:00 or 9:00 pm), or avoiding trips altogether ( 1 ). The work notes that there are many barriers to reporting. None of the women asked knew about the Metro safety app and many said they either do not know how to report incidents or believe it is not worth the time to report them. Additionally, the report notes that the announcements about sexual harassment on the transit, buses, stops, and stations are only offered in English, creating a barrier for non-English speakers, and did not include any information on how to report sexual harassment ( 1 ).
In April 2021, Bay Area Rapid Transit (BART) launched the Not One More Girl campaign in partnership with several community-based organizations (CBOs). The campaign was largely inspired by a report titled “Together We Rise,” which was written by one of BART’s CBO partners, Alliance for Girls, and documents the lived experiences of girls (defined as cis girls, trans girls, non-binary youth, gender non-conforming youth, gender queer youth and any girl-identified youth) of color in Oakland, San Jose, and San Francisco. The report includes a section on girls and public space, which specifically talks about experiences on BART and public transit. At every listening session almost all the girls talked about everyday instances of being physically or verbally harassed as they took the bus to and from school or traveled via BART ( 4 ).
The report was shared with the BART general manager and other staff, which began the dialogue about creating an advocacy campaign as well as identifying other policy changes and actions to address the harassment of girls on the BART system ( 5 ). Since BART has taken several steps to better understand and address sexual harassment on their system, including adding a question to their Passenger Environment Survey asking if riders have experienced gender-based sexual harassment in the last six months on BART and adding a new reporting category “Unwanted sexual harassment (non-criminal)” to the BART Watch app ( 5 ).
Perceptions of Safety on Transit
Across all the literature reviewed, perceptions of safety on transit systems vary based on demographic information. Across the board, women and gender minorities are more likely to be concerned about their safety while using public transit ( 1 , 6 , 7 ). The safety concerns of women and gender minorities center around harassment and personal security ( 1 ). Additionally, Black, Indigenous and people of color (BIPOC), elderly, younger, disabled women, and LGBTQI+ people experience heightened fear for their safety while traveling via transit ( 7 , 8 ). Research suggested that the mobility of transgender and gender non-binary transit users is routinely limited by their experiences of harassment and discrimination ( 9 ). Individuals who identify as Latinx, Black, or Asian are also more likely to feel unsafe compared with those who identify as white or other ( 7 ). Black riders and unhoused women also identified feeling unsafe on transit in the presence of law enforcement ( 1 , 7 ).
There are also environmental factors that contribute to feelings of safety. A survey of students’ perceptions and experiences of safety on transit found that transit settings that are dark or desolate and have litter make them feel unsafe ( 3 ). A study focused on perceptions of unwanted sexual behavior found that women perceive low density settings to be the most unsafe but unwanted sexual behaviors (such as groping) occur with more frequency during peak times ( 10 ). The authors do note that the most serious offenses (e.g., rape) occur at quieter times ( 10 ).
Perceptions of safety have a direct effect on the way women and gender minorities travel. Another study surveying students found that fear leads 60% of female students to take some precautions during their transit trips and when riders have other travel modes available these precautions include not taking transit ( 3 ). Other research underscores that, for women and gender minorities who have the financial means to do so, fears and experiences of harassment lead them to opt for different modes of transportation that they perceive to be safer, such as private cars and rideshare ( 1 , 7 ). About one third of the female students surveyed in another study reported that for bus and rail transit, fear of sexual harassment is a significant factor preventing them from using transit ( 6 ). Gender minorities interviewed for a study of harassment and violence experienced by transgender and gender nonconforming public transit riders in Portland OR found that interviewees reported behavioral changes they have made to avoid harassment. These included not traveling on certain routes or at certain times of day, changing their gender presentation, leaving the bus or train, or traveling with friends or family ( 8 ).
Rates of Harassment on Transit
Rates of harassment vary by demographics, location (i.e., on a transit vehicle, walking to a transit stop or station, waiting for a bus or train to arrive), and type of harassment. In general, the literature shows that women, girls, and gender and sexual minorities are more likely to face sexual harassment and violence on transit. One study examining harassment experiences found that 72% of bus riders and 48% of rail riders reported experiencing sexual harassment over the last three years while using transit ( 3 ). Another study found a similar rate, reporting that 71% of respondents reported experiencing sexual harassment behavior while using the bus or rail system in Los Angeles ( 6 ). When broken down by gender, category, and location, the study found that across all categories, women experienced higher rates of harassment than men, that verbal harassment is the most common type (followed by non-verbal and lastly physical), and that harassment is most likely to occur while waiting for the bus or on transit vehicles ( 3 , 6 ). The study mentioned previously focusing on gender minorities in Portland OR found that almost all the interviewees could recall forms of harassment that they perceived to be motivated by transphobia and that five out of 20 interviewees had experienced physical violence ( 8 ). Research has also found that riders using transit three or more days per week are more likely to be victims of sexual harassment ( 3 ).
Certain land use features have been shown to influence harassment positively or negatively. For example, lack of adequate lighting has been linked to more harassment incidents ( 3 ). Different parts of the transit system also have different rates of harassment. A global study revealed that in general, rates of harassment are higher on bus systems than on rail systems ( 3 ). Additionally, verbal harassment is more likely to occur while riders are walking to or waiting for transit, and physical harassment is more likely to occur while on transit vehicles ( 3 , 6 ).
Underreporting
One of the main challenges in addressing gender-based harassment on public transit is the lack of data about where, when, and how frequently harassment incidents are occurring on transit systems. This is because few agencies include questions about sexual harassment in passenger surveys, but it is also in part a result of underreporting of harassment incidents. A survey in New York City found that while 63% of respondents had experienced sexual harassment on transit, 96% did not report it to the New York Police Department or the Metropolitan Transportation Association (Stringer, 2007) (12). A global study on the topic found that in 17 of the 18 cities surveyed, more than half the victims of sexual harassment chose not to report the incident; in some cities (such as Los Angeles) reporting was as low as 10% ( 11 ). Another study conducted with San Jose State University (SJSU) students found that 10% of victims did not report the harassment, and those who did mainly reported to friends and family, but less to public authorities such as police or transit operators ( 2 ).
Bystanders are also unlikely to report harassment incidents. One study examining university students in Los Angeles found that only 10% of students who observed or experienced sexual harassment on transit reported the incident ( 6 ). Research has found that when passenger density is low, bystanders are more likely to report incidents ( 3 , 10 ). Furthermore, the perceived severity of the incident affects bystanders’ likelihood of intervening, when the incident is perceived to be more serious, bystanders are more likely to report it ( 10 ). Another report found that 64% of men and 64% of women surveyed reported witnessing harassment on transit and pretending not to see it, while only 20% of women and 18% of men came forward and talked to the victim, and 14% of women and none of the men talked to the offender ( 6 ). One international study focused on university students in four different cities found that 54% to 25% depending varying on the city of those who had experienced harassment or assault reported there being at least one witness to the occurrence who did not intervene ( 12 ).
Research has found various barriers to reporting gender-based harassment incidents. Several studies have revealed that victims of sexual harassment on transit were more likely to report incidents to friends or family rather than police or transit operators ( 3 , 11 ). Research in Los Angeles also found that none of the women asked knew about the Metro Safe app, one of the main channels for reporting harassment incidents, and others said that it was not worth the time to submit a report or that they didn’t know how to submit reports ( 1 ). Common reasons cited by women as to why they do not report gender-based harassment incidents are listed below ( 1 , 3 , 6 , 12 , 13 ).
Distrust in the justice system (victims do not believe any action will be taken based on the report)
Cultural influence of shame and victim blaming
Social conditions that lead victims to trivialize/normalize harassment (i.e., not perceiving the incident as serious or as a crime)
Embarrassment (victims prefer to internalize, escape from, and forget about the incident; can be the result of victims thinking they were at fault for the incident)
Not knowing how to report incidents or which types of incidents warrant reporting
Perception that the reporting process is lengthy and time-consuming
Past bad experiences with police and law enforcement (especially among LGBTQI, people of color, and indigenous women)
Avoiding “more trouble”
Suggested Interventions and Policies to address Gender-Based Harassment on Transit
Several of the reports reviewed provided policy recommendations or suggested interventions to address gender-based harassment. The commonly recommended solutions are listed below in Table 1.
Recommended Safety Intervention from Literature Review
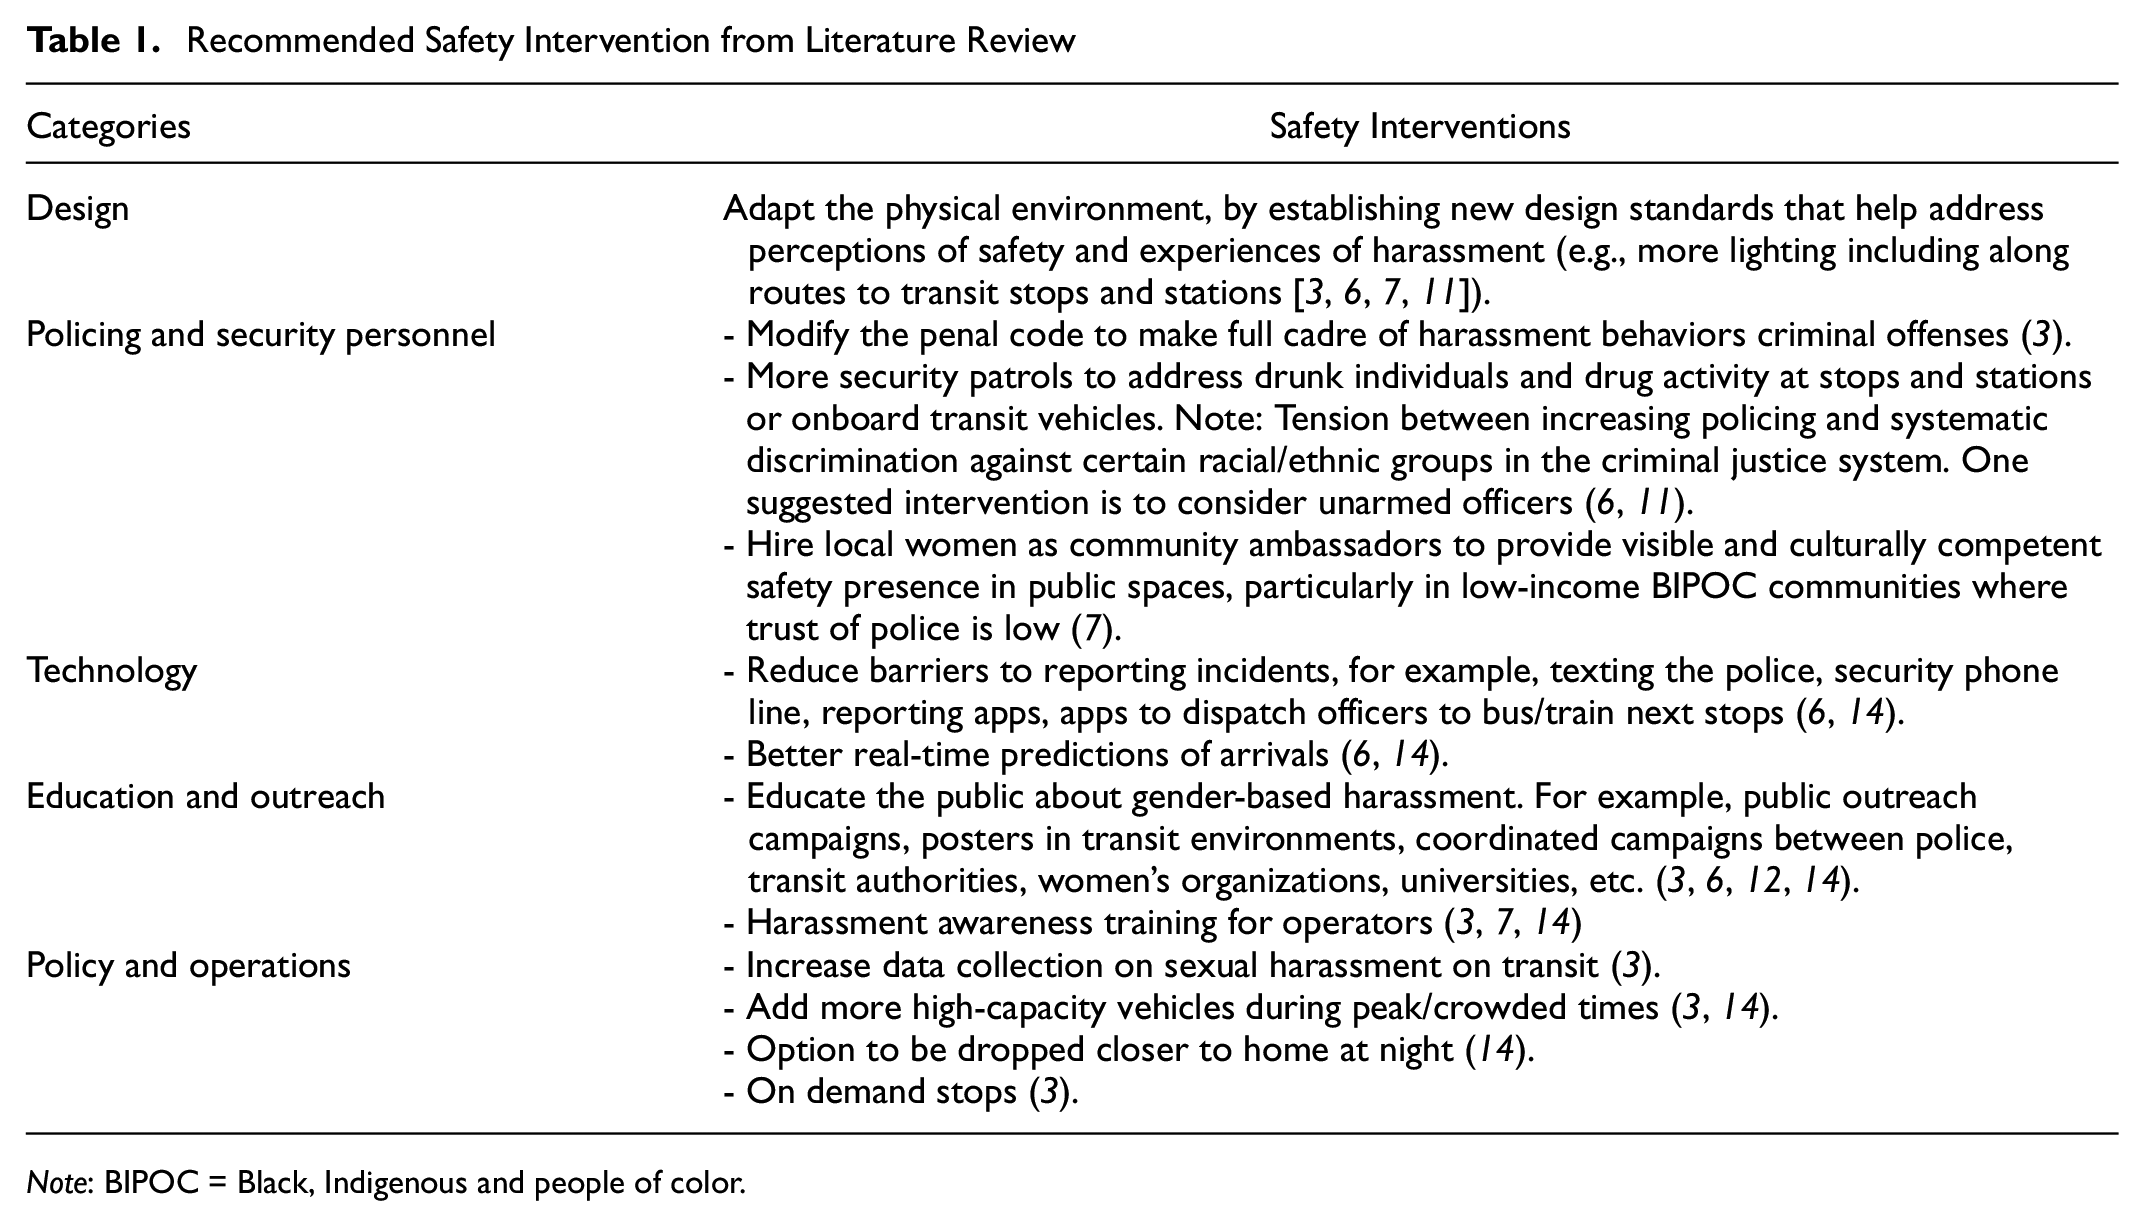
Note: BIPOC = Black, Indigenous and people of color.
Methods
This research focuses on the results of the SFMTA Safety Equity Initiative’s
Survey Development
The SFMTA SEI’s Gender-based Experience Survey includes a set of questions about Muni riders’ experience of gender-based harassment in transit environments. The survey development started in February 2022, when the team received the survey questions from Alliance for Girls. Alliance for Girls worked with BART on their “Not One More Girl” initiative, a youth-led campaign to combat harassment in transit and other parts of the city that launched in April 2021. The SFMTA SEI team then began a series of meetings with the SFMTA Communications team to adapt the survey to the context of the City of San Francisco and the language used by the agency.
The survey was workshopped within the SEI team until August 2022, then the SEI team formed a research partnership with UCLA Institute of Transportation (ITS) on the SEI project. The SEI team then received feedback from ITS researchers on the design and context of the survey. The survey was then internally launched to the SFMTA staff on September 14, 2022, and the team gathered feedback about the survey format and questions from SFMTA staff who took the draft survey.
From September 2022 to January 2023, the SEI and ITS teams edited and reviewed the survey, based on the feedback and data received, to check for data integrity and make the survey more user-friendly. The last step in the survey’s development was to translate it into four other languages: Spanish, Traditional Chinese (Cantonese), Filipino, and Russian, encouraging language accessibility.
Survey Distribution, Outreach, and Data Collection
The SFMTA SEI Gender-based Experience Survey was officially launched to the public on February 16, 2023. It was hosted on the ArcGIS Survey123 system. The survey was initially distributed via the Transit App. The Transit App had a banner in the user interface of the application for all users in San Francisco who opened the application. Users could follow the link and take the survey, “dismiss” the banner permanently so that it would not show the message again, or if they did not interact with the banner at all it would remain visible for two weeks when users opened the app.
On the first day the survey was available in the Transit App, just over 100 respondents completed the survey. Over the next two weeks (February 15, 2023–March 2, 2023) about 20 to 80 respondents completed the survey each day. Next, a push notification was sent to all users who had not dismissed or already followed the link to the survey on March 3, 2023, which resulted in 331 additional responses on that day alone. Finally, a Muni Alert was sent to all email and SMS subscribers on March 6, 2023, which resulted in 454 additional responses that day. The message sent to the Transit App users and the Muni Alert subscribers directed users to an SFMTA landing page, where the survey was available in five languages (Chinese, Spanish, Filipino, Russian, and English).
All versions of the survey were “opt-in” and this could create a bias among riders who have experienced harassment wishing to report on the incidents they have experienced. Additionally, since many of our responses came from the Transit App banner, this method excludes respondents who do not have access to a mobile phone and biases the demographics captured via that distribution method to be representative only of users of the Transit App.
Data Analysis Methods
The data was exported from the ArcGIS Survey123 system as a Comma-separated value (CSV) file and cleaned and processed for analysis. We calculated descriptive statistics and cross-tabulations examining the effects of various demographic characteristics on harassment and feelings of safety on transit. We used chi-squared analyses to determine the relationship between the participants’ demographic information and their experiences of harassment and feelings of safety on transit. The chi-squared test is a statistical test that is used to compare observed data with expected data to determine if there is a significant difference between the two. In this study, the chi-squared test was used to determine if there was a significant difference in harassment experiences and feelings of safety on transit between different gender identities, race/ethnicities, people with disabilities, if people have access to a car, and if Muni is their primary form of transportation. To perform the chi-squared test in Excel, the following steps were taken:
The contingency table was created in Excel using the demographic information and data on the experiences of harassment and feelings of safety on transit of respondents.
The chi-squared function was used in Excel to calculate the chi-squared statistic and the associated p-value.
The degrees of freedom were calculated based on the size of the contingency table.
The critical value was calculated using the chi-squared distribution table.
The p-value was compared with the level of significance (α) to determine if the result was statistically significant.
We also performed spatial analysis on the questions where respondents were asked to use an interactive map built in the ArcGIS Survey123 system to pinpoint the spot of the incident or the most common spot of incidents. The spatial analysis process studies harassment incidents by evaluating the spatial features of the data set (i.e., the location of harassment incidents). We used ArcGIS Pro to geoprocess the incident points and used tools such as kernel density and hot spot analysis to cluster and summarize features that are near transit infrastructure.
In addition to the interactive map, the survey included a text response field asking respondents to identify the Muni lines, stations, or stop locations where they had experienced harassment. We conducted a key words analysis based on these text responses. We analyzed the results by counting the frequency of the words within a list of key terms, including neighborhoods, Muni stations, and lines. 687 out of 1,613 respondents (43%) input location data through the written response option. We did not combine the written responses with the spatial mapping responses because many verbatim comments are on a bigger scale, like the neighborhoods and a section of the bus routes, making them hard to compare with point data. The comments are also much more scattered, making it less consistent if analyzed with the point data. Therefore, we analyzed the verbatim comments independently and compared the findings with our spatial data.
We conducted an analysis of the survey questions related to reporting incidents of harassment and which safety interventions would make people feel safer. These questions were analyzed across the whole sample as well as cross-tabulations for various demographics, including race/ethnicity and gender identity.
Analysis and Findings
Descriptive Statistics
The descriptive statistics provide an overview of the survey results. The survey was open from February 16, 2023 to March 31, 2023. We collected a total of 1,613 responses. Table 2 provides an overview of demographic and basic travel patterns of survey respondents.
Summary Statistics of Gender-based Experience Survey Sample
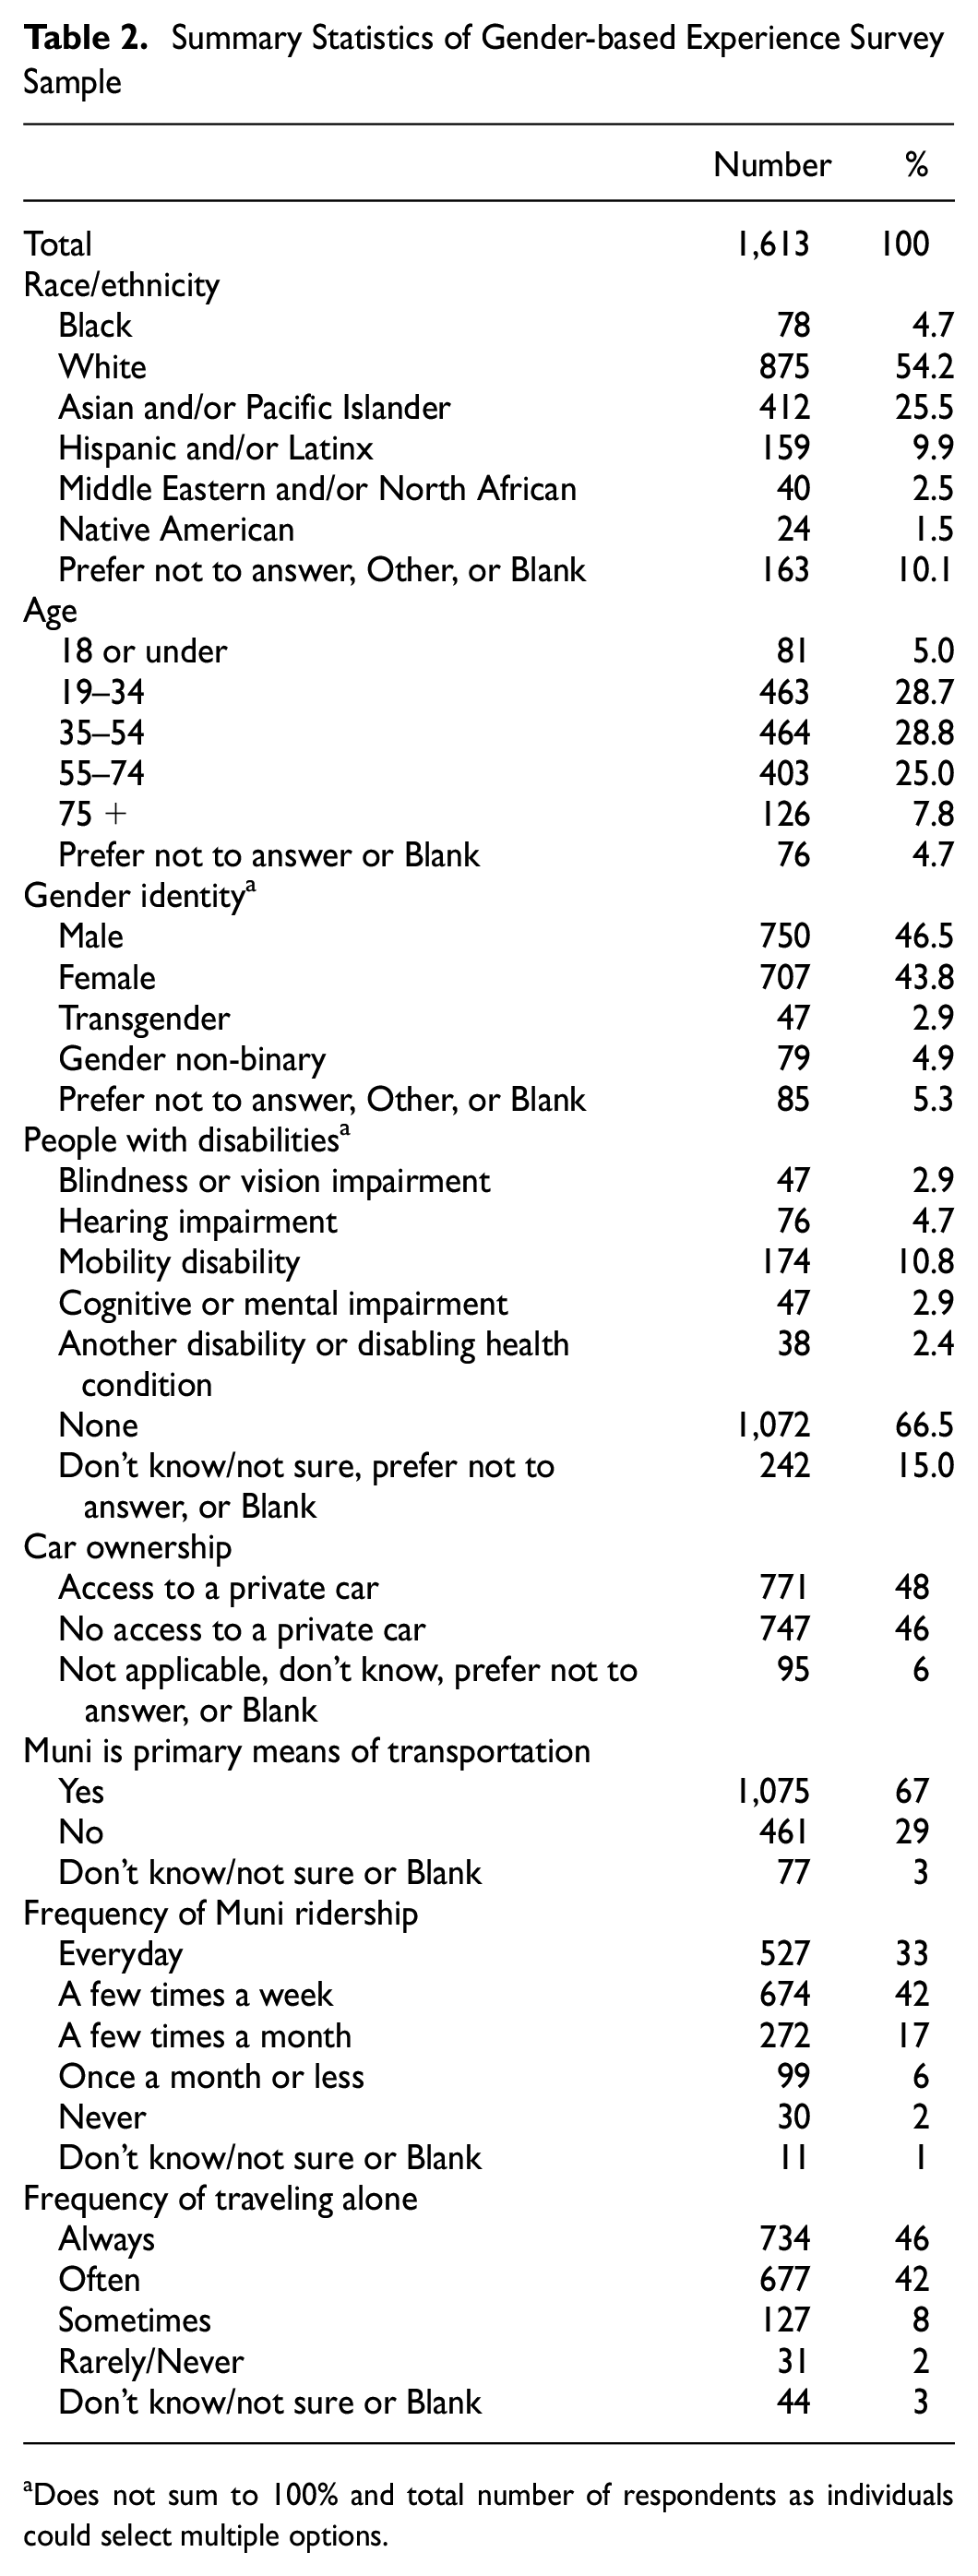
Does not sum to 100% and total number of respondents as individuals could select multiple options.
Table 3 provides an overview of the 2021 Muni Ridership Survey respondents’ demographic and basic travel patterns. Comparing the demographics of the Gender-based Experience Survey respondents with the Muni Ridership Survey, we can see if our survey is representative of the Muni ridership. The distribution of race/ethnicity from the ridership surveys is similar to our sample; the highest share of respondents is white, then Asian and/or Pacific Islander, then Hispanic and/or Latinx, then Black, and small samples of Middle Eastern and/or North African and Native American respondents. For gender identity, the distribution is spread evenly between men and women, which is consistent with our Gender-based Experience Survey. However, the 2019 ridership survey only had male and female as options on the gender question and gender non-binary was added in 2021. In comparison our survey included four options, male, female, transgender, and gender non-binary, as well as the option to select ‘other’.
Summary Statistics of 2021 Muni Ridership Survey
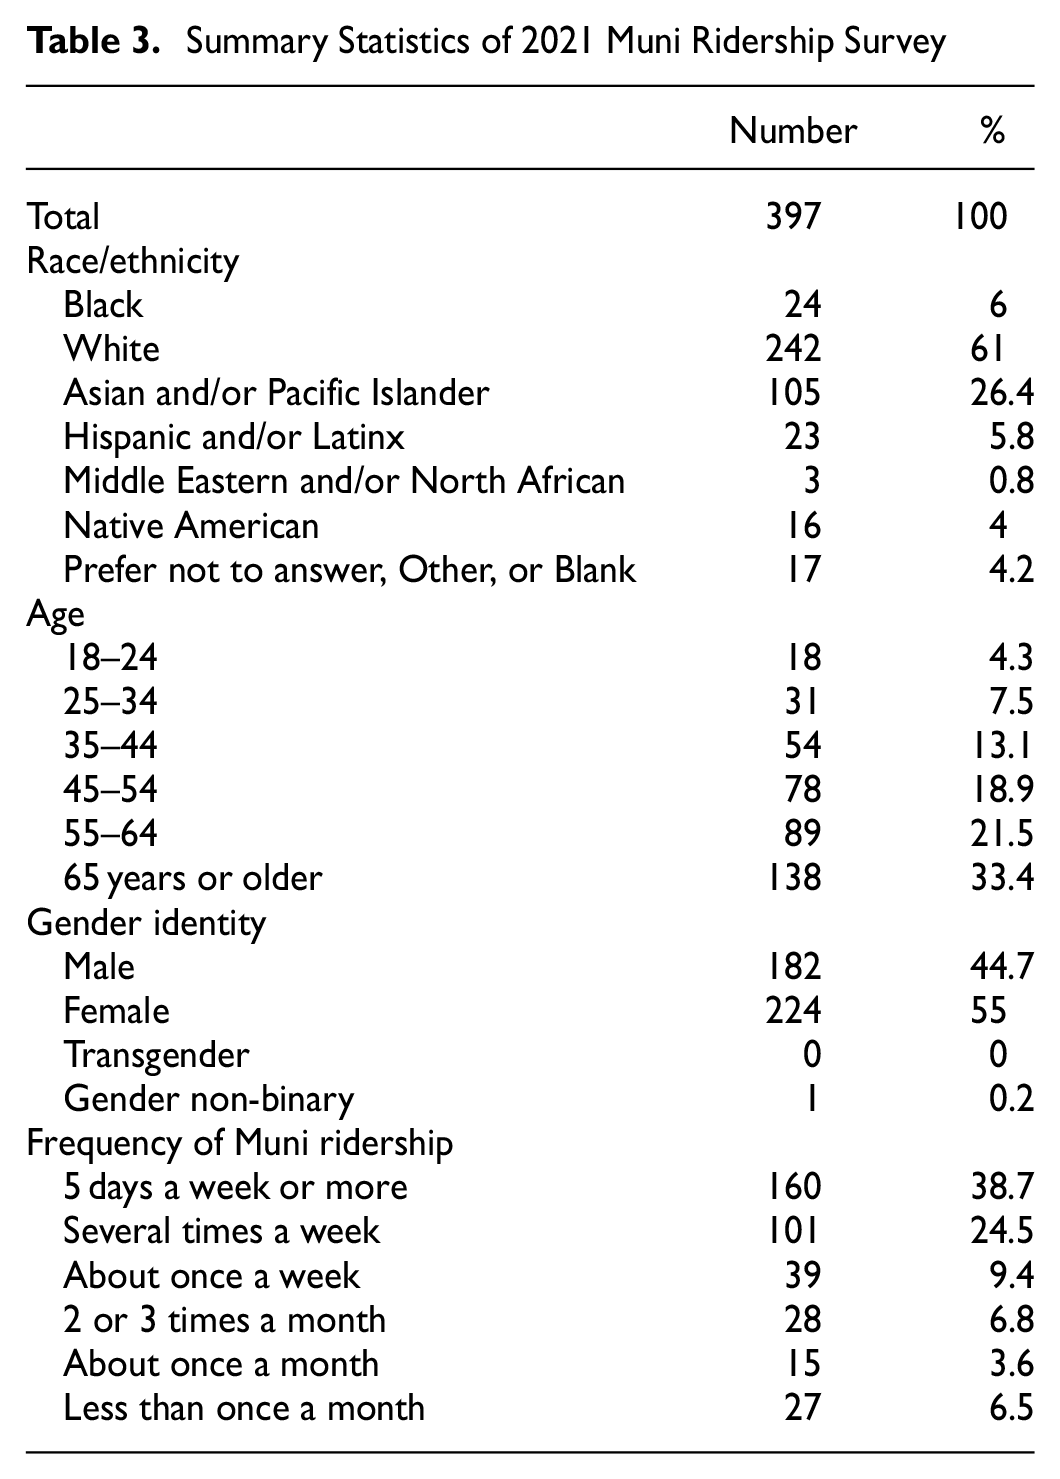
Most people who took the Muni Ridership Survey reported using Muni five days a week or more, or several times a week, which is consistent with the Gender-based Experience Survey. The survey also had safety-related questions, but “safety” was a general term not limited to harassment or gender-based violence. Only 38% of respondents said excellent or good for feeling safe and secure from crime while onboard or waiting for Muni, which is a lower percentage than we found for those who “always” or “often” feel safe during daytime (54%) and higher than Gender-based Experience Survey findings about nighttime perceptions of safety (13%).
Cross-Tabulations
This section includes cross-tabulations and bivariate analyses of our sample. Tables 4 to 7 include cross-tabulations across several demographic and travel behavior categories and experiences of harassment/perceptions of safety. There are four cross-tabulations—two of them are demographics (gender identity and race/ethnicity) and two are related to travel patterns (car ownership and Muni as primary means of transportation.) The survey questions on experiences and witnesses of harassment asked respondents to recall the last six months, so all reported rates apply to that timeline.
Effects of Gender Identity on Harassment
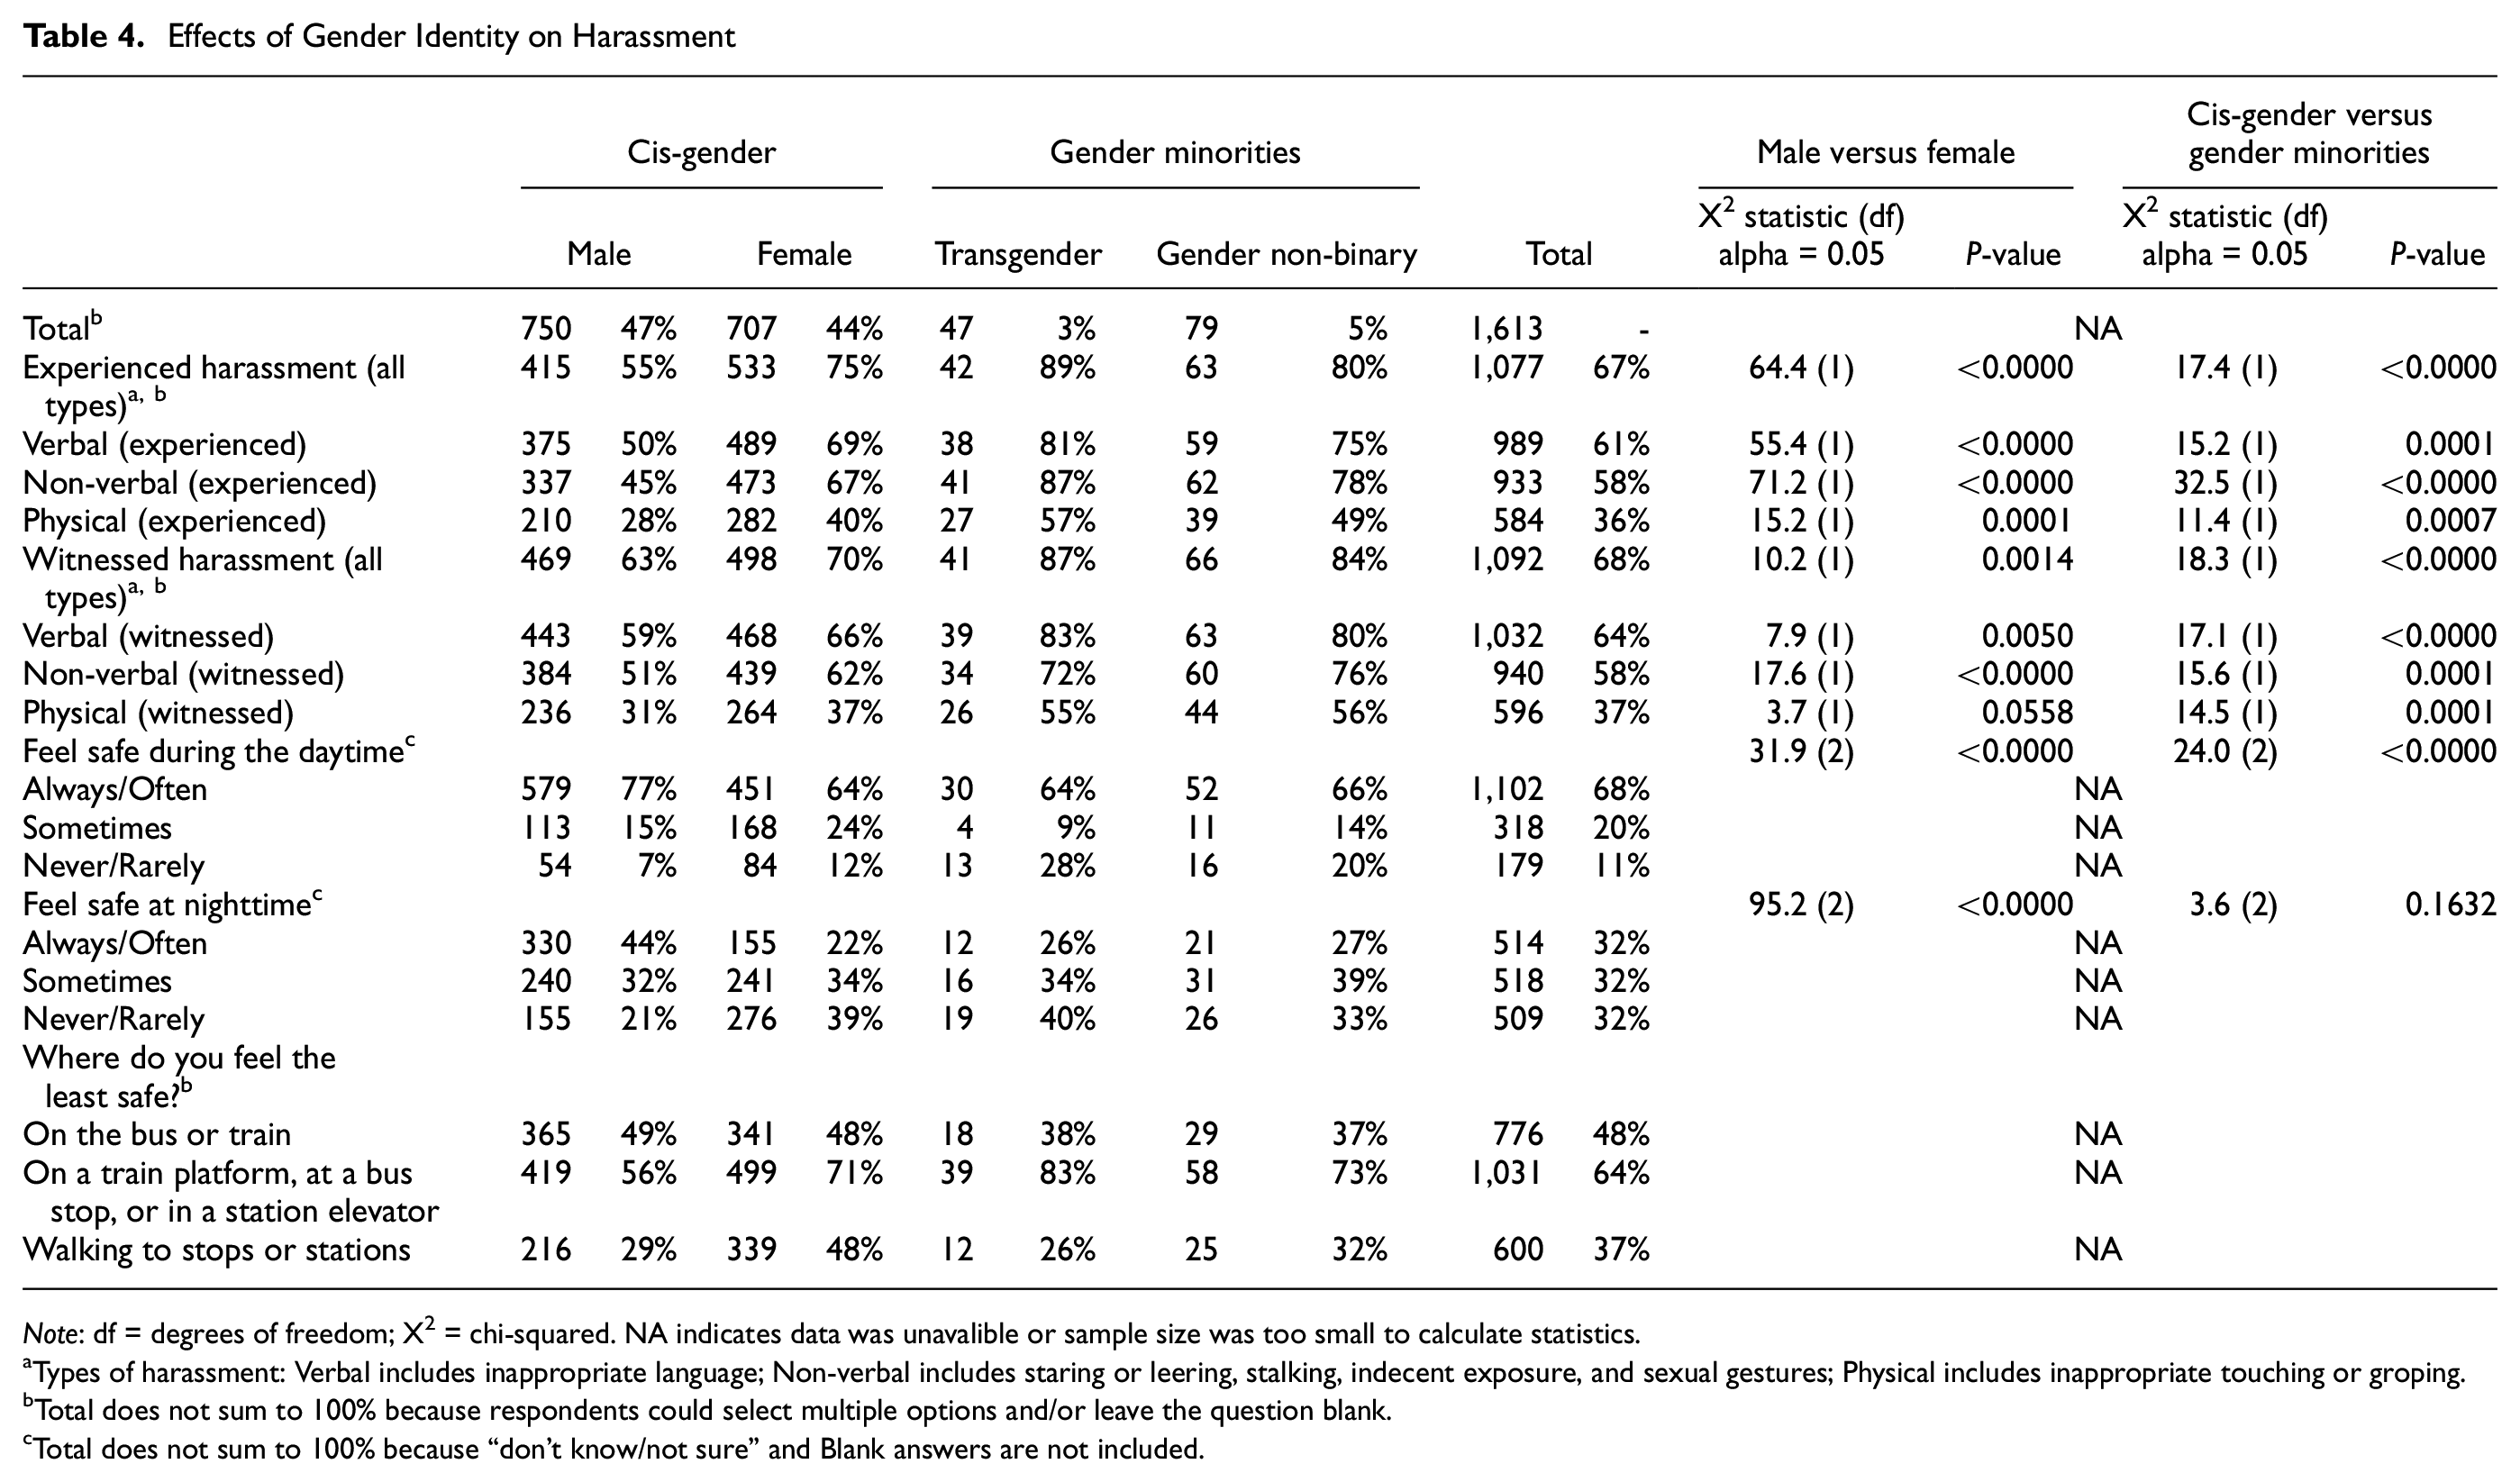
Note: df = degrees of freedom; X2 = chi-squared. NA indicates data was unavalible or sample size was too small to calculate statistics.
Types of harassment: Verbal includes inappropriate language; Non-verbal includes staring or leering, stalking, indecent exposure, and sexual gestures; Physical includes inappropriate touching or groping.
Total does not sum to 100% because respondents could select multiple options and/or leave the question blank.
Total does not sum to 100% because “don’t know/not sure” and Blank answers are not included.
Effects of Race/Ethnicity on Harassment a
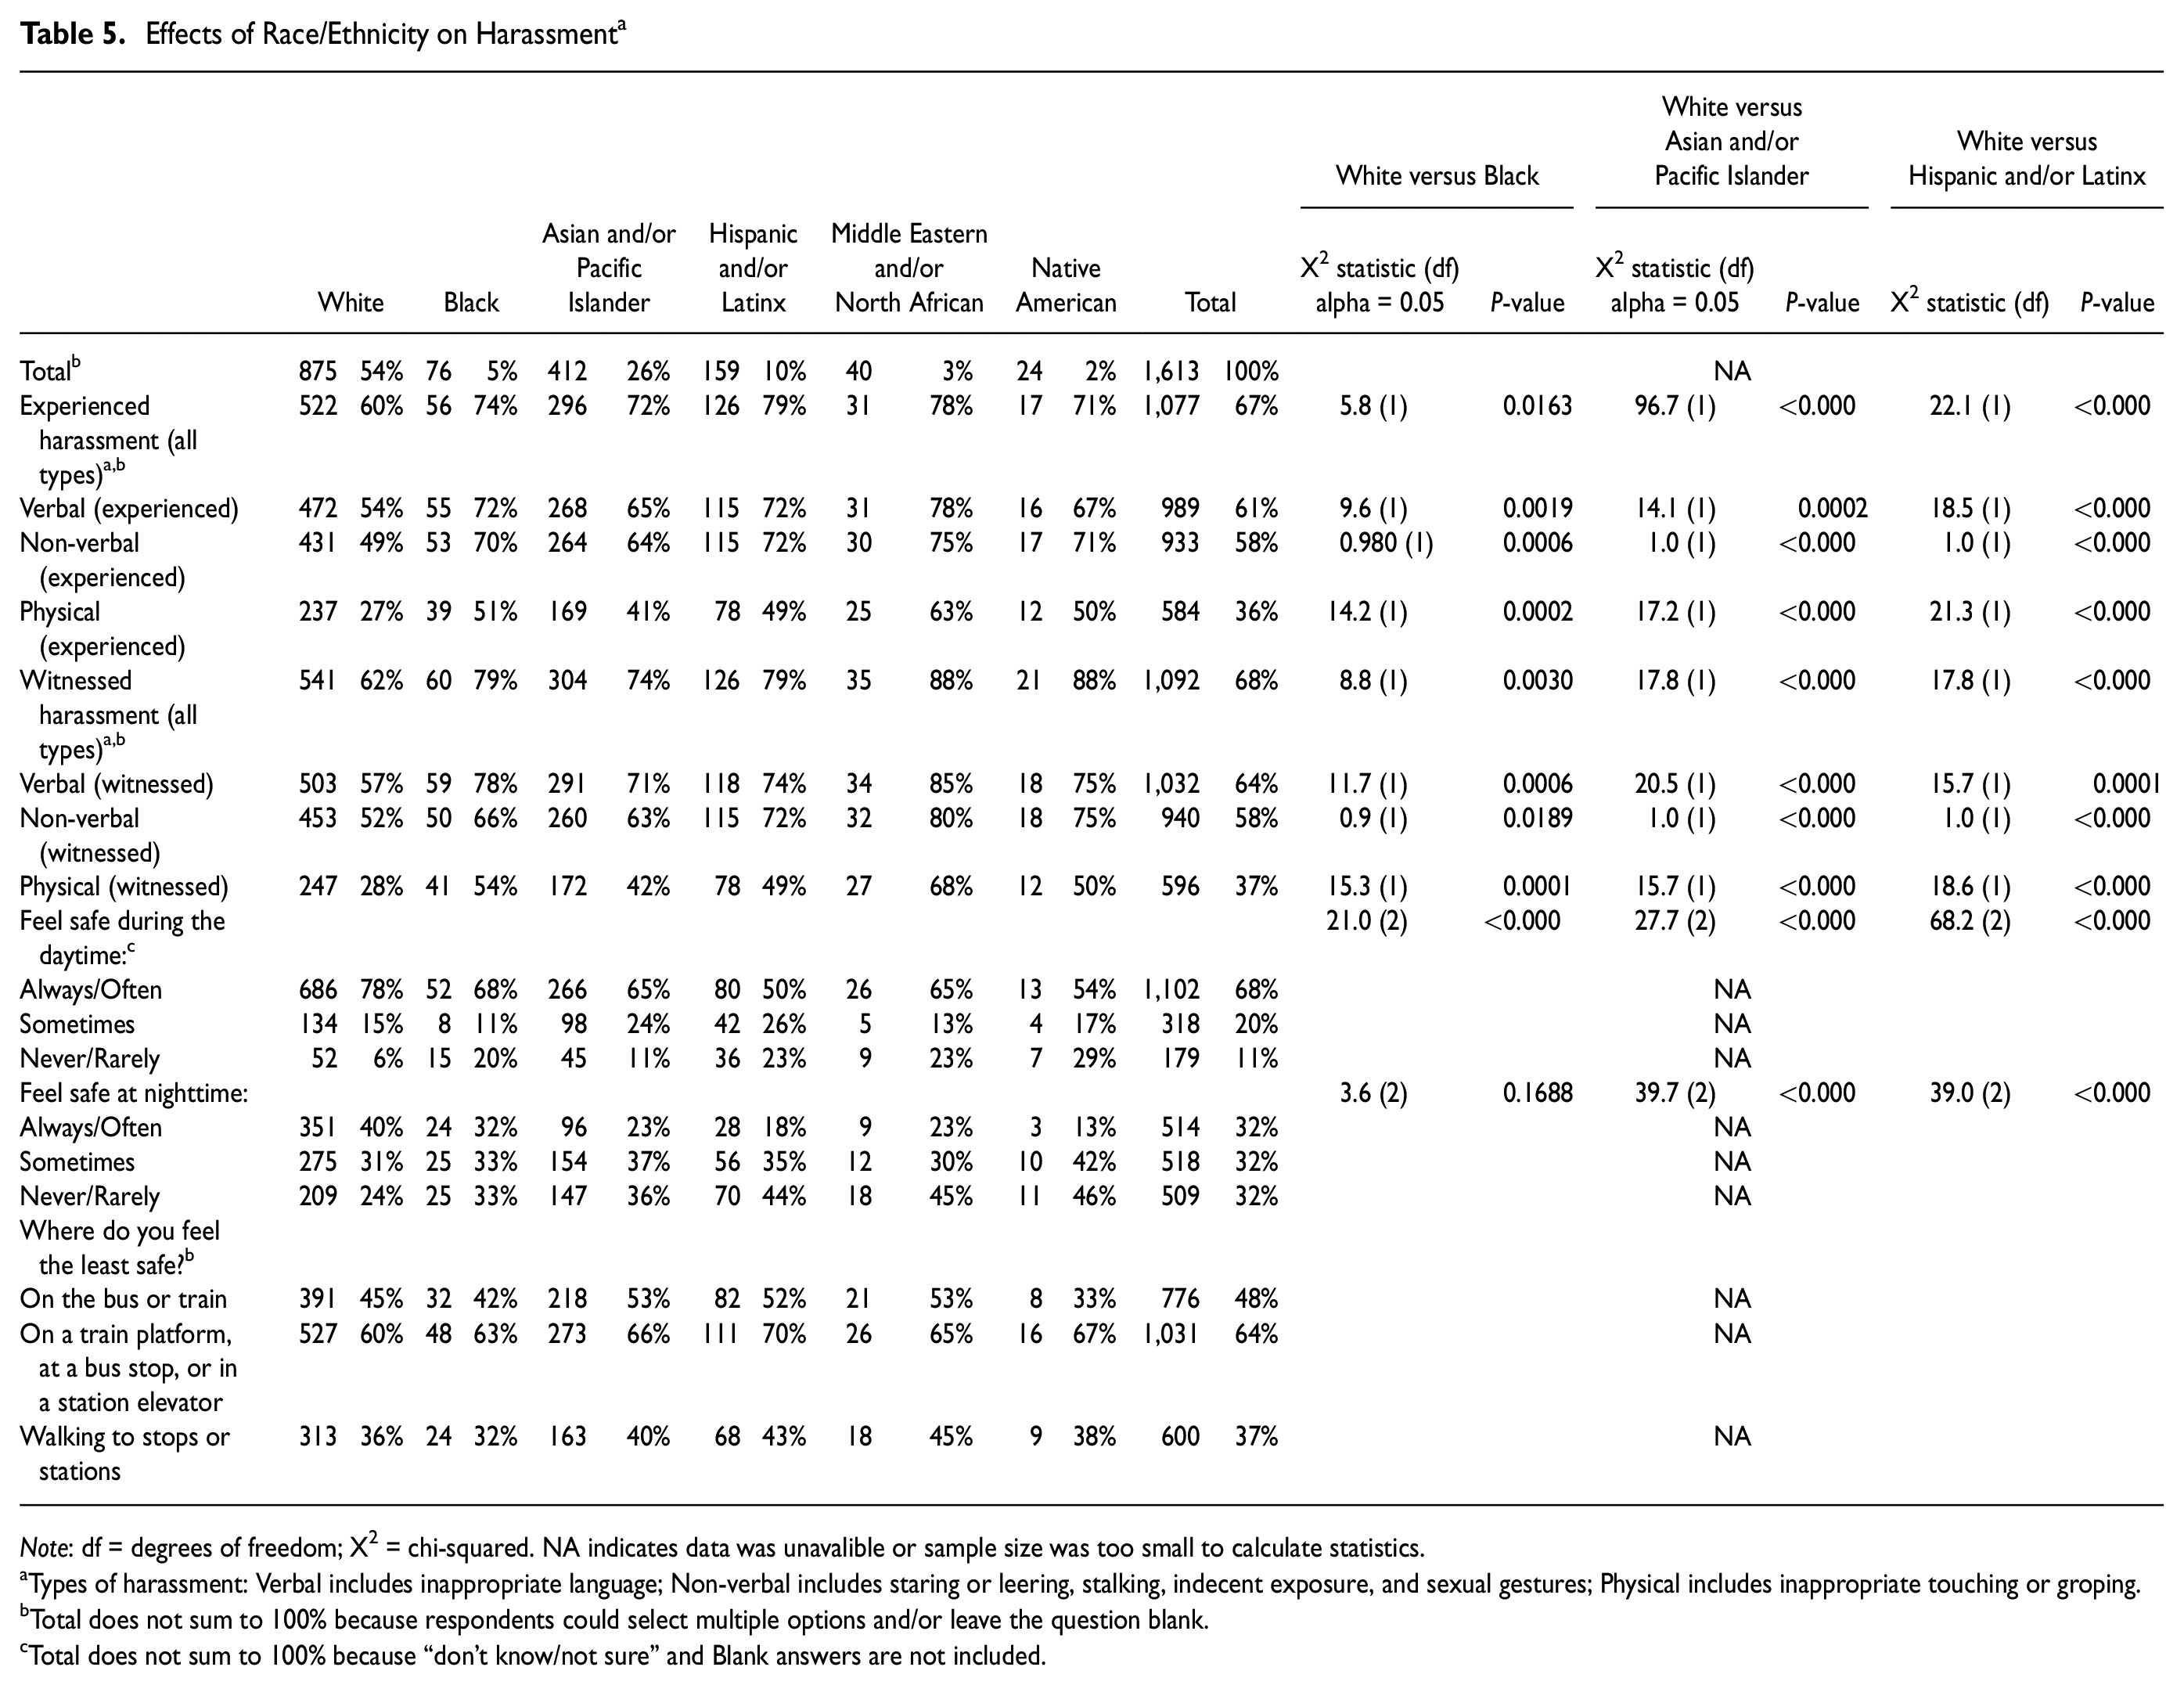
Note: df = degrees of freedom; X2 = chi-squared. NA indicates data was unavalible or sample size was too small to calculate statistics.
Types of harassment: Verbal includes inappropriate language; Non-verbal includes staring or leering, stalking, indecent exposure, and sexual gestures; Physical includes inappropriate touching or groping.
Total does not sum to 100% because respondents could select multiple options and/or leave the question blank.
Total does not sum to 100% because “don’t know/not sure” and Blank answers are not included.
Effects of car ownership on harassment
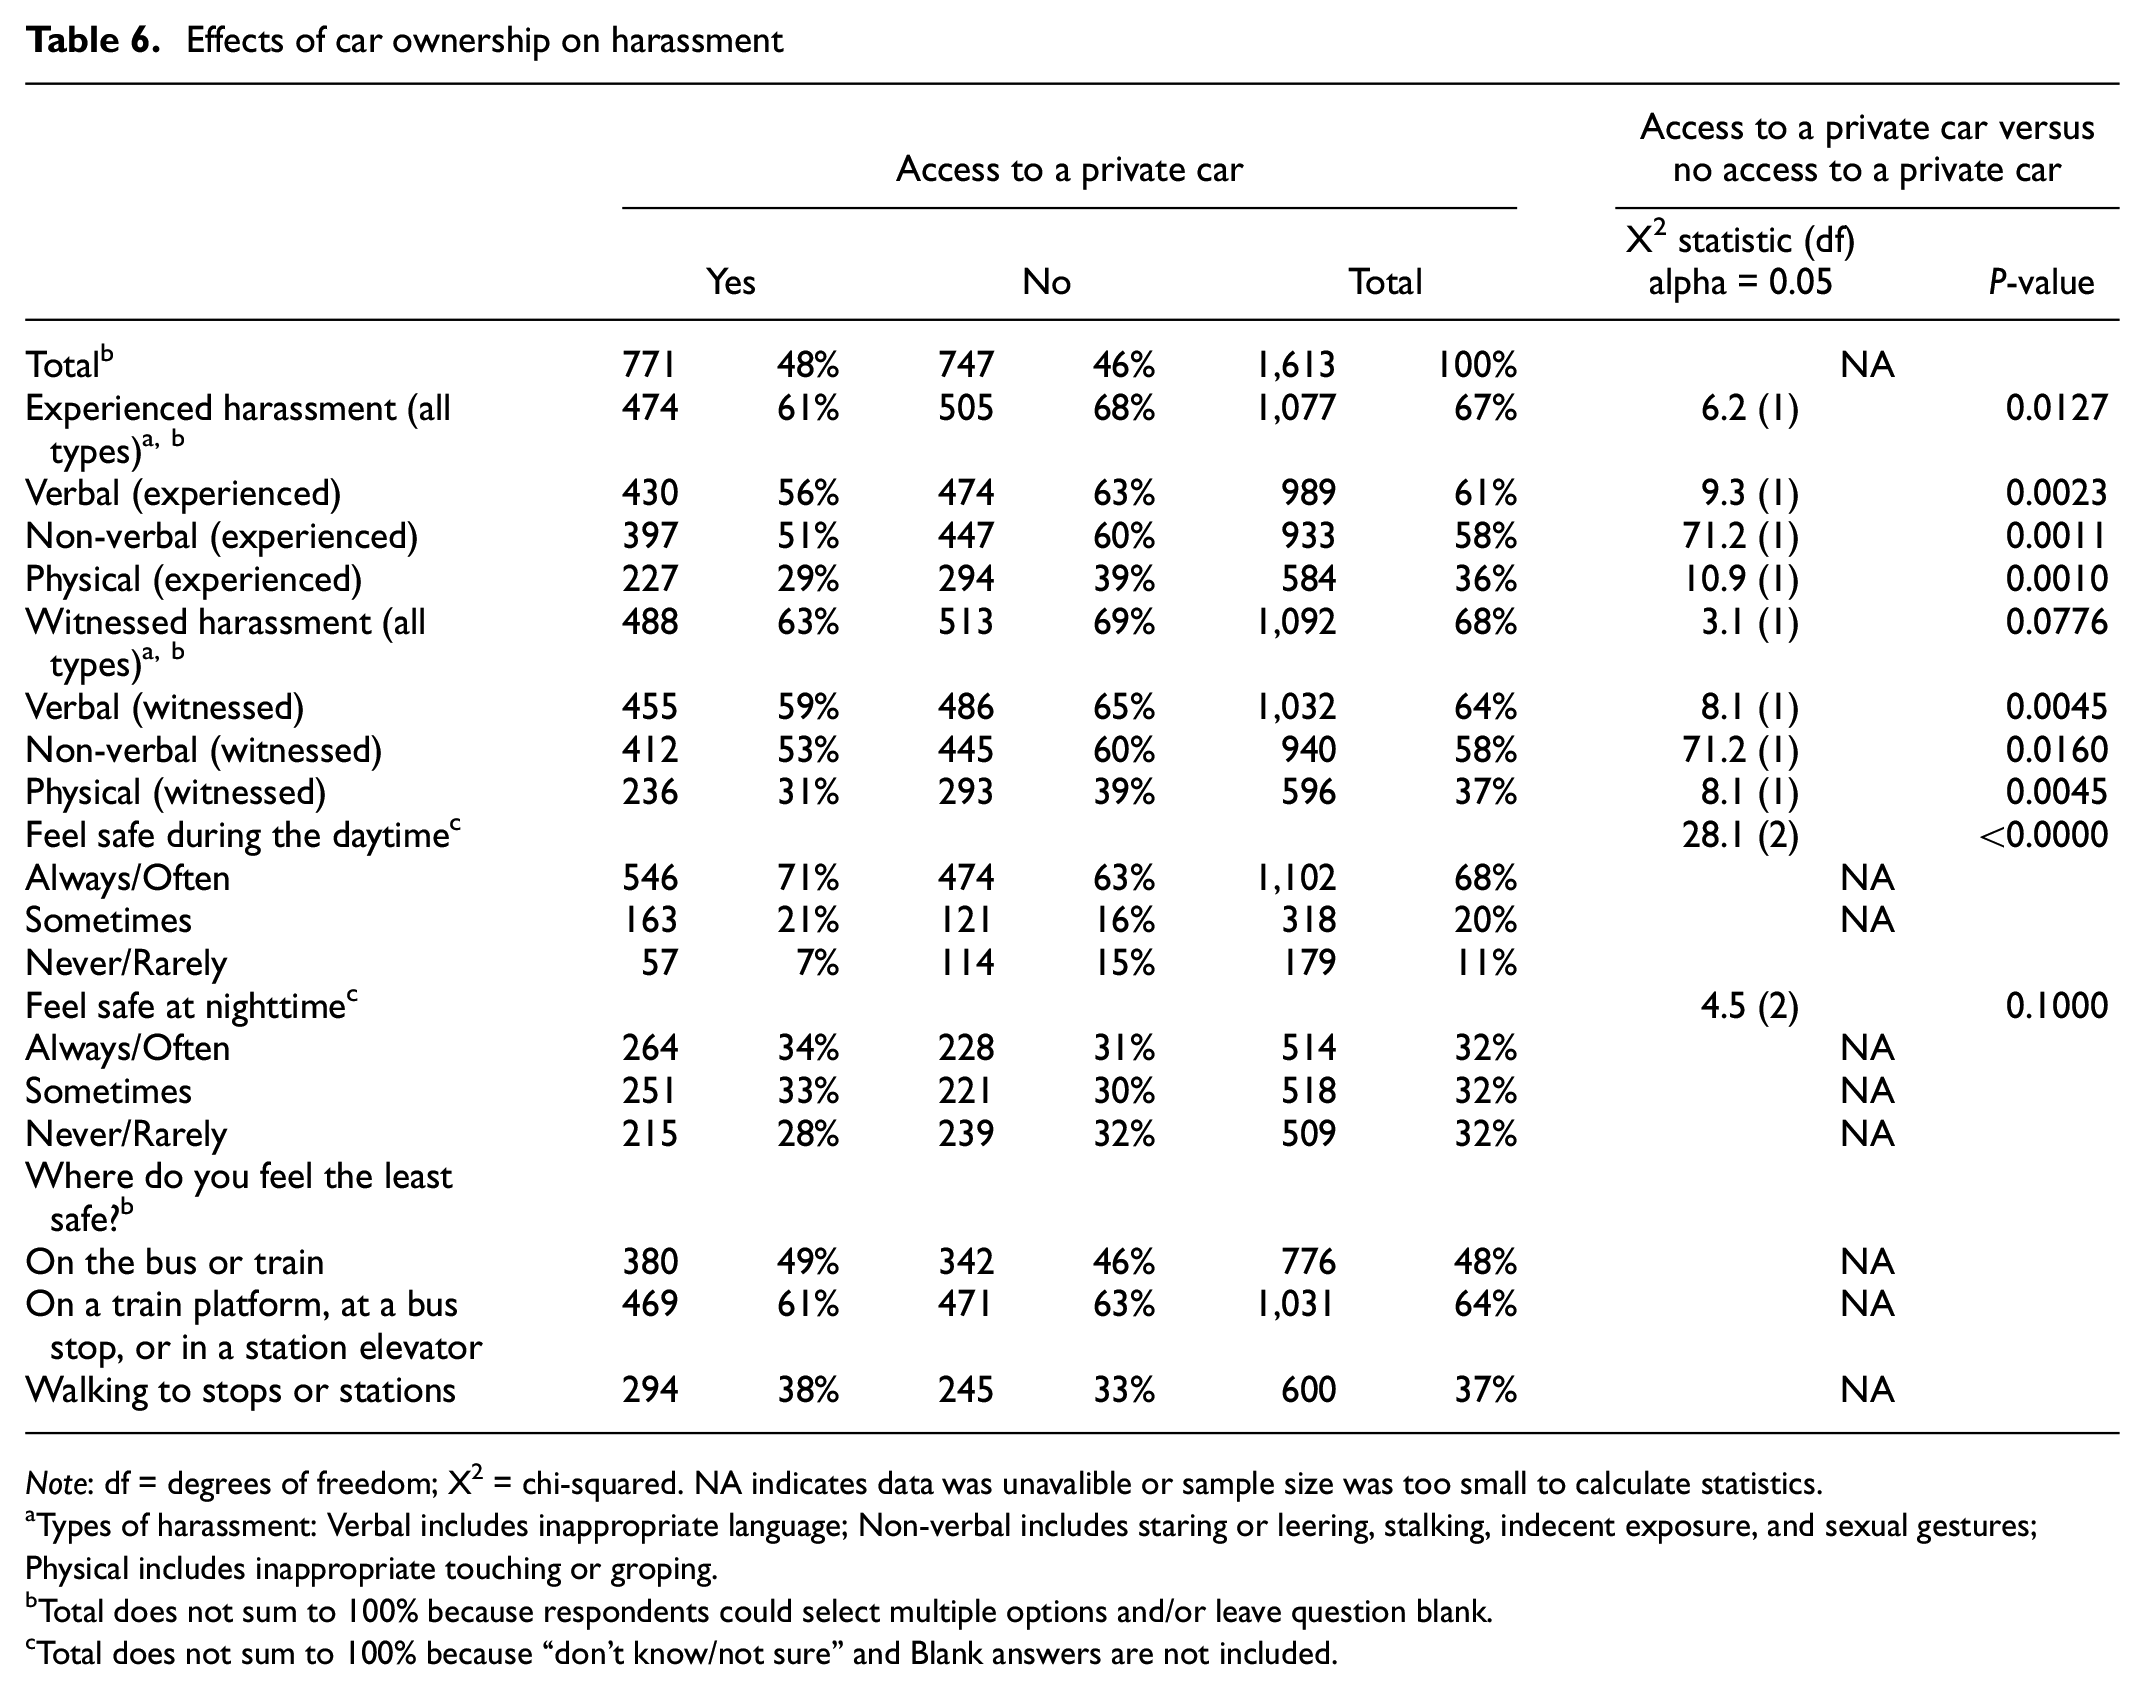
Note: df = degrees of freedom; X2 = chi-squared. NA indicates data was unavalible or sample size was too small to calculate statistics.
Types of harassment: Verbal includes inappropriate language; Non-verbal includes staring or leering, stalking, indecent exposure, and sexual gestures; Physical includes inappropriate touching or groping.
Total does not sum to 100% because respondents could select multiple options and/or leave question blank.
Total does not sum to 100% because “don’t know/not sure” and Blank answers are not included.
Effects of Muni as Primary Means of Transportation on Harassment
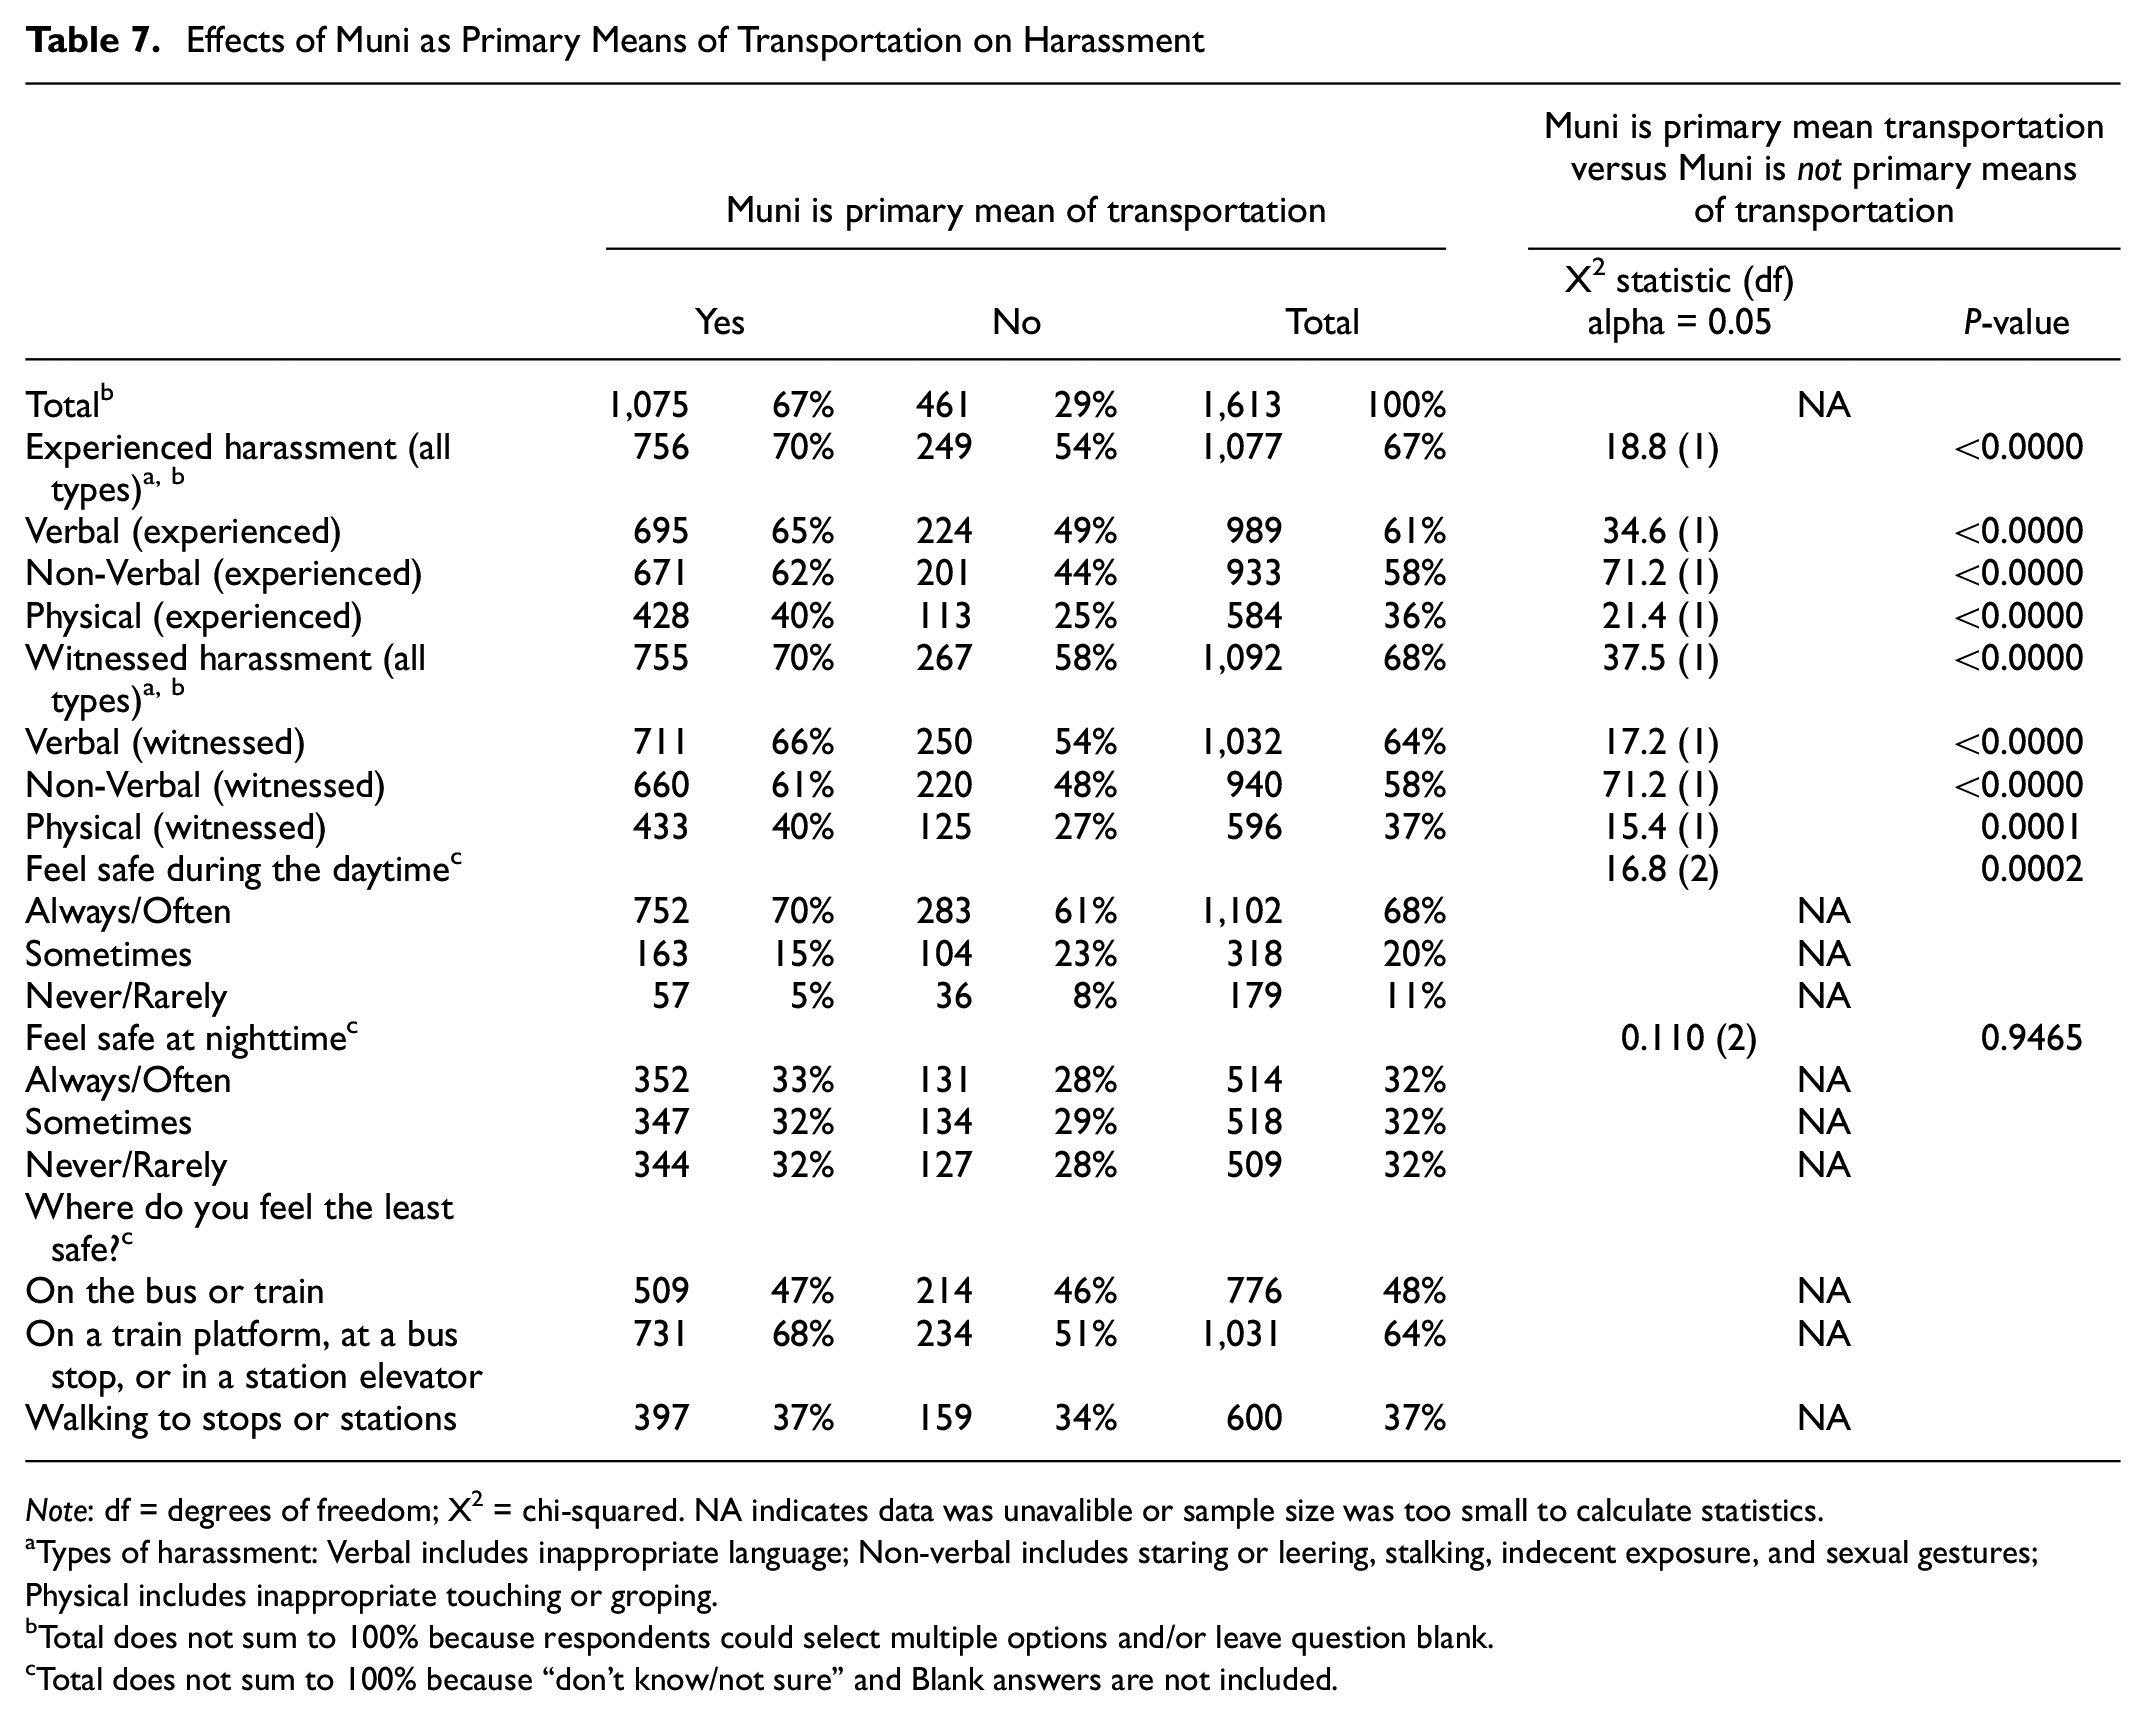
Note: df = degrees of freedom; X2 = chi-squared. NA indicates data was unavalible or sample size was too small to calculate statistics.
Types of harassment: Verbal includes inappropriate language; Non-verbal includes staring or leering, stalking, indecent exposure, and sexual gestures; Physical includes inappropriate touching or groping.
Total does not sum to 100% because respondents could select multiple options and/or leave question blank.
Total does not sum to 100% because “don’t know/not sure” and Blank answers are not included.
The tables focused on the effects of gender identity, race/ethnicity, car ownership, and Muni as the primary mode of transportation include chi-squared tests, examining if each demographic or travel behavior category has a statistically significant relationship with whether people have experienced or witnessed harassment and their perceptions of safety on transit. We conducted these cross-tabulations and chi-squared tests to examine the effects of various demographic characteristics on harassment and feelings of safety on transit.
The total rates across the entire sample are reported alongside the demographic breakdowns in each table. Across the sample, verbal harassment is the most common type of harassment that people experience and witness on transit, followed by non-verbal. Physical harassment is the least common. These findings are consistent with past research ( 3 , 6 , 11 , 12 ). We also found that transit stations (including train platforms, bus stops, and station elevators) are the places where people feel the least safe. This is consistent across all demographic groups analyzed in the tables that follow. The majority (68%) of respondents ‘always’ or ‘often’ felt safe during the day but were less likely to feel safe at nighttime (down to only 32%), this is similarly true across many of the demographics but is a more drastic contrast for some demographic groups over others.
The findings presented in Table 4 reveal that there are statistically significant differences between male and female and cis-gender people and gender minorities across almost all questions examined. This includes the share of respondents who have experienced or witnessed verbal, non-verbal, and physical harassment (the only exception being that the difference between the share of men and women who have witnessed physical harassment is not statistically significant). The magnitude of the chi-squared test statistics (64.4 for all types of harassment, 55.4 for verbal harassment, and 71.2 for non-verbal harassment) for the chi-squared test comparing how many female and male respondents have experienced various types of harassment also reveals that there is a substantial difference between the proportions of male and female respondents who have experienced harassment on transit. The findings are consistent with past research in this area. Several studies similarly found that women have experienced higher levels of harassment ( 1 , 3 , 6 , 7 , 11 ).
The difference in how many male and female respondents feel safe on transit during the daytime and nighttime is also statistically significant. The size of the chi-squared test statistics examining feelings of safety between female and male respondents during the daytime (31.9) and nighttime (95.2) shows that the observed frequencies deviate significantly from the expected frequencies between these two groups. Our findings on the share of female respondents who feel safe during the day versus at night are consistent with what we found in the literature. For example, LA Metro (2019) found that 60% of female riders feel safe during the daytime (compared with our finding of 64%), but that only 20% feel safe during the nighttime (compared with our finding of 22%).
While less studied, our finding that gender minorities experience more harassment than cis gender individuals is consistent with findings from the Lubitow et al. ( 8 ) interview-based research report, which found that gender minorities have experienced frequent harassment while engaging with the public transit systems. Additionally, the LA Metro On-board Survey conducted in 2018 found that non-binary people are most likely to have been harassed ( 1 ).
Table 5 includes cross-tabulations and chi-squared tests across different races and ethnicities. The results show that Hispanic, Black, and Asian and/or Pacific Islander respondents were more likely than white respondents to experience or witness harassment on Muni. This is consistent with several articles reviewed, which found white respondents reported less frequent harassment on transit ( 6 , 7 ). Middle Eastern and/or North African and Native American respondents also experienced and witnessed higher rates of harassment than white respondents, however the sample sizes were small (which is why they were not included in chi-squared tests). The chi-squared tests revealed that for all but one category, the difference between Black, Asian and/or Pacific Islander and Hispanic respondents were statistically significant.
The magnitude of the chi-squared test statistics between white and Asian and/or Pacific Islander respondents was 96.7, revealing that there is a substantial difference in the proportions of white versus Asian and/or Pacific Islander transit riders who have experienced harassment. This is consistent with the literature and aligns with recent growing concerns about how incidents of anti-Asian harassment on transit have increased since the pandemic ( 6 , 7 , 15 ).
Table 6 includes cross-tabulations and chi-squared tests across respondents who have access to a private car versus those without access to a private car. From this variable, we can get a general sense of transit dependents’ harassment experiences and perceptions of safety. Transit dependents are defined as “people who are too young, too old, can’t afford, or do not have access to a personal automobile and rely on transit to reach their destinations.” ( 16 ) The findings show that people without access to cars have experienced and witnessed the highest rates of harassment on transit (68% and 69%).
Through the chi-squared test, we see that there are statistically significant differences between people who have and do not have access to a private car across almost all questions examined. This includes the types of harassment experienced and witnessed (except for those who have witnessed all types of harassment). When looking at the non-verbal harassment experienced and witnessed, the magnitude of the chi-squared test statistics between people who have access to a car and people who don’t have access to a car was 71.2. This demonstrates that there is a substantial difference in the proportion of people who have experienced harassment and have cars compared with the rates of harassment among people who don’t have a car. This goes to show that the differences of people who are transit dependent that have experienced harassment are statistically significant. Many women and gender minorities are transit dependent, and therefore are more likely to experience and witness gender-based harassment. There are also statistically significant differences between people with cars and people without cars in their perceptions of safety during the daytime, but not at nighttime.
Table 7 includes cross-tabulations and chi-squared tests comparing people who use Muni as their primary means of transportation and people who don’t use Muni as their primary means of transportation. From the cross-tabulations, respondents who use Muni as their primary means of transportation were more likely than respondents who do not use Muni as their primary transportation to experience or witness harassment on Muni. The chi-squared tests revealed that for all but one category (feeling safe at nighttime), the difference between respondents who have and have not used Muni as their primary means of transportation were statistically significant. The highest chi-squared test statistics were for experiencing and witnessing non-verbal harassment. This demonstrates there is a substantial difference between the two groups and shows that respondents who use Muni as their primary mode of transportation are more likely to experience harassment.
Verbatim Comments Analysis
The survey included a qualitative question asking, “At which Muni lines, stations, or stop locations have you experienced or seen gender-based/sexual harassment or violence?” Respondents gave written responses to the question. We derived a list of key terms from the written answers and count the frequency with which they were used. The key terms is essentially the names and/or numbers of bus and rail lines and stations. Through Natural Language Processing in Python, we could see which key terms were repeated the most and count how many times each word was mentioned. There are conditions where a bus route could be counted twice, for example 38 bus route is calculated separately from 38R (rapid bus route). We disaggregated the counts by gender, demonstrating the different percentages of men and women and gender minorities in these key terms.
Table 8 demonstrates the frequency of use of Muni key terms. The table is presented in two columns, each reading from top to bottom in order of frequency of use of “key terms”. Key terms include names, numbers, and letters that are bus and rail lines and stations. The five most frequently used terms are Mission, Civic Center, Market, Powell, and Van Ness. The results show that a high frequency of people experience and see harassment on the Muni Metro system. It is worth noting that three of the five most frequently used terms (Civic Center, Powel, and Mission) are also the names of BART stations, and both Muni and BART system are in the same underground station but separated by different fare gates and platform. While the survey did specifically ask “at which Muni lines, stations, and stop locations” riders had experienced harassment, respondents might have conflated the BART and Muni systems at those three locations. Additionally, those stops service several Muni lines (J, K, L, M, N, T) with some of the highest ridership in the system, meaning that while instances of harassment are likely higher on these lines, the rates of harassment may not be.
Frequency of Use of Muni Key Terms
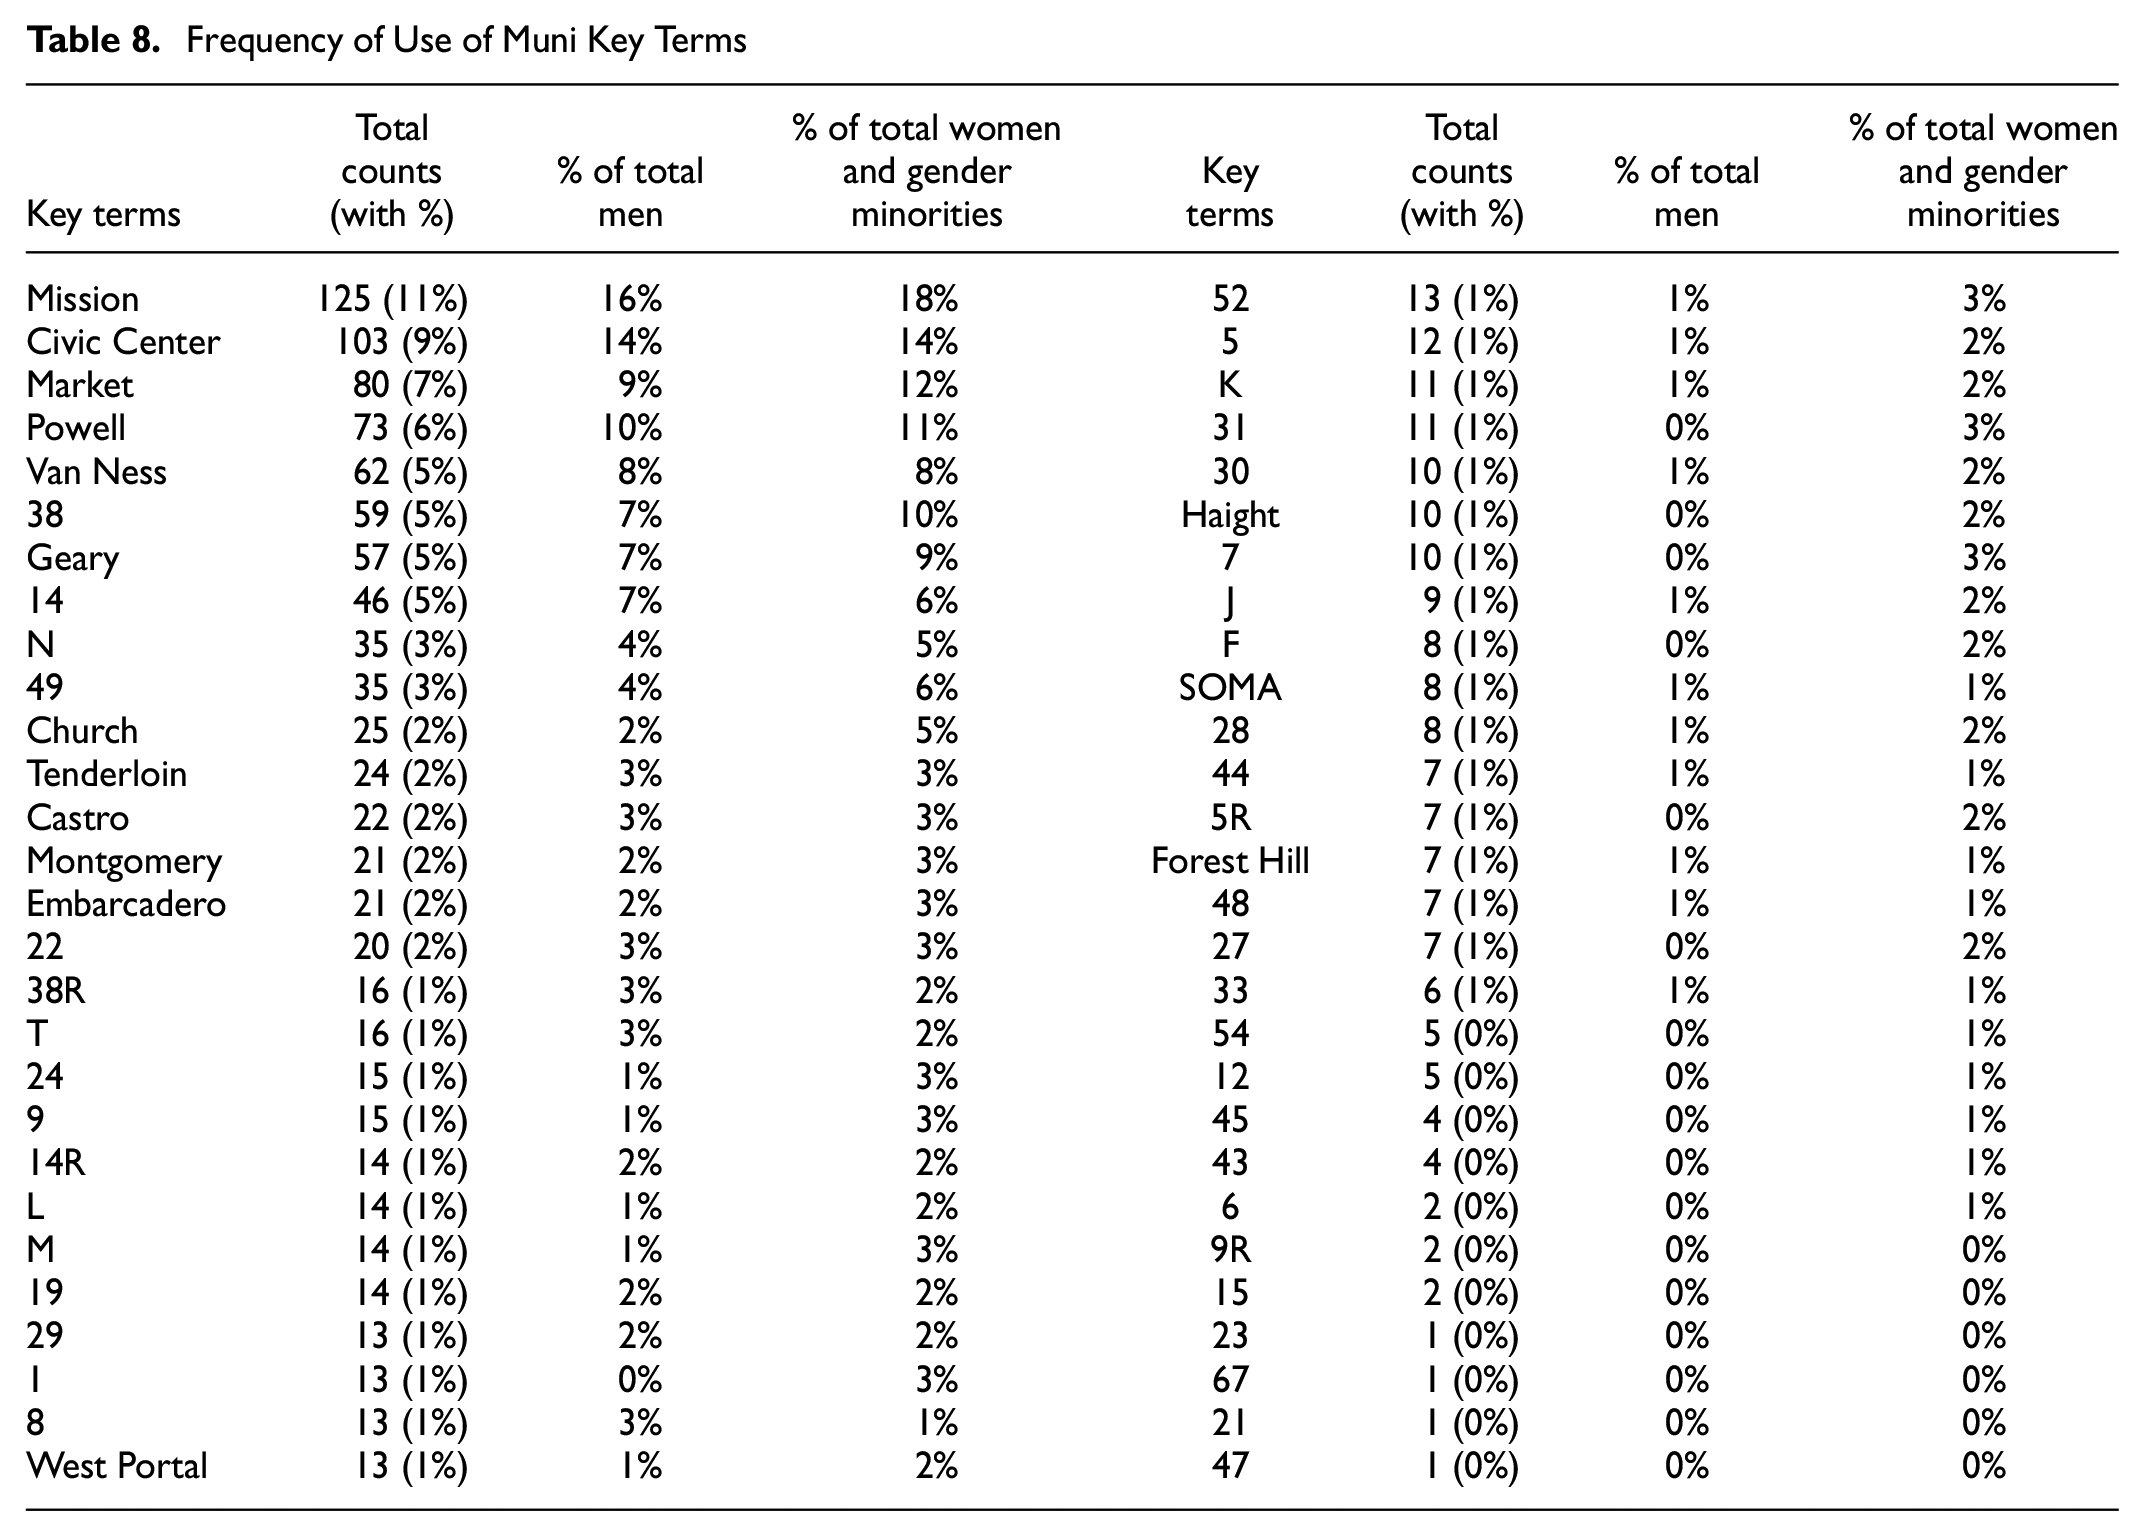
Other than the Muni Metro, the bus route that has the highest frequency of people reporting experiencing harassment is the 38 Geary. Once the data is disaggregated by gender, there are disparities between the Muni stations and lines where men and women/gender minorities have experienced harassment. Women and gender minorities are combined, with 291 written responses from men and 397 written responses from women and gender minorities. There is a slightly higher percentage of women and gender minorities experiencing harassment on 38 Geary (10%) compared with men (7%). We see a general trend that women and gender minorities experience harassment in more dispersed locations and have a higher frequency of harassment on buses than men. This trend is consistent with the spatial analysis in the following section.
Spatial Analysis
To recommend where safety interventions should be prioritized, particularly for women and gender minorities, we analyzed the spatial patterns of gender-based harassment in San Francisco based on our survey data. For this study, we used spatial analysis tools in ArcGIS, such as hot spot analysis, clustering, and summarize within analysis that summarize the features within a polygon.
In the survey, we asked survey takers where they had experienced or seen gender-based or sexual harassment while riding on transit, traveling to and from transit stops, or waiting at stops or stations. In the survey, there was an interactive map for respondents to pinpoint the spot of the incident or the most common spot for incidents. 299 out of 1,613 respondents (18.5%) input location data through geospatial pins. Here we are using these points for a spatial analysis.
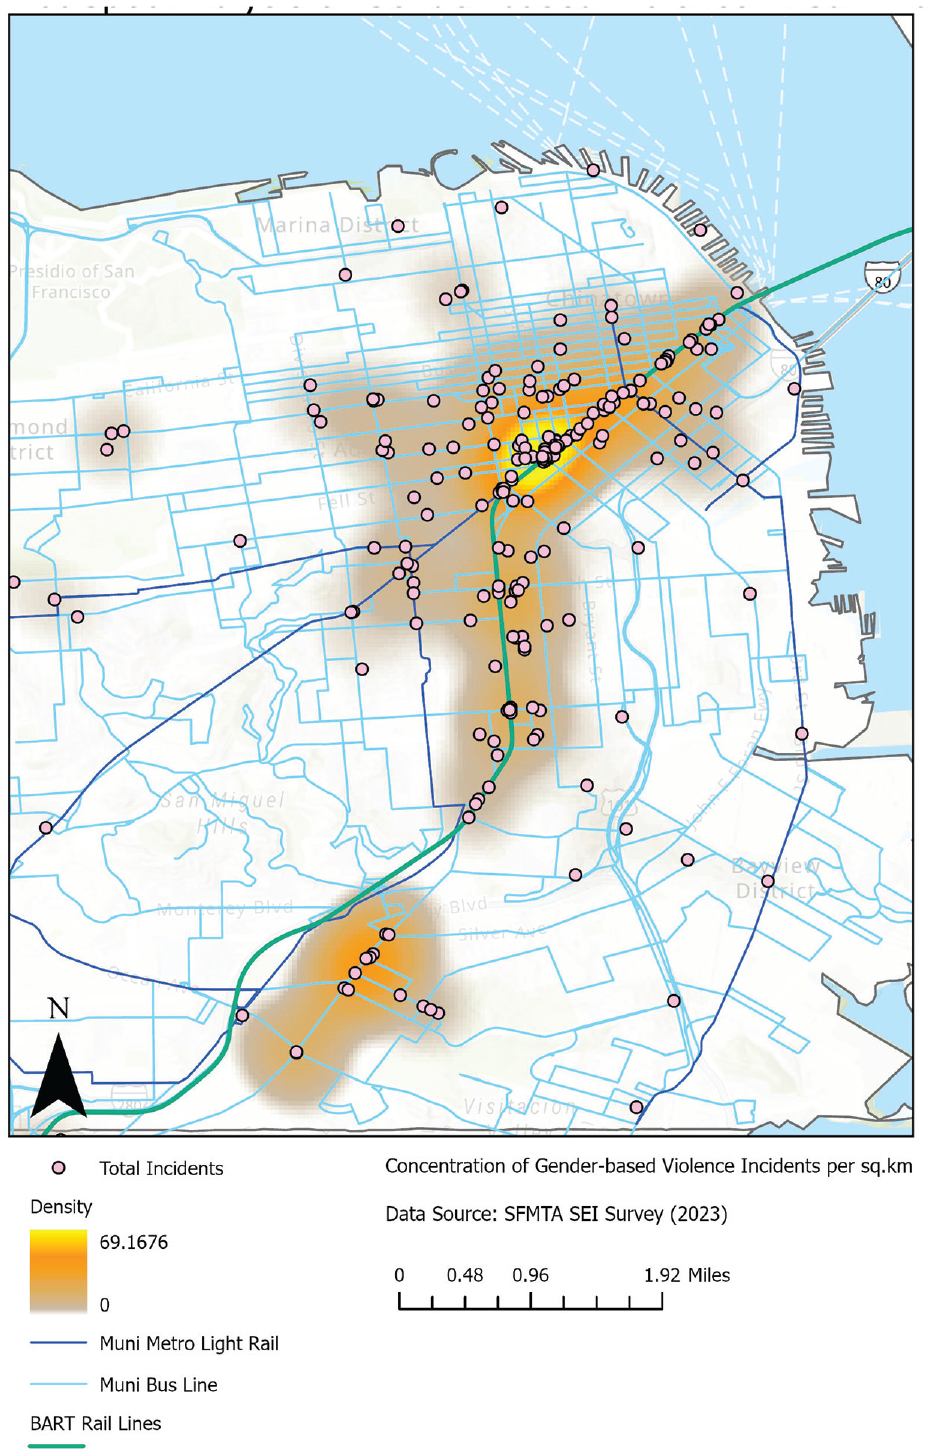
Figure 1 visualizes densities or concentrations of incident points over the City of San Francisco. The map on the left was generated through kernel density, calculating a 1-mi search radius (a radius used in the algorithm to calculate density). In this map, we see two clusters; one is in downtown San Francisco, and the other is around Mission Terrace. For downtown San Francisco, the neighborhoods are Civic Center, Tenderloin, Cathedral Hill, Hayes Valley, Mint Hill, and Showplace Square. The other cluster includes the neighborhoods Mission Terrace and Excelsior.
Hot spot analysis of gender-based harassment incidents in San Francisco.
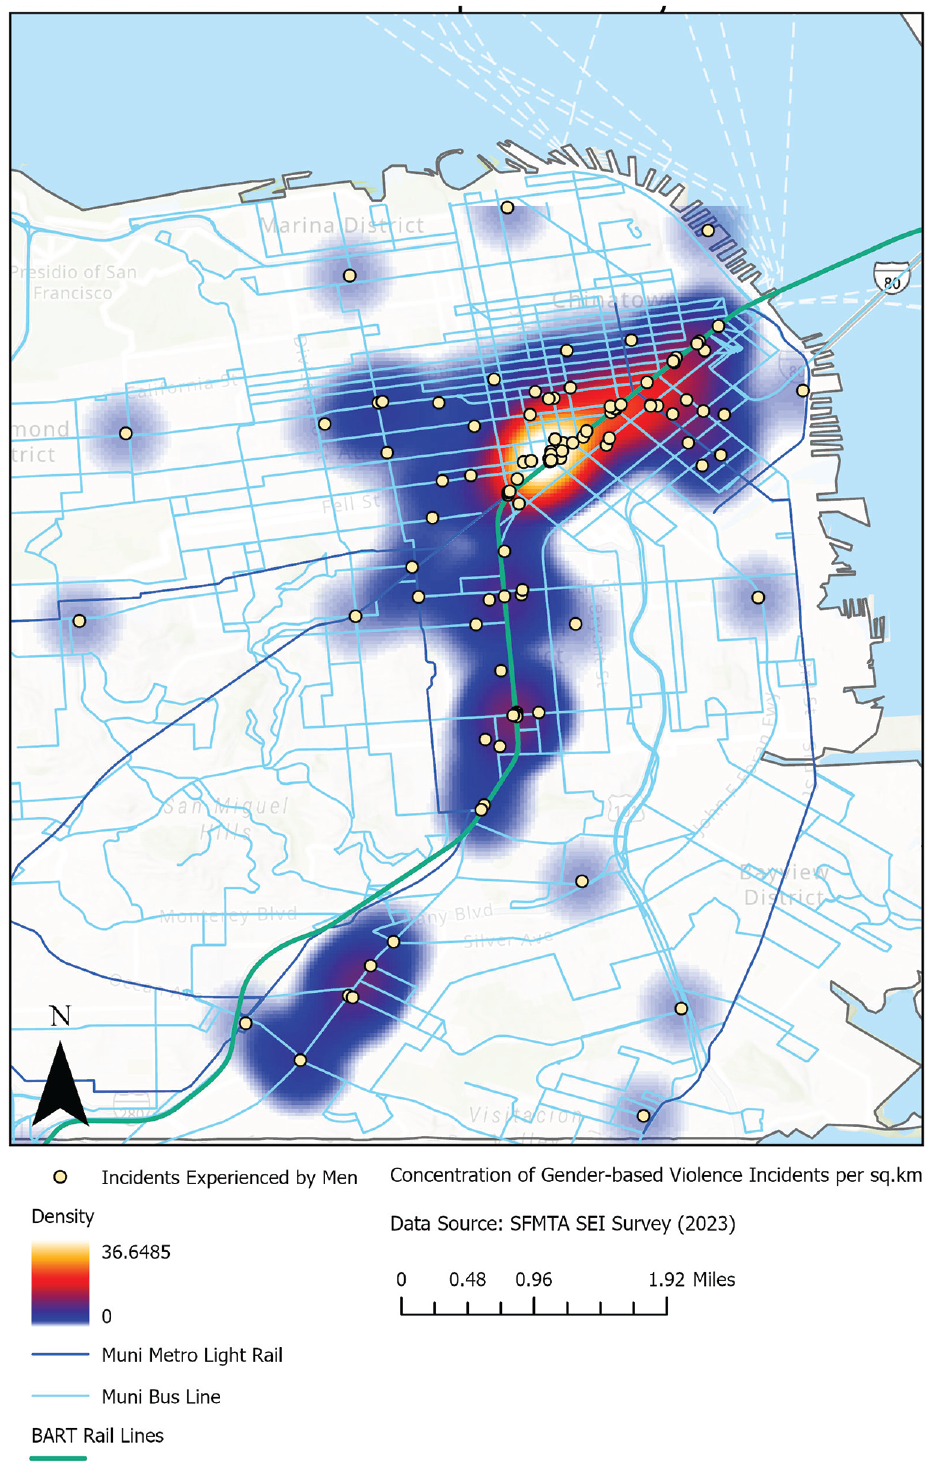
Figure 2 demonstrates the hot spots when we disaggregate the incident points by gender. Male respondents reported experiencing a total of 122 incidents. The concentration of men experiencing harassment is mainly located in downtown San Francisco. Lower Nob Hill, Tenderloin, Civic Center, and South of Market neighborhoods are hot spots.
Hot spot analysis of gender-based harassment experienced by men in San Francisco.
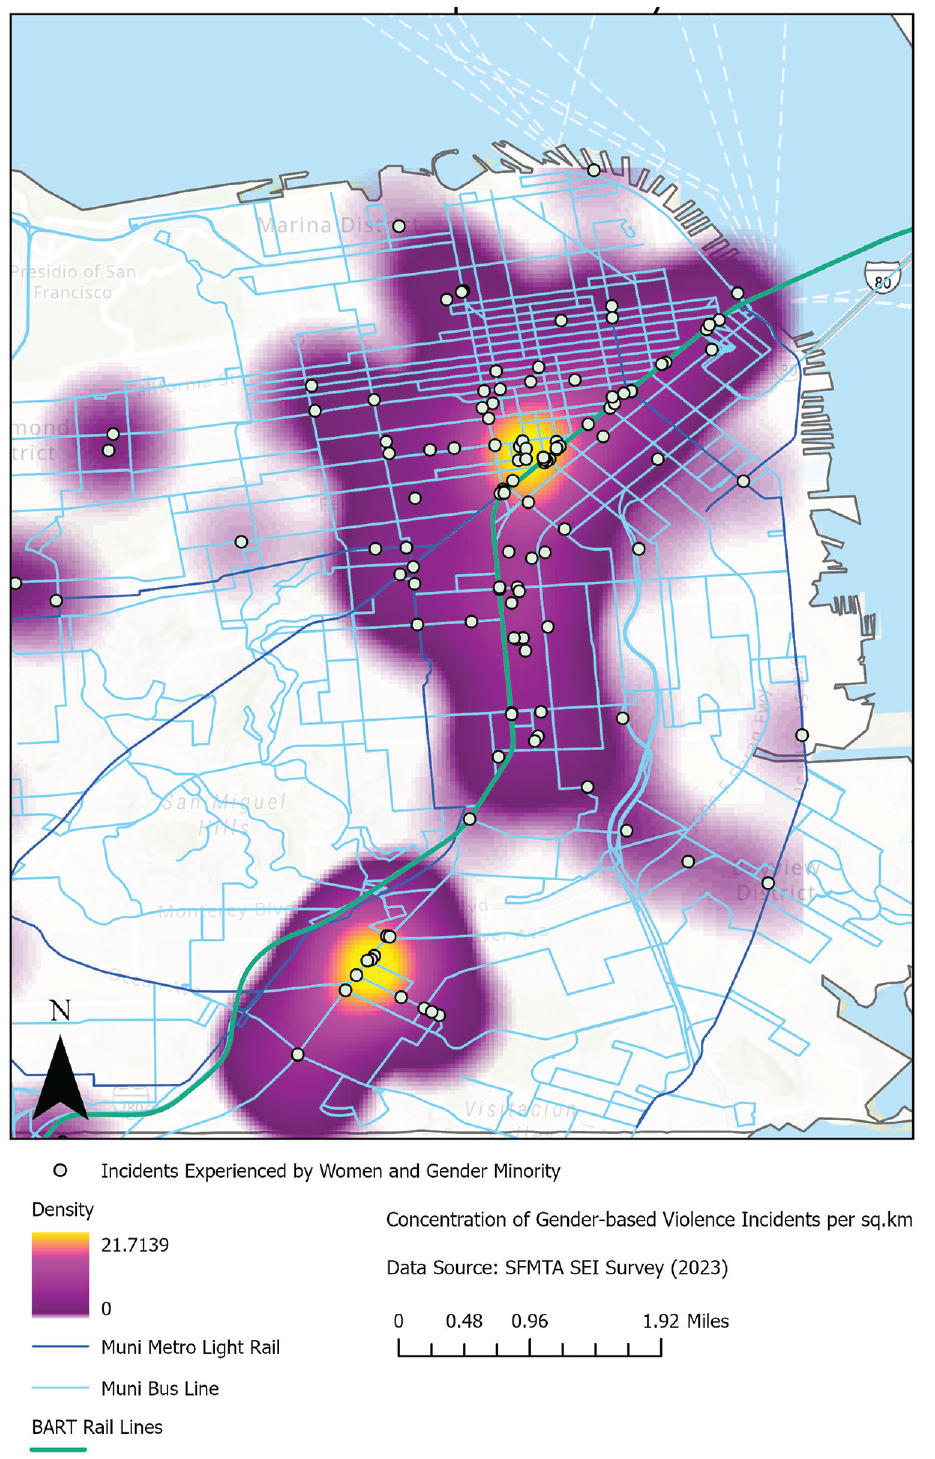
Figure 3 demonstrates the hot spots for harassment experienced by women and gender minorities. There are 129 incident points where women and gender minorities experienced harassment. The concentration of women and gender minorities experiencing harassment is mainly in downtown San Francisco, Mission Terrace, and Excelsior.
Hot spot analysis of gender-based harassment experienced by women and gender minorities in San Francisco.
Comparing hot spots where all respondents, men and women, and gender minorities experienced harassment, we see a high density of incidents in downtown San Francisco; both men and women/gender minorities have experienced the most incidents in these areas. Women and gender minorities have experienced gender-based harassment in more locations and more dispersed areas than men.
By overlaying the incident heatmap with the Muni layers, including the transit routes and stops, we can see which routes and stops have gender-based harassment clusters. The incidents were counted more than once (across multiple lines) because the analysis takes into account all incidents in a buffer of 100 m from a Muni route or station. Figure 4 calculates the number of incidents within a 100 m distance of Muni transit routes and demonstrates the transit lines that would need prioritization and safety improvements. The data points from verbatim comments were also added. We see that the five routes with the highest gender-based harassment reports are 14 Mission, N Judah Muni Metro, 49 Van Ness/Mission, L Owl, and M Muni Metro. The 14 Mission has a total of 123 incidents and passes through downtown/civic center and the Mission. The L Owl is an all-nighter service and runs every half hour between 1 and 5 a.m. nightly, serving off-peak commuters. These top five Muni routes also appeared to be the busiest with the most ridership since they operate downtown with increased service. The probability of encountering harassment might be the same throughout all routes, but Muni riders will be more likely to witness or experience harassment when there is higher traffic compared with other areas.
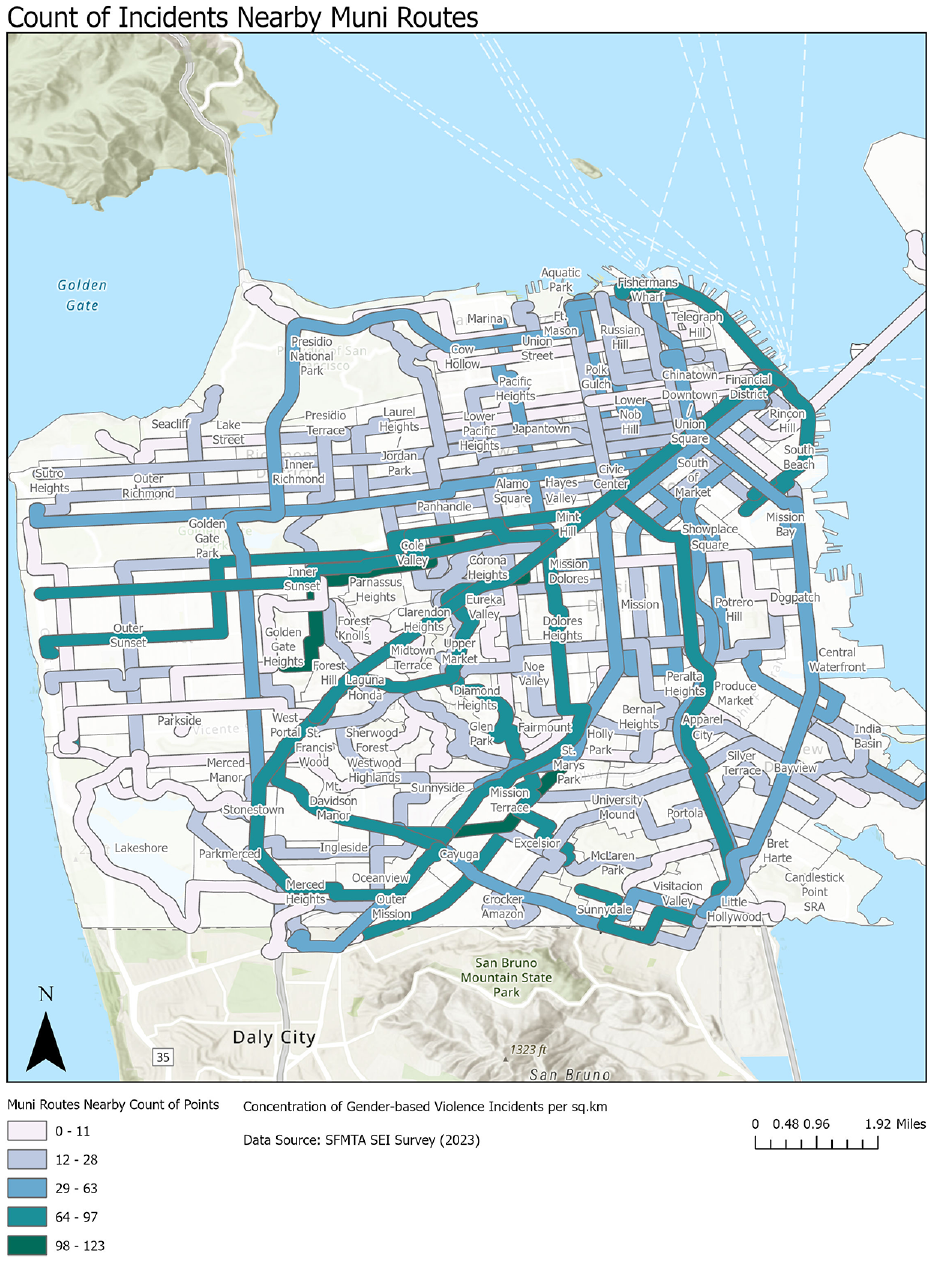
Count of incidents near Muni routes.
Using the same method of creating a buffer from transit routes, we analyzed the transit stops in Figure 5. Most stations are located in downtown San Francisco and the Mission District. The modes of transportation people experienced the most harassment are between Muni Metro trains and buses. By summing the number of incidents on each transit route and categorizing them by the two modes of trains and buses, a total of 1,583 incidents are identified on Muni buses, however this number includes some spots where incidents are double counted as some bus routes overlap or are very close to each other.
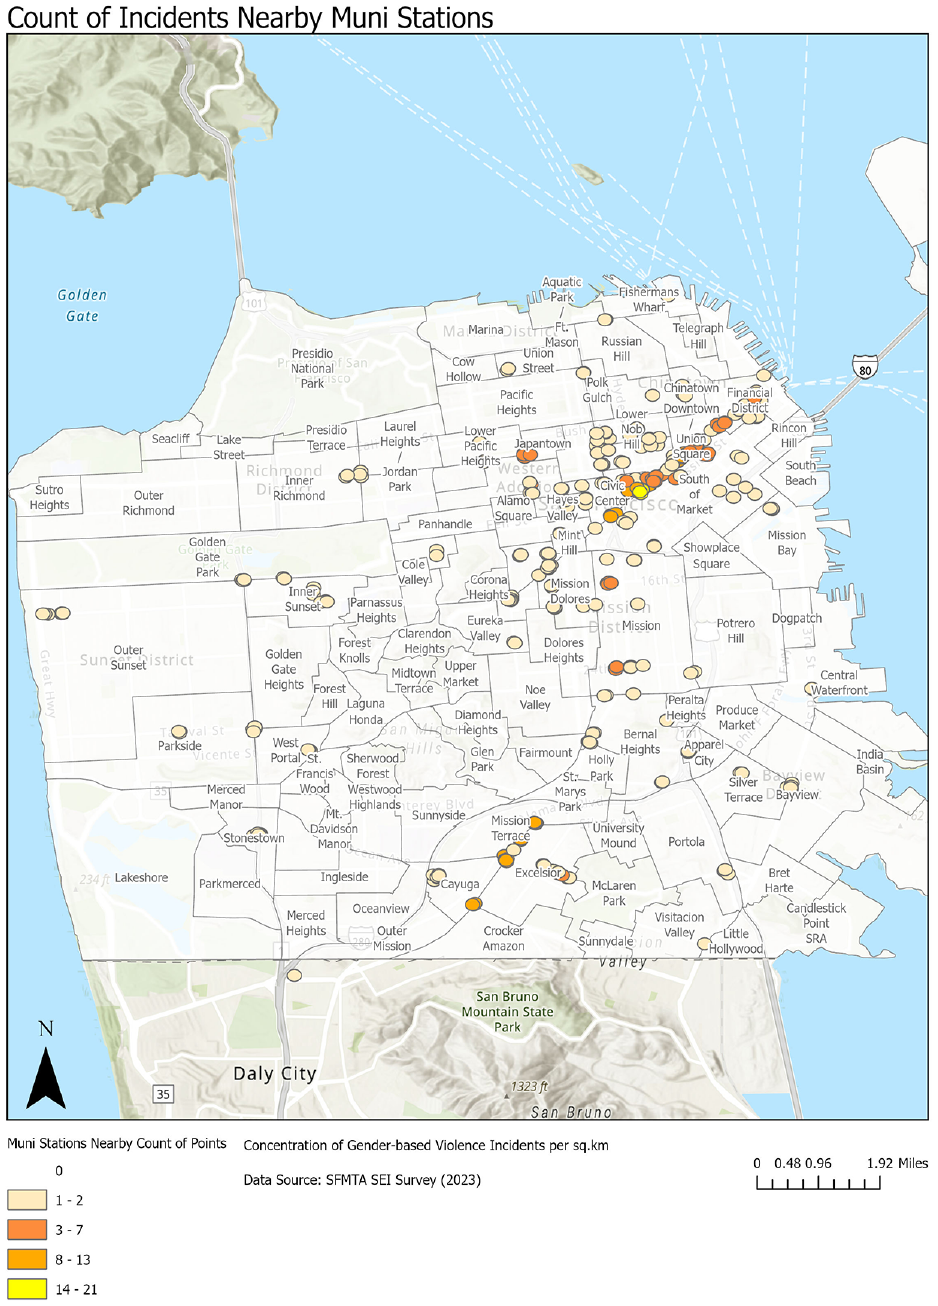
Count of incidents near Muni stations.
To continue to understand the location of harassment incidents on Muni, future research should compare the numbers or future survey numbers with rates of harassment reported to the police or to Muni to understand how rates of harassment uncovered by this study and ongoing tracking compares with police and agency collected reports related to harassment on transit.
Reporting and Safety Interventions
To understand the magnitude of underreporting on Muni, our survey included several questions asking if respondents had reported gender-based harassment on Muni and why people chose not to report. As Figure 6 depicts, only 6% of respondents had reported incidents they witnessed or experienced, even though 66% had witnessed, and 67% had experienced harassment in the last six months. This high level of underreporting is consistent with what was found in the literature review, research conducted in New York (96% did not report incidents), Los Angeles (only 10% reported incidents), and at San Jose State University (only 10% reported incidents).
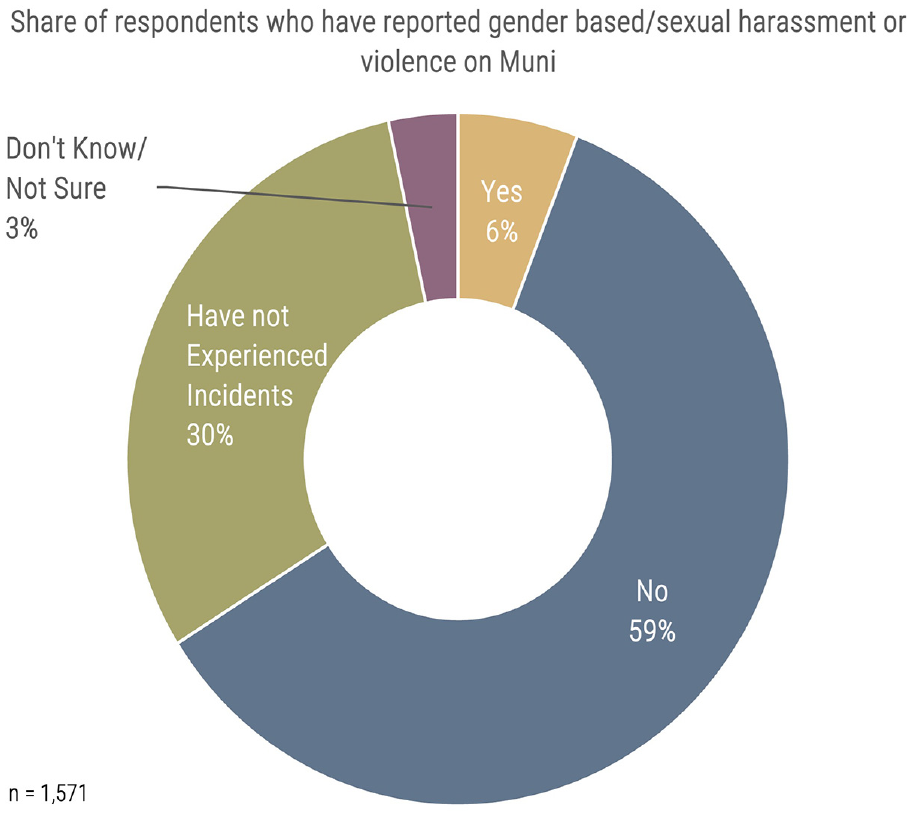
Reporting incidents.
Among, We also asked those who did not report incidents what reasons contributed to their decision to not report harassment they observed or experienced. As shown in Figure 7, we found that almost two thirds (62%) of people who did not report harassment incidents said that the reason was that they did not think reporting would make a difference. About a third of respondents said they did not think the situation was serious enough to report and 28% said they did not know how to file reports. A common write-in response to the “other” option was that people did not want to report individuals who they perceived to have mental health issues, or were experiencing homelessness, or dealing with substance abuse challenges.
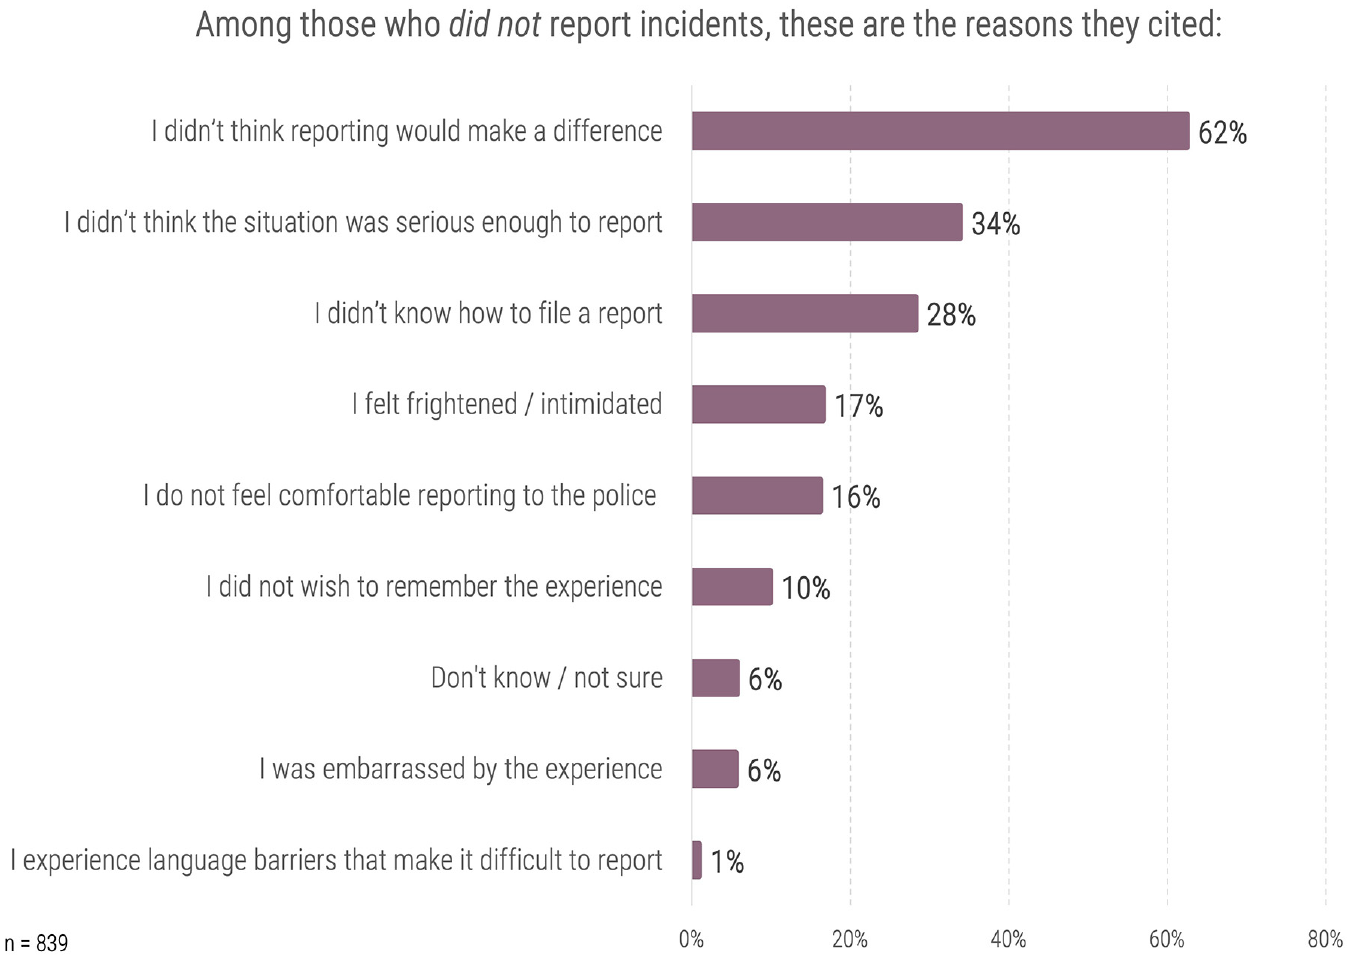
Reasons for not reporting incidents.
Some of these reasons came up in the literature. Specifically, Ball and Wesson’s ( 10 ) findings that bystanders are less likely to intervene or report when incidents are perceived to be less serious, aligns with our finding that people did not report incidents because they did not think they were serious enough. LA Metro found that people did not report because they were not aware of the main reporting channels or did not know how to submit reports, which is consistent with our finding that many individuals did not report because they didn’t know how to file a report. Furthermore, Whitzman ( 12 ) found that distrust in the justice system to provide a satisfactory response or doubt that the perpetrator would be “caught” was a top reason why people did not report. This is consistent with the main reason given in our survey, that people did not think reporting would make a difference.
The responses to why individuals did not report incidents did not vary much by demographic. Across all gender identities and race/ethnicities “I didn’t think reporting would make a difference” was the most common reason for not reporting. Similarly, the second most common reason for almost demographic groups is that they did not consider the situation serious enough to report or that they didn’t know how to file a report.
To inform potential safety interventions to improve safety on Muni, we asked respondents what types of improvements and changes would make them feel safer while traveling by Muni. Several operational (more frequent services) and design (better lighting at stations and stops) changes were among the top safety improvements that would make riders feel safer on Muni (Figure 8). Better lighting was especially popular among female, transgender, and gender non-binary people. Over half of the respondents feel security personnel in the form of transit ambassadors (56%) and police patrols (54%) at stops and stations would make traveling by Muni safer. However, this varies by demographic group. About 60% of the Hispanic/Latinx and Asian/Pacific Islander respondents felt that police patrols would make Muni safer, but under half of white and Black respondents agreed (Figure 9).
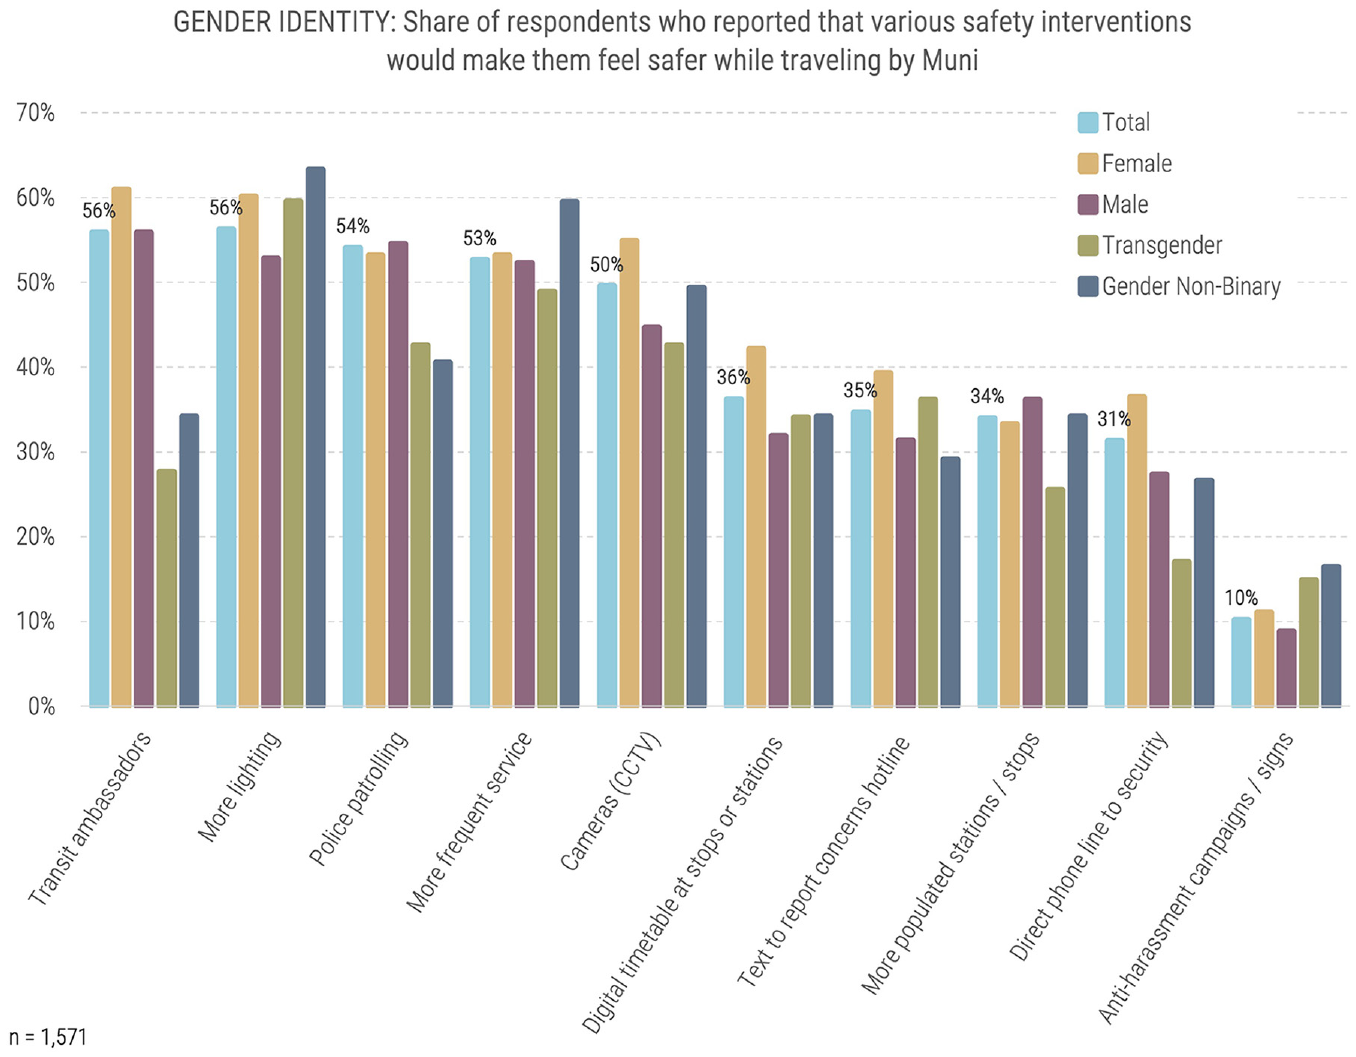
Safety Interventions (by gender identity).
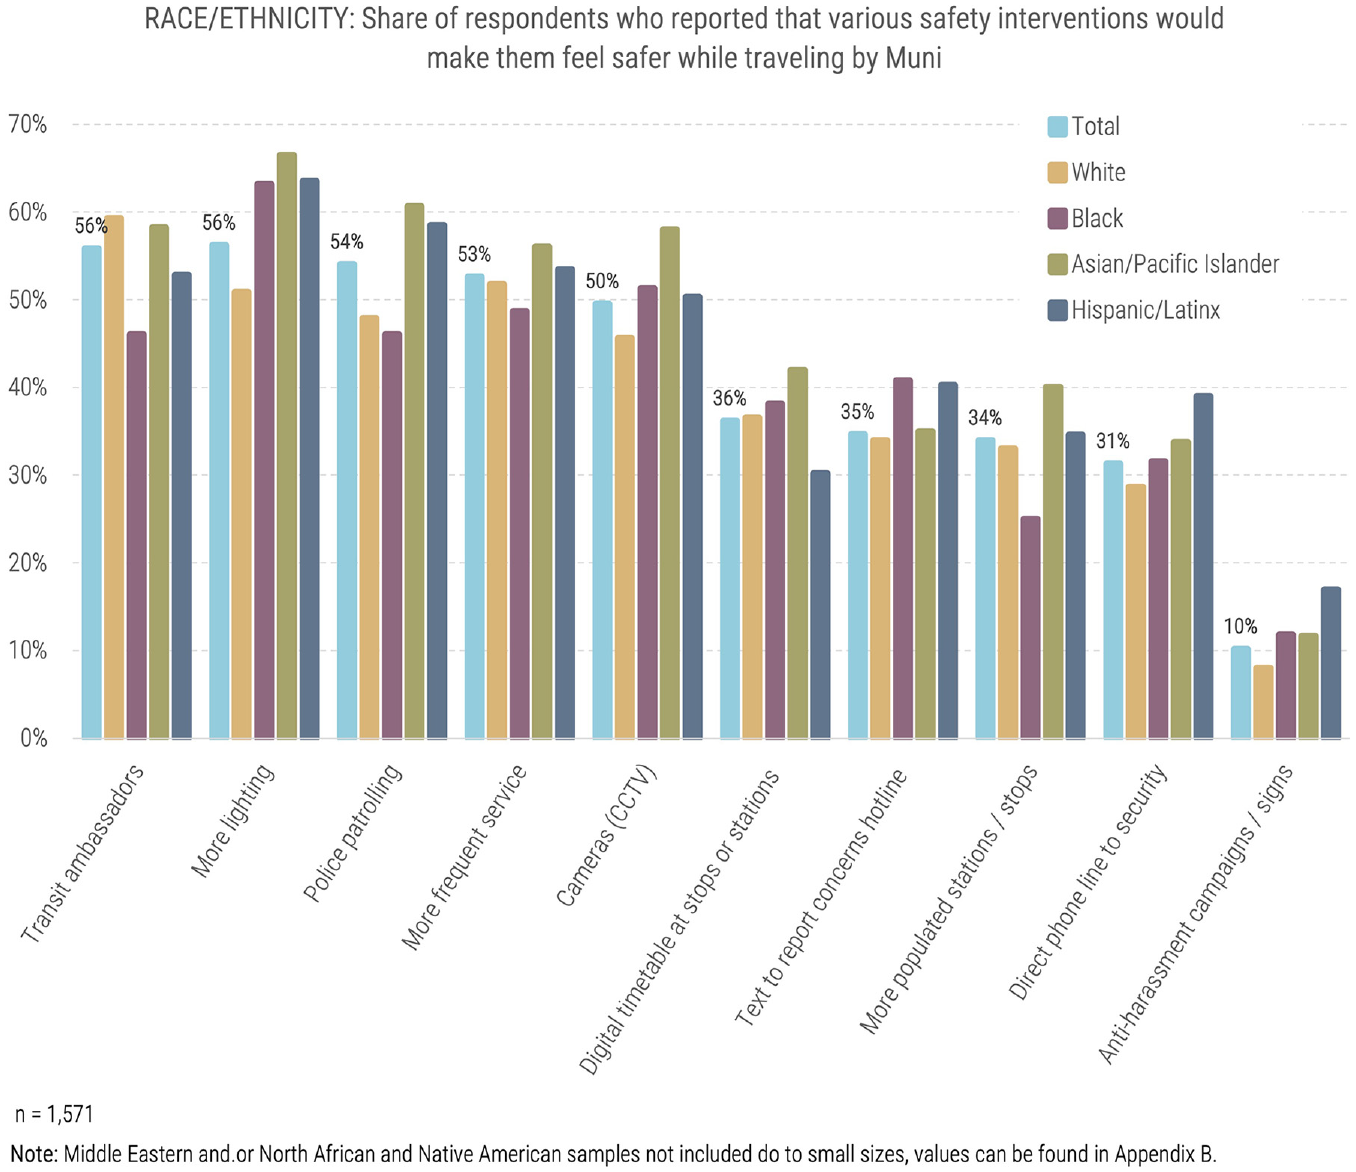
Safety Interventions (by race/ethnicity identity).
Additionally, while a similar share of white and Black respondents felt police patrols would improve safety, 60% of white respondents felt transit ambassadors would improve safety on Muni, while only 44% of Black respondents agreed. A much smaller share of transgender (28%) and gender non-binary (31%) respondents felt that transit ambassadors would improve safety, compared with over half of the female and male samples. While it was the least popular safety improvement, anti-harassment campaigns are one of the few options that were more popular among both transgender and gender non-binary people than among male/female identifying people. Female respondents were more in favor of almost all safety interventions than male respondents, except for police patrols and stations more densly populated with transit riders and stops, which male respondents were slightly more likely to select as a safety improvement.
These findings align with the harassment safety interventions documented in the literature review. For example, several studies recommended either increased security, policing, or community ambassadors. Multiple studies also recommended adapting the physical environment to increase safety, such as increasing lighting. Other safety improvement recommendations from the literature review include digital timetables, text hotlines, and phone lines to security. The literature also included various recommendations about anti-harassment campaigns, but per our survey results, only a small share of respondents agreed that these would make them feel safer on Muni.
Recommendations
We have categorized the three recommendations into three principles—service changes, infrastructure improvements, and campaigns and advocacy. Within every principle, there are several recommendations.
Advocacy and Campaigns on Reporting
Infrastructure Improvements
• Analysis of SFMTA safety training for bus operators to evaluate the program and identify areas for improvement. • On-board alert systems to inform bus operators when there is an active harassment incident. • More buses during peak hour along routes passing through downtown San Francisco to cut down on wait times at stops and stations (where riders reported feeling the least safe), reduce overcrowding that could lead to groping incidents, and so forth.
Service Changes
Conclusions
Our research underscores the importance of addressing gender-based harassment on the Muni transit system in San Francisco. Our findings demonstrating that harassment on transit disproportionately affects women and gender minorities, as well as non-white riders, demonstrates that the Muni system is no exception to the trends that have been uncovered in past research and on other transit systems. The high rate of underreporting of harassment incidents among Muni riders exemplifies the need to build awareness about how and where to report incidents. Additionally, various findings related to perceptions of safety and harassment events across different parts of the Muni system show the need for service- and infrastructure-based changes to address harassment.
These findings are addressed within our set of recommendations. The suggested changes to services, infrastructure improvements, and advocacy related to reporting incidents are all aimed at addressing the high rates of fear and experiences of harassment on transit that we uncovered among Muni riders. Addressing this issue is of the utmost importance, so that Muni riders—especially women, gender minorities, racial/ethnic minorities, and transit dependent riders—have proper access to mobility without fearing for their safety or feeling uncomfortable while traveling by transit.
Footnotes
Author Contributions
The authors confirm contribution to the paper as follows: study conception and design: P. Liu, G. Cowan; data collection: P. Liu, G. Cowan; analysis and interpretation of results: P. Liu, G. Cowan; draft manuscript preparation: P. Liu, G. Cowan. All authors reviewed the results and approved the final version of the manuscript.
Declaration of Conflicting Interests
The author(s) declared no potential conflicts of interest with respect to the research, authorship, and/or publication of this article.
Funding
The author(s) disclosed receipt of the following financial support for the research, authorship, and/or publication of this article: This work was supported by two UCLA Institute of Transportation Studies capstone fellowship awards in the 2022–25 fellowship period (one per author); funding was also provided for the research from SFMTA contract number: SFMTA-2023-65.