
Abstract
This research paper focuses on the feasibility of thick-lift paving with asphalt concrete. Thick-lift paving is the placement of asphalt concrete in a lift greater than the allowable maximum by an agency, often four to five times the nominal maximum aggregate size. Thick-lift paving offers potential benefits including streamlining operations and eliminating the bond interface in multi-lift layers. However, it also presents challenges such as potential for inadequate compaction and lower ride quality. Asphalt concrete design and construction specifications from 19 state Departments of Transportation were reviewed. In the field, 28 thick-paving test sections were constructed with different lift thicknesses (3 to 10 in.), two mix designs, different paving screed settings, and different rolling patterns. All pavers were equipped with tamper bar screeds. During construction, the researchers monitored asphalt cooldown time and mat density. After construction, the ride quality of each section was measured, and cores were tested for air voids content. Acceptable mat compaction was achieved in all test sections, with additional roller passes having the most significant effect on compaction. The study also found that thick one-lift layers yielded better and more uniform compaction than two-lift layers. Thicker lifts had significantly longer cool down times and potentially increased roughness. Recommendations included the possible use of tamper bar screeds and additional roller passes to improve compaction. Scenarios that are suitable for thick-lift paving were identified.
The lift thickness when placing asphalt concrete can have a significant influence on constructability and on the final quality of the pavement layer. The minimum lift thickness is typically three times the nominal maximum aggregate size (NMAS), and in Texas, the maximum lift thickness is approximately four to five times the NMAS.
Thick-lift paving is the placement of asphalt concrete in a lift greater than the allowable maximum. With thick-lift paving, a contractor can construct a thick design layer in a single lift instead of two or three separate lifts. In this study, mixtures were compacted to 6 to 10 in. in a single lift. This approach can provide the following benefits:
streamlines paving operations;
eliminates bond interface that could be a potential weak point;
saves money by eliminating the mid-layer tack coat.
Still, there are unique challenges and concerns with thick-lift paving:
potential for inadequate and non-uniform compaction;
potential for lower ride quality;
long cooldown times;
more critical timing of mix delivery.
A tamper bar screed might address issues of poor compaction and ride quality. Tamper bar screeds are designed to provide greater compaction behind the paver than a typical vibratory screed. Improving initial laydown compaction might improve overall compaction uniformity and reduce roughness introduced by excessive roll-down of the uncompacted mat. The screeds may have one or two tamper bars, zero to two pressure bars, and are integrated with a vibratory or static screed plate.
The purpose of this research, therefore, was to determine whether satisfactory air voids content and roughness can be practically achieved with thick-lift paving, and to identify the best practices to do so.
Background
Influential Factors of Asphalt Mixture Compaction
Compaction of asphalt concrete is the processes of reducing air voids in the mixture, pushing and reorienting aggregate particles to a dense configuration, by applying external compression and shear forces. High in-place air voids content (air voids) permit water and air to penetrate into the pavement which can lead to moisture damage, aging, raveling, and cracking ( 1 ). Several factors affect the final in-place air voids of an asphalt concrete pavement ( 2 ), including:
mixture design;
mixture temperature and environmental conditions;
construction practices (including lift thickness);
supporting layer stiffness.
Mixture Design
The mixture design properties that affect workability are gradation, aggregate properties, asphalt binder content, binder stiffness, and binder additives. Relevant to this project, the maximum aggregate size plays a significant role in compactability. All else equal, a mixture with larger aggregates will have higher density (lower air voids), because the aggregate, the densest component in the mixture, will consume a larger percentage of a unit volume. As discussed later, the maximum aggregate size also plays a role in the desired lift thickness ( 3 , 4 ).
Mixture Temperature and Environmental Conditions
Since asphalt binder stiffness and viscosity are temperature dependent, a lower mixture temperature will increase binder stiffness and thus, decrease mixture compactability. Environmental conditions affect to the rate of heat loss from the asphalt mixture. Air temperature, ground temperature and moisture content, wind speed, and solar irradiance will affect the cooling rate of the asphalt mat and will determine the amount of time available for compaction.
Construction Practices
The lift thickness during construction has a significant contribution to the ability to achieve adequate compaction. Different studies conducted by Mississippi Departments of Transportation (DOT) ( 1 ), Florida DOT ( 5 ), and Wisconsin DOT ( 6 ) evaluated the effect of lift thickness on the in-place density. The results of these studies support the findings through National Cooperative Highway Research Program (NCHRP) Project 9-27 ( 7 ), that compactability improves for thicker lifts. This is because (1) the mat maintains a high temperature for a longer time, and (2) the aggregates have more room for reorientation and can slide past each other, making it easier to obtain the desired density.
The effect of lift thickness is closely related to the mixture’s NMAS, especially relating to the minimum allowable lift thickness. One concern for placing very thick lifts is with the density uniformity within the layer. Specifically, does compacting excessively thick lifts leave high air voids at the bottom of the lift.
The compaction effort is provided by the paver screed and various rollers. Compaction equipment applies downward forces to the mat surface, and the heavier the equipment and the slower the equipment moves, the more compaction occurs. In most cases, the equipment also generates shear stress by applying vibrating or oscillating force. High shearing stresses help rearrange the aggregates into denser configurations with greater particle interlock ( 8 ).
In this study, different paving screed settings and roller patterns were evaluated. The screed is responsible for initial compaction and producing a tight, uniform surface texture. A typical vibratory screed achieves 75% to 85% density. A high compaction screed equipped with additional compaction devices (tamper bars and pressure bars) can achieve higher densities. An article in Asphalt Contractor Magazine claims up to 96% density behind the screed ( 9 ). The rolling pattern consists of the type of rollers, the number of passes for each roller, and the location on the mat of each pass. The pattern is often determined by monitoring the mat density with a density gage immediately after the paver screed and between each roller pass.
Practices for Thick-Lift Asphalt Concrete Paving
The research team reviewed asphalt concrete design and construction specifications for 19 state DOTs, the Asphalt Institute, and the Australian transportation body, Austroads ( 10 – 30 ). Often different lift thicknesses would be prescribed depending on the mixture type and the location of the layer within the pavement.
The allowable maximum lift thicknesses for the 19 states and Australia ranged from 1.5 in. (a 0.375-in.-mixture in New Mexico) to 7.75 in. (a 2-in. base course mixture in Ohio). Base courses in Arizona and Louisiana do not have lift-thickness maximums, and California, Illinois, Massachusetts, and Minnesota, do not have any maximum lift thickness requirements.
Figure 1 shows the allowed thickness to NMAS ratios (t/NMAS) for each agency. The t/NMAS ratios typically ranged from 3.0 to 6.0. Texas goes as high as 5.3 with their Item 341 Type C mixture. Wisconsin and South Carolina allow a ratio of 8.0, Oregon goes to 10.8, and Arizona, California, Illinois, Louisiana, Massachusetts, and Minnesota have no limits on some or all their mixtures. Most agencies provided additional guidance for laydown and compaction procedures of thick-lift construction, including allowing a lower mixture, pavement, or ambient temperature for laydown.
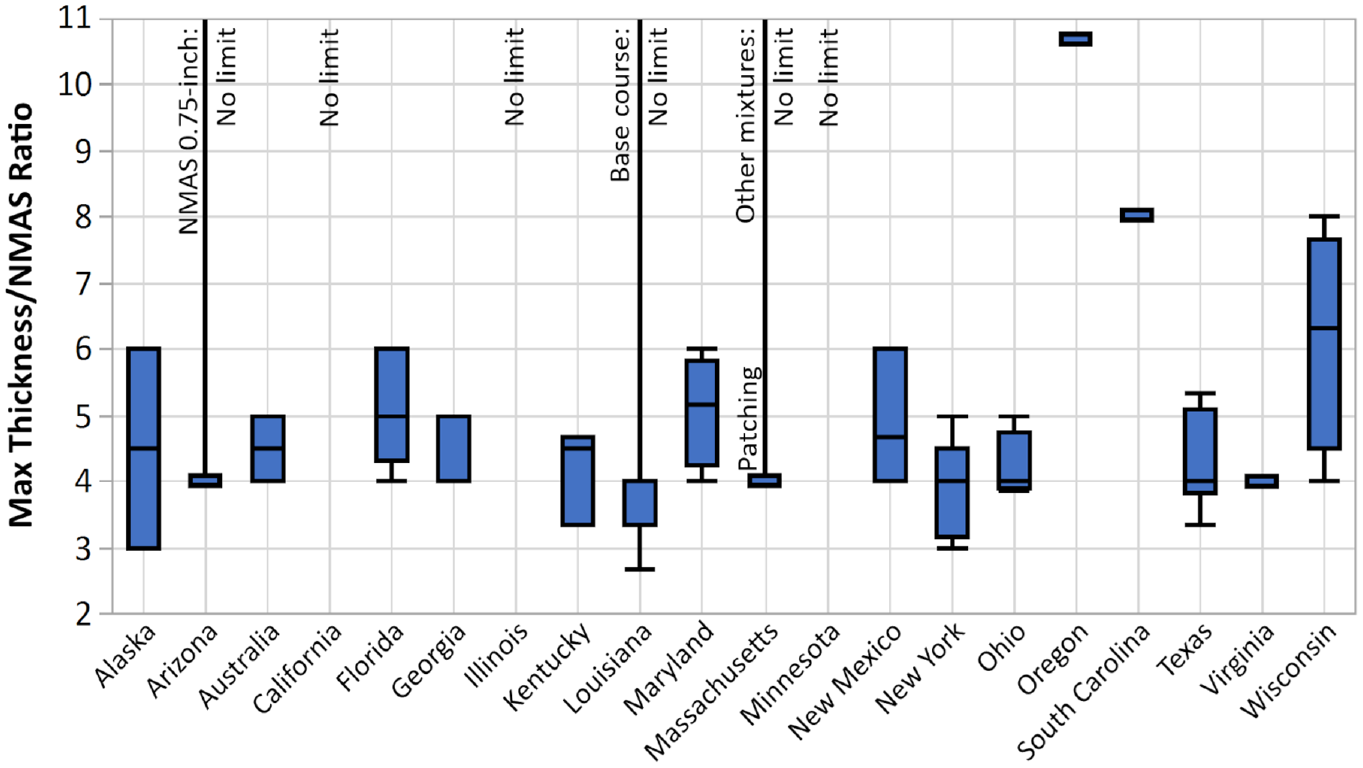
Allowable thickness/nominal maximum aggregate size (t/NMAS) ratios by State.
Methodology
Test Section Construction
Four sets of test sections were constructed in Texas on thick paving projects in the Tyler, Atlanta, and Dallas Districts. The total compacted layer thicknesses ranged from 6 to 10 in. Test sections involved placing the layer in one and two lifts, adjusting the paving screed settings, and adding additional passes to the rolling pattern. Test sections within each project were constructed end-to-end and were between 250 and 500 ft long. Details for the 28 total test sections are given in Table 1.
Test Section Details
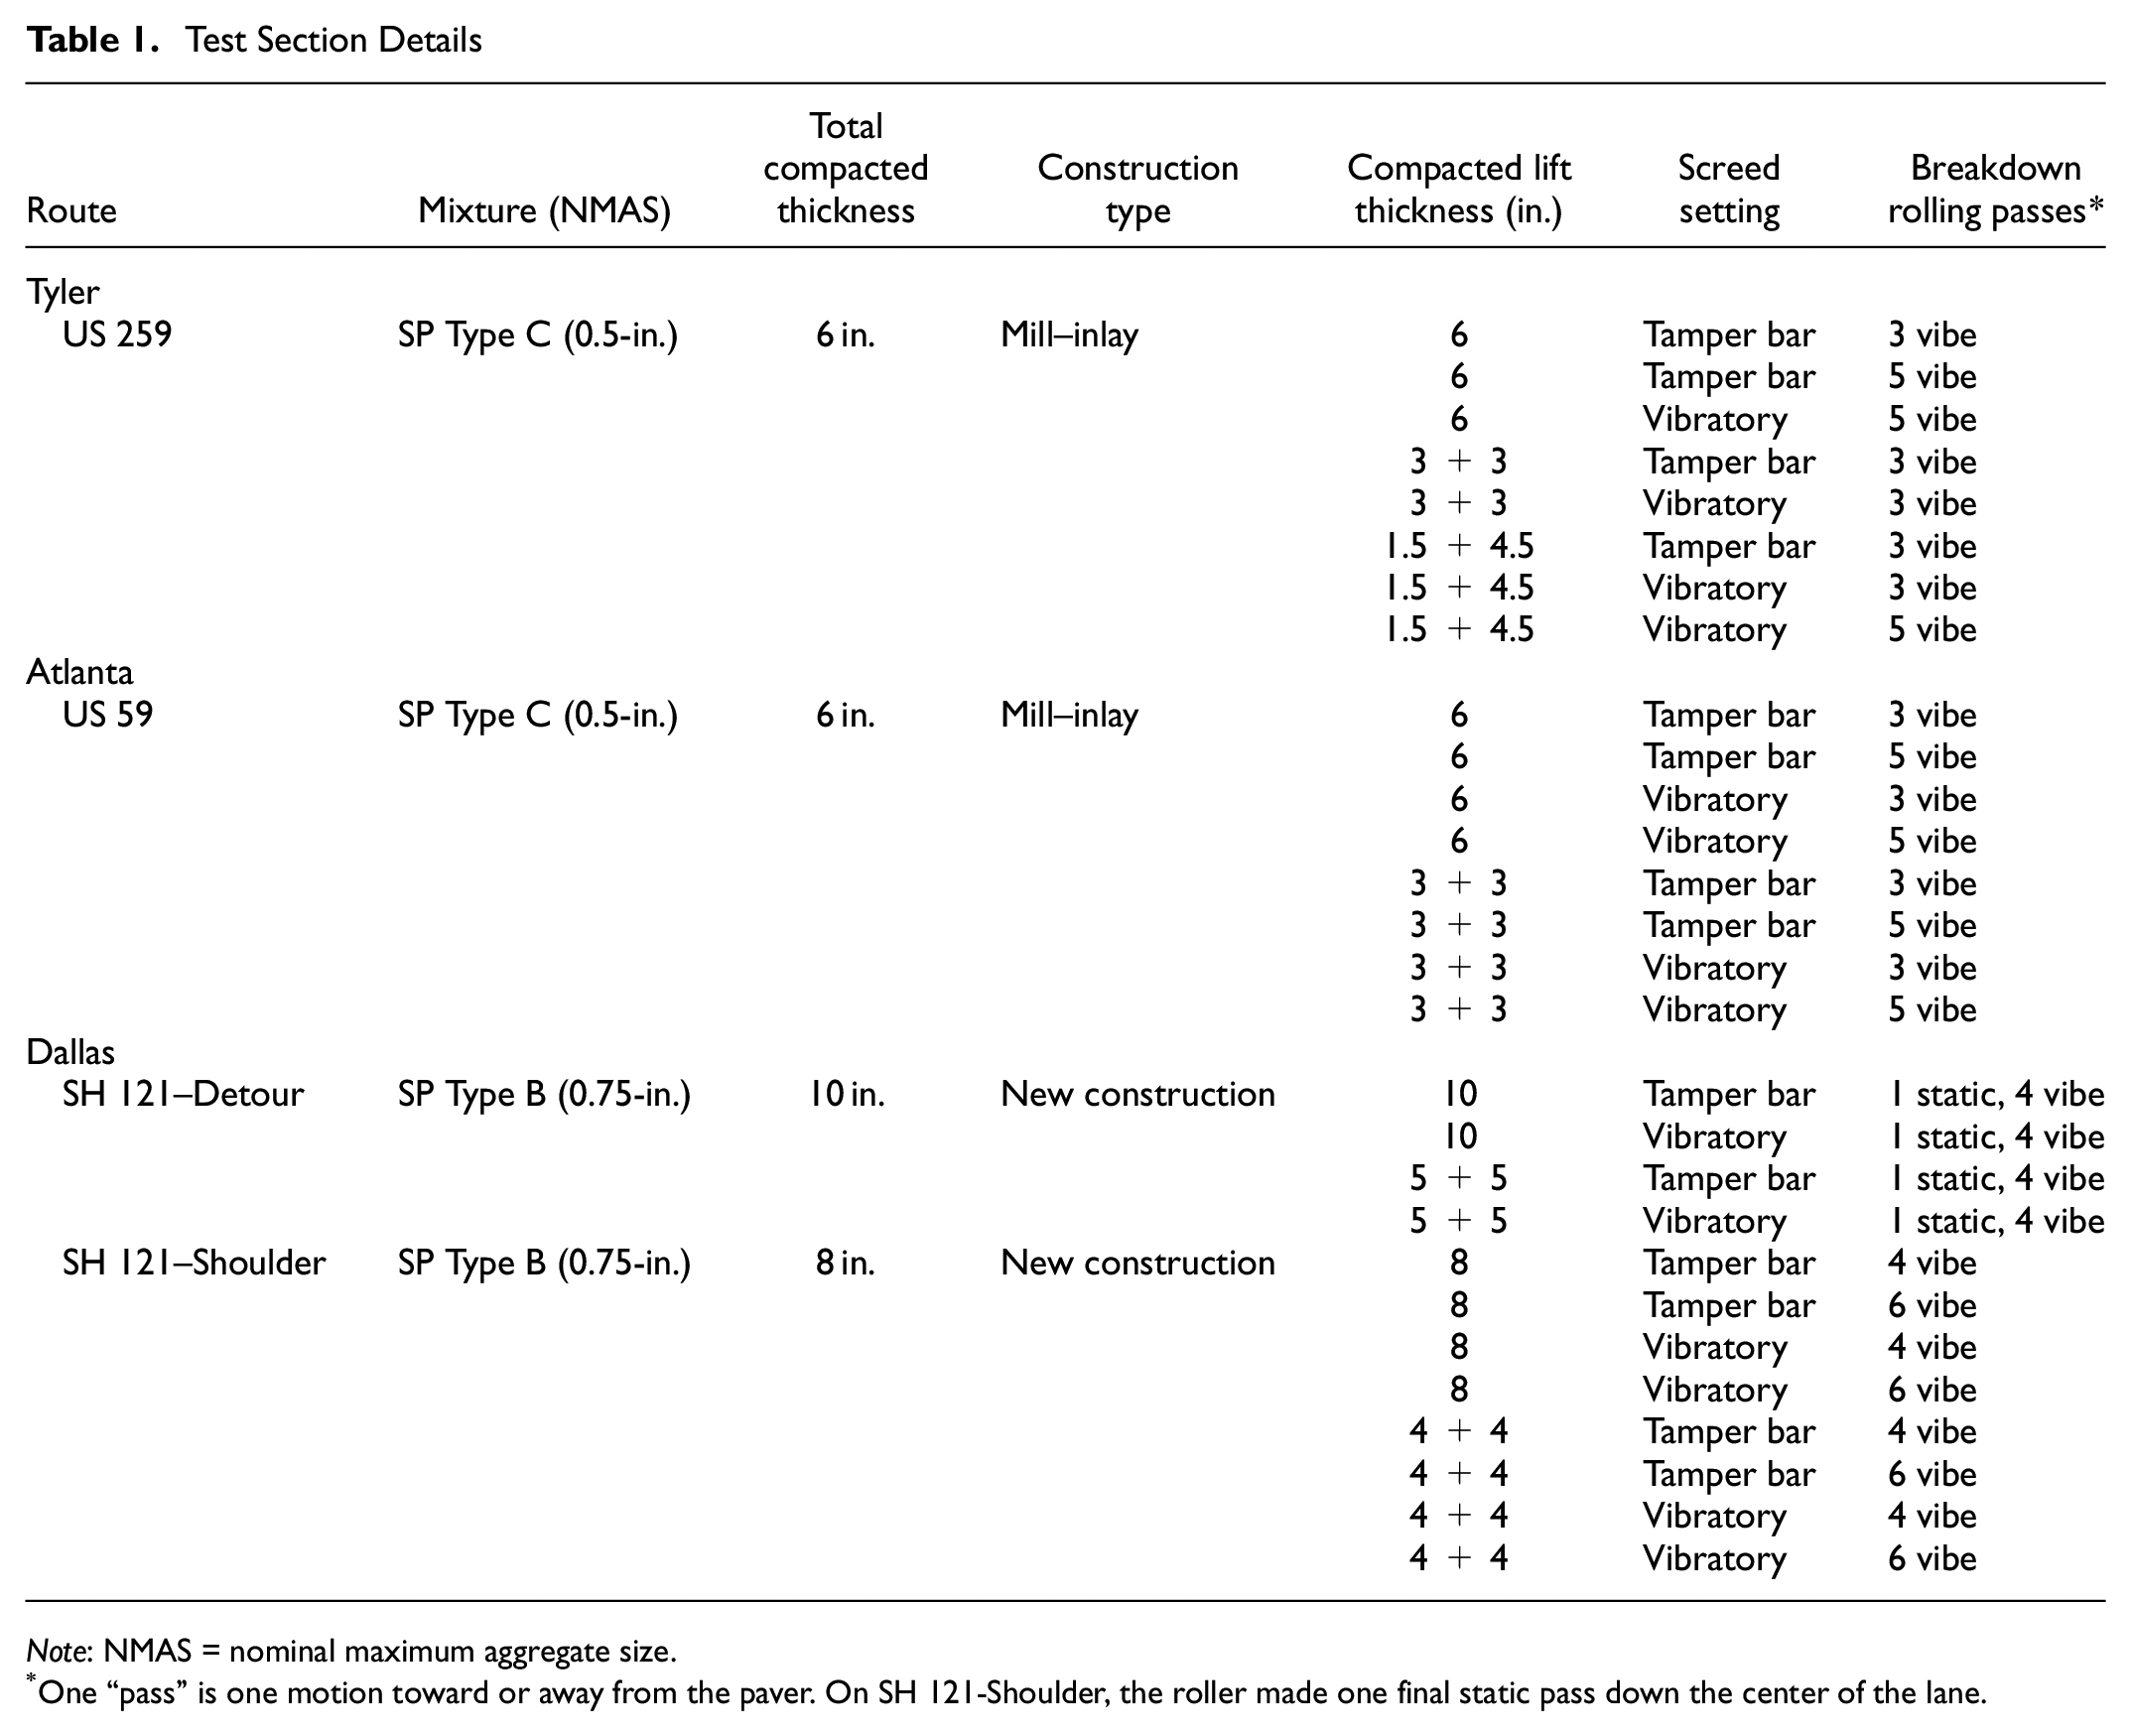
Note: NMAS = nominal maximum aggregate size.
One “pass” is one motion toward or away from the paver. On SH 121-Shoulder, the roller made one final static pass down the center of the lane.
In an effort to determine the effect of a tamper bar screed versus a traditional vibratory screed, sections were built with the tamper bar enabled and with the bar disabled. The screed itself, however, was not changed between the sections. Since a tamper bar screed is larger and heavier than a typical vibratory screed, the additional weight of the screed could have an impact in the results. Also, the shape and angle-of-attack of the two screed types are different. The “vibratory-only” sections, therefore, should not be interpreted as paving with a typical vibratory screed.
The Tyler and Atlanta District projects were constructed by the same contractor using the same SuperPave (SP) Type C (0.5-in.) mixture. The contractor used a rented Vögele-brand paver and tamper bar screed. Two sets of test sections were built on the Dallas District project by the same contractor with a SP Type B (0.75-in.) mixture. This contactor owned a Caterpillar-brand paver and tamper bar screed. Details of the construction equipment is given in Table 2.
Construction Equipment Details
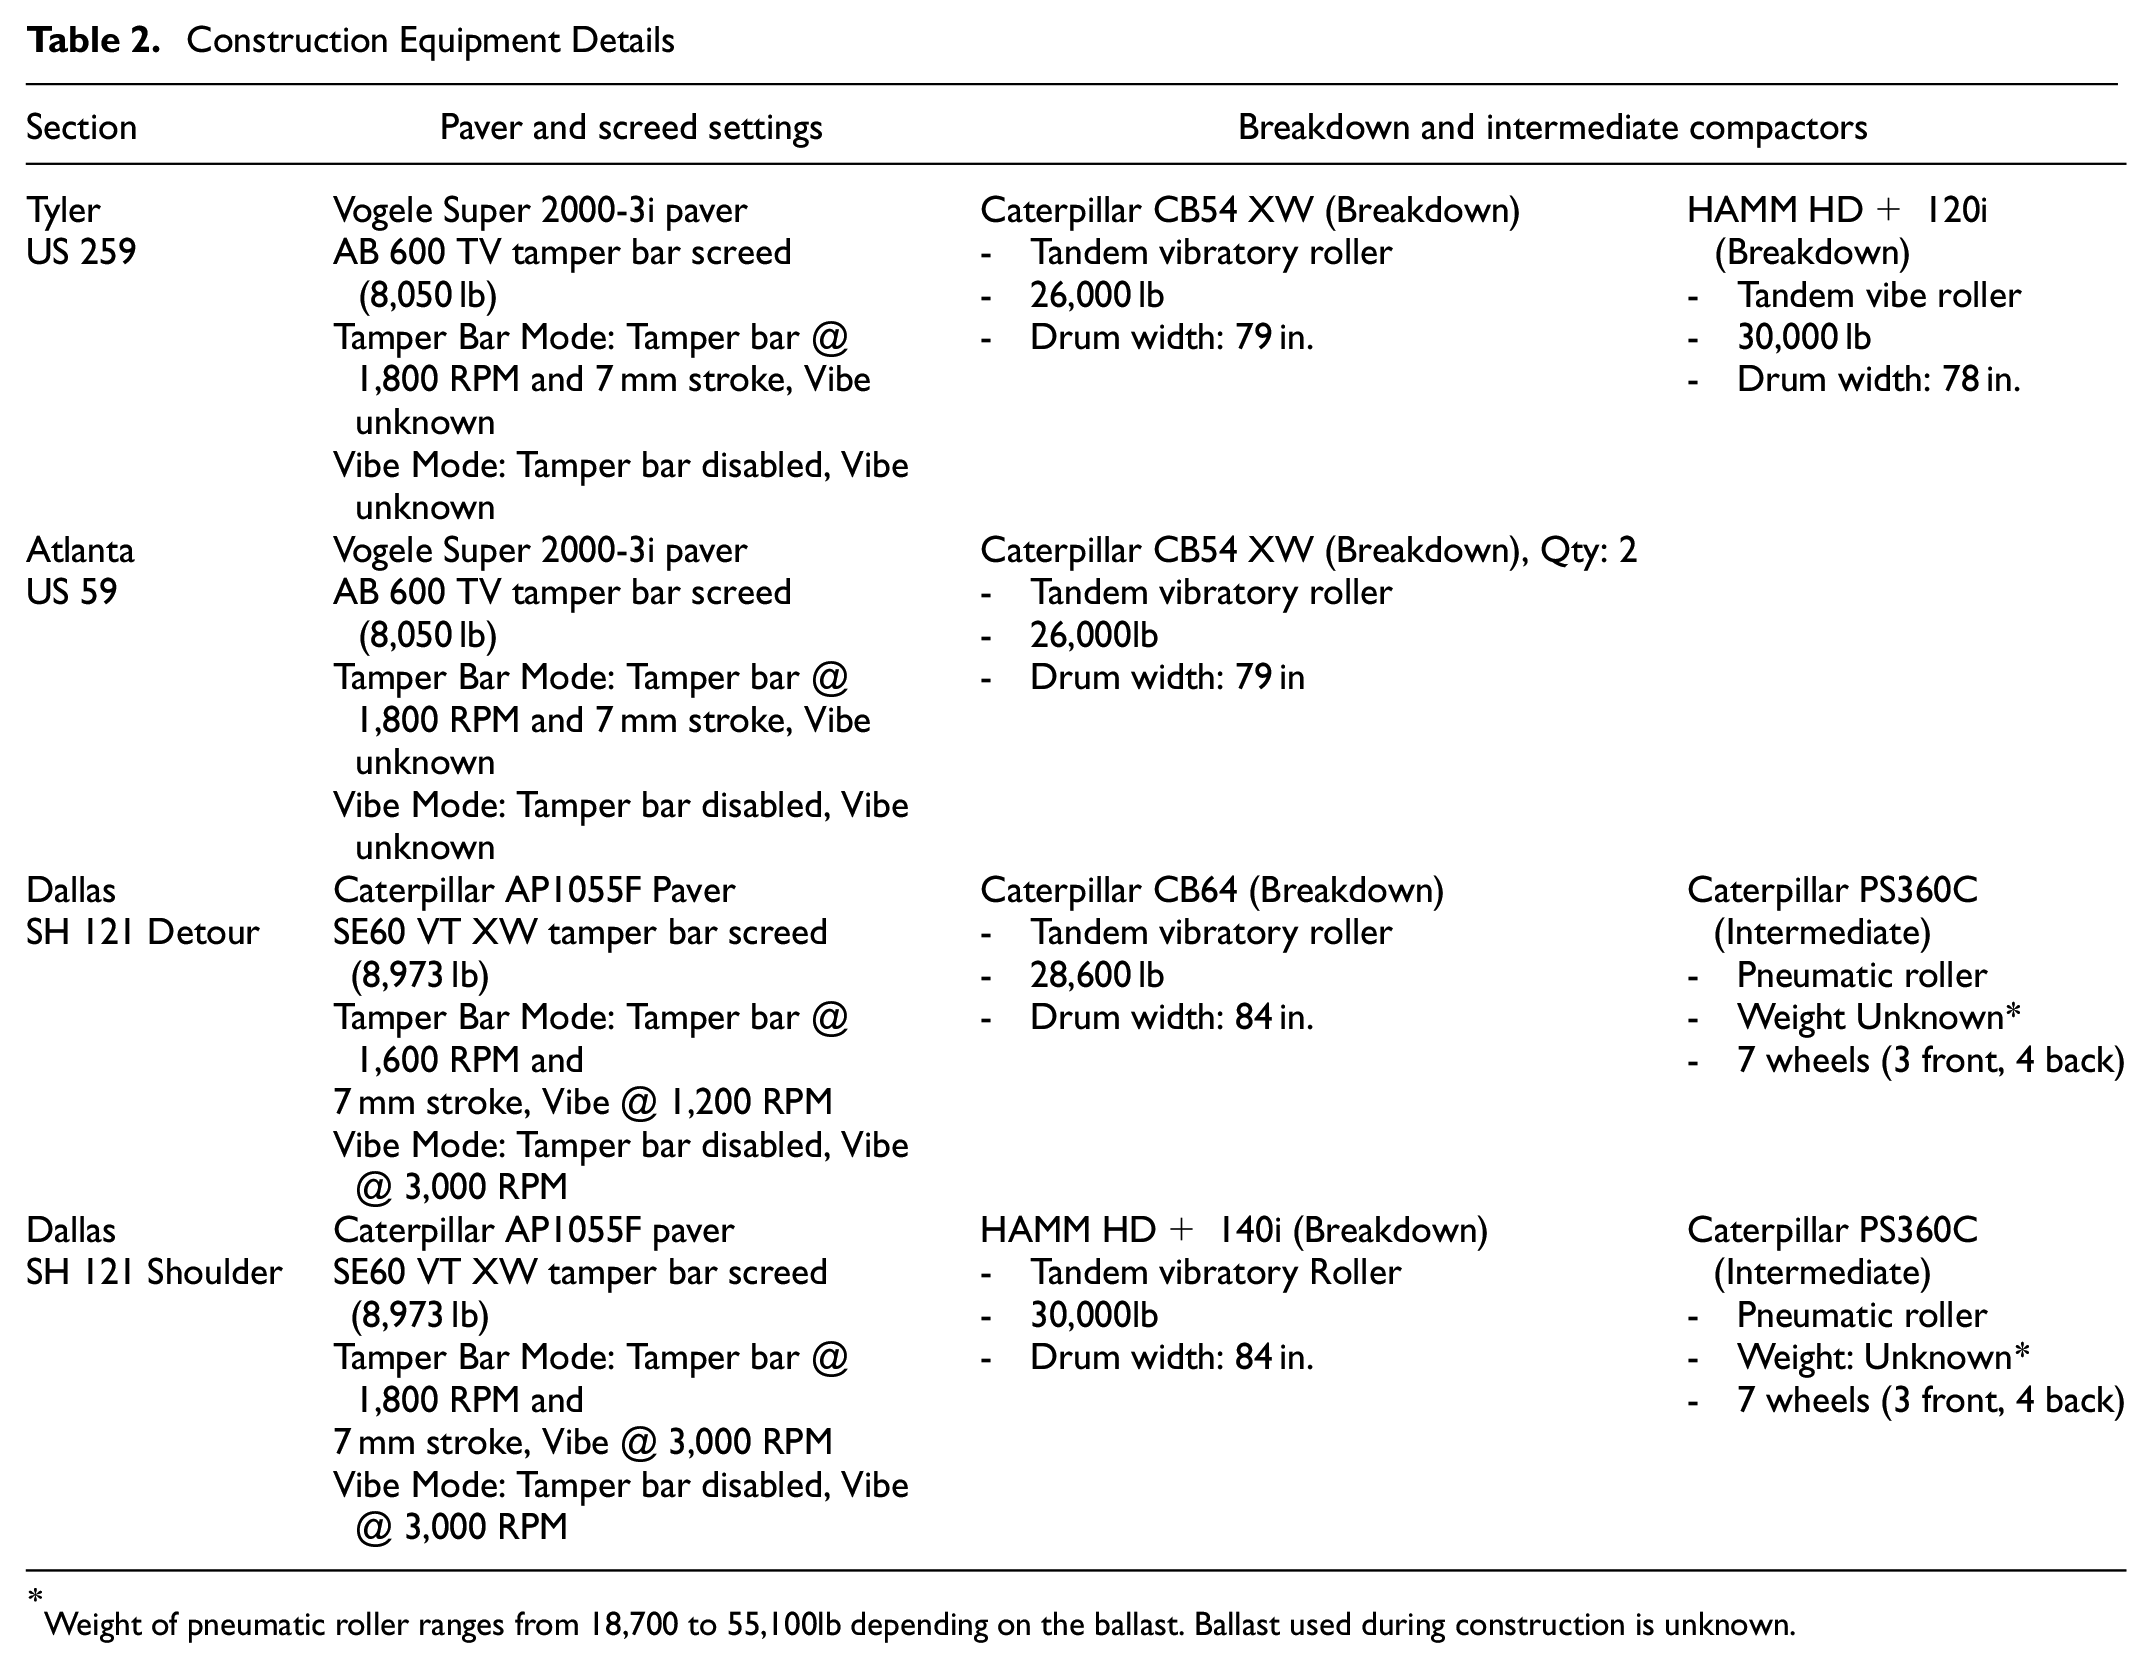
Weight of pneumatic roller ranges from 18,700 to 55,100lb depending on the ballast. Ballast used during construction is unknown.
A few notes about construction:
The specific tamper bar and vibratory plate settings varied among the different projects.
There was significant variability in the number of actual breakdown roller passes for Tyler-US 259 and Dallas-SH 121 Detour.
On the Dallas-SH 121 Shoulder project, the roller operator tended to perform straight stops to satisfy the rolling pattern needs, which introduced more roughness in the finished mat. In all other projects the roller operators performed stops at an angle.
On the detour sections, paving operations were conducted under challenging conditions. The natural subgrade was extremely soft, yielding to construction traffic and forming ruts up to 10 in. deep. This was particularly severe in the easternmost test section.
The tamper bar on the Caterpillar screed was significantly worn and likely did not uniformly impact on the mat as intended.
Approximate mixture temperatures behind the screed were 310°F for TYL-US259, 290°F for ATL-US59, 325°F for DAL-SH121 Detour, and 300°F for DAL-SH121 Shoulder.
Field and Laboratory Testing
Several tests were performed on the test sections during construction, on the finished mat, and with sampled cores in the laboratory. Details for the field and laboratory test methods and the statistical analysis are described as follows.
Mat Cooldown Time
On at least one location per project, a temperature probe (Figure 2) was inserted into the loose mat just before compaction. The probe has thermocouple sensors spaced every one or two inches of depth. An infrared (IR) sensor and an IR camera were used to measure the surface temperature. Mat temperature was measured for several hours until the mat cooled down.
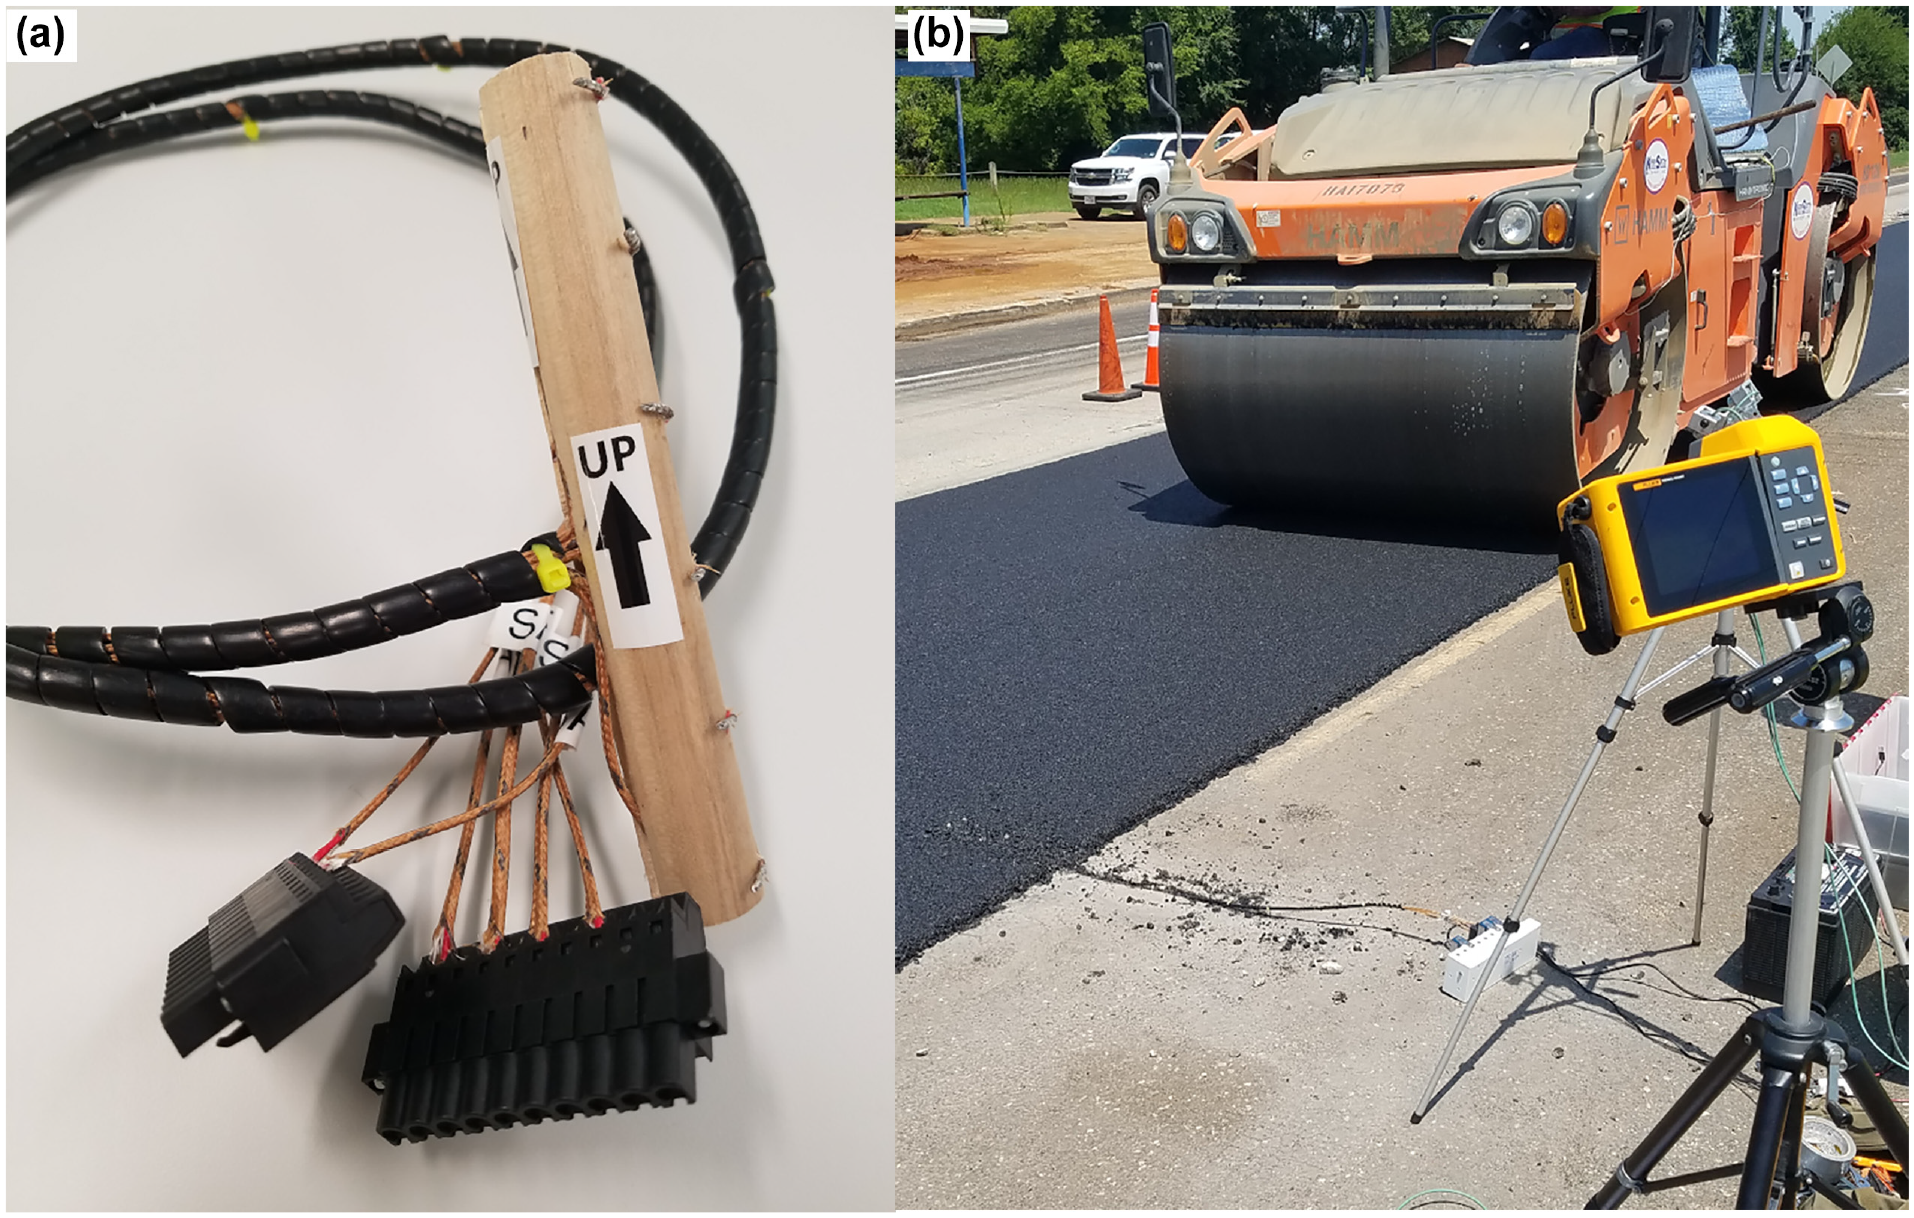
(a) Temperature probe and (b) installation site, and infrared (IR) camera. (TTI©)
Air Voids During Construction
The team used a pavement quality indicator (PQI) to test the mat density immediately after the paver screed and between breakdown roller passes. Another measurement was made following intermediate and finish rolling. In most cases, three locations were tested with the PQI within each section. In later sections, the team only measured the initial, uncompacted condition and the final density. The PQI data were corrected with an offset calibration, which was determined for each project by comparing the PQI measurements to core densities. The offsets ranged from +2.5 to +7.6 pcf. The researchers noted that the PQI and core data did not appear well correlated, but the trend of increasing PQI density with subsequent rolling was apparent.
Roughness
Each project, except for DAL-SH121 Detour, was tested with an inertial roughness profiler. The operator made three runs over all test sections. In post-processing, the profile data were separated into segments and the international roughness index (IRI) was calculated for each test section.
Core Sampling and Testing
The team sampled six cores from each test section. The cores were tested with a computed tomography (CT) scanner in the lab to capture the air voids gradient and were then tested for overall air voids using the bulk saturated surface-dry (SSD) method. In this study “air voids” are defined as the percent difference between the bulk density of the core and the maximum theoretical density (MTD) of the mixture. The CT scan data for each core were calibrated based on the measured overall air voids. Consequently, the correlation between the CT scan and the bulk SSD air voids was very strong.
Statistical Analysis
Several statistical analyses were performed to determine the effects of main research predictor variables on the response variables (Table 3). Each analysis used a certain combination of predictor variables and variable interactions as appropriate with the analysis goals. Analyses were done using the statistical software, JMP, through multivariate analyses of variance or covariance (i.e., MANOVA or MANCOVA) and stepwise regression. The complete details of how each analysis was performed and the sample size of input data are contained in the appendix of TxDOT Report 0-7064 ( 31 ).
All Response and Predictor Variables
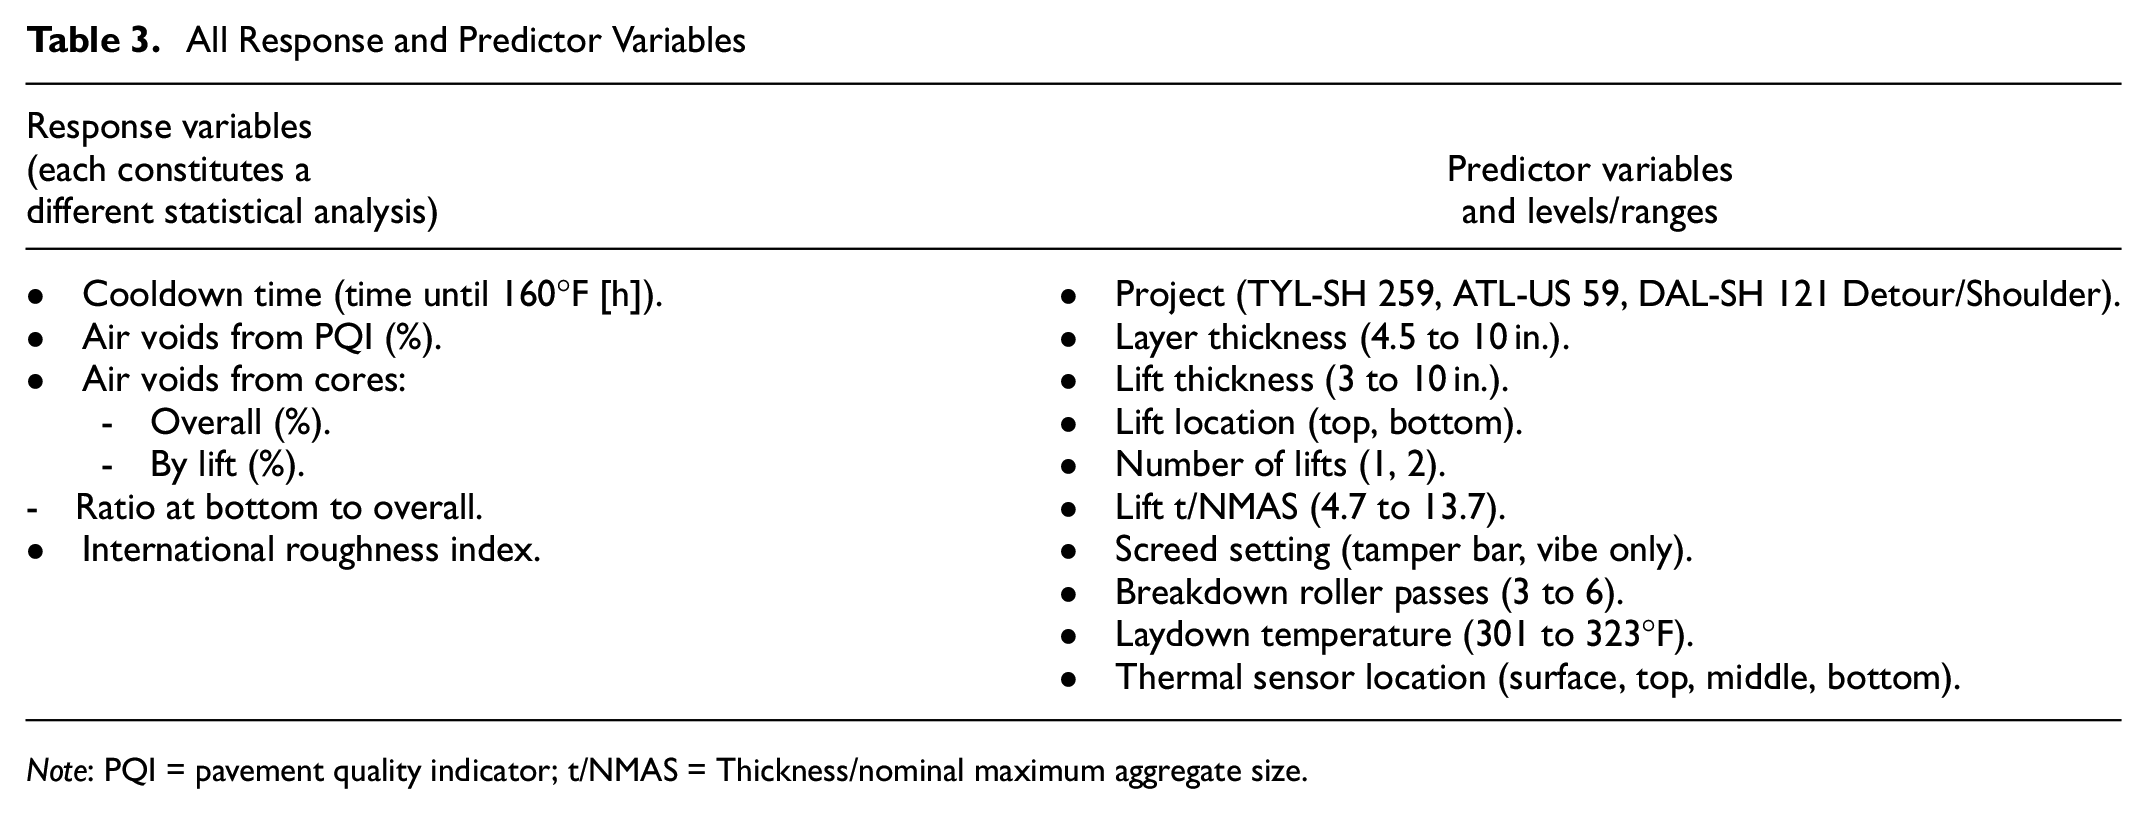
Note: PQI = pavement quality indicator; t/NMAS = Thickness/nominal maximum aggregate size.
Results
This section presents the results of testing and statistical analyses for the following topics:
mat cooldown time;
air voids of the mat during construction;
air voids of cores (overall, by lift, and uniformity);
profile roughness.
Summary statistics are provided for each topic analysis (variable p-values, variable partial R2, model p-value, and model adjusted R2). The provided figures show either example data or the main effects trends of the variables. Complete detailed results are found in TxDOT Report 0-7064 ( 31 ).
Mat Cooldown Time
An example of mat temperature data after compaction is shown in Figure 3. Each line shows the change in temperature at a different location in the mat. The surface and top of portion of the lift cooled the fastest. The middle of the lift was hottest overall, and both the bottom and middle of the lift were similar temperatures after several hours. The range in cooldown time (until reaching 160°F) ranged from 4.8 h near the surface on the thinnest lift to 9.3 h inside the thickest mat.
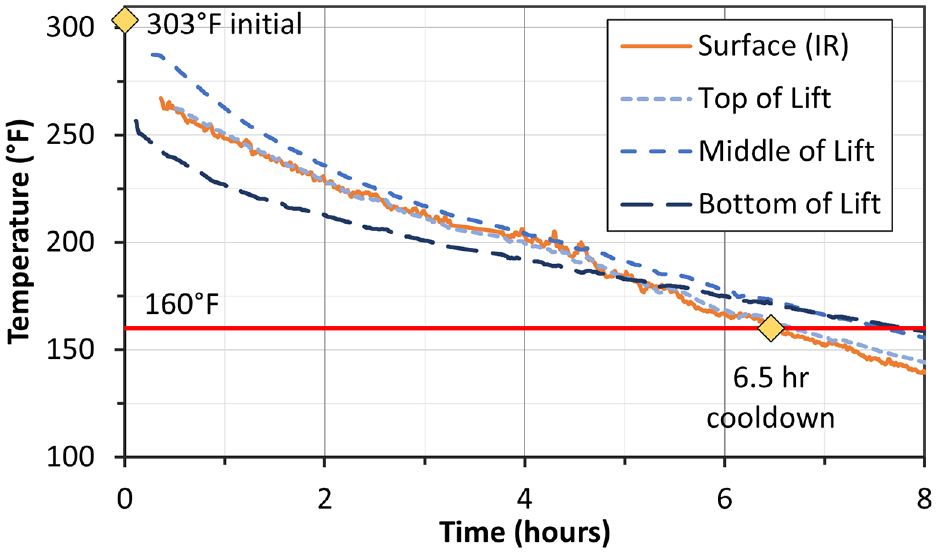
Mat temperature versus time (TYL-US259, 6-in. lift).
The statistical results of the mat cooldown time analysis are given in Table 4. The variables Sensor location, Lift thickness, and Project were all statistically significant. Thicker lifts took longer to cooldown, with a general trend of each inch adding about 45 min of cooldown time. Cooldown near the surface was about 1 h and 50 min faster than inside the mat. The initial Laydown temperature variable was not statistically significant. Among these projects, initial temperature ranged between 290°F and 325°F, suggesting that modest changes in the initial mixture temperature (like using warm mix additives) would not significantly affect the cooldown time. Other environmental variables that influence cooldown time were captured by the Project variable. Environmental variables were outside the scope of this study but include ground temperature, air temperature, wind speed, and cloud cover ( 32 – 34 ).
Statistical Results of Cooldown Time Analysis
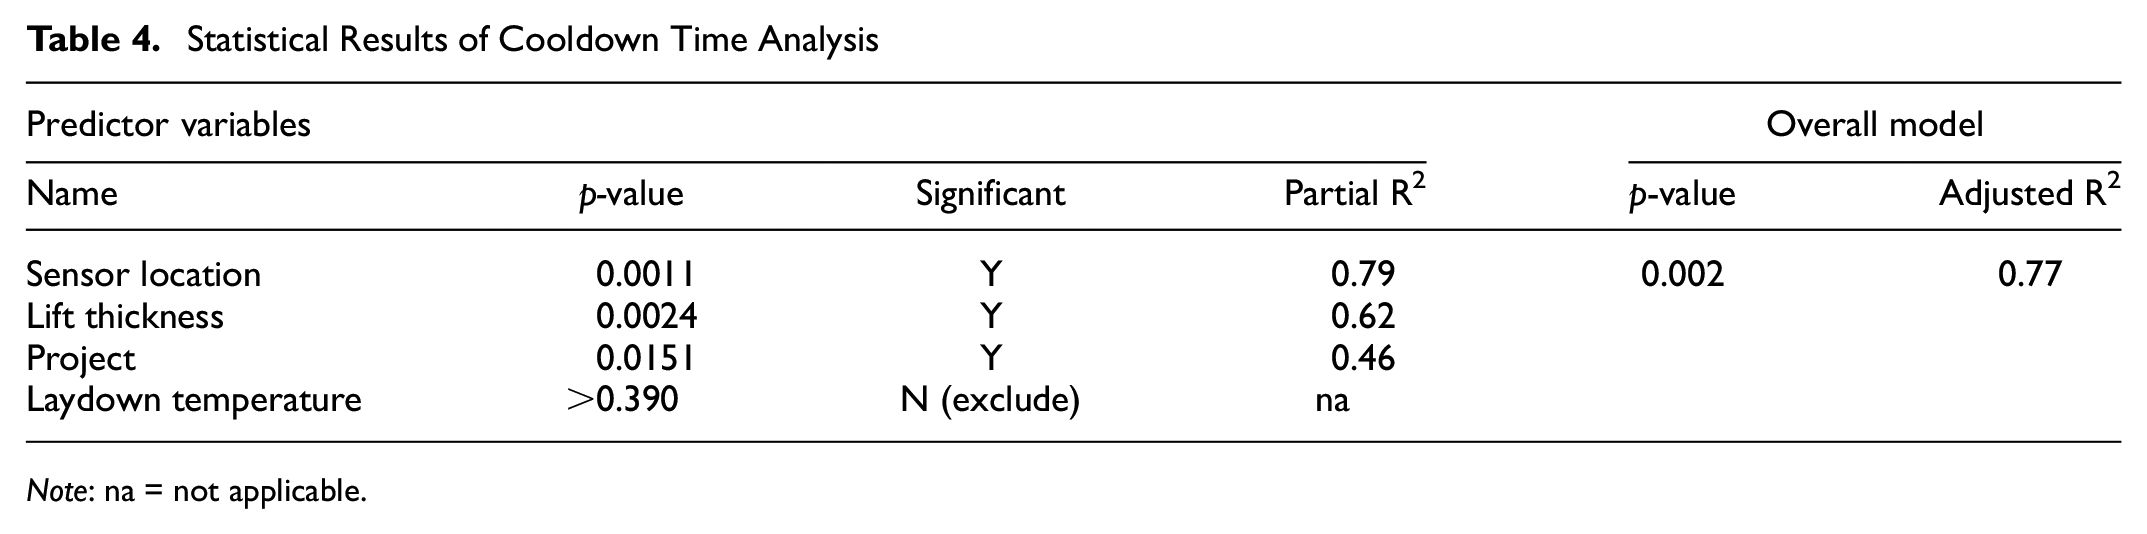
Note: na = not applicable.
Air Voids During Construction
This analysis focused on the air voids, measured by the PQI, behind the screed and throughout the compaction process. The general trend of air voids versus breakdown roller passes, using an exponential decay model is shown in Figure 4. The mat air voids directly behind the screed were 8.6% on average, then quickly reduced 2% after one pass of the roller. The second pass reduced air voids by just over 1% with diminishing returns until only 0.1% change in density was achieved after the sixth roller pass.
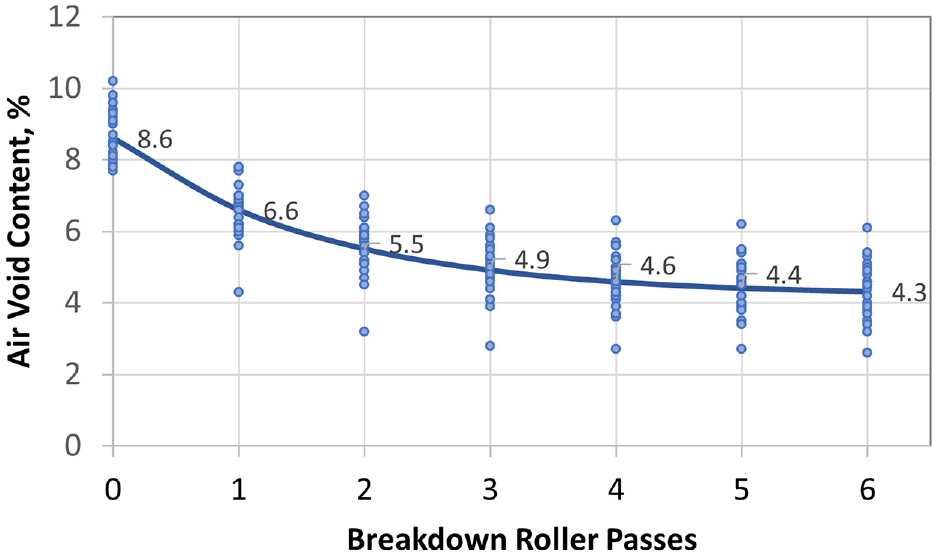
Air voids (pavement quality indicator [PQI]) versus roller passes.
The results of a statistical analysis using a linear model, with a log-transformed roller passes variable, is shown in Table 5. The overall model was significant (p-value < 0.0001) and had a high adjusted R2-value of 0.85. Number of Passes was the most significant factor. Lift Thickness had a significant effect, though practically, the effect was minimal. Screed Setting was not significant.
Statistical Results of Air Voids (Pavement Quality Indicator —PQI) During Construction
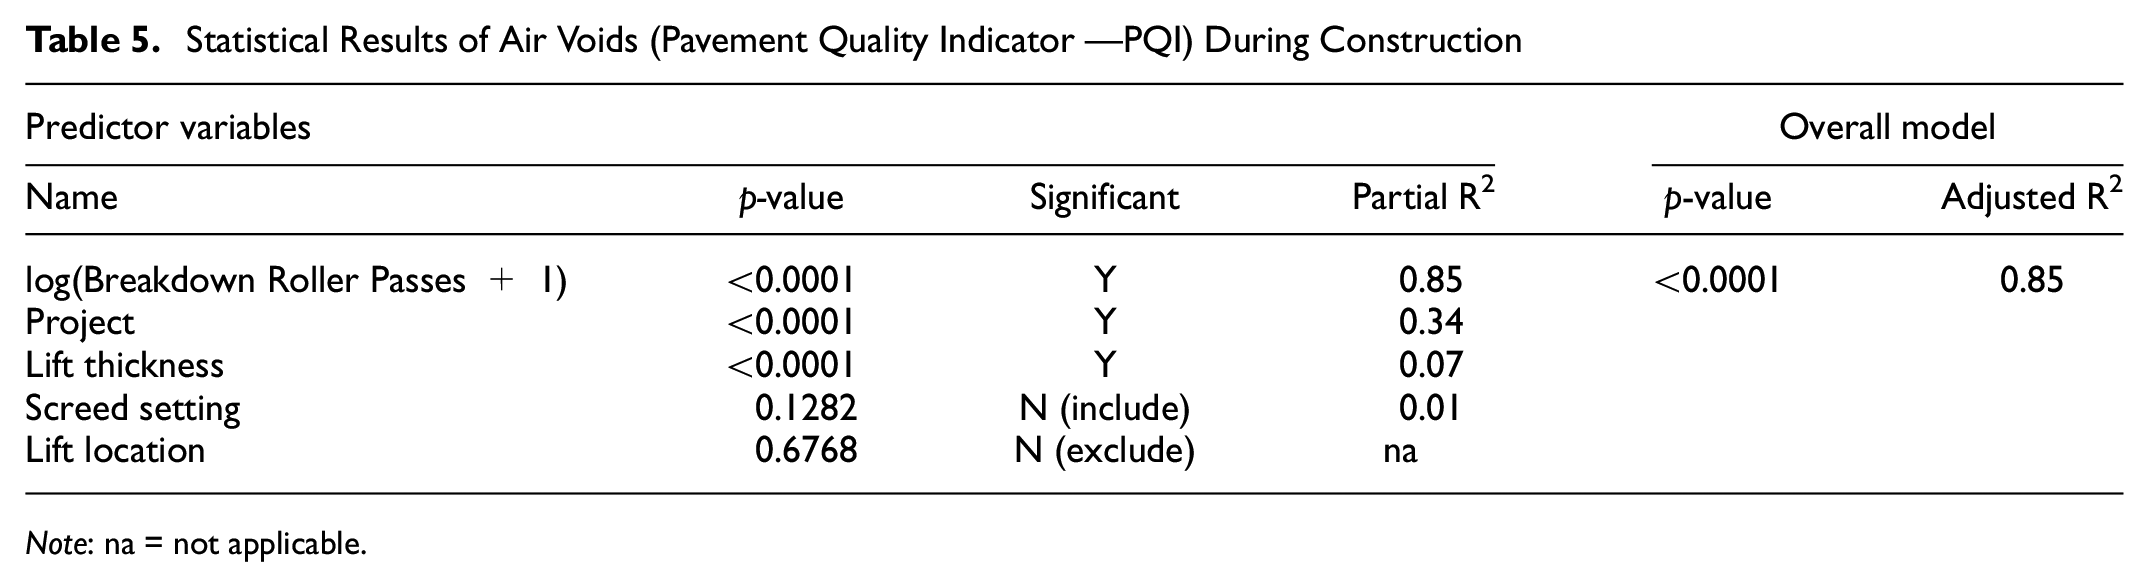
Note: na = not applicable.
Air Voids from Cores
Overall Air Voids
The statistical results of the overall air voids analysis, based on the core samples, is shown in Table 6. The model was statistically significant (p-value < 0.001); however, the data had a high degree of scatter as noted by a low adjusted R2 value of 0.37. The main effects of the five variables, and the predicted versus actual air voids plot are illustrated in Figure 5.
Statistical Results of Air Voids (Overall) Analysis
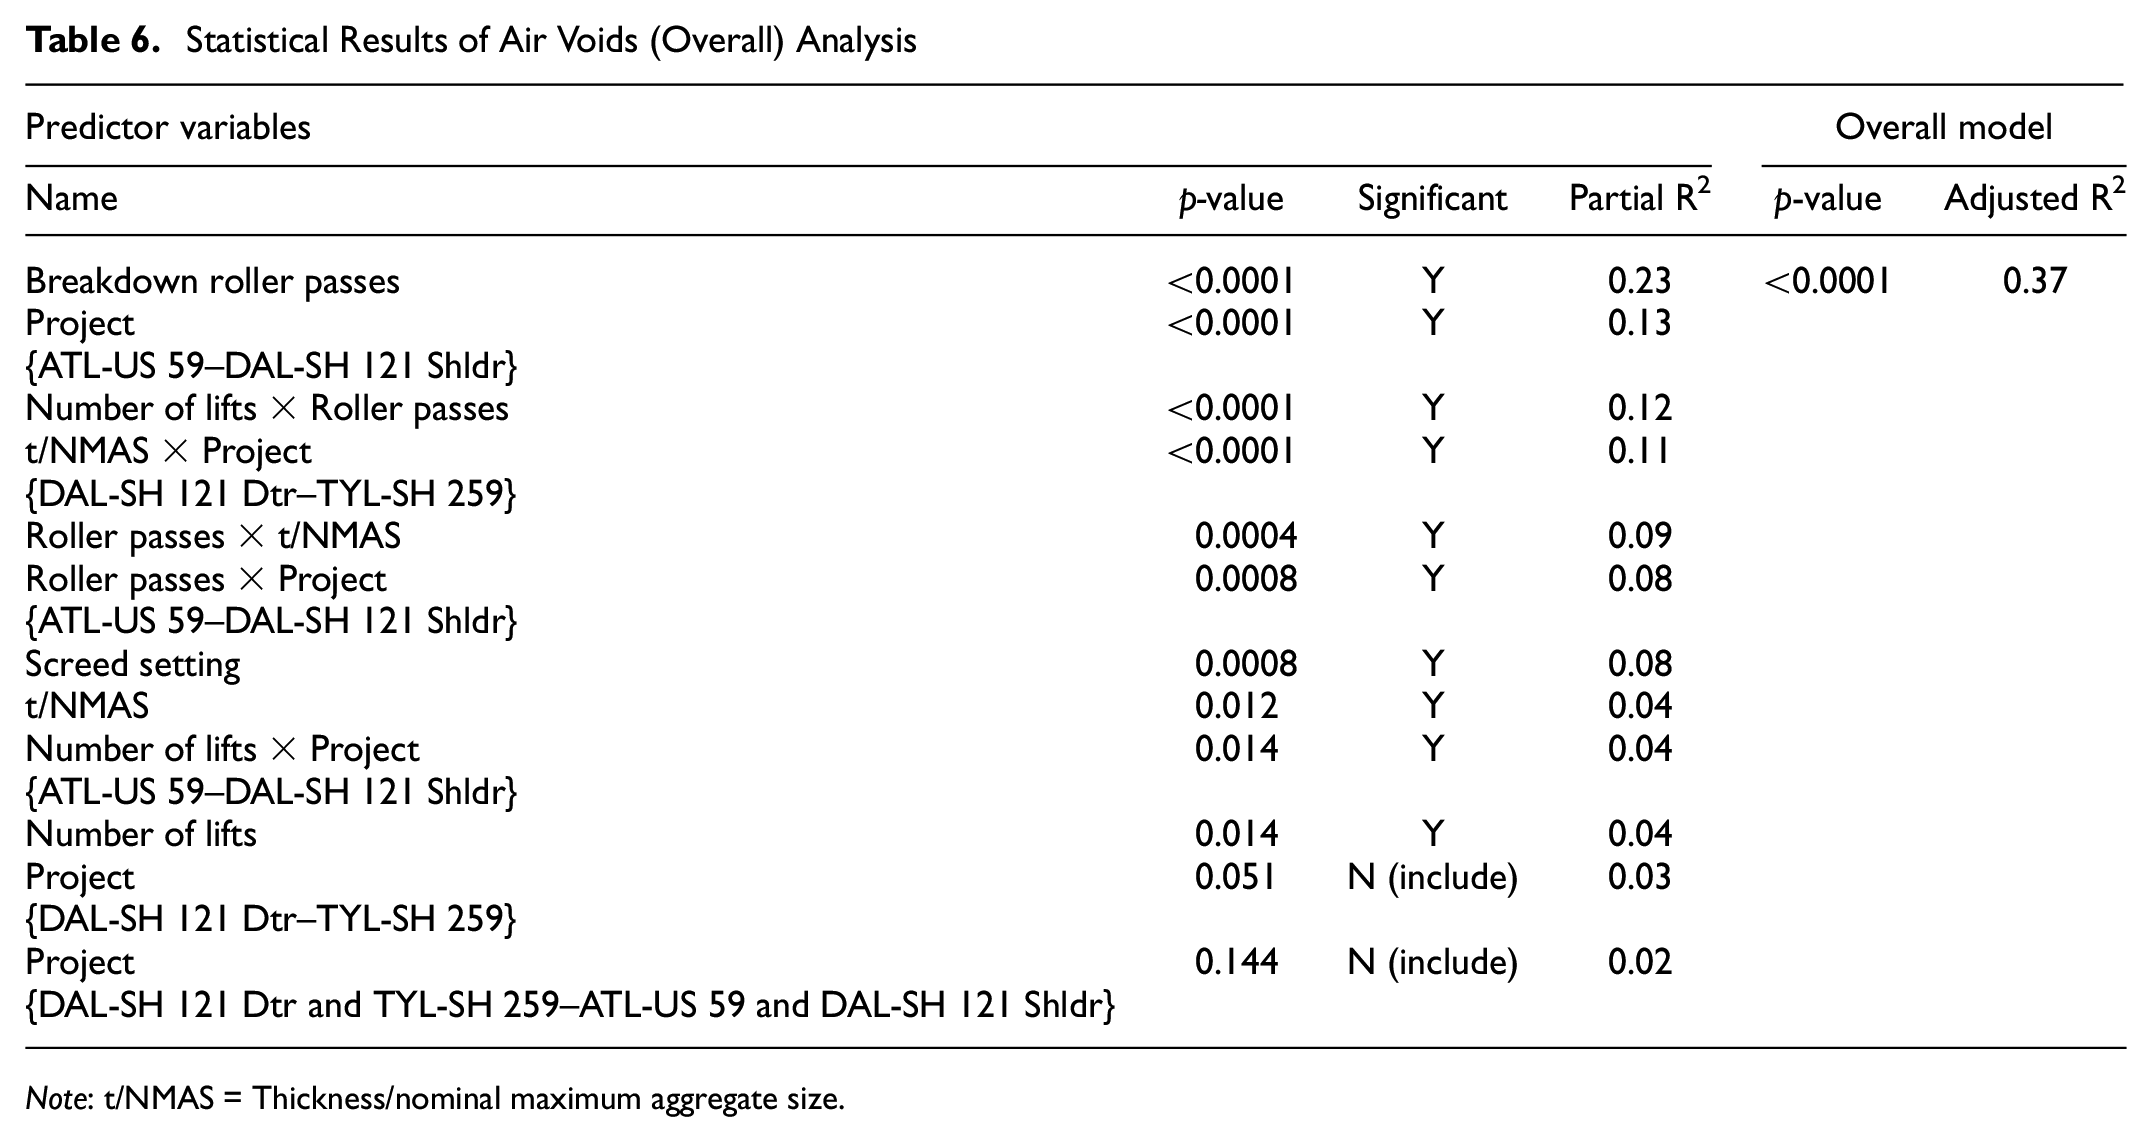
Note: t/NMAS = Thickness/nominal maximum aggregate size.
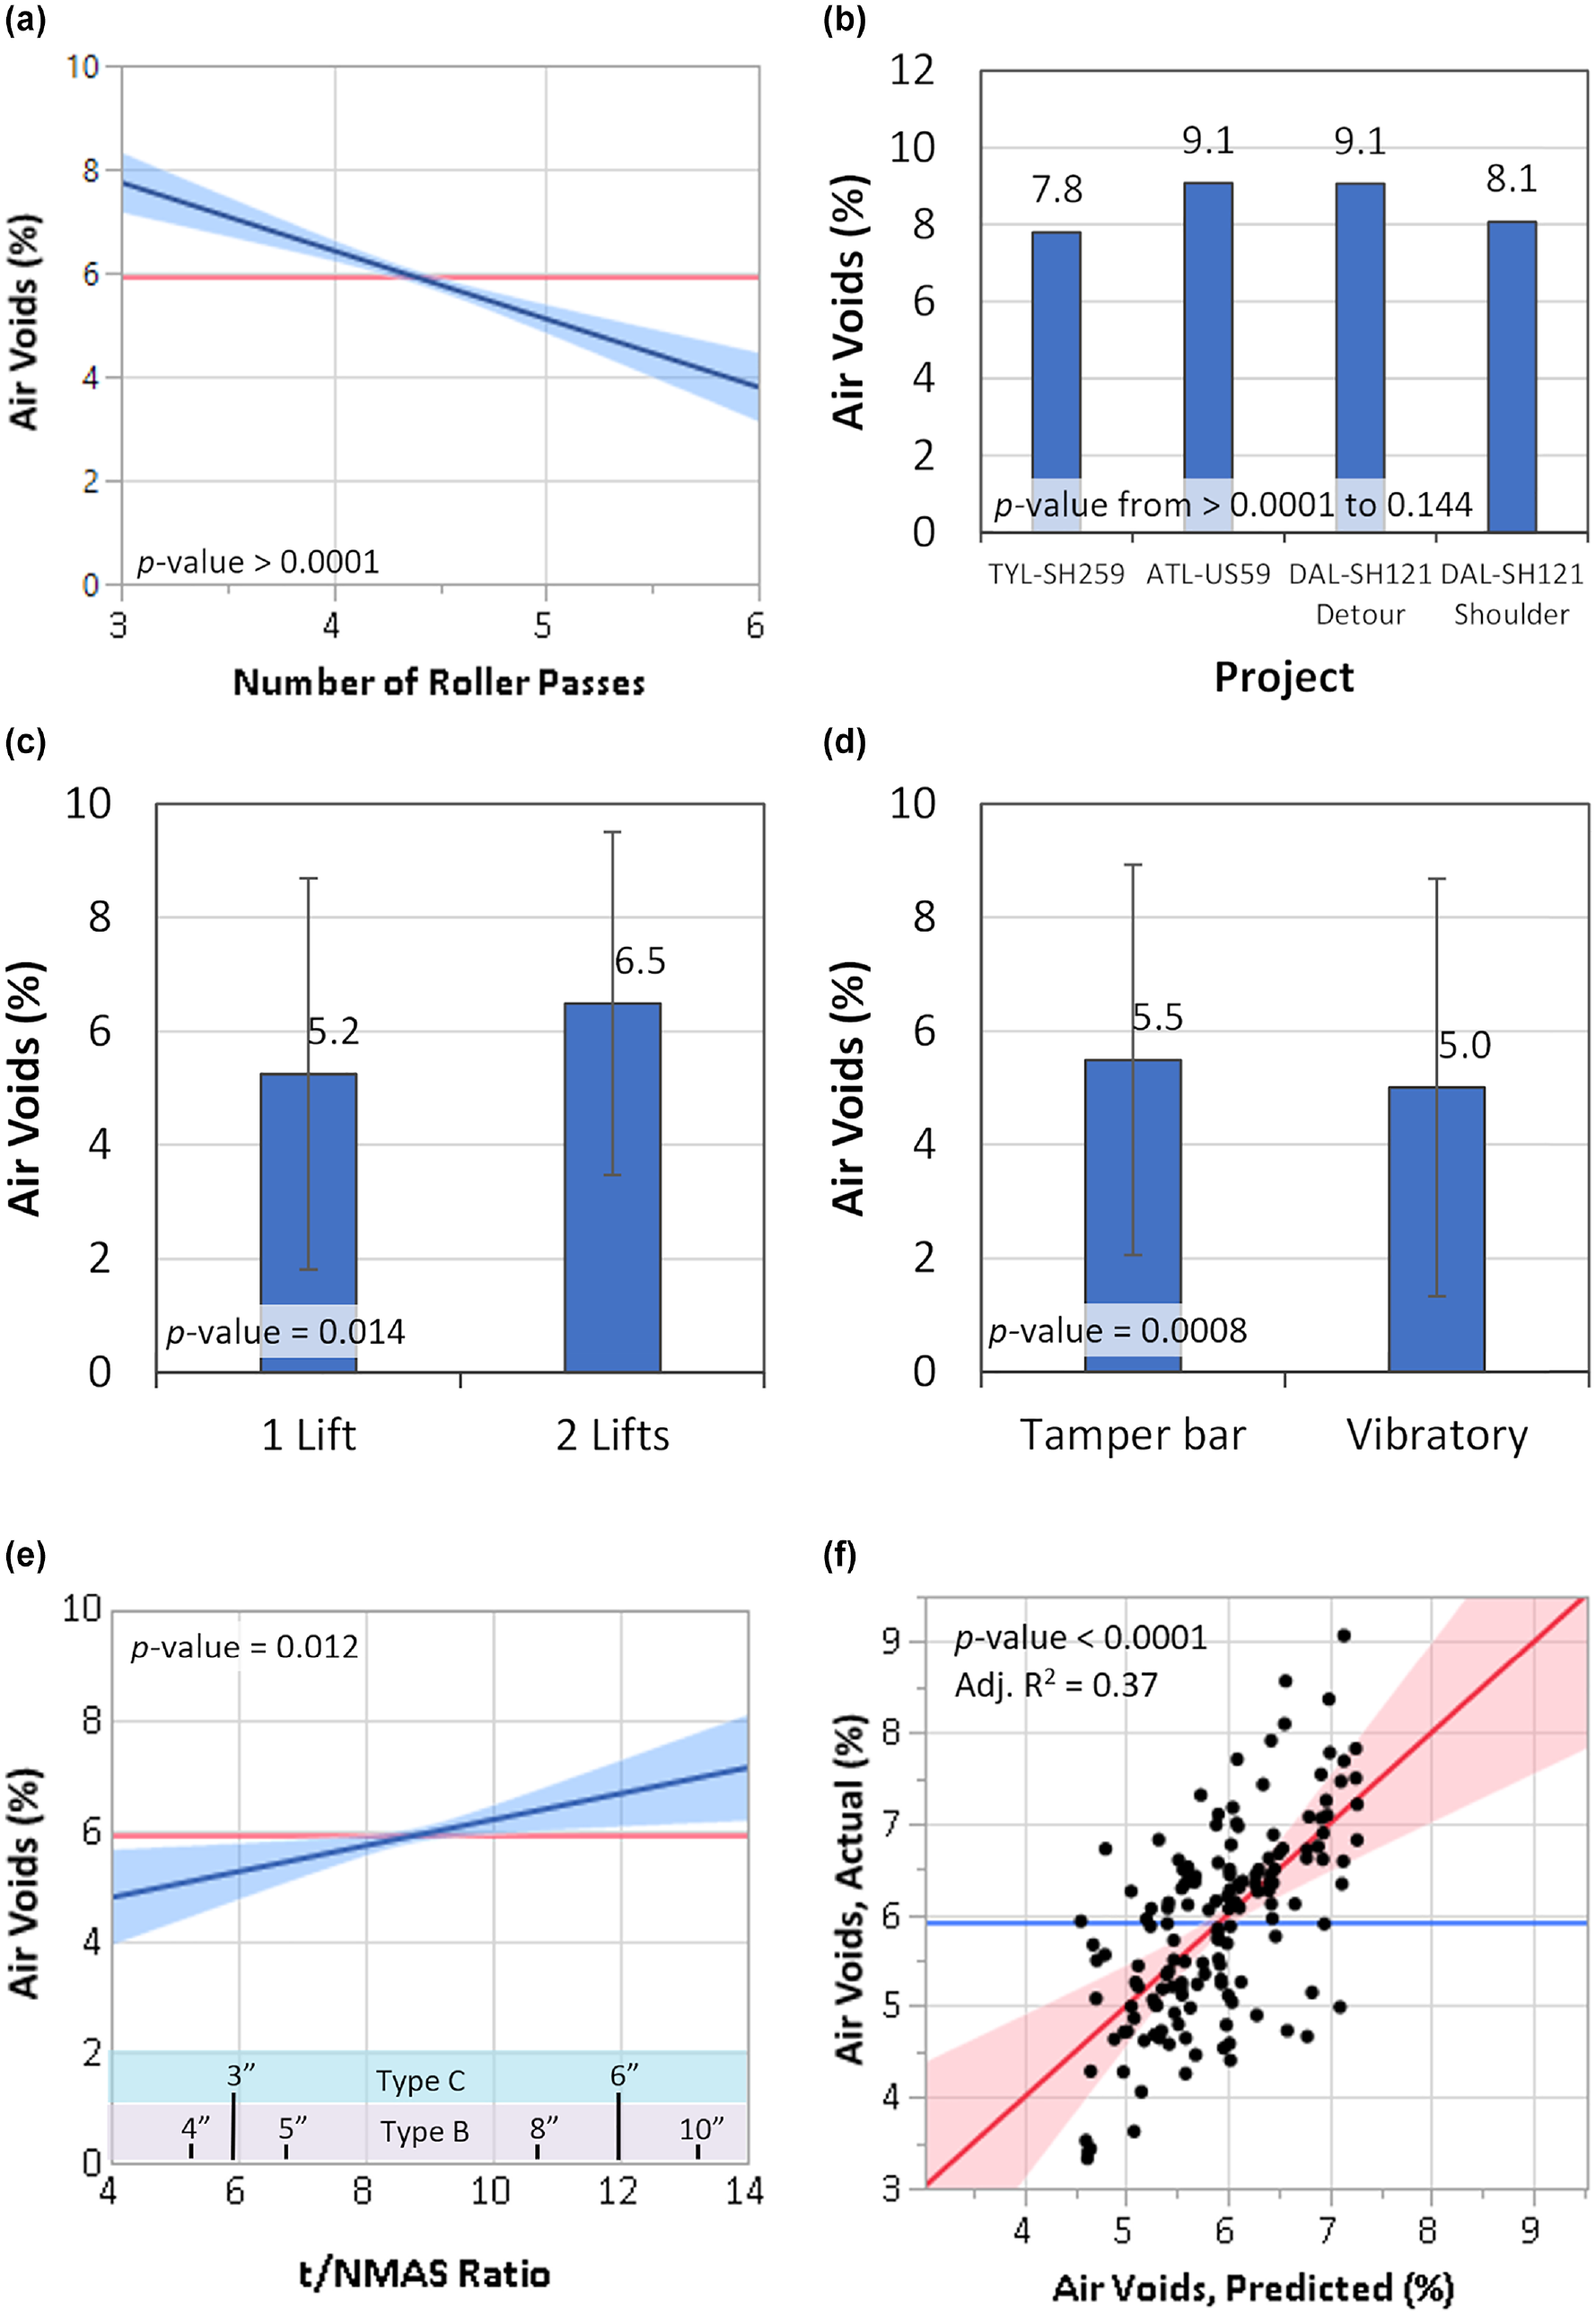
Air voids versus main effects: (a) number of roller passes, (b) project, (c) number of lifts, (d) screed setting, (e) thickness/nominal maximum aggregate size (t/NMAS) ratio, and (f) model results.
The most significant predictor variable was Breakdown roller passes. The rolling had more impact on the final air voids than anything else in the laydown process, the mixture properties, or the lift thickness. Based on the model, adding an extra roller pass decreases the air voids by about 1.5%. The effect of roller passes, however, is likely non-linear, as shown in the previous analysis with PQI air voids, and the impact of sequential passes has diminishing returns.
The Project variable was the next most significant factor. In total, six of the 12 model parameters include the Project variable. What this means is that there were different types and degrees of influence at the project level that were not accounted for by the primary study factors. These influences are wide ranging and could include:
contractor,
paver model and manufacturer,
condition of the tamper bar,
method of adjusting screed settings,
asphalt mix designs,
supporting substrate, and
edge confinement.
Even when these variables were known, it was not appropriate to include each of them separately, since the factor levels would not constitute a balanced test design, and they would overfit the model. Consequently, the Project factor serves as a catch-all for these uncontrolled variables.
From the Number of Lifts factor, we see that pavement placed in a single lift had lower air voids than pavement placed in two lifts. On average, single-lift cores had air voids that were 1.3% lower than the two-lift cores. This is because the air voids at the bond interface in two-lift cores was higher than the air voids in the middle of one-lift cores, as is evident in the CT scan data in Figure 6. On average, the air voids at the bond interface are 14.5%, compared with 4.2% air voids at the center of a single-lift layer.
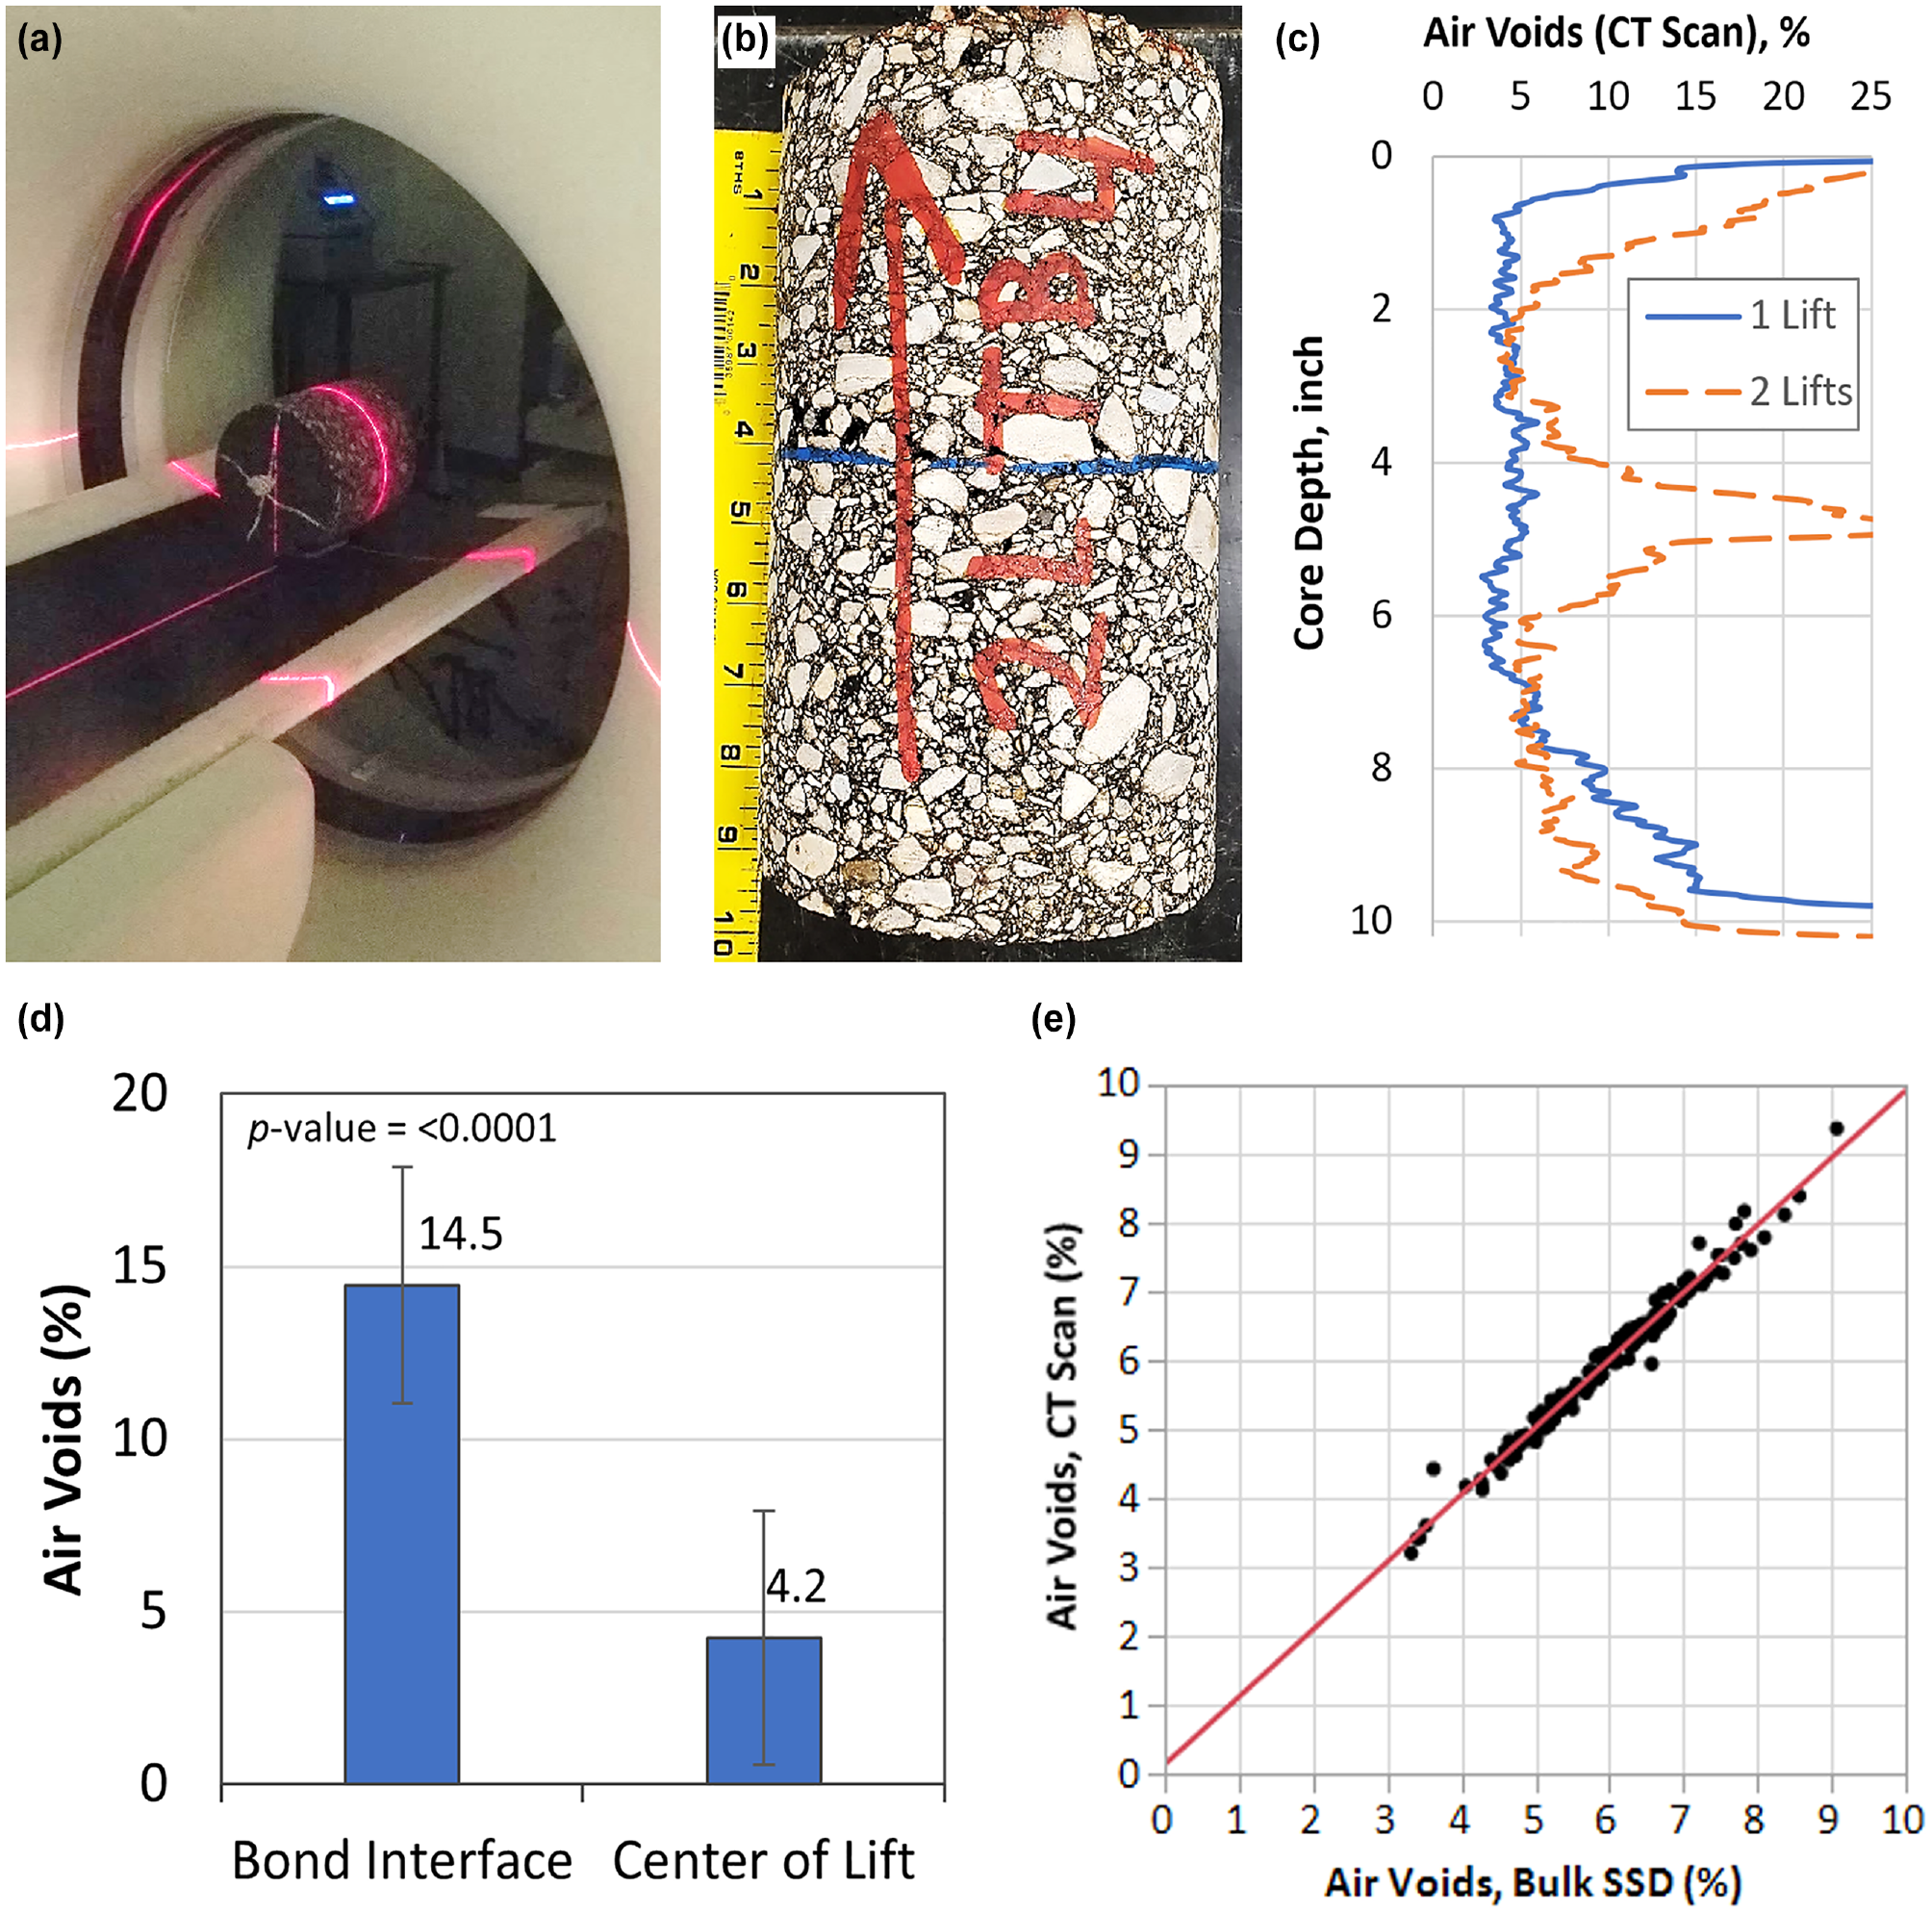
Computed tomography (CT) scan analysis: (a) equipment, (b) two-lift sample core, (c) CT scan results, (d) comparison of air voids at bond interface and center of lift, and (e) correlation between bulk saturated surface-dry (SSD) and CT scan measured air voids. (TTI©).
Finally, the effect of the t/NMAS Ratio factor showed that an increase in the ratio (i.e., thicker lift for a given mix type) increases the overall air voids slightly. On average, an increase of the t/NMAS ratio by 2 will increase air voids by 1%. This finding is contrary to results in the literature that studied this same factor in a laboratory setting. However, evaluating the main effect of t/NMAS in the analysis of overall air voids is misleading because the effect gets confounded with the effect of the number of lifts. Samples with the lowest t/NMAS ratios were also placed in two lifts, which tends to increase the air voids. The next analysis of air voids by lift is an attempt to clarify the influence of the t/NMAS ratio factor.
Air Voids by Lift
The results from analyzing core air voids by lift is shown in Table 7. While the model did contain some significant factors (Roller Passes and Screed Setting), the R2 value of the model is very low, indicating that there is another factor, not in the model, that has a significant effect, and/or that there is high variability inherent to the data. The effect of Lift Thickness/NMAS was not significant in the model. Therefore, from the core lift data set, the researchers did not observe any effect of the lift thickness/NMAS (or lift thickness alone) on air voids.
Statistical Results of Air Voids by Lift
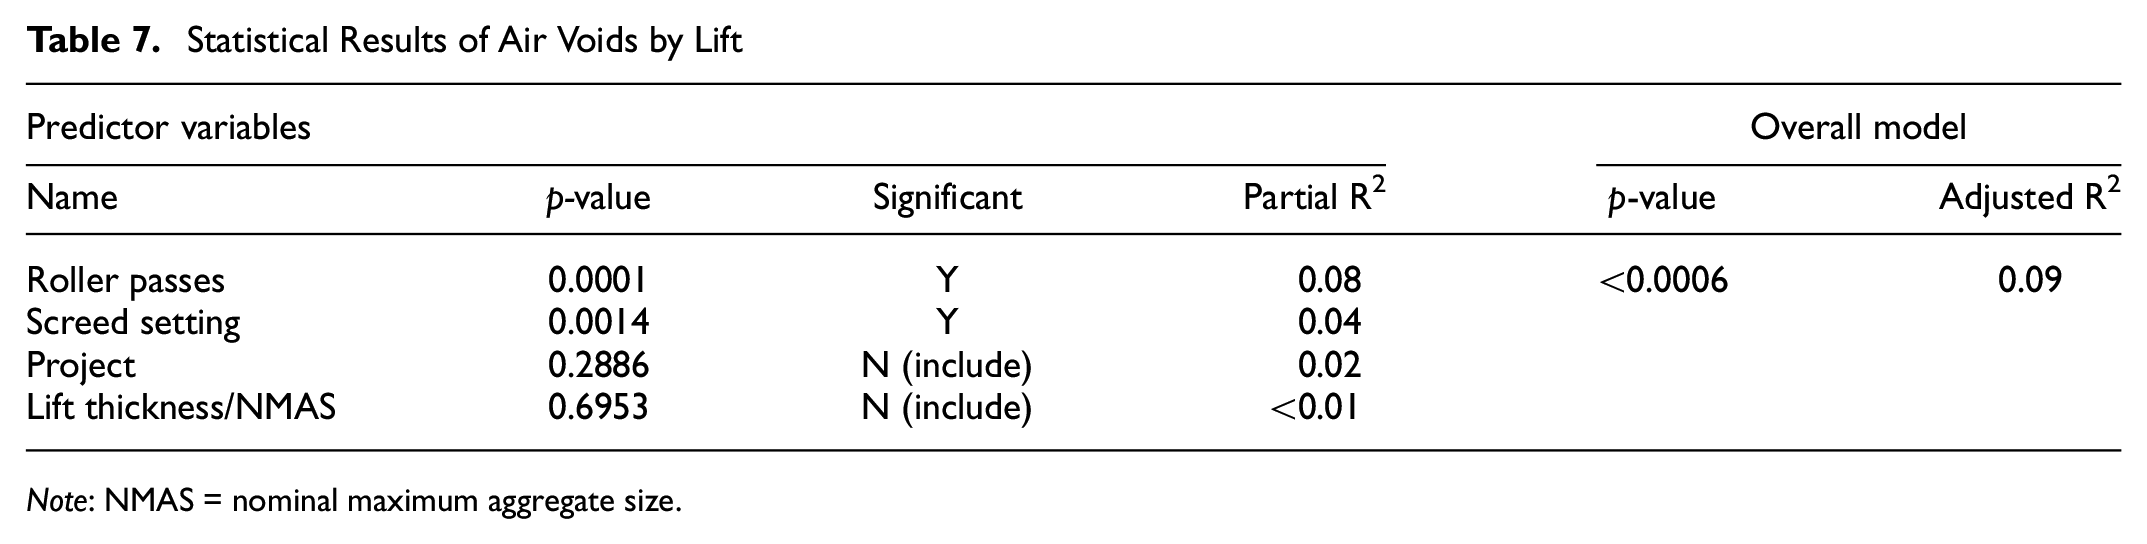
Note: NMAS = nominal maximum aggregate size.
The difference in compaction between the top lift and bottom lift was analyzed separately with a paired t-test. The air voids of the bottom lift were subtracted from the top lift for all two-layer cores, and this difference for all paired data was compared with zero. The distribution of all the differences is shown Figure 7. On average, the top lift has less compaction, and 1.8% higher air voids than the bottom lift. The difference from zero was statistically significant (p-value < 0.0001). The difference is likely attributable to the high air voids at the interface. The researchers theorize that, though compacting against a stiffer layer could help compaction, it actually becomes harder to compact the interface itself because it is difficult for finer aggregate to reposition into the voids within the coarse aggregate at the interface.
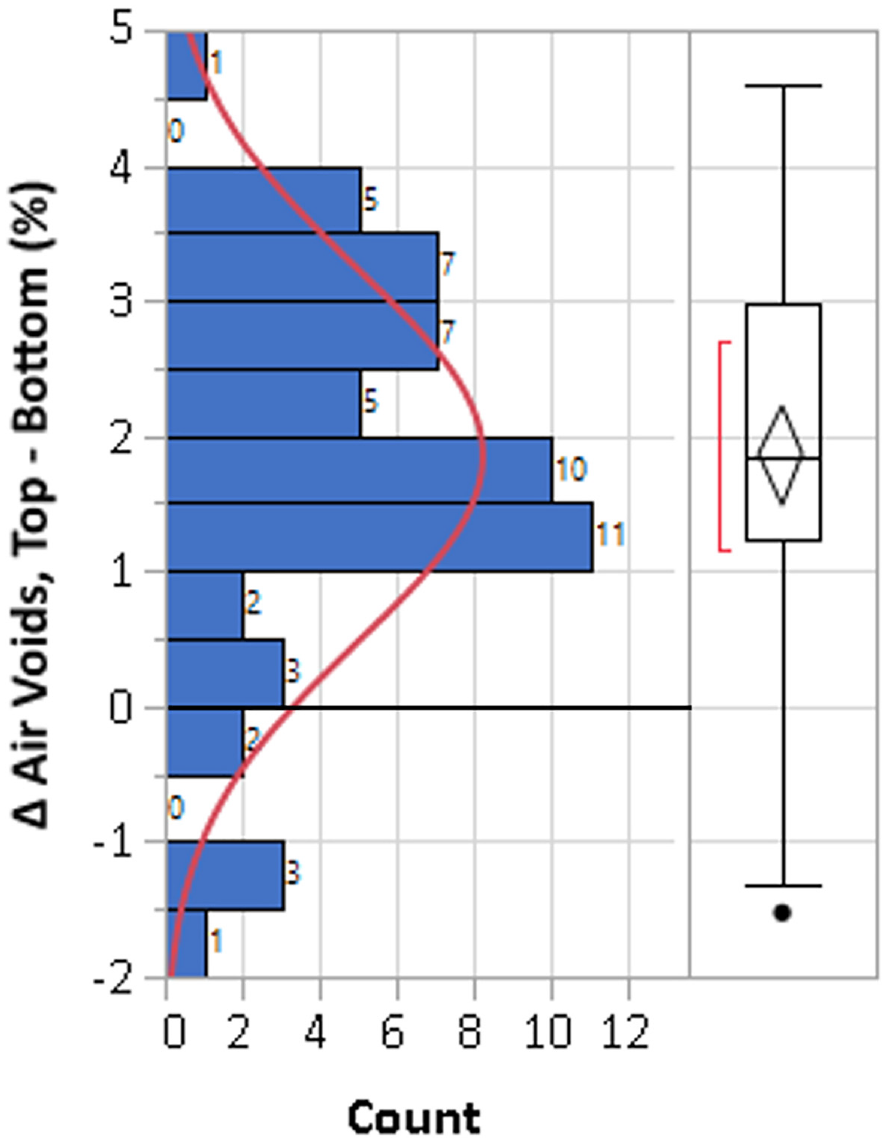
Paired difference between of top lift and bottom lift air voids.
Air Voids Uniformity
One concern about placing thick lifts is whether the contractor can achieve adequate compaction at the bottom of the lift. The air voids uniformity analysis compared the air voids at the bottom 0.5-in. with the overall air voids, to calculate a ratio. For example, a ratio of 2 means that the bottom air voids are twice as high as the overall air voids.
The result of the air voids uniformity analysis is in Table 8. Lift thickness was the most significant variable that affected the uniformity of air voids within a lift. The relationship is illustrated in the leverage plot in Figure 8. As the lift thickness increases, the ratio of bottom air voids to overall air voids increases. This is confirmation that thicker lifts are more difficult to compact uniformly, even if overall compaction is improved. At 10-in., the ratio is over 2.0, and as the lift approaches 2 in. (which was outside the scope of testing in this project), the ratio approaches 1.0. The factors Screed setting and Roller passes were not significant. This means that additional compaction effort in thick-lift paving does not reduce the higher air voids at the bottom of the lift.
Statistical Results of Air Voids Uniformity Analysis
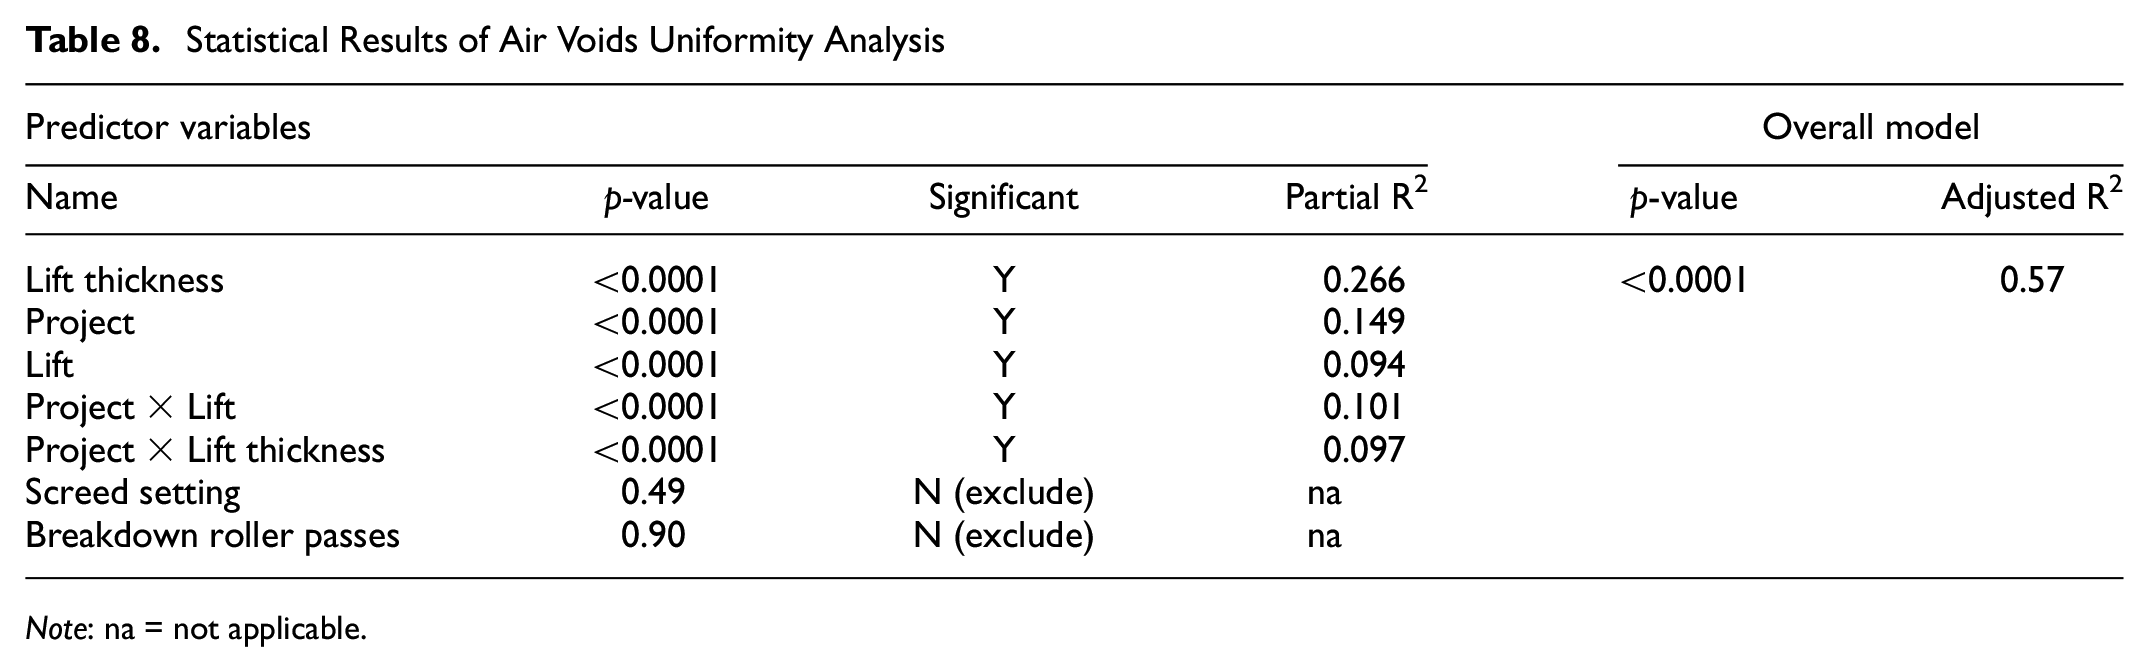
Note: na = not applicable.
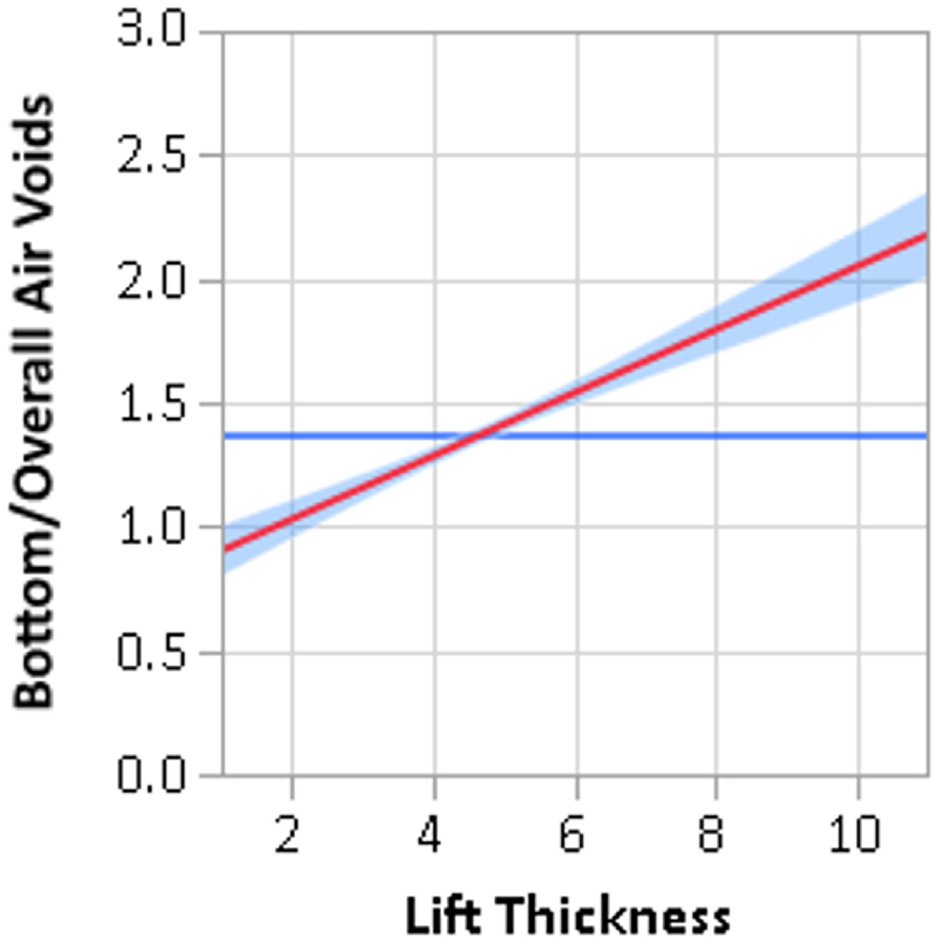
Ratio of bottom to overall air voids versus lift thickness.
The effect of the air void distribution on the quality of the pavement was not explored in this study. It is possible that, as the lifts get thicker, the compaction at the bottom of the lift becomes less critical since the thicker pavement provides a bridging effect, distributing the traffic loads over a wider area, and reducing stresses at the bottom of the layer.
Roughness
As shown in Figure 9, in both the ATL-US 59 and TYL-SH 259 projects, the single lift test sections had higher roughness. Paving in two lifts decreased the roughness from around 90 to 70 in./mi. on these projects. The researchers expected this trend since the contractor can improve roughness with each subsequent lift. On the DAL-SH 121 Shoulder project, however, the trend was drastically reversed, and the two-lift section had much higher roughness (155 versus 85 in./mi.) Note that this was the only project where the roller operators performed straight stops instead of the common practice which is stop at an angle, which would explain the high roughness and variability on the DAL-SH 121 Shoulder project. Also, roughness standards for shoulder construction are generally less strict than for the travel lane. While the researchers believe the trends from TYL-SH 259 and ATL-US 59 are typical of the ride quality improvements that could be achieved when paving in two lifts versus one lift, the overall results are inconclusive.
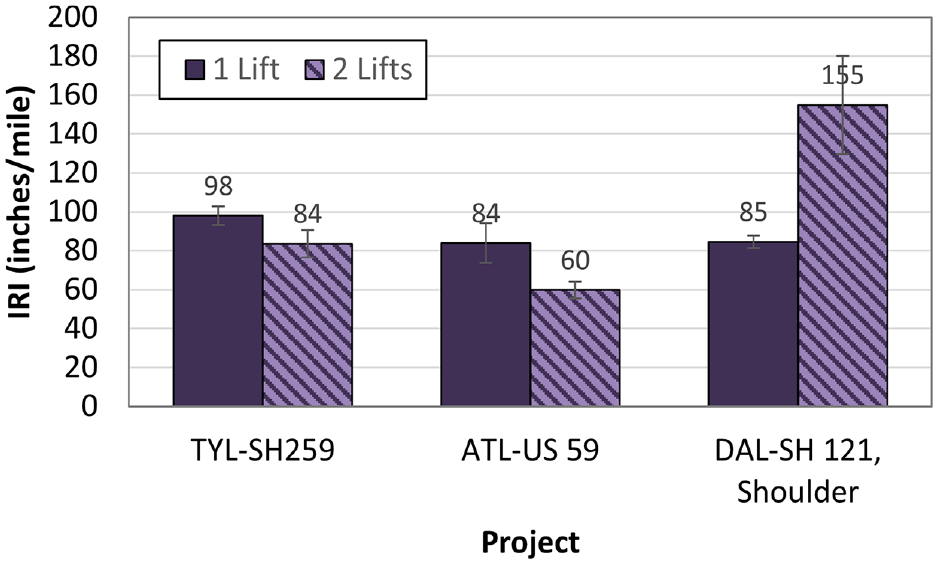
Profile roughness by project and number of lifts.
Conclusion
The purpose of this research was to determine whether a satisfactory air voids content and roughness can be practically achieved with thick-lift paving, and to identify the best practices to do so. Asphalt pavers with tamper bar screeds were deployed on three paving projects to place thick asphalt layers ranging from 6 to 10 in. thick. On each project, test sections were constructed in one or two lifts, evaluating different lift thicknesses, paver screed settings, and rolling patterns. The research team monitored the asphalt cooldown time after laydown and the mat density throughout compaction. Cores were sampled for laboratory testing including CT scanning for air void uniformity, and bulk air void testing. Each project, except for DAL-SH121 Detour, was profiled to measure ride quality.
Findings
Mat Cooldown Time
The middle or bottom of a thick mat takes at least 1.5 h longer to cooldown than the surface.
An additional 1 in. of asphalt increases the cooldown time by about 45 min.
Air Voids
Overall mat compaction was acceptable for all test sections, even when paving in less-than-ideal circumstances.
Additional roller passes had the biggest effect on compaction than any other factor, but with diminishing returns. On average, each pass reduced the air voids by 1.5%, but the sixth roller pass reduced the air voids by only 0.1%.
Two-lift cores had about 1.3% higher air voids than single lift cores because the air voids at the bond interface were considerably higher (about 14%) compared with the rest of the core (about 4%).
As the ratio of lift thickness to NMAS increased, so did the air voids content.
The bottom of the mat was more segregated (higher air voids) for thicker lifts. Additional compaction effort did not improve compaction at the bottom of the mat.
Roughness
The evaluation of roughness was inconclusive. There was more variability from project to project, than from the number of lifts or the screed settings.
Recommendations
Thick-lift asphalt concrete paving is a valid construction approach. A thick one-lift layer has better overall compaction, and more uniform compaction, than a two-lift layer because the high-air void interface is eliminated. Still, there are constraining factors, like long cooldown times and potentially increased roughness, which limit the scenarios that are appropriate for thick-lift construction.
Scenarios for when to use thick-lift paving:
thick mill-and-fill patches;
emergency repairs or in urban areas where streamlined paving operations are important;
to place thick intermediate lifts at one time. (For example, place one 4-in. lift of SP Type C (0.5-in.) instead of two 2-in. lifts);
asphaltic concrete base layers;
perpetual pavement layers;
when there is a concern with bonding of multiple lifts;
when rapid heat loss of the mixture is a concern for compaction.
Scenarios for when NOT to use thick-lift paving:
for the final riding surface when optimal ride quality is needed;
roadways that need to be opened to traffic very quickly;
if mixture delivery will not be consistent—frequent paver stops will increase roughness.
if milling and construction would leave excessive work zone dop-offs that cannot be adequately protected.
The following are guidelines for the best practices for thick-lift paving.
Paving Equipment
The researchers could not conclude whether a tamper bar screed improves thick-lift paving. They do believe, though, that thick paving can be performed with a lighter, traditional vibratory screed and paver, but this was outside the scope of the study.
Compaction
Add breakdown roller passes to the rolling pattern. Of all the study factors, this was the most effective way to improve compaction. This is especially important if paving with a traditional vibratory screed. Determine the optimal number of passes to achieve proper density using onsite testing.
Use pneumatic rollers to improve deep compaction when placing base or intermediate layers.
Be sure to roll unconfined edges of the mat but monitor for lateral movement of the mat that may cause the roller to sit unevenly.
Bear in mind that the relationship between mixture tenderness, which is the tendency of HMA to move laterally rather than densify during compaction ( 35 ), and lift thickness was not considered in this study and should be evaluated in future research.
Opening to Traffic
Use tools to estimate the cooldown time in the design process to help determine traffic control strategies. (See the MultiCool calculator, hosted by Auburn University: https://www.eng.auburn.edu/users/timmdav/MultiCool/FinalRelease/Main.html).
Keep closed to traffic until the surface temperature reaches a desired level (e.g., 160°F is used in Texas).
As needed, apply water to the surface to shorten the cooldown time.
Lowering the mixing and application temperatures (e.g., using warm mix) has less effect on cooldown times for thick lifts than typical lift thicknesses, and might not substantially reduce the time to opening to traffic.
Ride Quality
Since paving in one lift usually results in a rougher ride, consider providing additional smoothness opportunities such as milling, leveling-up, or placing a final surface course.
Ensure the mix delivery is sufficient to minimize paver stops.
Rolling patterns should be optimized to ensure the compaction operation does not contribute to roughness.
Footnotes
Acknowledgements
The authors thank the project manager, Tom Schwerdt, and the project monitoring committee, Ray Brady, Travis Patton, Ryan Barborak, Enad Mahmoud, and Kevin Plumlee. The authors also thank the personnel that helped coordinate, provide equipment for, and construct the test sections. From TxDOT, these were Will Buskell, Shane Cunningham, Shannon Ramos, Jennifer Vorster, and Roger Horst. The contractors were Madden Construction LLC, Reynold’s Asphalt Co., and Mario-Sinacola & Sons. Equipment manufacturers and vendors were Kirby-Smith Machinery, Wirtgen Group-Vögele, and Caterpillar Inc. Several Texas A&M Transportation Institute (TTI) employees helped collect data, sample pavement cores, and perform laboratory testing: Jason Huddleston, Lee Gustavus, Wenting Liu, Tony Barbosa, Poura Arabali, and Camilo Jurado.
Author Contributions
The authors confirm contribution to the paper as follows: study conception and design: Wilson and Goehl; data collection: Saca and Wilson; analysis and interpretation of results: Wilson and Saca; draft manuscript preparation: Wilson, Saca, and Goehl. All authors reviewed the results and approved the final version of the manuscript.
Declaration of Conflicting Interests
The authors declared no potential conflicts of interest with respect to the research, authorship, and/or publication of this article.
Funding
The authors disclosed receipt of the following financial support for the research, authorship, and/or publication of this article: This research was jointly funded by the Texas Department of Transportation and by the Federal Highway Administration under TxDOT research project 0-7064 – Use of Tamper Bar Paver to Place Thick Lift Asphalt Concrete Pavement.