
Abstract
Accessibility to food stores offering nutritious and affordable options is critical to ensure urban residents lead healthy lives. However, the uneven distribution of diverse food options in U.S. cities has raised concerns about marginalized communities’ ability to obtain affordable and nutritious food. Transportation-related issues, like car-oriented urban form and sprawl, have created food deserts in cities, making it hard for marginalized communities to access affordable and healthy food. This lack of access has recently drawn the attention of urban planners to address food access-related equity issues. Spatial interaction models can help measure food access by examining how grocery store supply, demand, and proximity affect individuals’ access to necessary food. However, these measures do not always consider the pricing of food items, which can significantly affect food access for low-income individuals and families. We use a highly disaggregated measure tailored to measuring inequitable food accessibility by factoring grocery store pricing into various types of supply and demand. Then, using regional socio-demographic thresholds, we identify target population groups and perform a series of equity analyses using our food accessibility measure. Our results show that walking is more inequitable than driving to food stores and that African American and Hispanic minorities, the elderly, and carless households are more burdened than the reference groups (whites). Using our framework, we identify food deserts and provide spatial and empirical insights for policymakers and planners to address food insecurity and promote equitable access to healthy food.
Keywords
Spatial accessibility to retail outlets of healthy, inexpensive food is crucial for maintaining a healthful diet, which affects many health outcomes. To access nutritious foods, individuals must have financial capability, spatial proximity, and sufficient food literacy ( 1 ). Researchers have started incorporating these elements into their analysis in the past few years, allowing for a more comprehensive understanding of nutritious food accessibility ( 2 ). Regional food environments are an essential element of urban lives as consumption behaviors are influenced significantly by food store accessibility. Ensuring urban residents enjoy a healthy life requires better access to fresh product options.
Sen’s idea of entitlement to healthy food stresses individuals’/households’ entitlements to commodity bundles (such as food) and sees starvation as an outcome of failing to be entitled to any commodity bundle with ample food ( 3 ). He offers directions to measuring food accessibility by focusing on commodity bundles and entitlement where the prior refers to the supply side of food accessibility (variety of food options) and the latter refers to the demand side, that is, the potential of individuals or households to purchase healthy food (income, buying power). In this approach, food accessibility is considered a distributive aspect and a central tenet of food security ( 4 ). Healthy food accessibility and equity discussions have become trending among urban planners worldwide ever since Sen ( 3 ) laid out his entitlement approach. Thus, from here onwards, for the ease of reading, we refer to commodity bundles as supply, and entitlement as demand.
Nevertheless, the distribution of healthy food options is not uniform in urban areas ( 5 ), raising concerns about low-income and other communities’ lack of access to affordable, nutritious food ( 6 ). People of color, rural residents, low-income communities, and minorities are disadvantaged in most aspects of the food production and consumption system compared with the elites and the general population, who tend to have higher levels of education and disposable income ( 7 ). Likewise, people without automobiles or the capability to utilize public transportation (such as seniors) cannot take advantage of healthy, low-priced options readily available to those who can drive ( 8 ). Those with the most significant nutritional needs have difficulty accessing cheaper, more diversified food options ( 9 ). Such population segments mostly have no choice but to shop at mom-and-pop establishments, with limited fresh food supply and higher costs ( 9 – 11 ).
Scholars who study food equity believe that regional transportation plans may help increase food equity by making it easier for low-income families to get healthy foods by reducing the time and money spent on transportation ( 12 ). Given the significance of transportation infrastructures in facilitating access to nutritious food, planners should consider the diverse mobility requirements of urban and rural areas. By tying together transportation and development choices with their far-reaching effects on food, planners may use the strengths of regional plans to improve food equity. Recognizing such issues, planning scholars are pushing for the frame of equity and justice in recognizing food-related barriers that vary across geographic, economic, and racial lines ( 12 – 17 ). These equity issues have triggered the adoption of an analytical viewpoint that brings equity and accessibility together ( 7 ). Since then, there has been a massive trend in the academic and planning communities to map and quantify areas with limited access to nutritious food ( 18 ).
Spatial equity in food accessibility relates to whether food services are spread reasonably throughout space according to inhabitants’ needs ( 19 , 20 ). Its evaluation is often based on food accessibility measurement, as it reveals the availability of physical closeness to food services ( 21 , 22 ). Generally, equity in accessibility can be considered from the horizontal and vertical perspectives ( 23 , 24 ). Horizontal equity requires each similar individual or group to have the same distribution of costs or benefits ( 25 ). In horizontal equity, we assess how resources are spatially distributed across a population or a region. Vertical equity, also known as “social equity,” aims to provide services to those who need them most ( 26 ). Here, we lay stress on how benefits are distributed across socioeconomic groups ( 27 ). The principle of horizontal equity assumes that all individuals in the population possess identical abilities and needs, entitling them to equivalent shares of both burdens and benefits. However, this assumption can be challenged by employing vertical equity analysis. In such an analysis, population groups are categorized according to their specific needs, capabilities (such as mobility needs in transportation), and various socioeconomic factors like race and income ( 25 ). Given the diverse range of population with varying needs and abilities in cities, it is essential to complement horizontal equity analysis with vertical equity analysis.
Planners and public health policymakers face difficulties because of the unequal distribution of healthy, inexpensive food possibilities brought about by the expansion of the suburban superstore and the abandoning of more minor, urban supermarkets ( 28 ); this is one area where underserved populations are not favored ( 29 ). Also, most scholars have measured food accessibility using commodity bundles ( 30 , 31 ) but ignored individuals’ entitlement to healthy food. Likewise, although a few studies have applied the concept of horizontal equity assessments in food equity studies ( 22 ), the idea of vertical equity assessments still needs to be incorporated.
However, previous studies have failed to recognize the importance of pricing in measuring food equity access. Pricing of food items can have a significant impact on low-income individuals’ and families’ ability to access food. To close this gap in the literature, we propose a new food accessibility measure that considers both food supply and the demand of individuals to purchase accessible food. Such an accessibility measure will help present finer insights into inequities in accessing healthy food options across different population segments, particularly those with restricted commuting and food-choice alternatives. We also propose a framework for measuring horizontal and vertical equity in food accessibility. Our equity assessment framework is easy to implement and, at the same time, offers nuanced equity insights as a result of the highly disaggregated food accessibility measure we propose. To demonstrate a case study, we chose Houston-Galveston Metropolitan Area as our study area.
Centering on the issues discussed above and the planned framework, we first evaluate how supply–demand mechanisms and availability of transportation options affect food accessibility. Then we look at how equitably are the measured food accessibilities distributed in the metropolitan area and across different population groups. Finally, we provide insights into the spatial distribution of food deserts in the study area with respect to areas having higher potential demands. We structure the remaining sections of the paper as follows. We begin with a literature review and then provide a methodological framework for addressing the stated study topics. Next, we discuss the study’s methodology and data. After that, we present detailed section-wise results from our case study. We conclude with some thoughts and recommendations for both policy and future studies.
Literature Review
There are various categories of food stores that are generally considered when evaluating food accessibility. Supermarkets, defined as corporate-owned large chain stores, have been found to provide residents with a variety of healthy food items. In addition, small supermarkets, often commonly called grocery stores, are smaller noncorporate-owned stores that also offer residents food options; in addition, specialty food stores that often provide people access to fruits, vegetables, and meat also offer residents healthy food options ( 32 ). Convenience stores, mostly attached to gas stations, focus on a restrictive range of food categories and are the primary go-to spots for quick purchases. Regrettably, these stores often offer restricted selections of healthier food options, potentially contributing to adverse health consequences ( 33 – 37 ). Farmers’ markets and community gardens, on the other hand, enhance community-wide fruit and vegetable consumption patterns, particularly in low-income neighborhoods when food access may be limited ( 38 ). Foodservice and drinking places include other stores, including full-service restaurants, fast-food restaurants, carryout eating places, carryout specialty items, bars, and taverns ( 39 ). However, our study focuses explicitly on chain supermarkets, as the majority of the population accesses these locations for their grocery shopping ( 32 ).
Food environment studies have recognized the contributions of spatial methods for assessing peoples’ proximity to food stores. Several scholars in other disciplines have adapted the gravity-based job accessibility measure developed by Hansen ( 40 ) to calculate access to other types of opportunities. For instance, Huff, interested in modeling individuals’ choices concerning shopping destinations, developed a gravity-based utility model that considers the square footage of stores and travel time between zones for computing the probability of choosing a particular shopping zone ( 41 ). Similarly, Schneider and Symons calculated the accessibility to regional health facilities adopting Hansen’s accessibility measure ( 42 ). In a similar fashion, extending Hansen’s ( 40 ) job accessibility model, Guy ( 30 , 31 ) evaluated accessibility to Reading’s local retail facilities by summing up the product of the mean expenditure of every household in every zone and the shortest straight-line distance between a store selling a particular good ( 11 ). However, he ignored the competition between different types of food retailers ( 19 ), neglecting the quality–quantity tradeoff in his measurement. As the quality–quantity tradeoff is understood, we can fine-tune accessibility metrics ( 43 ). Recognizing these limitations, some scholars have tried to touch topically on how supply, demand, and geographical isolation influence people’s ability to get the food they need ( 11 ).
Chang and Lee pointed out that to understand market competition and household food consumption patterns in detail, integrating data on the types of stores from which different households purchase food is necessary ( 44 ). Those living near a high-price grocery store are more likely to shop there exclusively. In contrast, those whose nearest store is average are more likely to drive farther to reach a superior option ( 43 ). Thus, the availability of high-price supermarkets is more critical than many supermarkets for certain people. Contrastingly, low-price supermarkets are essential for people who cannot afford expensive food ( 43 ). These studies have evaluated food insecurity using different food accessibility measures. However, the limitation of these measures is that they have used (a) a large unit of analysis, (b) arbitrarily chosen travel-time thresholds ( 45 ), and (c) ignored the utilization component of food security ( 46 ), generating imprecise food accessibility measures.
To understand such trade-offs (considering the relevance of the quality of jobs and the capability of individuals to access different job types) for measuring employment accessibility, Pan et al. incorporated job competition and matching in a single measure ( 74 ). To do so, they incorporated different job types (blue- and white-collar) on the supply side and the capability of individuals to match those jobs (considering people with educational attainment matching to blue- and white-collar jobs and commuting by different transportation modes) on the demand side. Developing such an integrated measurement for food accessibility that helps understand the quality–quantity tradeoff is essential.
According to a study by Larsen and Gilliland on London and Montreal in Canada, low-wage workers who utilize mass transit and reside in an inner city lack easy accessibility to supermarkets because supermarket chains are only present in suburban areas located away from transit lines ( 47 ). While low-income employees are more prone to rely on convenience shops, often near transportation hubs, food deserts might affect their nutrition and health ( 47 ). Food deserts, as described by Furey et al. ( 48 ), have emerged because of the proliferation of colossal chain supermarkets, which have forced out smaller, independent grocery shops in neighborhoods and have been exacerbated by economic segregation brought about by the movement of middle- and upper-class families to the suburbs ( 49 ).
In the United States, automobility has facilitated access to once-isolated suburban areas near major highways previously deemed inaccessible. As a result, non-car owners increasingly rely on limited resources in urban core areas. Moreover, big-box development has intensified competition, impacting traditional family-owned stores negatively and erasing the Central Place Theory’s notion of a closely linked retail structure attached to urban areas ( 50 – 52 ).
The preferred choice of driving as a travel mode guided the strategic placement of grocery stores in easily accessible suburban areas with ample parking spaces. This choice is driven by the recognition that locating in areas near major highways optimizes supply-chain logistics, contributing to cost reductions in the storage and procurement of perishable food ( 53 ). In addition, businesses are less likely to relocate in urban cores because of other issues like the negative public opinions of the region, and a shortage of low-skilled manpower ( 54 ). Likewise, Zenk reported that factors including limited disposable income and lower household car ownership rates can also affect grocery store location choices ( 55 ). These demand–supply mechanisms along with other systematic challenges including zoning regulations, and transportation accessibility ( 56 ) also drive the location decisions of grocery stores. Likewise, retailers are typically discouraged from establishing operations in urban food deserts because of financial concerns, thereby perpetuating food deserts, although these places have benefits such as great location, an unmet need, and access to a significant work population. Such apparent disparities in the food environment highlight the need to undertake a food equity evaluation.
Planning for food equity must propel cities and regions to eliminate systemic barriers within the food system, especially those that prevent marginalized and disadvantaged communities and population groups from accessing, buying, or growing healthy food options ( 12 , 13 , 17 ). The terms marginalized and disadvantaged are often used to describe groups or communities that face social, economic, or political challenges and are marginalized or excluded based on factors such as age, race, gender, income, and ethnic minority status ( 57 ). These populations may experience reduced access to resources, opportunities, and equitable treatment in various aspects of life. Therefore, planning for food equity also must take these population groups into concern.
As mentioned previously, equity can be measured from horizontal and vertical perspectives. One of the most common methods of assessing horizontal equity is using Lorenz curves and Gini coefficients ( 27 ). Zhang et al. plotted Lorenz curves and computed Gini coefficients to determine the degree to which different modes of transportation serve disparate populations ( 20 ). They found 6% of restaurants in rural areas were accessible by foot and bus, highlighting high food accessibility disparities in rural areas compared with urban areas. Using the Gini coefficient and Lorenz curves, Li et al. looked at differences in access to grocery shops across Taipei’s neighborhoods to determine if the elderly are more susceptible to food inequity than the general population ( 22 ). Eight communities in urban and suburban settings have huge access gaps for the elderly; only two villages in suburban regions had high access disparity rates for the population that is not elderly. Although several food deserts studies have used Lorenz curves and Gini coefficients to assess equity ( 58 , 59 ), only the above two studies use these measures to assess equity outcomes using food accessibility as performance measures.
Chegini et al. evaluated sustainable food security in rural areas and the impact of household livelihood and income disparity ( 60 ). They measured household food insecurity using Household Food Insecurity Assessment System (HFIAS) and the Food Co-security Index (FCS). Also, household welfare was evaluated using six indicators, and income disparity was measured using Theil, Atkinson, and FGT indices. They found that income disparity among homes in the marginal and moderate categories was more significant than that among other households. Applying a regression decomposition approach, Lukwa et al. showed within-group and between-group health disparities based on their socioeconomic status ( 61 ). Although food insecurity dropped by 4.35% over the study period, the malnutrition rate increased by 1.03%. Children living in poverty in remote regions saw an increase in the prevalence of malnutrition and nutritional insecurity.
Descriptive methods that combine accessibility and demographic variables are often employed to locate food deserts ( 62 , 63 ). Several studies and regions have produced conflicting results about the presence and frequency of food deserts. Research undertaken in the United States metropolitan areas provides solid empirical evidence of food deserts ( 64 , 65 ). The results for Canada, however, are contradictory, with some research showing that low-income areas had greater access to cheap and healthful food, whereas others showed the reverse ( 47 ). Several British studies have shown food deserts in low-income areas of Leeds/Bradford and Cardiff ( 11 ), whereas others have found no major disadvantage for any demographic categories in British cities, leading to contradicting conclusions ( 66 , 67 ).
Our literature review suggests that only a few studies have considered the pricing of food items, which can have a significant impact on food access for low-income individuals and families. Further, only few studies have used accessibility as a performance metric to measure equitable food access. That said, scholars have not delved into the demand–supply and price–choice mechanisms that affect the distribution of food accessibility across different population groups. To our knowledge, no studies have evaluated food equity using horizontal and vertical inequality metrics and tried to identify food deserts in a single study. In the remainder of the paper, we attempt to develop a framework and fill these gaps identified in the literature.
Methodology and Data Preparation
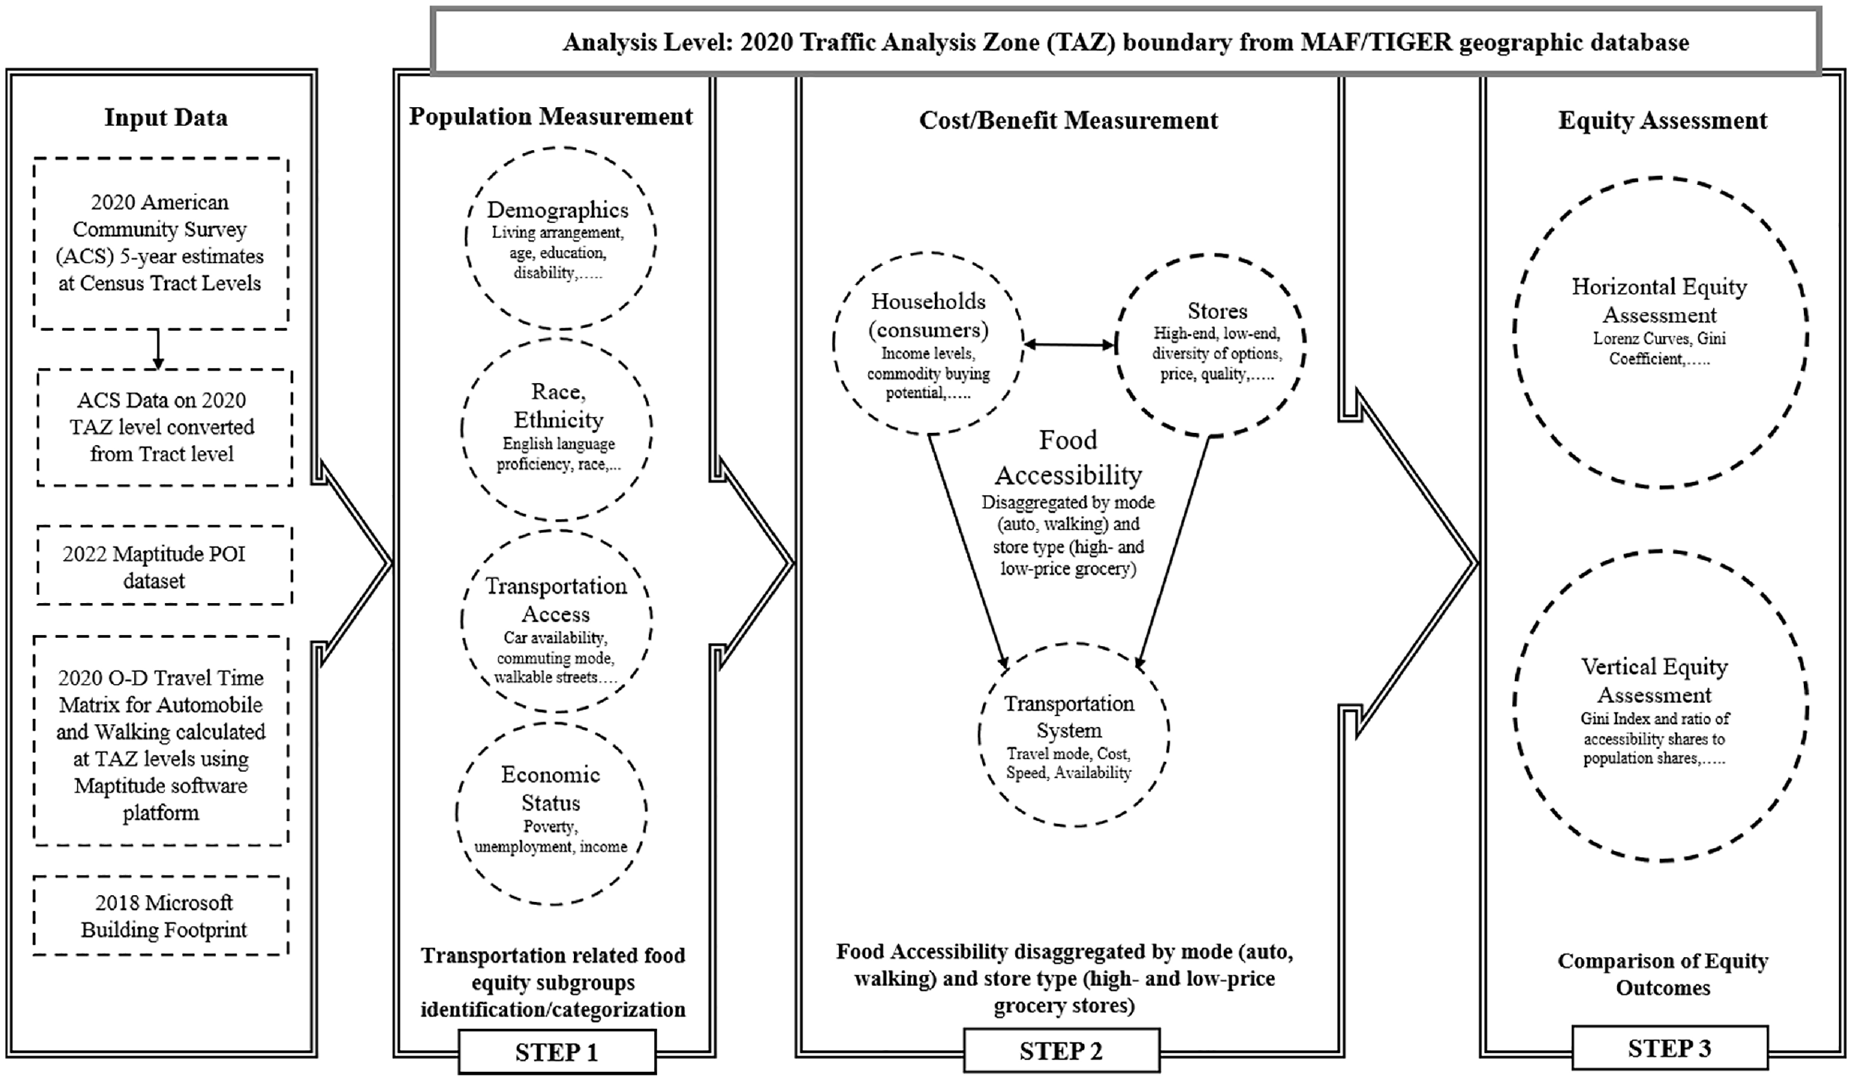
This section offers a description of our equity assessment framework. First, we use regional thresholds to identify population subgroups. After that, we outline a new equation for food accessibility measurement (that considers both supply and demand-side factors). Lastly, we employ Lorenz curves, Gini Coefficients, and ratio of accessibility shares to population shares to evaluate food accessibility’s equity outcomes.
Incorporating different transportation modes and matching supply types with demand type for calculating food accessibility to measure equity outcomes will be an essential contribution to the literature on food equity. Unlike previous equity assessments, the four food accessibility measures used in the study (i.e., driving to high-price stores, walking to high-price stores, driving to low-price stores, and walking to low-price stores) can highlight equity in accessing food based on food availability, food pricing, transportation mode, and people’s potential to purchase food. Also, our study uses standard equity metrics to measure horizontal and vertical equity outcomes for different populations. Figure 1 highlights the equity assessment framework developed for this study.
Methodology.
Population Measurement
Segregation in metropolitan areas is often conceptualized as a function of population divisions with a high representation of minority populations ( 68 ). Based on Executive Order 12898, which identifies various population groups that may be disproportionately affected by environmental hazards, regulatory actions should consider the potential environmental justice (EJ) implications for these groups. According to the Council on Environmental Quality’s guidance on implementing this order in 1997, we classify the population groups of concern based on race, car ownership, and seniors.
As regions vary in relation to their regional characteristics, relying on arbitrary thresholds when assessing equity introduces inaccuracies, potentially leading to either overestimation or underestimation of the dominance of specific population groups in certain zones ( 69 ). The Title VI of the Civil Rights Act of 1964 and the Intermodal Surface Transportation Equity Act (ISTEA) of 1991 mandate that each Metropolitan Planning Organization (MPO) address concerns about inequities related to transportation benefits and burdens. This ensures that projects and investments are free from discrimination based on people’s socioeconomic status ( 70 ). In adhering to this directive, each MPO establishes thresholds (below, at, or above) that align with regional attributes (such as cost of living, income, racial/ethnic makeup, and average household sizes). This is done to effectively identify and categorize minority and disadvantaged groups within the region for equity assessment ( 71 ).
Thus, in accordance with the Houston-Galveston Area Council’s (HGAC) manual for citing percentages, we used HGAC’s regional percentages to identify traffic analysis zones (TAZs) with a higher proportion of a particular racial minority population. For this study, the regional percentages used were 61.54% for minorities, 17% for African Americans, 37.3% for Hispanics, 8.1% for Asians, 11.07% for elderly, and 6.75% for Zero Automobile Ownership ( 72 ). TAZs with proportions of a particular minority population above these regional averages were identified as minority-dominant TAZs. TAZs that did not fall into any of these racial groups were classified as Mixed TAZs, representing TAZs that may have higher proportions of two or more of the minority races mentioned above.
Accessibility Measurement
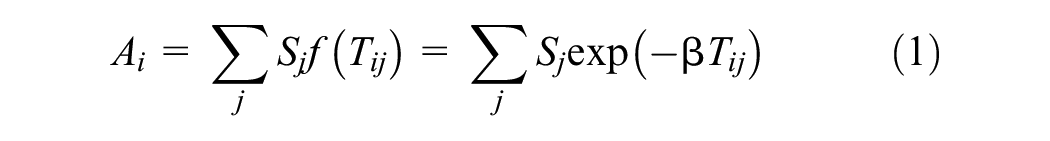
Accessibility measurement has been adopted in planning practice since Hansen ( 40 ) developed a gravity-based employment accessibility measure. Guy ( 30 ) extended Hansen’s ( 40 ) equation and developed a retail accessibility measure presented in Equation (1).
where
Accessibility is inversely proportional to travel cost, that is, the higher the accessibility, the lower the travel cost. Considering this assumption, impedance functions, that is,
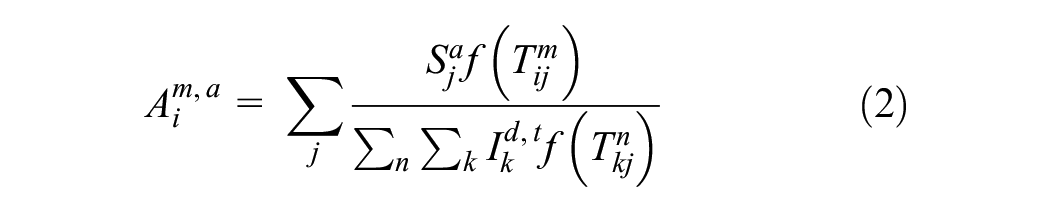
Guy’s ( 30 ) measurement of accessibility neglected the demand aspect of food accessibility. To address this gap, we have proposed a new approach to measuring food accessibility, inspired by Pan et al. ( 74 ). Our proposed approach considers both the supply and demand components of food accessibility. Specifically, we match the food supply type, which is measured by the number and size of stores, to the demand type, which we measure using household income as a proxy for the potential of individual households to purchase quality food. By incorporating competition and matching into our food accessibility measure, we aim to provide a more accurate representation of the accessibility of different kinds of food options in an area. Equation 2 presents our proposed food accessibility measure.
where
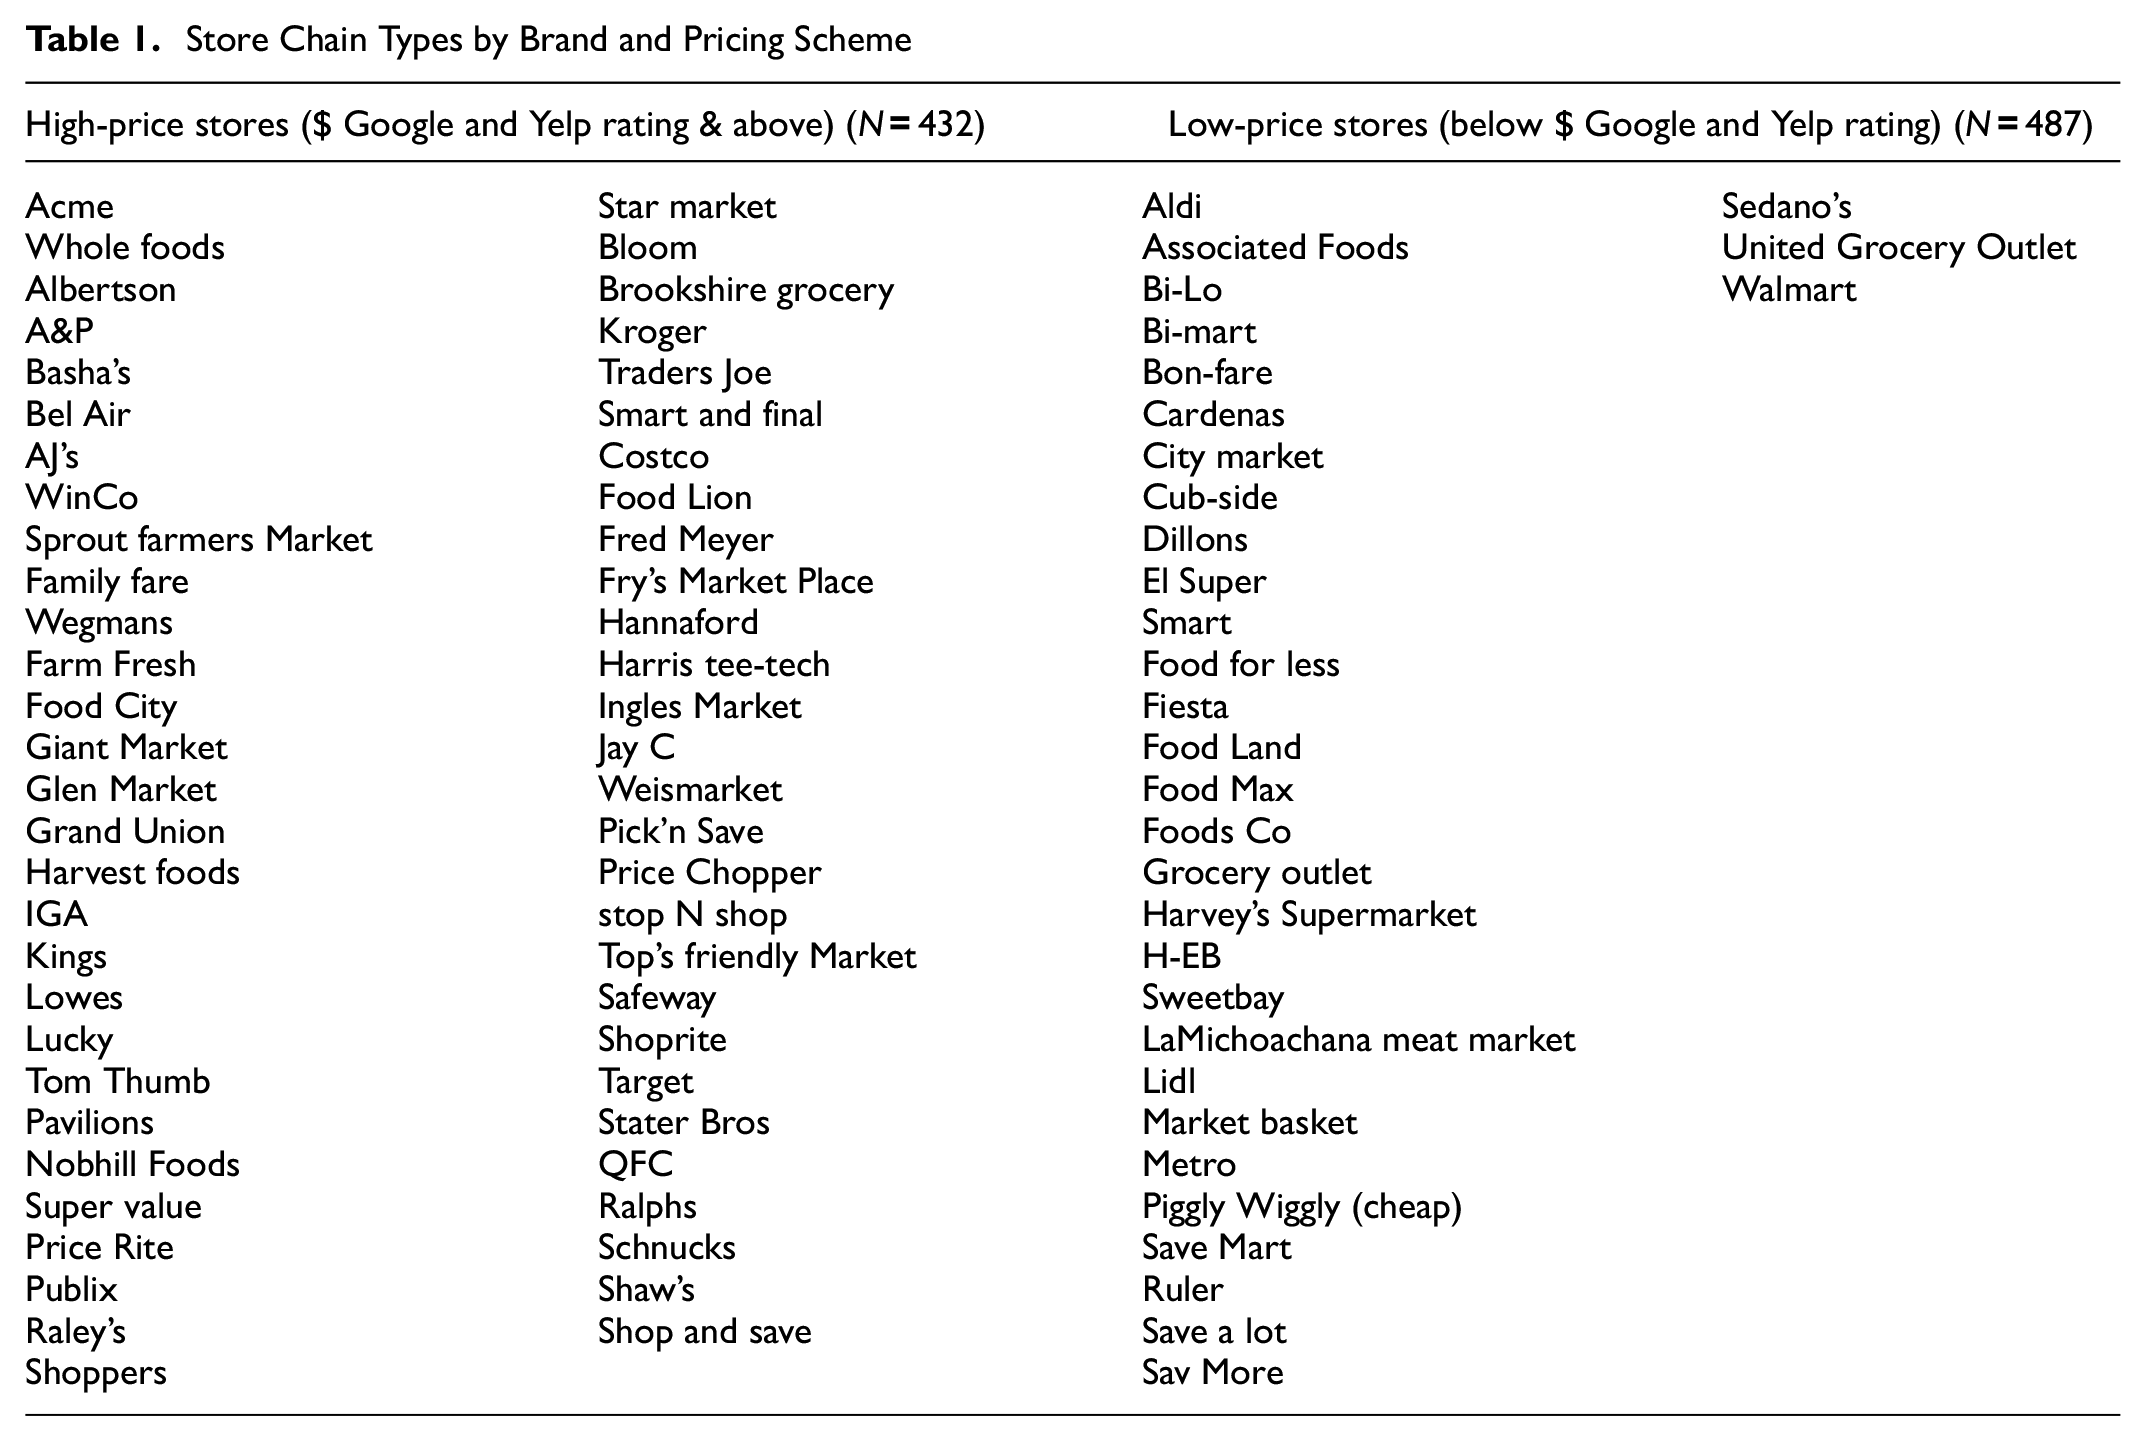
Collaborating with undisclosed entities collecting credit and debit card transaction details from individuals, responsible for documenting 70% of all U.S. transactions, Google collects data (including the location, time, purchase type, and expenditure on a product) that have undergone anonymization through sophisticated algorithms. Then Google integrates this information with data from its applications (Google Maps, Google Search, Gmail) to analyze and determine spending patterns on specific products in stores ( 75 , 76 ). Similarly, Yelp collects transaction details and computes the average cost of purchase a customer does at a particular location ( 77 ). Using such data, platforms Google and Yelp utilize specific descriptors to associate establishments with the services they offer ( 78 ). The descriptors are crafted to enhance users’ search capabilities and provide detailed information about particular establishments, including the types of establishments and their subcategories, and their pricing schemes ( 79 , 80 ).
In short, both Google and Yelp platforms have developed means of collecting transaction data in tandem with user-reported information to develop pricing information for each business using which they develop pricing schemes. In both Google and Yelp pricing scheme descriptors, a one-dollar sign ($) refers to an average transaction cost per person under $10. On the other hand, a two-dollars sign on Google descriptor refers to an average transaction cost between $11 and $25, whereas the same on Yelp refers to an average transaction cost between $11 and $30 ( 75 , 77 ).
Caliper’s Point of Interest Data include point layers by location categories like auto dealership, hospitals, banks, grocery stores, and restaurants. These data are updated yearly for the United States, and periodically for other countries including Australia, United Kingdom, Ireland, Canada, Austria, Switzerland, Germany, and many more ( 81 , 82 ). We use these data along with information from Google Maps and Yelp to categorize food stores into high- and low-price grocery stores ( 83 , 84 ). Then we utilize Microsoft’s 2018 building footprint data to calculate the total supply of food products in each TAZ (Figure 1). As Microsoft’s building footprint data capture all existing building footprints in a city ( 85 ), using this dataset is of paramount importance to our study. This is because we could (I) link each food store to its building footprint, and (II) obtain the area of those food stores. Thus, after categorizing the food stores into high- and low-price types, we linked each food store to their building footprints, calculated the area of each food store, and then summed the total food store area in each TAZ to calculate the total attractiveness of grocery stores in every TAZ. This enables us to measure the food supply in high- versus low-price grocery stores. To quantify demand, we use household income as a proxy for a household’s financial capacity to purchase healthy food. Specifically, we divide households into groups based on whether their income is above or below the median household income. Alongside these inputs, we also calculate food store proximity measured by Maptitude-driven origin–destination (O-D) matrices for different transportation modes at the TAZ levels.
The distinctions among the specifications of impedance functions predominantly lie in their approaches to incorporating distance-related factors, consequently influencing accessibility measurement. Scholars have used numerous variations of the impedance function, yet there is limited empirical evidence to determine which is best for usage. Wilson’s negative exponential function (
73
) offers an advantage by exhibiting a more gradual decline than other functions, thereby providing more accurate estimations for shorter trips, especially those undertaken through nonmotorized modes (
86
–
88
). This advantage, combined with a history of numerous practical applications, establishes it as a suitable impedance function for utilization in the current study. Thus, this study adopts Wilson’s negative exponential formula, that is,
Our selection of travel modes that households might take to reach grocery stores were based on the United States Department of Agriculture (USDA) Food APS survey ( 89 ). Out of the 4,826 surveys conducted in the entire nation, 1,785 surveys were conducted in the Southern census region (where our case study is located), from which 1,739 reported visiting a supermarket or grocery store for food purchases. Among these respondents, approximately 96% used private automobiles, 2% walked, 1% used buses, 0.2% cycled, and 0.8% utilized other transportation modes. Based on these findings, it became evident that most of the surveyed population either drove or walked to grocery stores. Consequently, we focused on studying these two modes of transportation in our research.
On average, most American residents’ travel time to reach a shopping destination, primarily a grocery, is around 25 min (
90
–
92
). Likewise, the average travel time to grocery stores by foot in American and European cities is approximately 15 min (
93
–
96
). Thus, for estimating our friction factors for grocery shopping trips, we use a travel-time threshold for automobile trips of 25 min and walk trips of 15 min. Our
Store Chain Types by Brand and Pricing Scheme
Inequality Measurement
The Lorenz curve compares the accumulated distribution of a commodity under interest (food accessibility in this case) to the ideal of ideal proportionality for a statistical sample. On a diagram, inequality is represented by a convex arc, with a more acute convexity reflecting greater inequality ( 97 ). Gini coefficient is a disproportionality measure based on the Lorenz curve. The Gini coefficient is a simple statistic frequently employed to explain how resources are allocated across population groups ( 59 ) represented in the equation below.

where
Suppose the Gini coefficient is close to zero, and the Lorenz curve is close to the equality diagonal. In that case, the resource of interest (in this case, food destination types) is distributed fairly across all receiving units in the research area. Suppose the Gini coefficient is closer to 1. In that case, the resource is more concentrated in a few areas within the research area ( 98 ).
Although the Gini coefficient is widely used for within-group inequality measurement, it alone cannot highlight the between-group inequality between subpopulations. In such a case, in addition to the Gini coefficient, inequality within and between subpopulations can be measured using population shares and benefit shares (food accessibility in our case) of corresponding subpopulations where the weights for both population and income shares add up to one ( 25 , 99 , 100 ). Then the ratio between the share of accessibility to the share of population (AS/PS) can be calculated as:

where Pj is the jth group share in total population, and Sj is the jth group benefit (food accessibility) share ( 101 ). In such a case, if the value of the AS/PS ratio is higher, the level of inequality is low, and vice versa ( 99 ).
Identification of Food Deserts
The USDA defines a “food desert” as a low-income neighborhood where a significant portion of the population resides more than 1 mi (in urban areas) or more than 10 mi (in rural areas) from a retailer, big-box chain store, or other large grocery stores ( 102 ). Based on this definition, we use two criteria for identifying food deserts. Firstly, we identify dense urban clusters using a threshold of 5 persons per acre or more. This is because, according to the 2020 U.S. Census Bureau, urbanized areas in Houston have a population density of 3,340 persons per square mile, which is equivalent to 5.218 persons per acre ( 103 ). Secondly, within these dense clusters, we use our walking to low-price (WLP) stores measure, which considers both walking travel time and low median household income, to identify areas of high inaccessibility. Specifically, we look for TAZs with a WLP value of less than 10, which indicate food desert locations.
Empirical Study
Study Area and Data Collection
Our study focuses on HGAC’s eight-county regions, including Brazoria, Chambers, Fort Bend, Galveston, Harris, Liberty, Montgomery, and Waller counties. H-GAC, the MPO for the economically thriving eight-county Houston-Galveston Metropolitan Area, oversees transportation planning projects. Since 1980, H-GAC’s population has surged by a million each decade, increasing annually by almost 120,000 people. In such a thriving economy, strategic efforts across all forms of transportation, informed by the needs of all kinds of travelers, would be essential as the region continues to expand.
In 2015, HGAC saw nearly 170 million miles of daily travel on its 25,000 mi of roads. About 10% of the road network consists of freeways, including interstate and limited-access highways, carrying more than 40% of daily traffic. Arterial routes make up most of the road network. Collector lanes accommodate 7% of daily traffic, and 180 mi of toll lanes accommodate 8% of daily traffic. Seven public transit services serve seven counties. Municipal bus lines, park-and-ride/commuter operations, demand responsive, and light rail dominate service. H-GAC has 1,215 bikeways, with Houston having 300 bikeways. H-GAC’s pedestrian and cycling locations are also expanding. H-GAC has built about 87 km of bicycle–pedestrian routes since 2009. According to the 2012 American Community Survey (ACS), nearly 4,000 Houstonians bike to work and almost 7,000 regionally ( 104 ).
Data collected for our analysis were derived from several sources. Our socioeconomic data and other necessary information, including mean travel time, were derived from ACS. H-GAC provided the cartographic boundary files for 2020 at the TAZ levels. Caliper’s Maptitude 2022 Point of Interest and Microsoft 2018 Building Footprint layer datasets helped gather primary inputs for developing the commodity bundle part. Likewise, ACS data on median household income gathered at census tract levels and converted to TAZ level helped calculate the entitlement part. The Maptitude software platform helped calculate the O-D travel-time matrices for automobiles and walking as commuting modes, the final piece required for calculating the food accessibility measure. Other data for conducting equity analysis, like median household income, population distribution by race, age, and car ownership were gathered at the census tract level and converted into TAZ-level data in the GIS environment, as TAZ is our analysis unit.
The following sections highlight the empirical findings of our equity analysis design. We spatially show how the availability of transportation options and matching food supply with demand affect food accessibility measurements. Thereafter, we present the horizontal equity analysis outcomes, followed by our vertical equity assessment outcomes with respect to race, age, and car ownership.
Preliminary Results
We first separated the food stores by their pricing schemes and found 432 high-price stores and 487 low-price stores in the study area. Then, we used Equation 3 to compute food accessibility to different kinds of grocery stores for buyers traveling by automobile and walking as commuting modes. Figure 2 depicts accessibility to high-price and low-price stores using automobiles and walking as the travel mode.
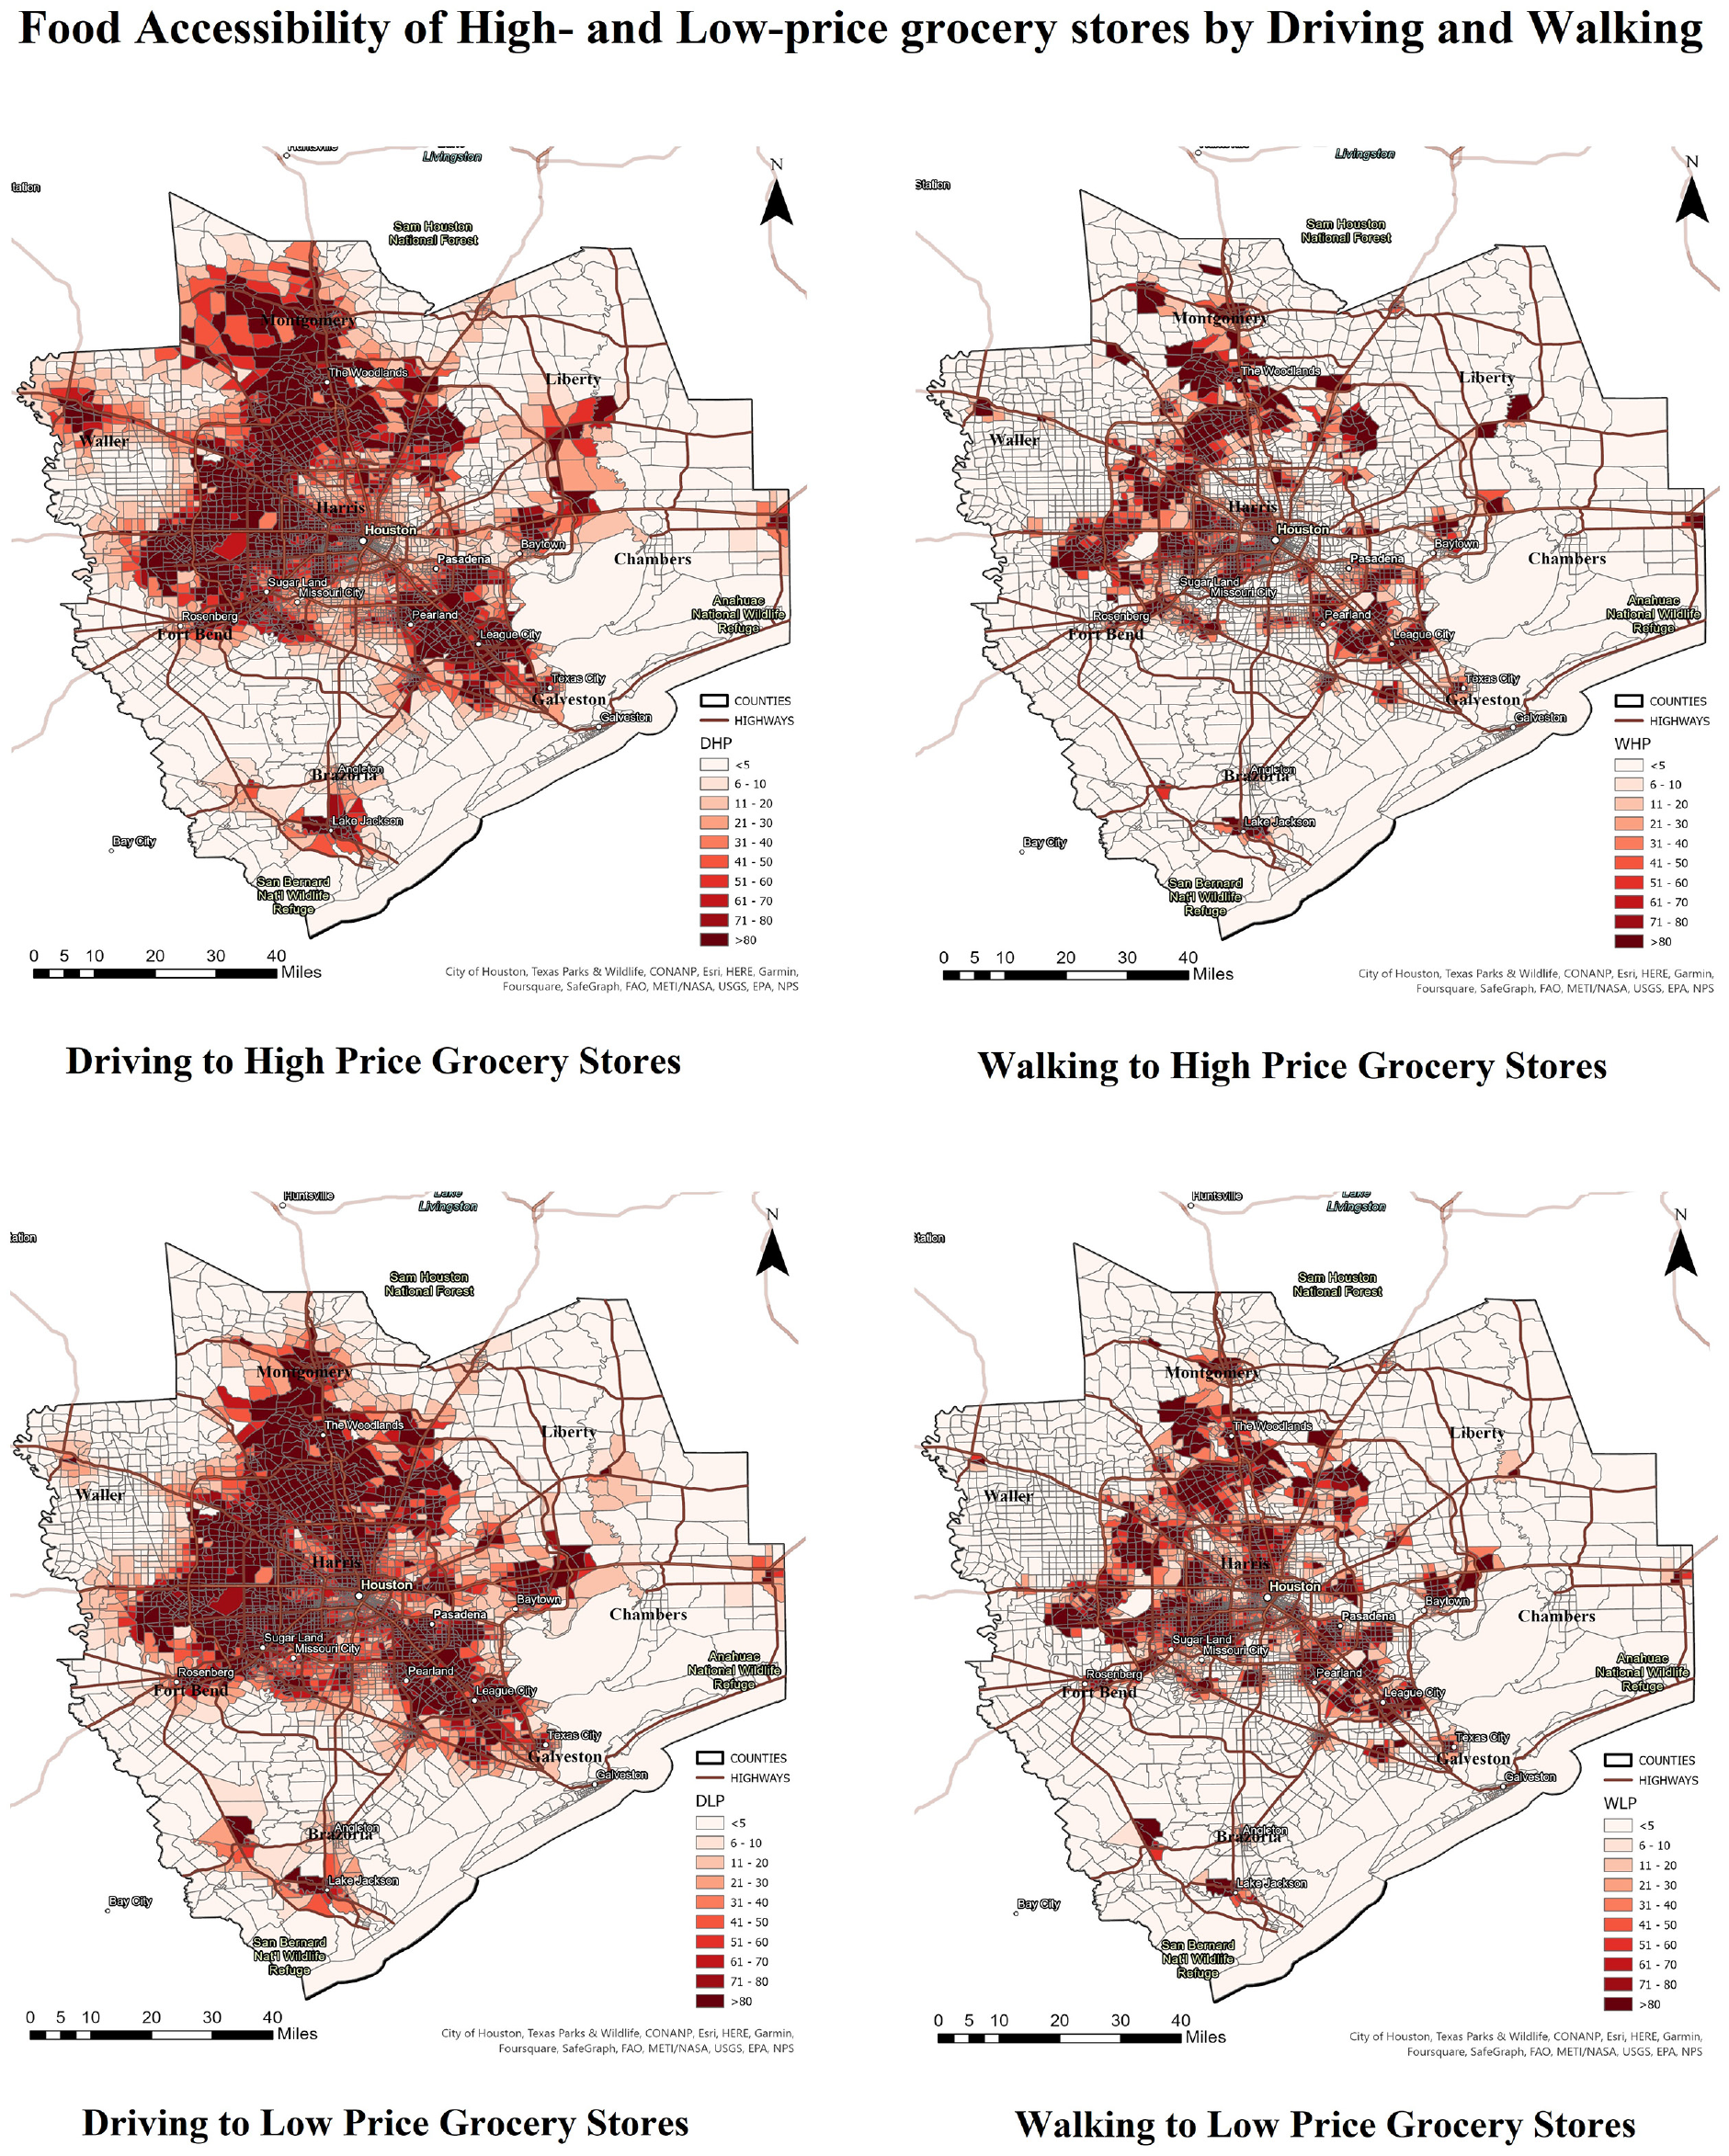
Accessibility of high- and low- price grocery stores by driving and walking modes.
In Figure 2, the darker color (with larger numbers) denotes better accessibility and vice versa. Our results suggest that food accessibility varies both across mode and store type: Driving to High-price Grocery store (DHP), Walking to High-price stores (WHP), Driving to Low-price stores (DLP), and Walking to Low-price stores (WLP). Our observations from DHP & DLP accessibility maps show higher accessibility values for DHP than DLP in HGAC metropolitan area. This is probably because the area is highly car dependent, and little has been done for improving walking access to various opportunities including food stores. The results also show that DLP is fairly evenly distributed in the city center, with DHP having about the same level of accessibility in the city center as well as in more remote neighborhoods. Contrastingly, WHP & WLP accessibility maps show higher accessibility for low-price stores than high-price stores. It can be seen from the maps that DHP accessibility values are much higher than DLP in Montgomery, Waller, and Liberty Counties, all of which are remote areas.
In contrast to driving to stores, WLP and WHP are mainly limited to the inner city, with WLP having slightly better distribution of food accessibility. Also, our food accessibility maps clearly show that food deserts in HGAC metropolitan area lie mainly toward the eastern side of Harris County, the northern and central part of Montgomery County, and most of Waller, Fort Bend, Brazoria, Liberty, and Chamber counties. It should be mentioned that accessibility to low-price stores should be mapped for identifying food deserts as marginalized communities, who are usually overburdened in relation to transportation costs, often are not capable of taking advantage of high-price stores, even if accessible. The results also highlight the importance of considering different transportation modes for identifying food deserts. Our accessibility maps also show that high-price grocery stores locate in high-income suburban neighborhoods, thereby leaving a lot of food deserts in central places where a lot of marginalized people reside.
In the next step, we use EJ indicators (race, vehicle ownership, and senior population) to disaggregate our food accessibility measures using H-GAC’s Environmental Justice manual ( 72 ). Table 2 reports the findings from our descriptive statistics. To highlight disparities faced by racial minorities, elderly population, and carless TAZs in accessing healthy food, we ran t-tests and calculated the DHP difference, DLP difference, WHP difference, and WLP difference between TAZs dominated by the Reference Category and TAZs dominated by different population categories (such as Hispanic, African American, Asian, and Mixed). We also checked to see if the difference between the Reference and other categories were significant or not.
Descriptive Statistics
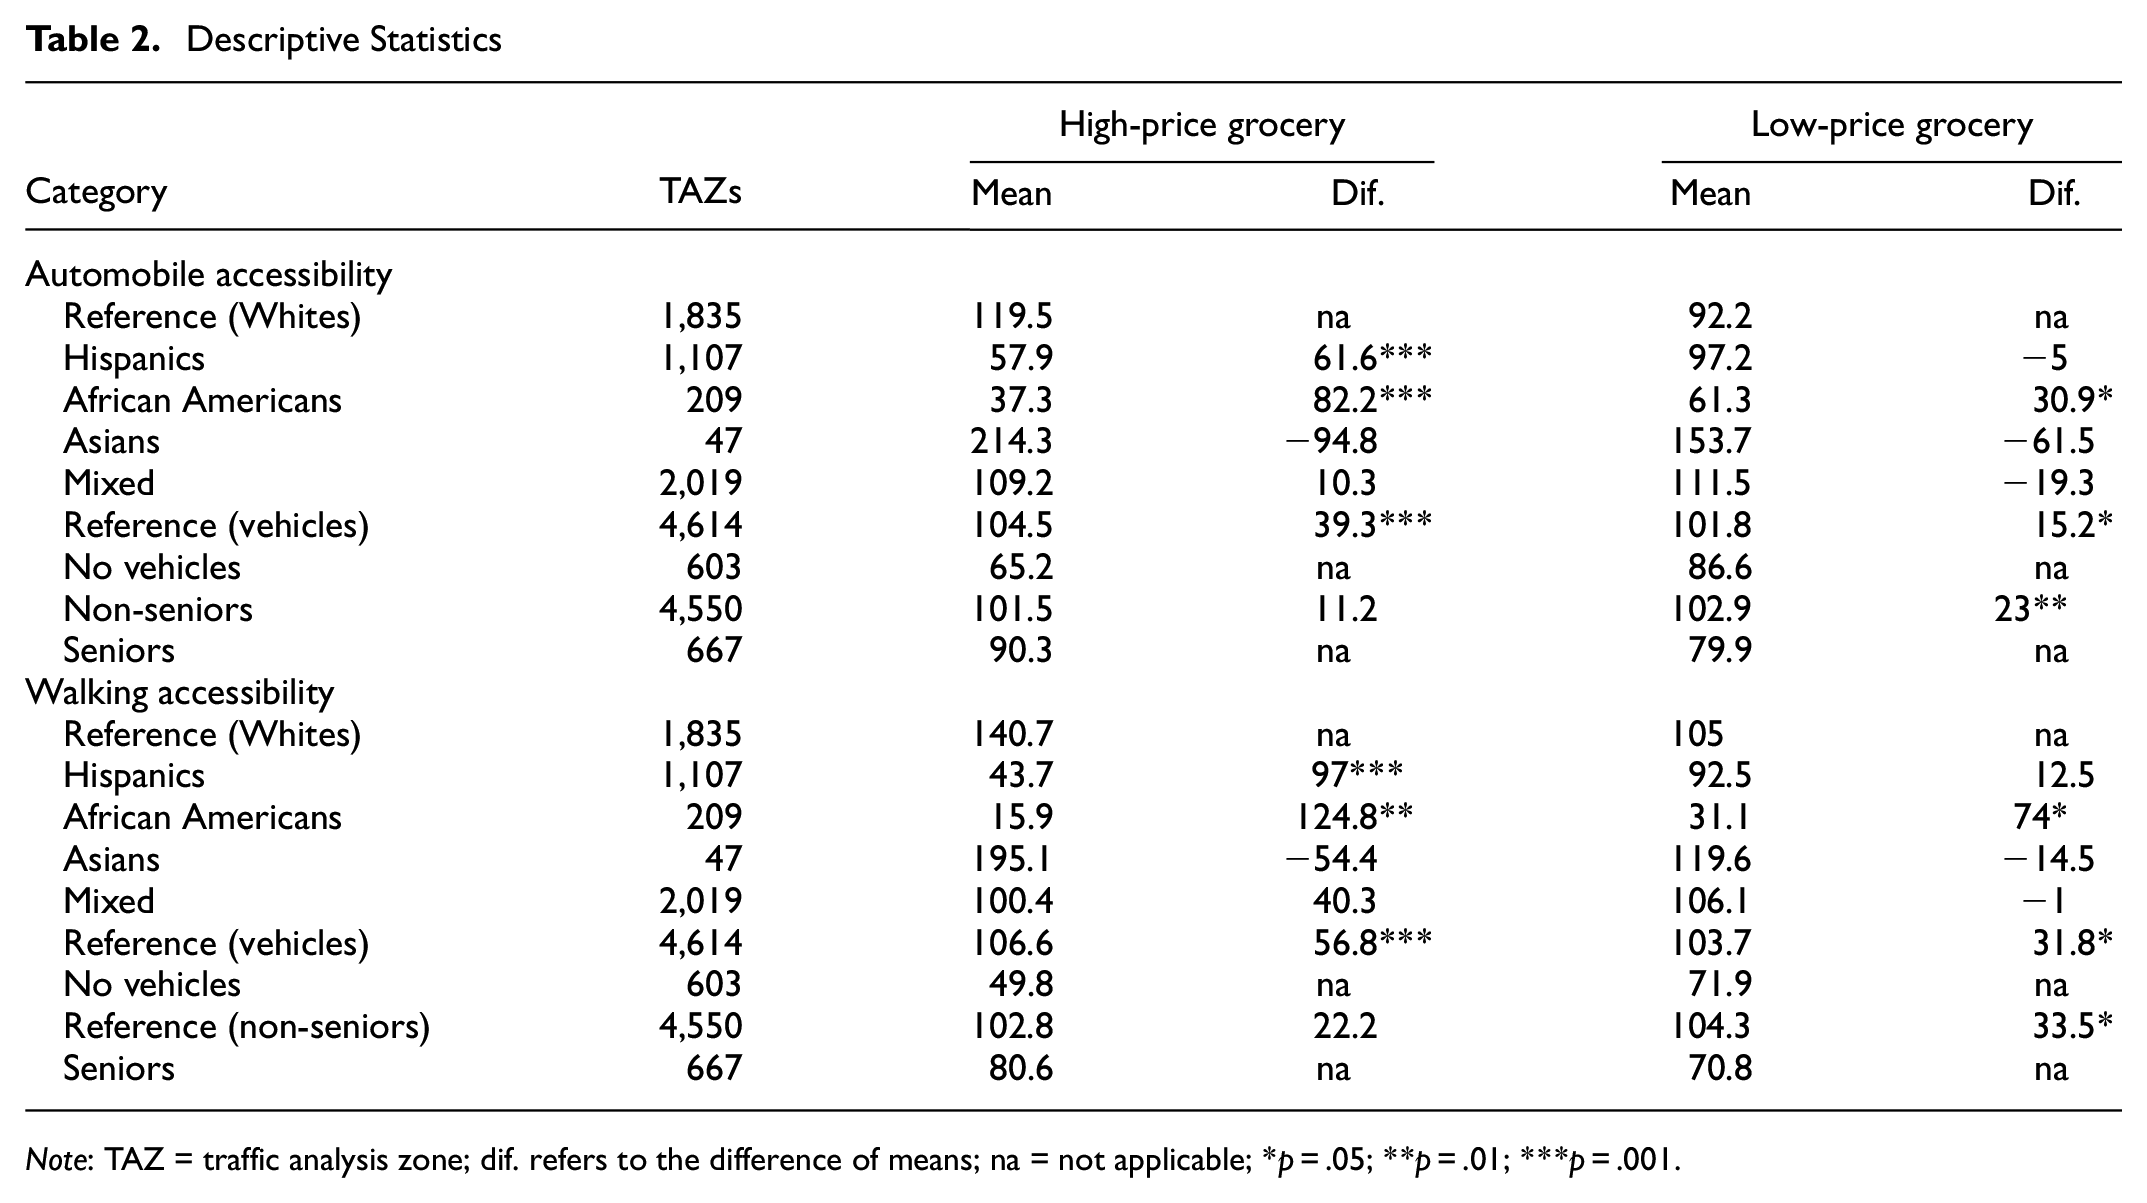
Note: TAZ = traffic analysis zone; dif. refers to the difference of means; na = not applicable; *p = .05; **p = .01; ***p = .001.
When comparing the DHP and WHP for the reference and Hispanic categories, we found a significant difference between the means of the two groups for both the categories. On the contrary, we did not find any significant difference when comparing the difference in the DLP and WLP for the same groups. These results suggest that Hispanic TAZs have access to low-price grocery stores (and their accessibility levels are not very different from the Reference TAZs) but face disparities in accessing high-price grocery stores by driving and walking modes.
When we compared the DHP, WHP, DLP, and WLP for the reference and the African American group, we found a significant difference between the means of the two groups for all four categories. It is interesting to note from these results that African American TAZs are highly disadvantaged in relation to accessing food options, whether it be high- or low-price groceries or accessing them by automobile or walking. Although we found insignificant differences for other racial categories, it is worth noticing from the descriptive statistics that Asian groups have higher accessibility levels than the Reference group.
Similarly, comparing the DHP, WHP, DLP, and WLP for the reference and the carless group revealed a significant difference between the means of the two groups for all four categories. It is clear from these results that carless populations are highly disadvantaged when accessing different grocery store types, either by walking or driving.
When comparing the DHP and WHP for the Reference and Seniors categories, we found no significant difference between the means of the two groups. Contrastingly, we did not find a significant difference when comparing the difference in the DLP and WLP for the same. These results suggest that for seniors, high-price stores are easily accessible compared with low-price stores, by both driving and walking modes. Although these results could be favorable for seniors who have higher disposable income, those that have lower income and low purchasing power might face severe disparities. The results from our comparison of descriptive statistics clearly show the presence of equity issues in the HGAC area.
Horizontal Equity Analysis
The concept of horizontal equality holds that all population groups should be treated equal, and no group should be prioritized more in relation to receiving benefits. The Gini index is a helpful tool because it provides a single quantitative measure that is not reliant on size and can be used to examine the distribution of resources for various scenarios in metropolitan regions ( 105 ). So, to assess the level of horizontal equity present in the study area, we compare the results of our accessibility calculations using two measures, that is, Lorenz curves and Gini coefficient. Figure 3 compares the Lorenz curves (obtained by plotting cumulative accessibility measures against the cumulative population) of our four accessibility measures against the perfect equality line.
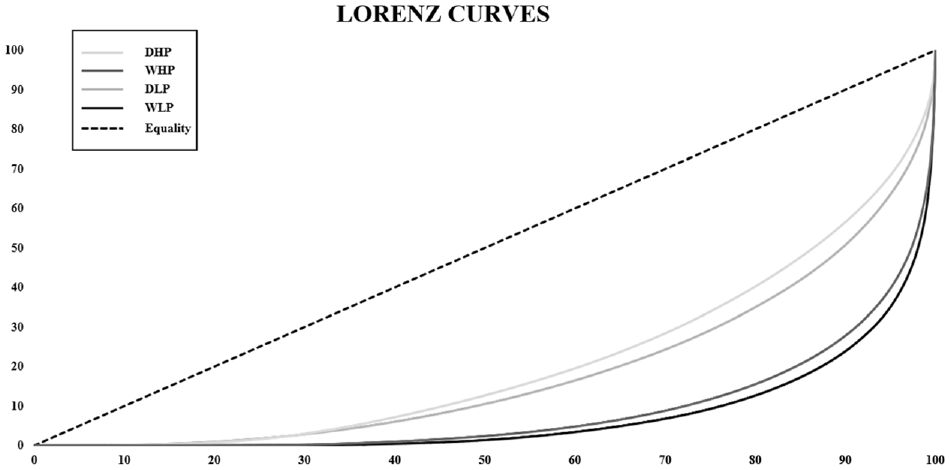
Horizontal equity assessment (Lorenz curves).
Our observations from Figure 3 reveals better distributions for DHP & DLP than WHP & WLP. This result shows that accessing grocery stores by automobile is much easier than accessing grocery stores by foot in the HGAC metropolitan area, again reinforcing that Houston is car dependent. We can see from Figure 3 that 80% of DLP is shared by 40% of the total population, 80% of DHP is shared by 35% of the total population, 80% of WLP is shared by 15% of the population, and 12% of the total population share 80% of WHP, respectively. Our reported values of the Gini coefficients for WHP, WLP, DHP, and DLP are 0.822, 0.850, 0.582, and 0.628. We can see from these results that low-priced grocery stores have a better distribution compared with high-priced stores, as high-priced stores in the HGAC metropolitan area are less distributed toward the city center and more distributed toward the suburban areas.
Vertical Equity Analysis
Vertical equity refers to providing higher benefits to those in need ( 106 ), and aims to prioritize more benefits in favor of marginalized populations. From an egalitarian point of view, providing equal access to opportunities does not indicate equal service; instead, it assumes we must prioritize developments and benefits for marginalized populations susceptible to encountering challenges in accessing any benefit. Our study utilizes the Gini index and the ratio between accessibility and population shares to highlight disparities in vertical equity across different marginalized population groups. To this end, we use socioeconomic indicators of race, car ownership, and the elderly population in our study. As our accessibility measurement already controls for income, we do not measure vertical equity with respect to income. In the following sections, we present the findings of our vertical equity analysis for race, followed by vehicle ownership, and finally for elderly populations.
Vertical Equity Analysis with Respect to Race
Figure 4 shows the general results of the vertical equity analysis with respect to race and visualizes the Gini coefficient for each racial group and each accessibility measure. As expected, walking to grocery stores has a much higher level of inequality than driving, whether we are considering traveling to a high or low-price store. Moreover, WLP has a better accessibility distribution than WHP for all racial groups. DLP and DHP seem to have relatively similar levels of inequality. However, we find that African American racial groups have the highest level of equality, followed by Hispanics and Asians. It is important to note that the Gini coefficient is not solely enough to comment on the distributional impact of food accessibility. Although the Gini coefficient can illustrate the level of inequality within each sub-group, it may not be able to compare disparities among various groups.
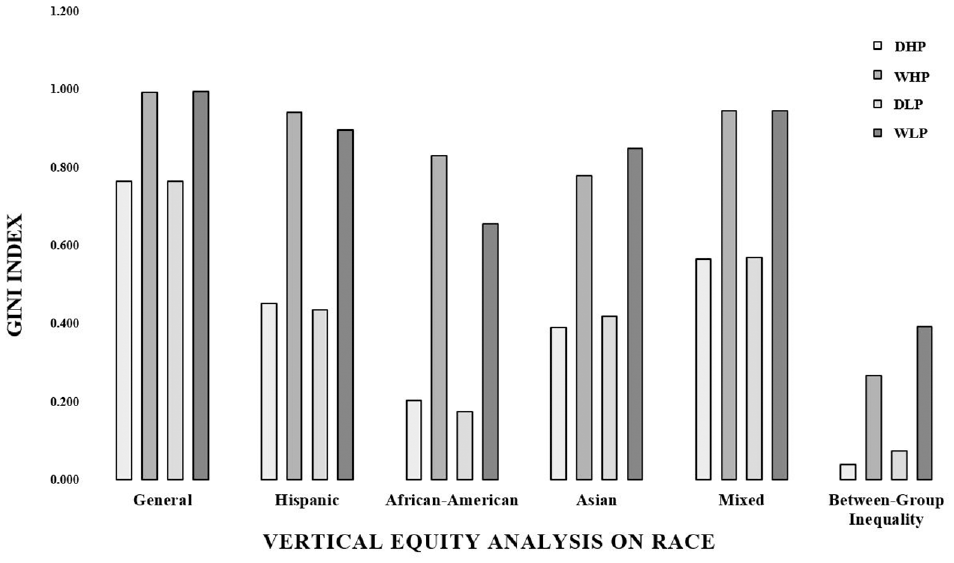
Plot of vertical equity analysis with respect to race (Gini index and between-group inequality).
Table 3 breaks down each accessibility measure by racial groups, AS/PS ratio, and their respective Gini coefficients for every county. According to Table 3, African American-dominant TAZs are present in Brazoria, Fort Bend, Galveston, Harris, and Waller counties. Hispanic-dominant TAZs are present in all counties except Chambers County, and Asian-dominant TAZs are located only in Fort Bend and Harris County. From our within-group inequality assessments, Gini coefficients for Asians, Hispanics, and African Americans are similar and, simultaneously, lower than other groups when we look at all accessibility types. However, our interpretation of between-group inequality using the AS/PS ratio shows that most Asians have a proportionally higher share of accessibility than Hispanics and African Americans.
AS/PS ratio and GINI for Race (Within and Between Group Comparison)
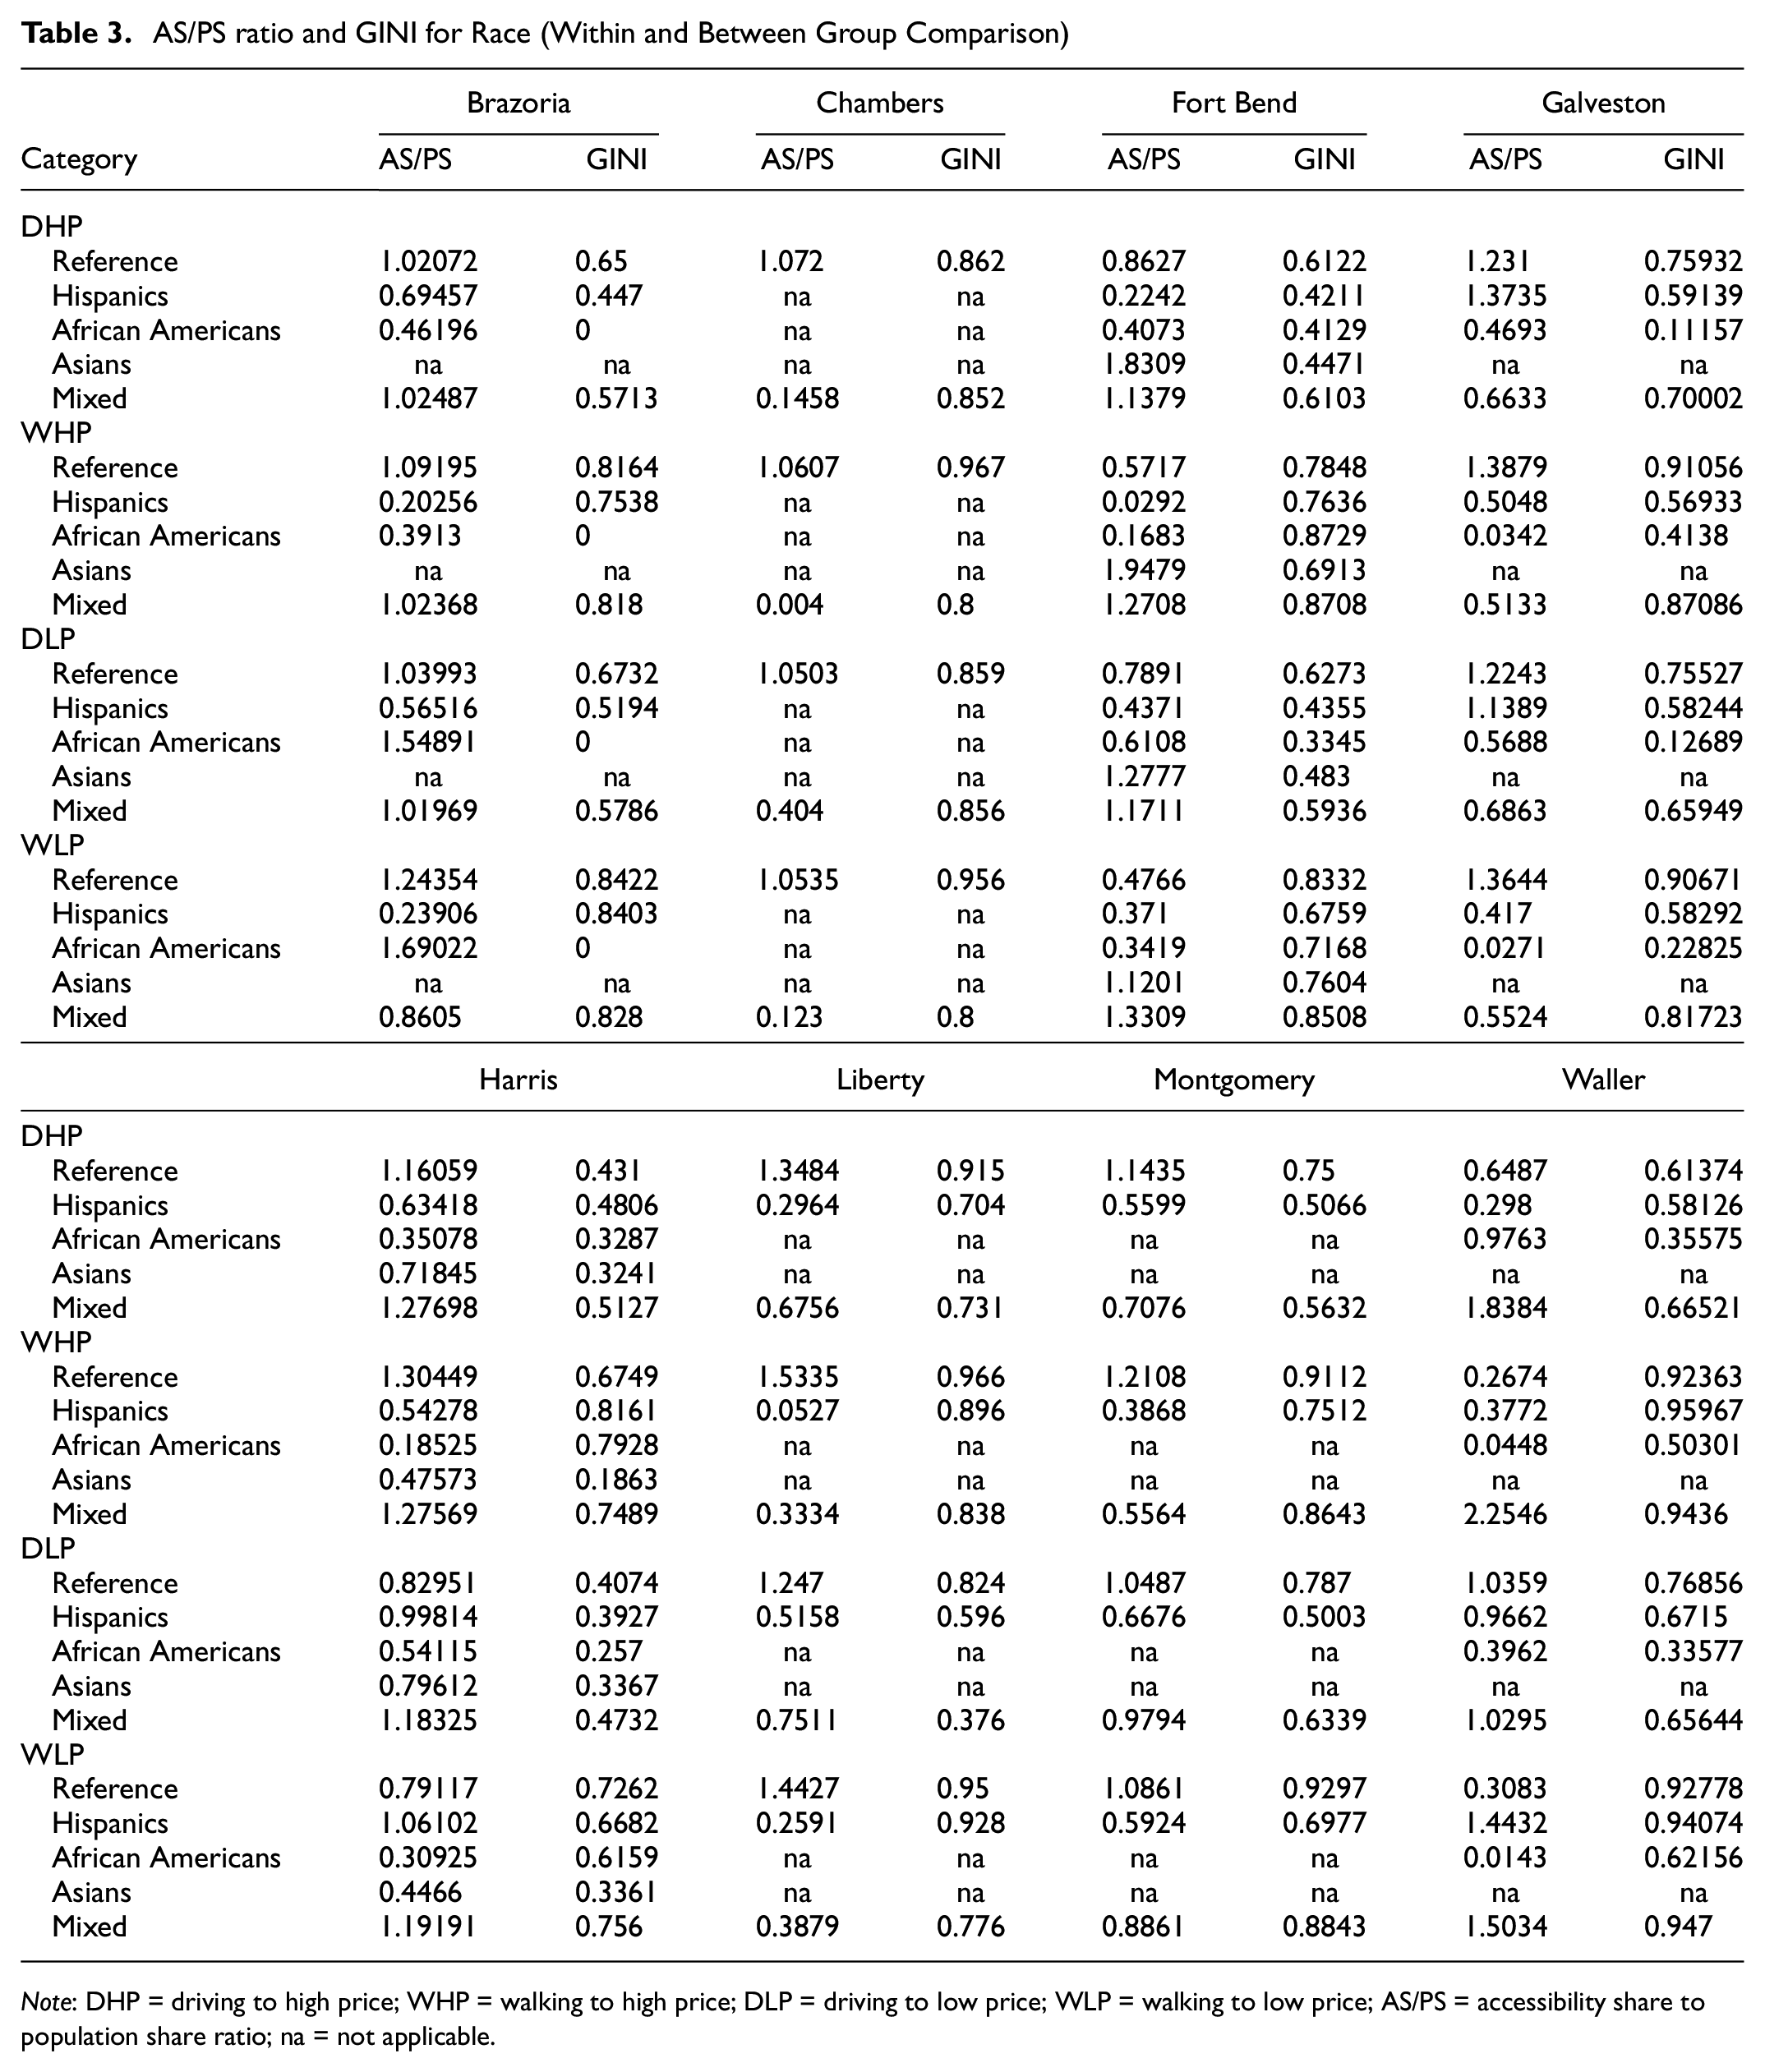
Note: DHP = driving to high price; WHP = walking to high price; DLP = driving to low price; WLP = walking to low price; AS/PS = accessibility share to population share ratio; na = not applicable.
Likewise, our results show that in the case of DHP, African American-dominant TAZs have a high AS/PS ratio in Waller County compared with other counties. Likewise, when considering DLP and WLP, AS/PS ratio is higher for African American-dominant TAZ in Brazoria County, compared to other counties. Similarly, for all four accessibility measures, Hispanic-dominant TAZs have a high AS/PS ratio in Galveston County. Likewise, when considering DLP and WLP, the AS/PS ratio is higher for Hispanic-dominant TAZ in Harris and Waller counties. In the case of mixed-race TAZs, our results show that AS/PS ratio for all accessibility types is high in Brazoria, Fort Bend, Harris, and Waller counties compared with other counties. It is also interesting to note that Asians have the highest AS/PS ratio in Fort Bend County (even more than the reference group) and a relatively good AS/PS ratio in Harris County compared with other racial minorities. A rational reason for that probably is that most Asian households enjoy relatively high-paying jobs and opt to live in areas with good access to food.
Notably, fewer modal disparities exist for the Asians, Mixed, and Reference categories as well as disparities related to supply type. In contrast, disparities exist for all other racial groups. Table 2 also shows that high-price stores are less equitable for Hispanics and African Americans than low-price stores. Also, African Americans and Hispanics have, by far, the lowest AS/PS ratio for WLP in Harris County, which indicates severe racial equity issues for accessing food stores using different transportation modes. For instance, the AS/PS ratio for DLP and WLP is 0.83 and 0.79 for Reference TAZs and 0.54 and 0. 31 for African American TAZs. This comparison of results in Harris County demonstrates the modal disparities existing for certain racial groups. The reason for such a finding is probably because most high-price stores follow affluent neighborhoods in remote areas, whereas racial minorities reside in the central city with limited opportunities. For accessibility to low-price stores, the results show that Hispanics have a slightly better AS/PS ratio when compared with African Americans. However, our results show that African American and Hispanic TAZs still need to be adequately supplied with provisions for good access to low-price stores.
Vertical Equity Analysis with Respect to Vehicle Ownership
In this study, we use vehicle ownership to perform a vertical equity analysis on accessibility to food stores. Figure 5 shows the Gini coefficient for all four food accessibility measures across zero and non-zero vehicle ownership TAZs. We chose vehicle ownership rates as a factor for our vertical equity analysis because our accessibility measures are separated by walking and driving. Therefore, looking at the distribution of food accessibility, considering vehicle ownership as a governing factor can illuminate existing disparities in the study area. Figure 6 shows that zero vehicle ownership TAZs have a lower Gini coefficient, thus, low inequality levels.
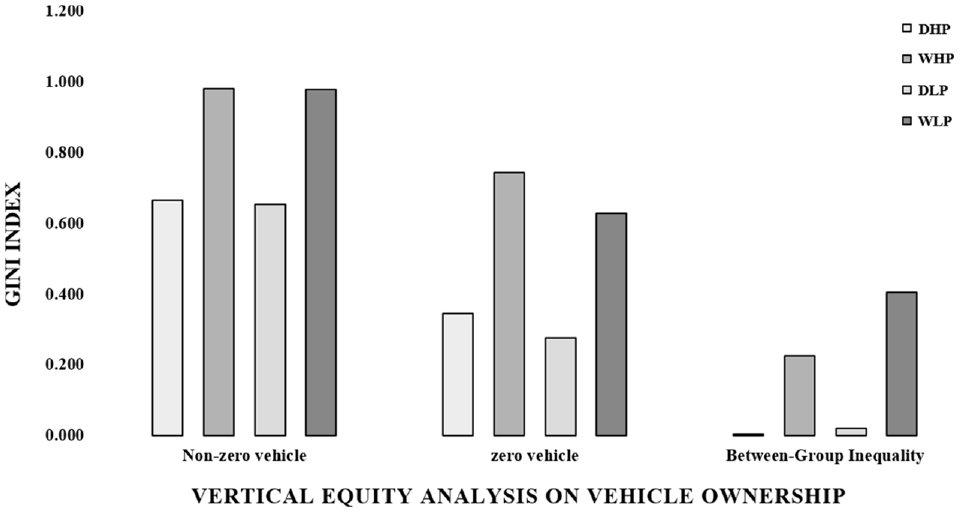
Plot of vertical equity analysis with respect to vehicle ownership (Gini index and between-group inequality).
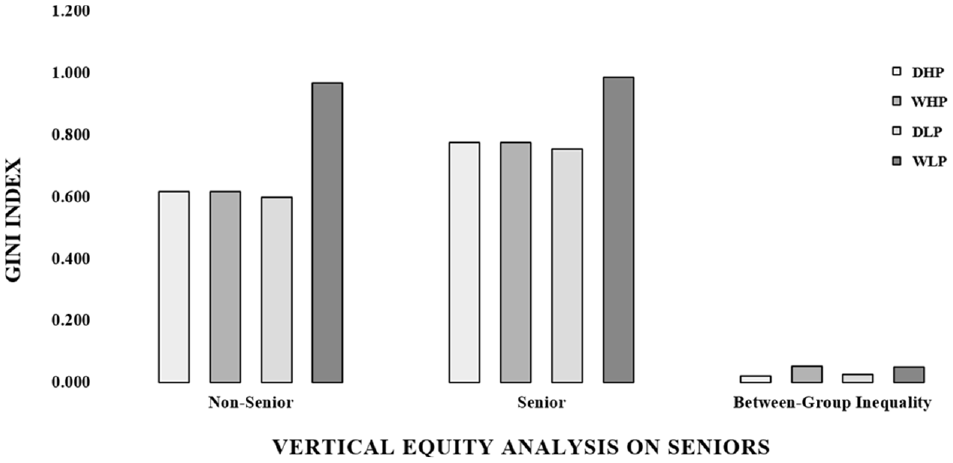
Plot of vertical equity analysis with respect to elderly population (Gini index and between-group inequality).
Moreover, aligned with previous findings, walking to food stores is more unequally distributed than driving. The results summarized in Figure 6 show the inequality level within TAZs. That said, for a better analysis of existing disparities in relation to accessibility to food stores, a between-group equity analysis can yield more interesting results. Table 4 shows the population’s share and accessibility for each category of TAZs. For instance, Table 4 shows that for DLP, the AS/PS ratio is around 1.01 for non-zero car ownership, whereas the AS/PS ratio is around 0.9 for their respective counterparts. This disparity is more severe for WHP and WLP. For WHP and WLP, the AS/PS ratio for non-zero car ownership TAZs is around 1.02 and 1.04, respectively, whereas the same for zero car ownership TAZs are around 0.8 and 0.7. Although the AS/PS ratio for non-zero car ownership TAZs remains steady across all four measures, the AS/PS ratio for zero vehicle ownership TAZs is much lower when we look at WHP and WLP. These findings suggest that households without access to private cars face more difficulties accessing food stores.
AS/PS ratio and Gini for Vehicle Ownership (Within and Between-group Comparison)
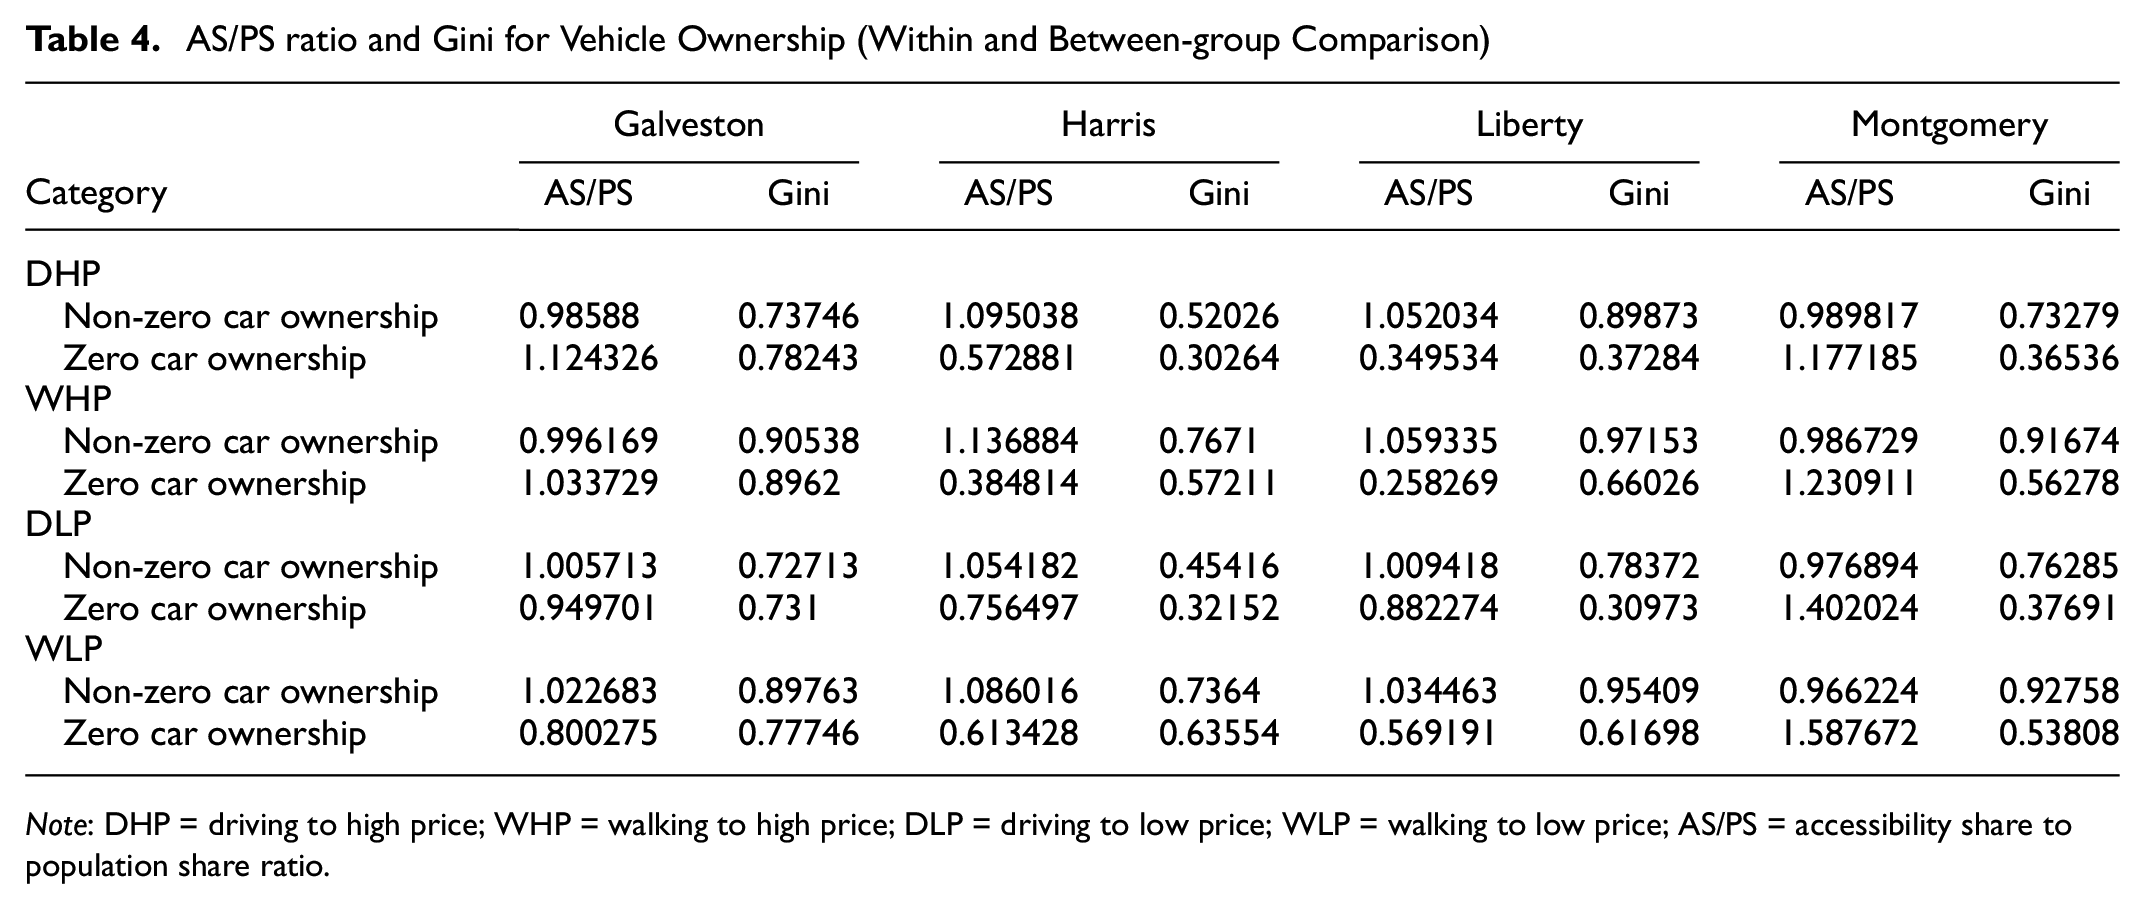
Note: DHP = driving to high price; WHP = walking to high price; DLP = driving to low price; WLP = walking to low price; AS/PS = accessibility share to population share ratio.
Moreover, walking to food stores is more unequally distributed than driving. The results summarized in Figure 6 show the inequality level within TAZs. That said, for a better analysis of existing disparities in relation to accessibility to food stores, a between-group equity analysis can yield more interesting results. Table 4 reports the AS/PS ratio and Gini coefficient for each accessibility type for different counties. Because of Houston’s highly car-oriented urban form, we could only find Zero Car Ownership TAZs in Galveston, Harris, Liberty, and Montgomery counties, owing to which AS/PS ratios and Gini coefficients are reported only for these four counties. Our results show that accessibility to all grocery store types by both driving and walking is relatively equitable for both Non-Zero and Zero Car Ownership TAZs in Galveston and Montgomery Counties. However, Non-Zero Car Ownership TAZs have a much more equitable distribution than Zero Car Ownership TAZs in Harris and Liberty Counties for all four accessibility measures. However, compared with accessibility to high-priced stores, accessibility to low-priced stores is relatively equitable for Non-Zero TAZs in Harris and Liberty counties. These findings suggest that households without access to private cars face more difficulties accessing food stores and thus choose to live in highly urbanized areas like Harris County, where food stores are easily accessible by any commuting mode.
Vertical Equity Analysis with Respect to Elderly Population
The final factor we incorporated in our vertical equity analysis is age (identification of elderly population or TAZs). We chose to consider this factor as elderly populations have physical disadvantages with regard to walking or even driving to opportunities in a city. Moreover, elderly populations are usually prone to chronic diseases and need quick and easy access to healthy and fresh food ( 107 – 109 ). Thus, we believe that performing a vertical equity analysis concerning the elderly population may also yield interesting results. The results of our analysis considering the elderly population show that the elderly and non-elderly populations have a similar pattern of Gini coefficient across all four measures. Figure 6 shows that WLP has the highest inequality for both groups but more for elderly TAZs. This indicates that the highest inequality exists in walking to low-price stores among elderly populations. Thus, some seniors, especially if they are low-income and do not have access to cars or cannot drive them, have serious issues accessing low-price stores via walking.
Table 5 again breaks down the disparities between groups across all four accessibility measures by county and clearly shows that the elderly population has a lower AS/PS ratio than the non-elderly population in general. Again, Gini coefficient for both elderly and non-elderly population are similar across all areas. However, the AS/PS ratio is generally high for both seniors and non-seniors in Harris County for all accessibility types. Likewise, Brazoria County has a high AS/PS ratio for seniors and non-seniors TAZs when we look at driving and walking to low-priced stores. Although the AS/PS ratio for driving and walking to high- and low-priced stores remains consistently high for the Non-elderly TAZs across all six counties, the same is relatively low and varies considerably for the elderly population. This clearly shows that the elderly population has difficulties accessing high-price foods via walking.
AS/PS ratio and Gini for Elderly Population (Within and Between-group Comparison)
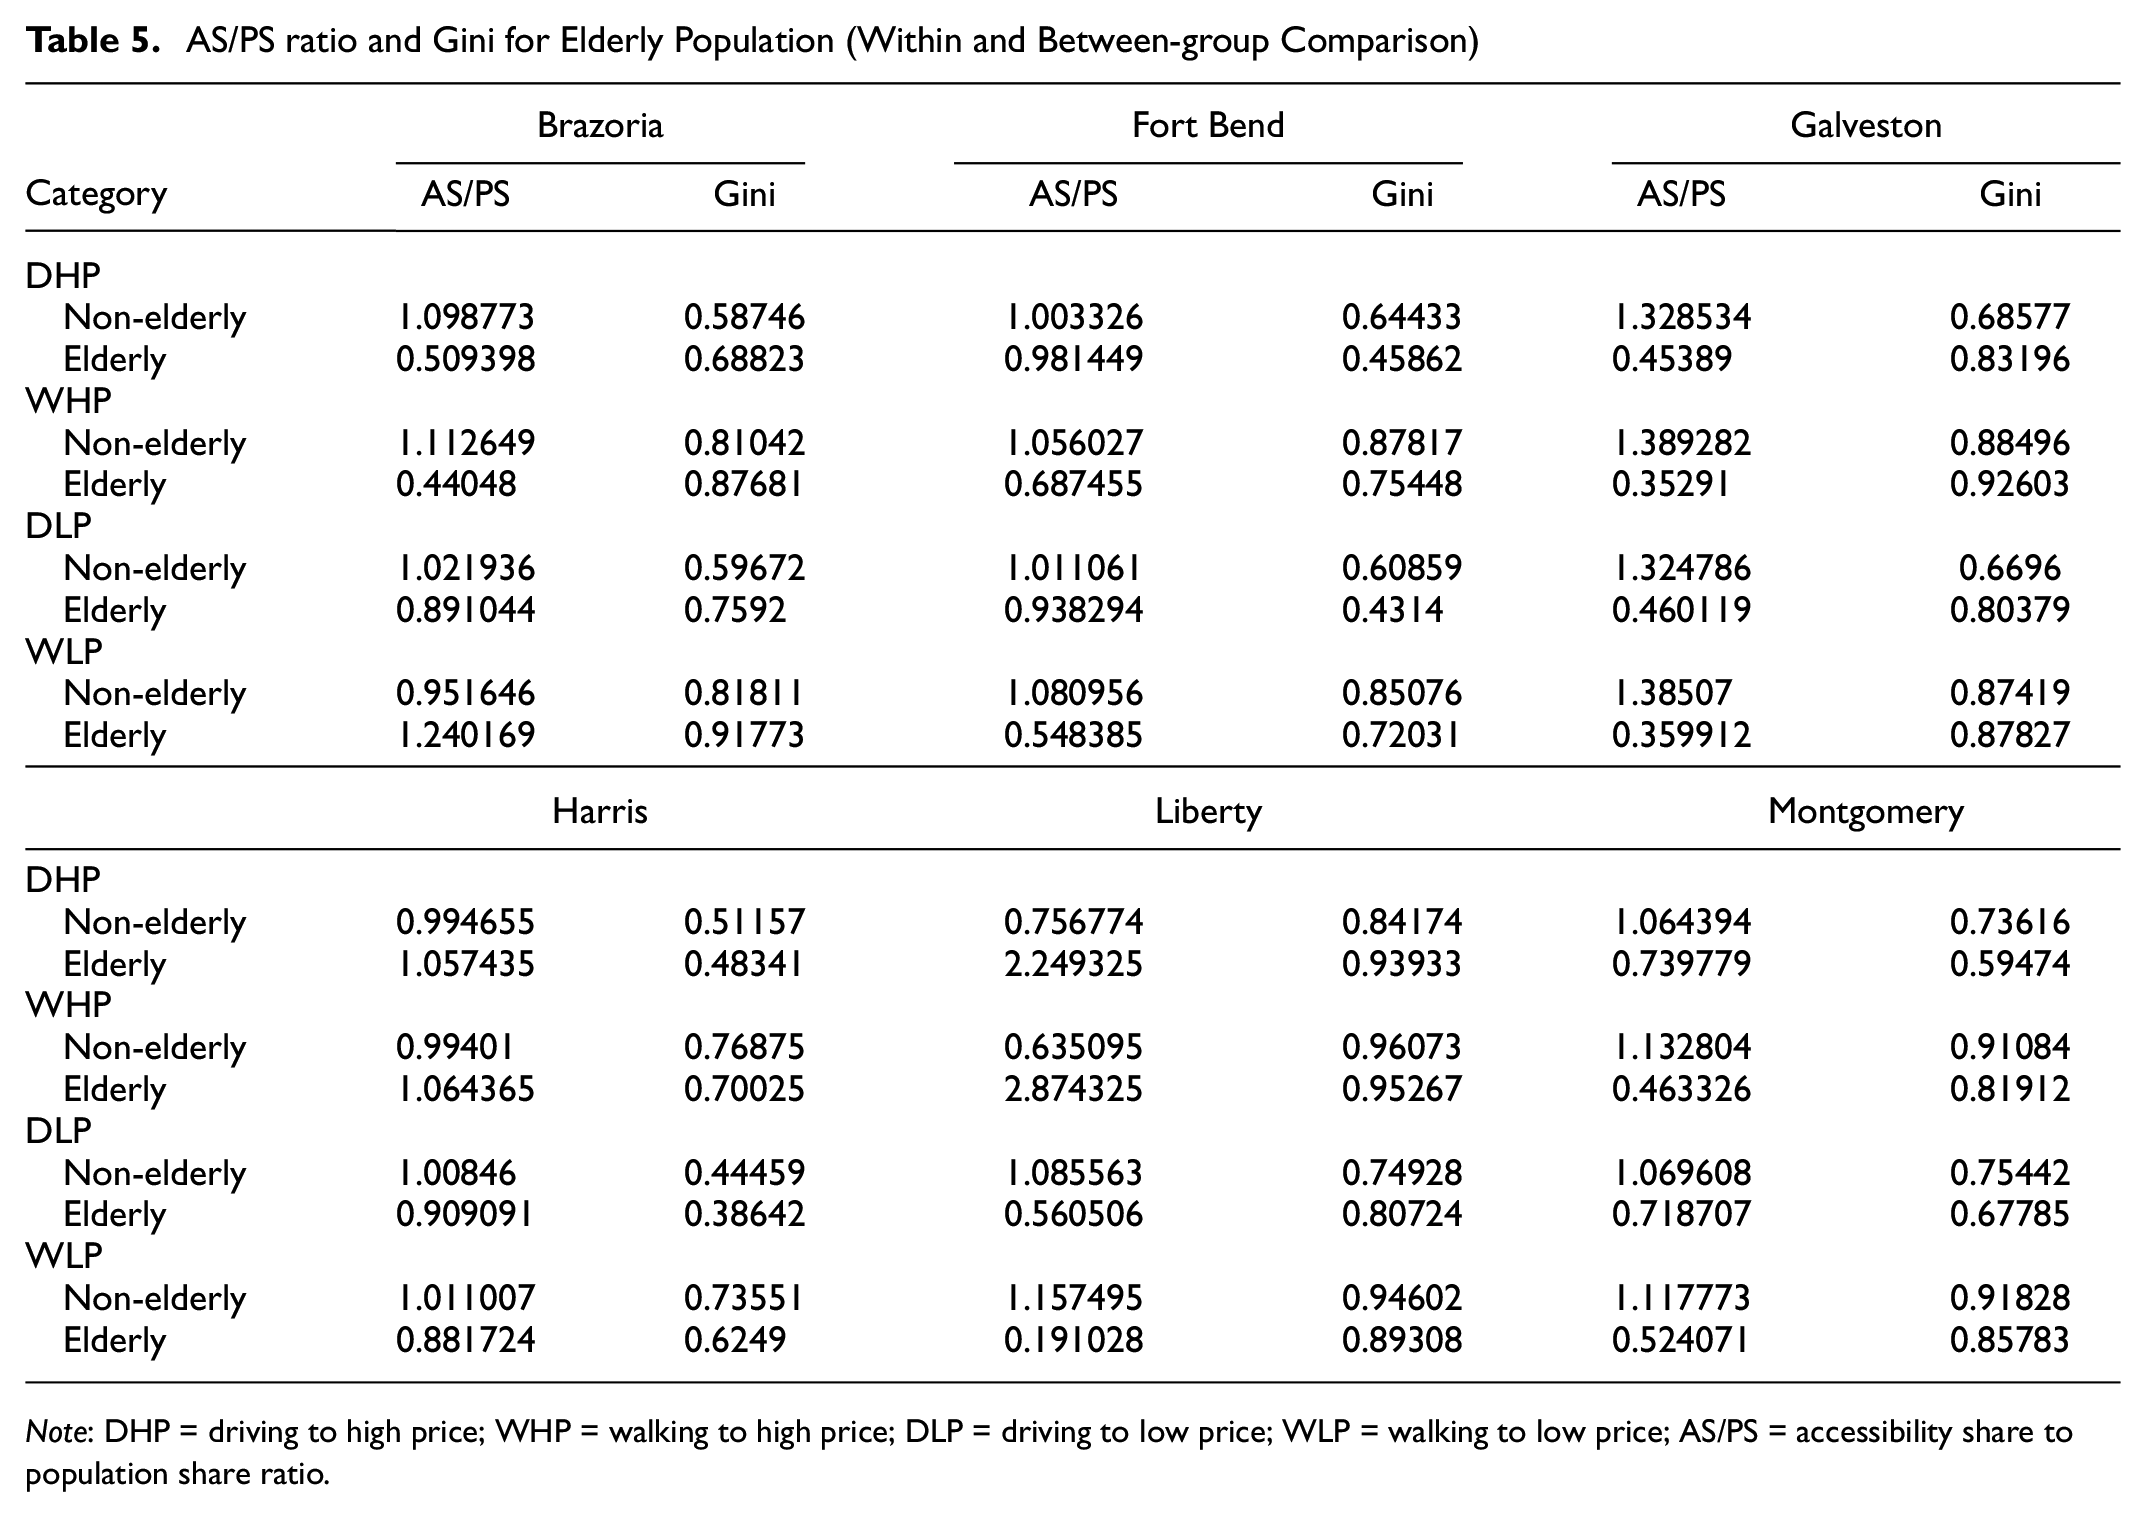
Note: DHP = driving to high price; WHP = walking to high price; DLP = driving to low price; WLP = walking to low price; AS/PS = accessibility share to population share ratio.
In contrast, for the elderly population, the AS/PS ratio changes considerably. In general, walking accessibility to food stores is far less equally distributed. Thus, the elderly population who might not be able to drive or walk long distances find themselves in food deserts in the area.
Between-group Vertical Equity Analysis
Finally, for comparison, the between-group equity analysis results are compiled and summarized in Figure 7. According to the figure, the highest Gini coefficient is for DLP when we look at vehicle ownership.
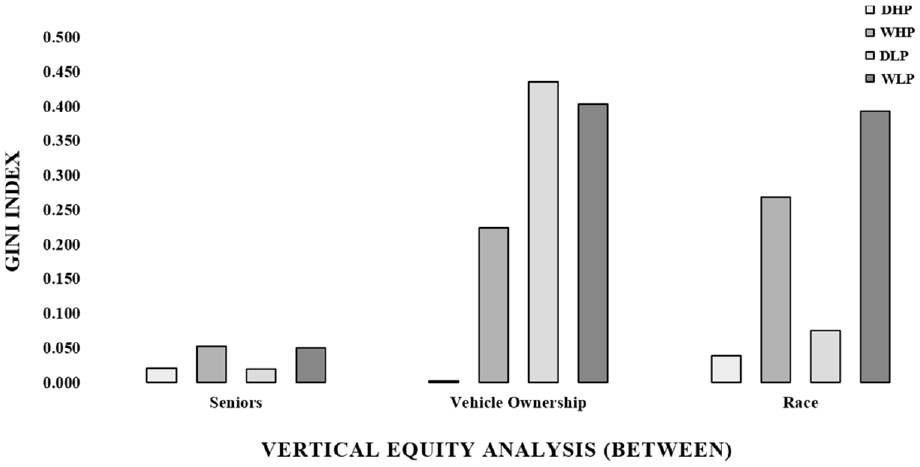
Plot of vertical equity analysis (between-group inequality comparison).
This observation acknowledges that low-income households usually face a tradeoff between housing and transportation costs with regard to residential location choices. In this tradeoff, they might opt for living closer to the urban core with the highest concentration of opportunities, especially if they do not have a vehicle. Others may go further away (in less accessible areas) to acquire cheaper housing options, creating high levels of inequality. Comparing between-group analysis results on the three factors we selected in this study shows that equity issues with respect to car ownership are the most serious, followed by race. This shows how the location choice of households depends on their car ownership rate to some extent. Moreover, equity issues concerning race are more severe than for age. In other words, food distribution is more inequitable for racial minorities than elderly populations.
Food Desert Identification
After exploring food accessibility with respect to supply–demand mechanisms and demonstrating their disparities by mode and store types and performing indicator-based equity analysis for various population groups, we intend to provide an overview of the distribution of food deserts in the area with regard to demand (population density and race).
Figure 8 presents a visual comparison of potential food desert locations and racial minority-dominant areas in our study region. We find that food deserts exist in several areas, including but not limited to, the northwestern part of Houston downtown, areas near Missouri City in Fort Bend County, northern and southern parts of Brazoria County, the northwestern part of Harris County, and a few areas in Montgomery, Brazoria, and Galveston counties. What’s even more concerning is that we have found that these food deserts are primarily clustered in areas where African Americans, Hispanics, and Mixed-Race minorities live. This suggests that marginalized communities face greater challenges in accessing healthy food options. By identifying these food desert locations and the populations that are most affected by them, we can work toward creating equitable access to affordable food for all.
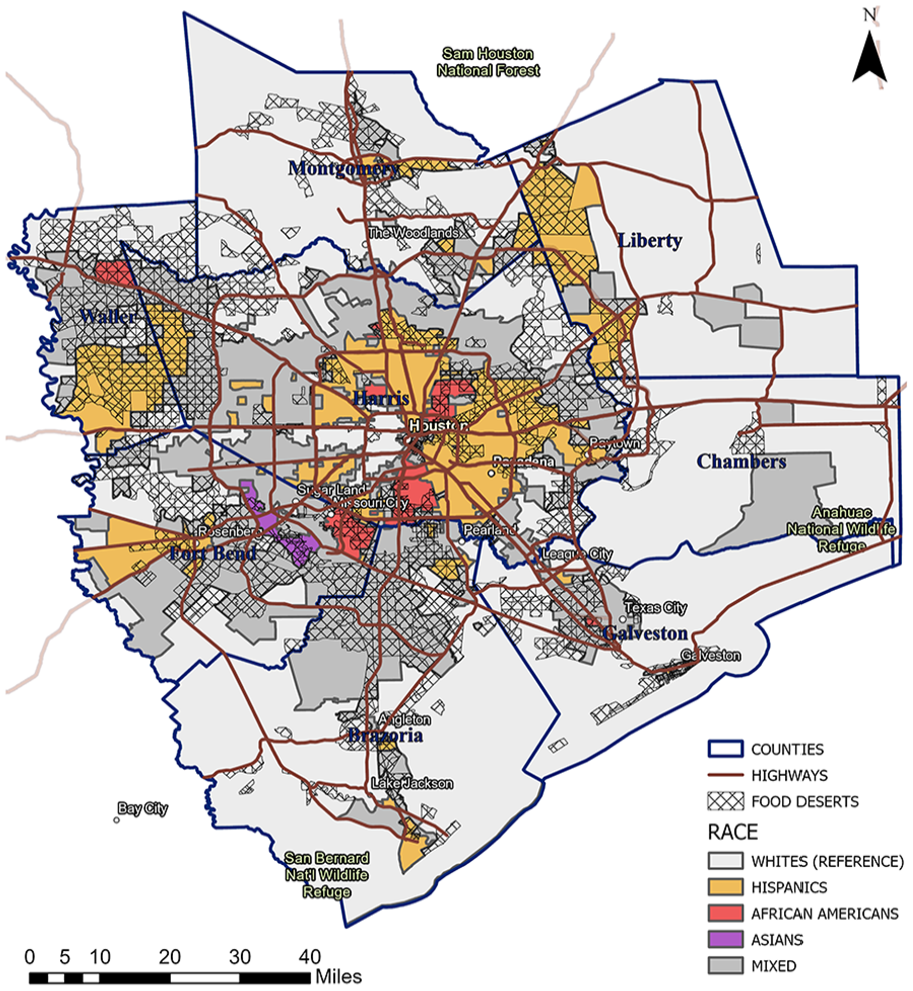
Maps of racial minority-dominant areas and food deserts in the study area.
Conclusion and Policy Recommendations
This study attempts to measure food accessibility in the Houston-Galveston Metropolitan Area using a gravity-based accessibility measure incorporating food entitlement and utilization concepts of food security. The main contribution of this study is integrating grocery store pricing into spatial accessibility measures to provide a more accurate picture of food access equity. This measure matches food stores to population based on income and stores’ pricing schemes coming from freely accessible online platforms (Google and Yelp). As collecting price data of grocery stores needs a lot of time and resource, relying on these platforms makes this kind of research more feasible and replicable for others to conduct.
In this study, we compare accessibility to different store types and derive several equity implications. We find that grocery stores are significantly less accessible by walking than driving. Given the land-use pattern and density in the HGAC region and auto-oriented development type, we should expect this result. Our results indicate that low-price stores have a better distribution than high-price ones in the HGAC area. One reason for this could be that most retailers follow their customers, and high-price stores locate in more affluent neighborhoods with a high concentration of potential customers for their products.
Our vertical equity analysis provides many interesting insights into the equity of food store accessibility considering race, vehicle ownership, and age. Concerning race, DLP and DHP have a reasonably similar level of inequality, except for the African American racial group, which has the highest level of equality, followed by Hispanics. Considering race, the most significant disparity is for WLP, which is an important observation because most marginalized populations do not have access to cars ( 110 , 111 ); we should prioritize walking access if equity is a goal in planning. The result of the analysis considering vehicle ownership is also thought-provoking. The results of this step show that low vehicle-ownership TAZs have a lower Gini coefficient, thus, lower levels of inequality.
Moreover, aligned with previous findings, walking to food stores has a greater inequality distribution than driving to food stores. Also, WLP has the highest disparity for low car ownership TAZs versus non-low car ownership. WLP is a crucial accessibility measure for equity analyses as it has walking as the mode and low-price stores as the opportunities. Improving non-driving access to low-price food stores should be prioritized to realize EJ for different social groups. Our study found that elderly and non-elderly populations have a similar Gini coefficient pattern across all four measures.
Our study finds that food deserts are particularly found in low-income areas where most underserved communities live, which means that unequal access to opportunities with respect to different population groups, or in other words, segregation of racial minorities or low-income populations, exists in the Houston metro area. Moreover, the analysis further shows that the highest inequality exists for walking to low-price stores among elderly populations. In other words, some seniors, especially if they are low-income and do not have access to cars or cannot drive them, have serious issues accessing low-price stores via walking. In the case of the elderly, walking to stores is highly unequal compared with driving. This is an essential observation, as often the elderly population has physical limitations for driving and needs to rely on other modes such as walking or riding paratransit modes (that provide individuals with disabilities or mobility needs with transportation alternatives to fixed-route public transportation systems) like METROLift, VIAtrans, or Handitran ( 112 ).
These results have several planning and policy implications on equity, environmental, and health justice. Urban form and land-use patterns can significantly affect the formation and emergence of deserts and choices of residential and retail locations. For instance, Hispanics and African Americans usually live within the inner city or first ring of suburbs, where neighborhoods are relatively poor. In contrast, the outer areas of the metro area accommodate mostly white affluent neighborhoods where most high-end businesses, including food stores, tend to locate to maximize the accessibility of their service to high-income groups. On the other hand, most carless people live close to central business district opportunities and thus have almost zero access to good and healthy food. In sum, the urban development pattern significantly affects residential and retail choices according to race, income, and vehicle ownership, all of which can lead to various inequalities, including realizing food deserts.
In such conditions, planners and decision-makers should constantly oversee the pattern and direction of urban development to ensure these trends do not preclude the practice of just and equitable planning and distribution of opportunities throughout the metropolitan area. We can achieve this by defining land use and zoning regulation specific to issues of food access justice. Promotion of sustainable bike and walking networks and complete street design can make these travel modes more desirable and competitive to driving for shopping trips on the one hand, and increase walking accessibility of food stores on the other. Another alternative is incentivizing small-size food stores to locate in EJ locations, or encouraging more online food delivery services in such areas. However, it is essential to consider the zones’ socio-demographic characteristics before implementing these interventions.
Making improvements to the measurements of food accessibility is straightforward while being capable of showing underlying disparities and inequalities. This study contributes to the environmental and food justice, equity, and health literature in a few directions. First, several studies have shown that socio-demographics deeply affect individuals’ shopping trip behavior, including store choice. Thus, it is essential to develop frameworks for food accessibility equity analyses where consumer preferences and limitations are included ( 45 , 113 ). This study presents the concept of food entitlement and utilization to improve food accessibility measures. Furthermore, our framework offers an indicator-based vertical equity analysis in which the exact share of different socio-demographic groups can be calculated and compared.
With regard to limitations, this study only considers driving and walking as travel modes for shopping trips. Future studies can incorporate transit, paratransit, bus, bike, or transportation network companies into the framework. Future research can incorporate a wider variety of travel modes for shopping trips and analyze the underlying built environment and socio-demographic contributors to the emergence of food deserts by different modes. This can help transportation and urban planners develop preemptive planning actions and programs to prevent food deserts from realizing, or neutralize their effects on certain population groups. Further, our studies looked at grocery stores at general. We acknowledge that there are other membership-required grocery stores (including Costco, Sam’s Club) that pose inherent access constraints through membership requirements. However, our study does not make a differentiation between regular grocery stores and those that require memberships. Future scholars can perhaps explore how inequity issues are driven by the presence of these kinds of grocery stores in urban areas.
Footnotes
Acknowledgements
The authors would like to thank and acknowledge their partners and data sources in this effort. The authors would also like to thank Caliper’s Maptitude for assisting with necessary datasets and software tools. We also thank Dr. Jianling Li and Dr. Tongbin Teresa Qu for their valuable feedback throughout the research.
Author Contributions
The authors confirm contribution to the paper as follows: study conception and design: S. Kharel, S. Sharifiasl; data collection: S. Kharel, S. Sharifiasl; analysis and interpretation of results: S. Kharel, S. Sharifiasl; draft manuscript preparation: S. Kharel, S. Sharifiasl, Q. Pan. All authors reviewed the results and approved the final version of the manuscript.
Declaration of Conflicting Interests
The author(s) declared no potential conflicts of interest with respect to the research, authorship, and/or publication of this article.
Funding
The author(s) disclosed receipt of the following financial support for the research, authorship, and/or publication of this article: This research was funded by the Center for Transportation, Equity, Decisions, & Dollars (CTEDD) and the Cooperative Mobility for Competitive Megaregions (CM2) Center.