
Abstract
Long-distance travel for leisure purposes, especially international travel, has grown dramatically over the past decades. Although its share of the total number of trips is small, it accounts for a significantly larger share of total distance and greenhouse gas emissions, with the accompanying adverse environmental consequences. One remedy might be to urge tourists to travel on vacation by rail rather than car, which is less harmful to the environment. However, it is not clear how to persuade them to do so, since knowledge of the determinants of mode choice for international vacation travel is quite limited. To fill this gap, we collected survey data among tourists, mostly international, visiting the Austrian Alps and estimated a choice model between personal vehicle and rail. The results revealed a cost dumping effect, and the significant influence of factors related to overall travel convenience, luggage transport, travel party size, and the accessibility of the destination by rail. The tourists reacted with little elasticity to changes in cost and travel time, and exhibited a higher value of time than in other studies on long-distance travel, which was also higher than the hourly wage in their home countries. This article delivers valuable evidence that could contribute to improved long-distance rail services, more accurate project appraisals, and better marketing campaigns and transportation policies to make rail more competitive against the personal vehicle, and facilitate more sustainable vacation travel.
Keywords
As labor productivity, disposable income, and leisure time have increased, and personal vehicles (PVs) and air travel have become widely available, leisure travel has undergone rapid growth. In Western societies, it now dominates in relation to miles traveled ( 1 ). Recent data indicate a steady increase in both domestic and international leisure travel globally, with a concomitant reduction in the length of stay at the destination ( 2 ). There are signs that this strong upward trend in long-distance leisure travel is slowing down and reaching a plateau in Western Europe, but there is no indication so far that it is about to stop completely or reverse in Europe ( 3 ).
Unfortunately, long-distance travel is often overlooked in analyses and models, as it only accounts for a small portion of all trips. However, its contribution to total miles traveled and greenhouse gas emissions is dramatically larger ( 4 , 5 ), especially on international trips ( 6 ). Interestingly, studies from Europe ( 7 ) show that a larger share of these emissions is generated by the car than by air travel. Further, this environmental aspect brings with it issues of environmental justice, as there is a very unequal distribution of emissions, with the minority of the population that is traveling long distances generating the majority of the emissions and externalizing them onto everyone else ( 8 ). On top of that, there are other negative externalities, such as increases in noise ( 9 ) and accidents ( 10 ).
Particularly vulnerable to these adverse consequences are areas where tourism is the mainstay of the economy, their very existence, and which struggle with tourists excessively arriving in private automobiles. One solution to this problem would be to reduce the number of incoming tourists while increasing their length of stay (i.e., to maintain the same turnover) ( 11 ). Another would be to urge customers to come by a less environmentally harmful means of transportation, namely by rail or, more often, by a multimodal combination of rail and other modes, usually buses, serving the first and last mile—for this purpose, we would need to know by what means this could be achieved. In particular, we need to know what value customers place on travel costs and travel time, and what other aspects besides level of service (LoS) influence their mode choice behavior.
The literature does not provide satisfactory answers to these questions. Studies on long-distance (leisure) travel typically describe this phenomenon from the perspective of the origin country and utilize data collected from national household surveys ( 12 ). Such a nationwide perspective is sufficient in large countries (such as the United States, Canada, or Australia), in a European context (the Schengen Area) though, it requires an integrated EU-wide model of long-distance travel like the one by devised by Rich and Mabit ( 13 ). However, this model is based on only LoS attributes and does not take into account the distinctive nature of holidays (e.g., traveling with family and luggage).
Few researchers have investigated long-distance tourism travel in detail. LaMondia et al. modeled jointly the destination and transport mode choice of vacationers in a large-scale European travel market characterized by multiple destinations ( 14 ), and Thrane analyzed transport mode choice in the domestic tourism market in Norway ( 15 ). Others have explored socio-psychological factors ( 16 ), or characterized specific travel groups ( 17 ). However, for international vacation travel by surface transportation, no studies have used the precise attributes of the alternatives or additional variables that capture the peculiarity of vacation travel. Furthermore, with the exception of a few works ( 18 , 19 ), there is very limited evidence on value of travel time savings (VTTS) in long-distance travel, let alone long-distance vacation travel. The same pertains to elasticities in vacation travel, as raised by Rich and Mabit ( 13 ).
This study seeks to bring us closer to filling the aforementioned research gaps. By (i) investigating the determinants of mode choice between PV and rail for vacation travel using discrete choice models, (ii) assessing mode choice elasticities, and (iii) taking a closer look at time valuations among tourists, it offers a unique view of the long-distance component of vacation travel from the perspective of tourist regions facing an overflow of tourists arriving by PV.
Data and Methods
Data Collection
This research is based on data collected from visitors to tourist destinations in the Austrian Alps (Figure 1) during the summer and winter seasons of 2016 and 2017. The survey was designed as a revealed preference (RP) intercept survey using self-administered paper questionnaires (SAPQs) (see Figure A1 and Figure A2 in the Appendix). The questionnaires were distributed, by means of convenience sampling, to passengers on trains and to tourists approached at tourist hot-spots (e.g., ski lodges, restaurants, recreation facilities) in the resorts. Nonmonetary (promotional items) incentives were offered for participation in the study.
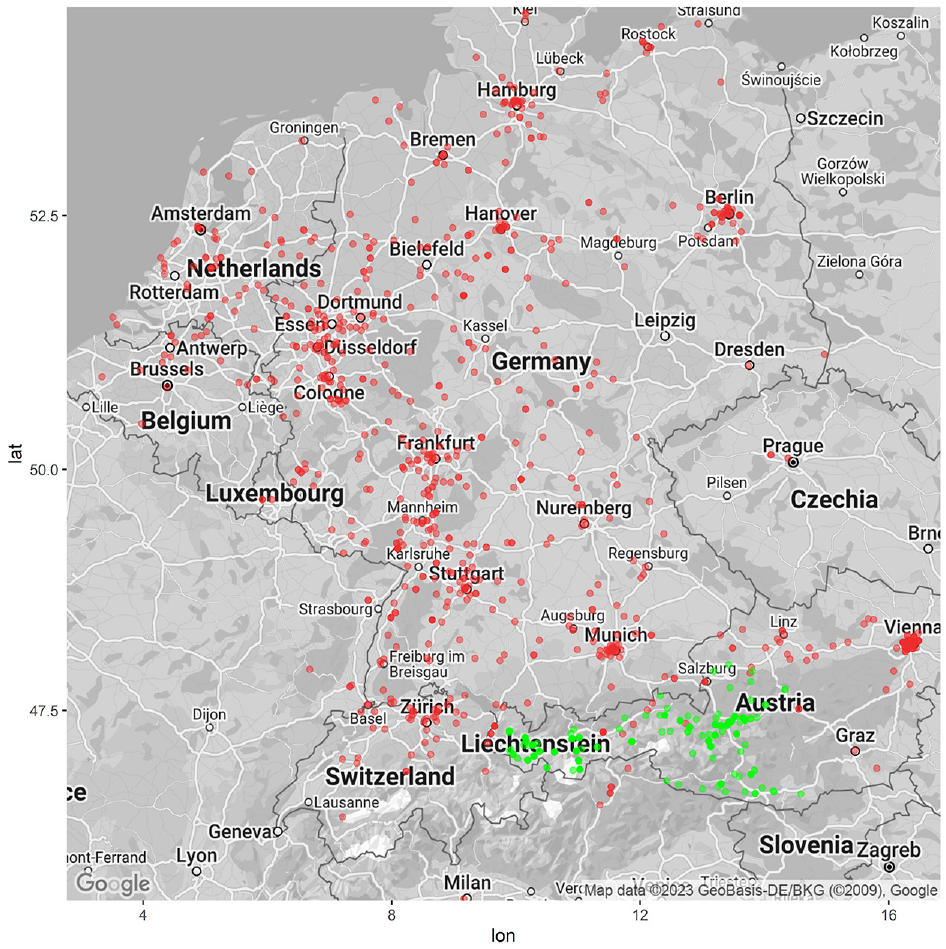
Study area: survey was conducted at the locations represented by green dots and on trains going to these locations. Red dots represent the origin locations of visitors.
The survey instrument consisted of several components that covered (i) sociodemographic information, (ii) current vacation trip, (iii) dedicated questions about traveling by rail, traveling with family, transporting luggage, and car-sharing once at the destination, and several other aspects that exceed the scope of this article. Relevant for this study is that we asked respondents to name the factors that had contributed to their choice of the specific transportation mode over another.
Overall, we collected data from 1,921 individuals. Eventually, 807 valid observations on long-distance trips from 658 distinct origin locations to 114 distinct destinations remained for modeling purposes (see the next section, Data Processing, for details).
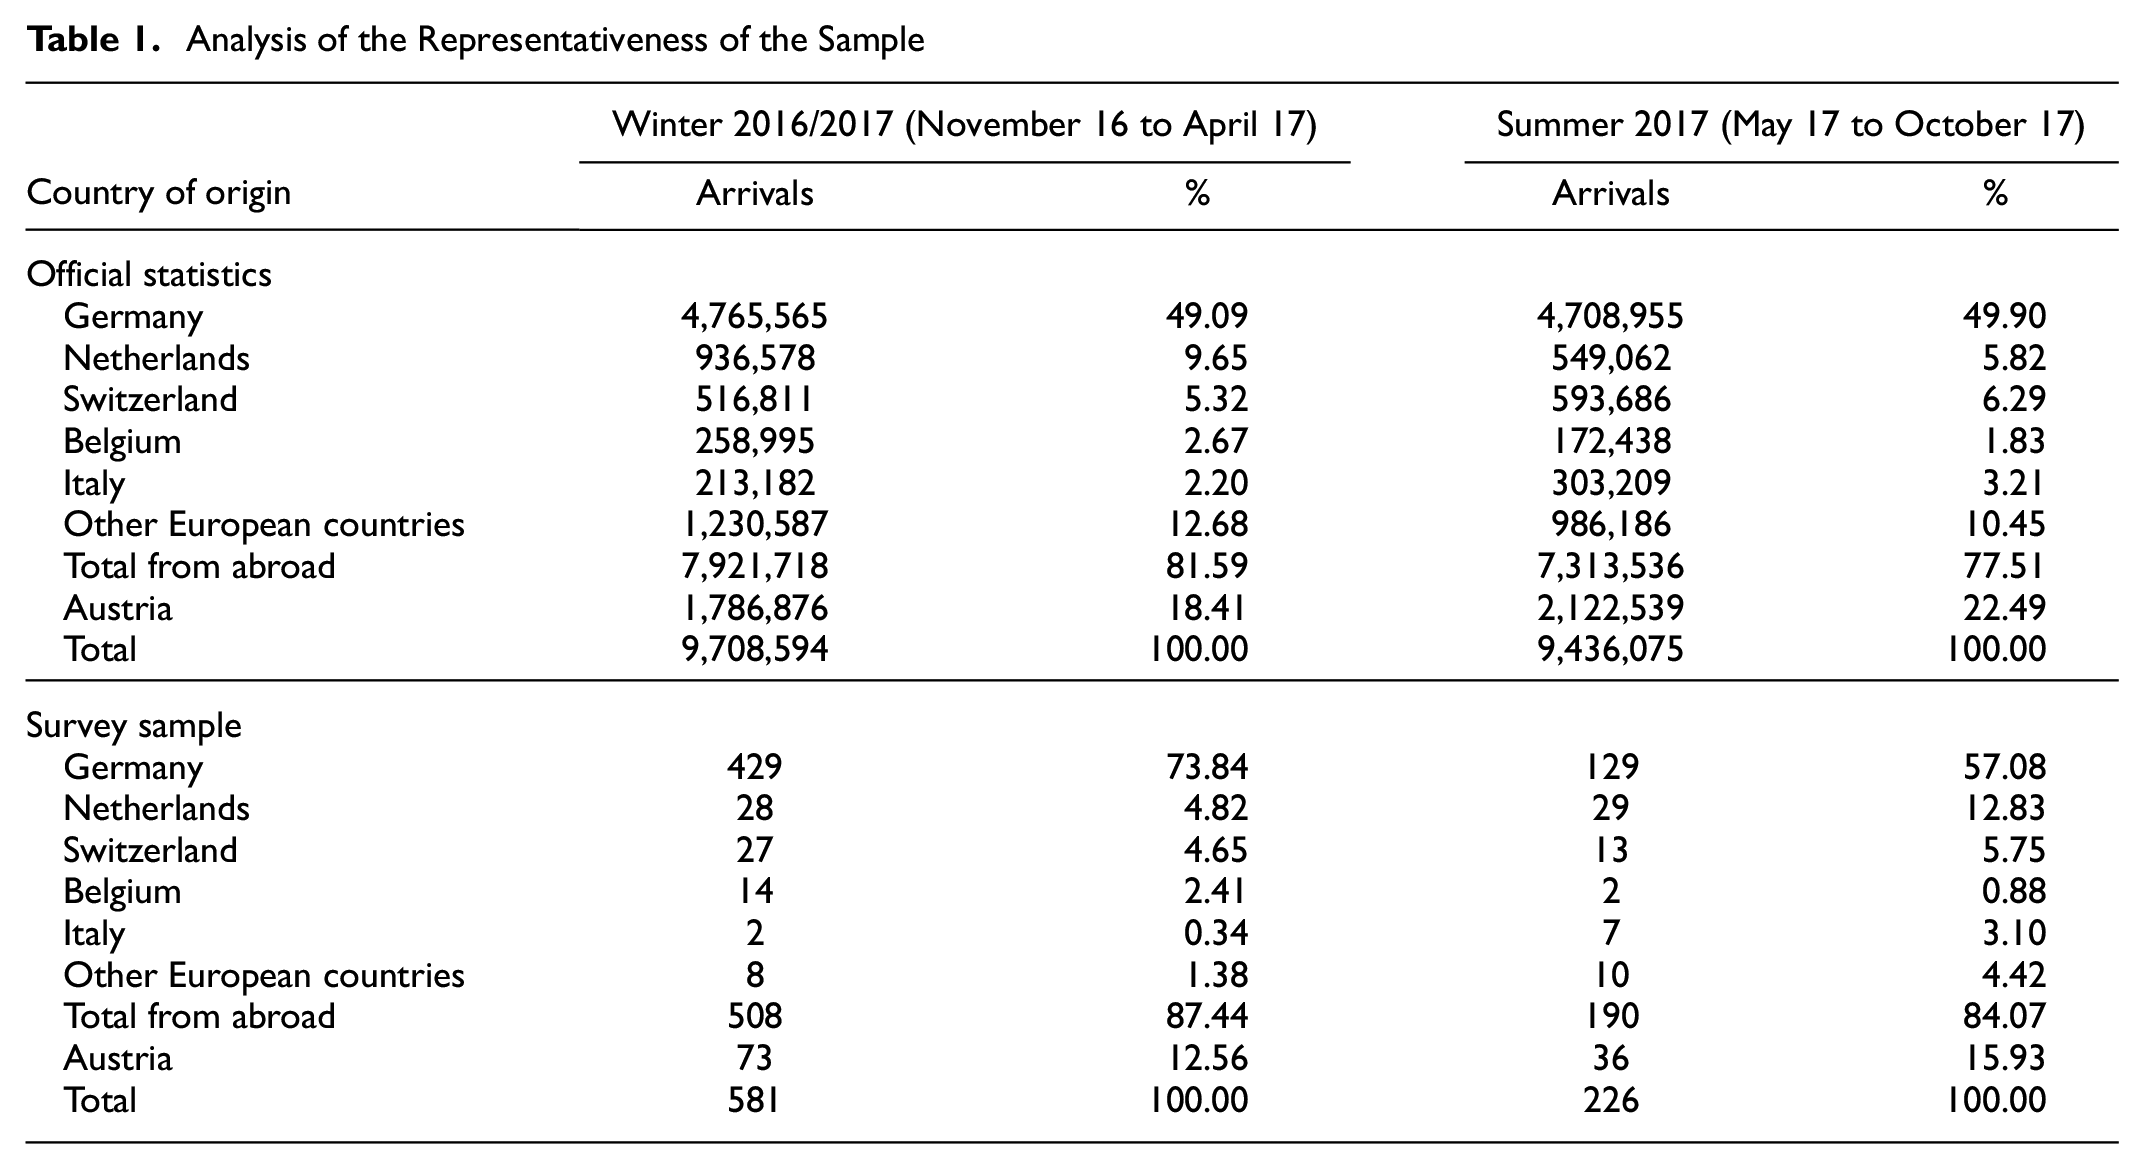
To determine how representative the final survey sample was of the study population (i.e., tourists visiting mountain resorts), we compared the percentages of arrival numbers of the sample with official statistics ( 20 ), which we stratified by country of origin and season. Since the survey concerned visitors to mountain destinations, we used official statistics of only the Austrian federal states (Tyrol, Vorarlberg, Salzburg) that are characterized by alpine tourism. Furthermore, we excluded from the official statistics tourists from countries from which Austria can be reached only (e.g., USA, Australia, Asia) or mainly (e.g., UK, Russia) by air, as a result, countries of mainland Europe remained. Table 1 shows how these values deviate from each other. Visitors from Germany were overrepresented in the survey sample, in particular in winter when the difference reached almost 24%. Austrians, on the other hand, were underrepresented: their share in the sample in both seasons was about one-third lower than the real visitor composition. Ultimately, however, the survey sample, despite major deviations in percentage shares from official data, correctly captured the trend and order of magnitude for each country’s share.
Analysis of the Representativeness of the Sample
Collecting answers to rail-specific questions required oversampling train travelers. Although there are no “ground truth” statistics on the share of transportation modes among international visitors to Austria, as accommodation providers are only required to record information on country of origin and arrival/departure date, multiple surveys ( 21 – 23 ) suggest that the “real” share of PV oscillates around 80%, slightly above the share in our data (67%).
Data Processing
Selection of Observations
Although the SAPQ method is an inexpensive way of collecting data, it suffers from significant downsides, one of them being missing and low-quality responses ( 24 ). Furthermore, eligibility for completing the survey was not controlled in the questionnaire. As a result, the data had to be cleaned and processed after the survey was completed before analysis. From the initial 1,921 observations, we excluded responses that did not fit the purpose of the study, with missing information, or for which we could not collect the mode attributes needed for modeling. Observations were removed according to the following criteria in the following order:
- The reported trip is not a vacation trip to the Austrian Alps: 479 observations. Respondents who completed questionnaires on the train were often traveling for other purposes.
- No information on the chosen transportation mode: 55 observations.
- Respondents who traveled by coach: 45 observations. Coach travel to vacation resorts is usually operated by travel agencies: travel there and back is an integral part of the vacation package along with hotel, meals, guide, and so forth, therefore, it is difficult to see it as an independent mode of transportation that travelers would consider to be on a par with car or rail travel.
- Respondents who traveled by air from overseas (the Americas, Australia, Asia) or the UK: 79 observations. These travelers were regarded as having no alternative to air travel. Although a rail connection from the UK to Austria is technically possible, none of the UK respondents in our data had traveled by rail, so we assumed that we were observing a “real” consideration set in our data and that air is the only alternative that is actively considered by the individuals when making a choice.
- Respondents who traveled by air from mainland Europe: 94 observations. It is very difficult to reconstruct the attributes of scheduled flights owing to dynamic pricing, seasonal changes in flight schedules, and mixing with charter flights that are part of vacation packages.
- Respondents under the age of 19: 101 observations. It was assumed that they were not the decision makers in the family during vacation travel.
- Trips with a distance shorter than 100 km: 22 observations. The threshold most commonly used in long-distance surveys in Europe is 100 km ( 25 , 26 ).
These steps reduced the sample to 1,046 records.
Reconstruction of the Choice Set
Unfortunately, we do not have any information (reported or measured) on the choice set at the time of making the choice. The choice set had to be reconstructed based on other information in the survey. We used possession of a driver’s license as a criterion for driving. PV availability was 0 if the respondent did not have a car or was not licensed to drive a car. Any other answer (“any time” or “occasionally”) implied the availability of a PV for vacation trips. As for rail, if the route planner (see next paragraph) did not return any rail connections (in fact, it is a multimodal combination of different modes, in which rail is the longest component), we assumed that this mode was not available, that is, if no such route was found in the data provided by the transportation operators, it would be returned by other route-planning tools that a person might have used to plan a trip (e.g., Google Maps and alternatives, or the official websites of the rail operators bahn.de [Germany], oebb.at [Austria], or sbb.ch [Switzerland]).
Whenever one of the alternatives was unavailable to the decision maker, and the initial choice set consisting of PV and rail was reduced to only one alternative, the observation was removed from the dataset, because this represented a “no choice” situation. We performed additional checks to eliminate implausible travel times and costs by car and rail. As a result, the database shrank to 807 observations in which the decision maker was faced with a choice between two alternatives.
Computation of Attributes of Alternatives
The attributes of the chosen and nonchosen alternatives were queried from RouteRank (www.routerank.com), a Swiss-based comprehensive trip and route planner (like Google Maps, Rome2Rio)—an example of a tool often used by travelers to compare travel options ( 27 ). From RouteRank, we obtained data on the travel alternatives from the respondent’s origin country to their chosen destination in Austria including distance, travel time, travel cost, and number of transfers. These kinds of data have been already used in studies on long-distance travel, yet to the best of our knowledge, so far only for trips within one country (e.g., for Canada, see research by Llorca et al. [ 28 ]). In our dataset, cross-border trips constituted 86.5% of all observations, and RouteRank (unlike the route-planning tools of national providers) has a unique database that combines data from numerous national, regional, and local transit providers from multiple countries.
Travel time by rail is the total door-to-door travel time, including in-vehicle time spent on the train, in-vehicle time on other modes (such as a bus, bringing the traveler to the main train station), as well as any out-of-vehicle time spent getting to the first bus stop/station and from the last bus stop/station to the accommodation, and the waiting time between the transfers. Travel time by PV is the total door-to-door travel time without additional breaks or stops. Travel cost by rail is the total adult fare for the entire trip (including additional modes on the first and last mile, feeder transit, etc.). The cost of travel by PV was calculated assuming an average fuel consumption of 10 L per 100 km.
All other transportation attributes (e.g., comfort, flexibility, reliability, privacy, safety, convenience in transporting luggage) were obtained indirectly from the reasons declared by respondents for choosing their means of travel. Otherwise, it would have not been feasible to collect information about, for example, services on first/last mile (e.g., home rail station, rail station hotel) for every individual, or transit services at the destination for every hotel location. Likewise, it would have been unfeasible to collect reliable data on the level of comfort of all vehicles used, or on the type/size/weight of the luggage carried by travelers.
Descriptive Analysis
Table 2 summarizes the characteristics of the respondents and their long-distance trips, stratified by chosen transport mode. Among those surveyed, about 67% opted for PV and 33% chose rail. As already mentioned, rail was overrepresented in our sample. Within rail users there was a higher share of the youngest and oldest age groups than for visitors traveling by PV. Visitors from Germany constituted the predominant nationality in the sample, followed by Austrians, and the Dutch. When broken down by means of transportation, Germany still ranked first, but the proportions in the subsequent places had changed: rail travelers were mostly domestic and from neighboring countries (i.e., Germany, Switzerland). Distinct differences between drivers and rail travelers were observed in the type of residential area, but also in the frequency of transit use (by “transit” we mean any type of public transportation, be it bus, streetcar, coach, light rail, cable car, railroad, etc.): visitors traveling by PV on vacation declared less frequent use of transit on all kinds of trips. Winter season visitors (about 70%) dominate over summer season visitors (about 30%), both among all respondents in the survey sample and in the PV and rail travel groups. Among the reasons given for choosing PV for the trip, the most frequently mentioned were price, the need to transport luggage and sports equipment, mobility at the destination, comfort, privacy, and travel party size, whereas rail travelers mostly justified their choice with few transfers, destination being directly accessible by train, but also comfort, price, and distance. Although not explicitly introduced in the survey, given the high number of responses in winter and existing research suggesting that the proportion of driving is actually higher in the winter than in summer, especially among international tourists, we surmised that weather did not have an impact on mode choice ( 11 , 22 ). Slightly more rail passengers (28%) than drivers (23%) reported problems during the trip. In the case of people traveling by train, this was mostly delays, whereas in the case of drivers it was (expected) traffic congestion. Overall, the reasons for the infrequent travel by rail for vacation purposes given by tourists were very different, however—regardless of how they had arrived at the time of taking the survey—the predominant reasons were luggage transport and the direct (non)accessibility of destinations by rail.
Characteristics of Respondents, Trips, and Modes
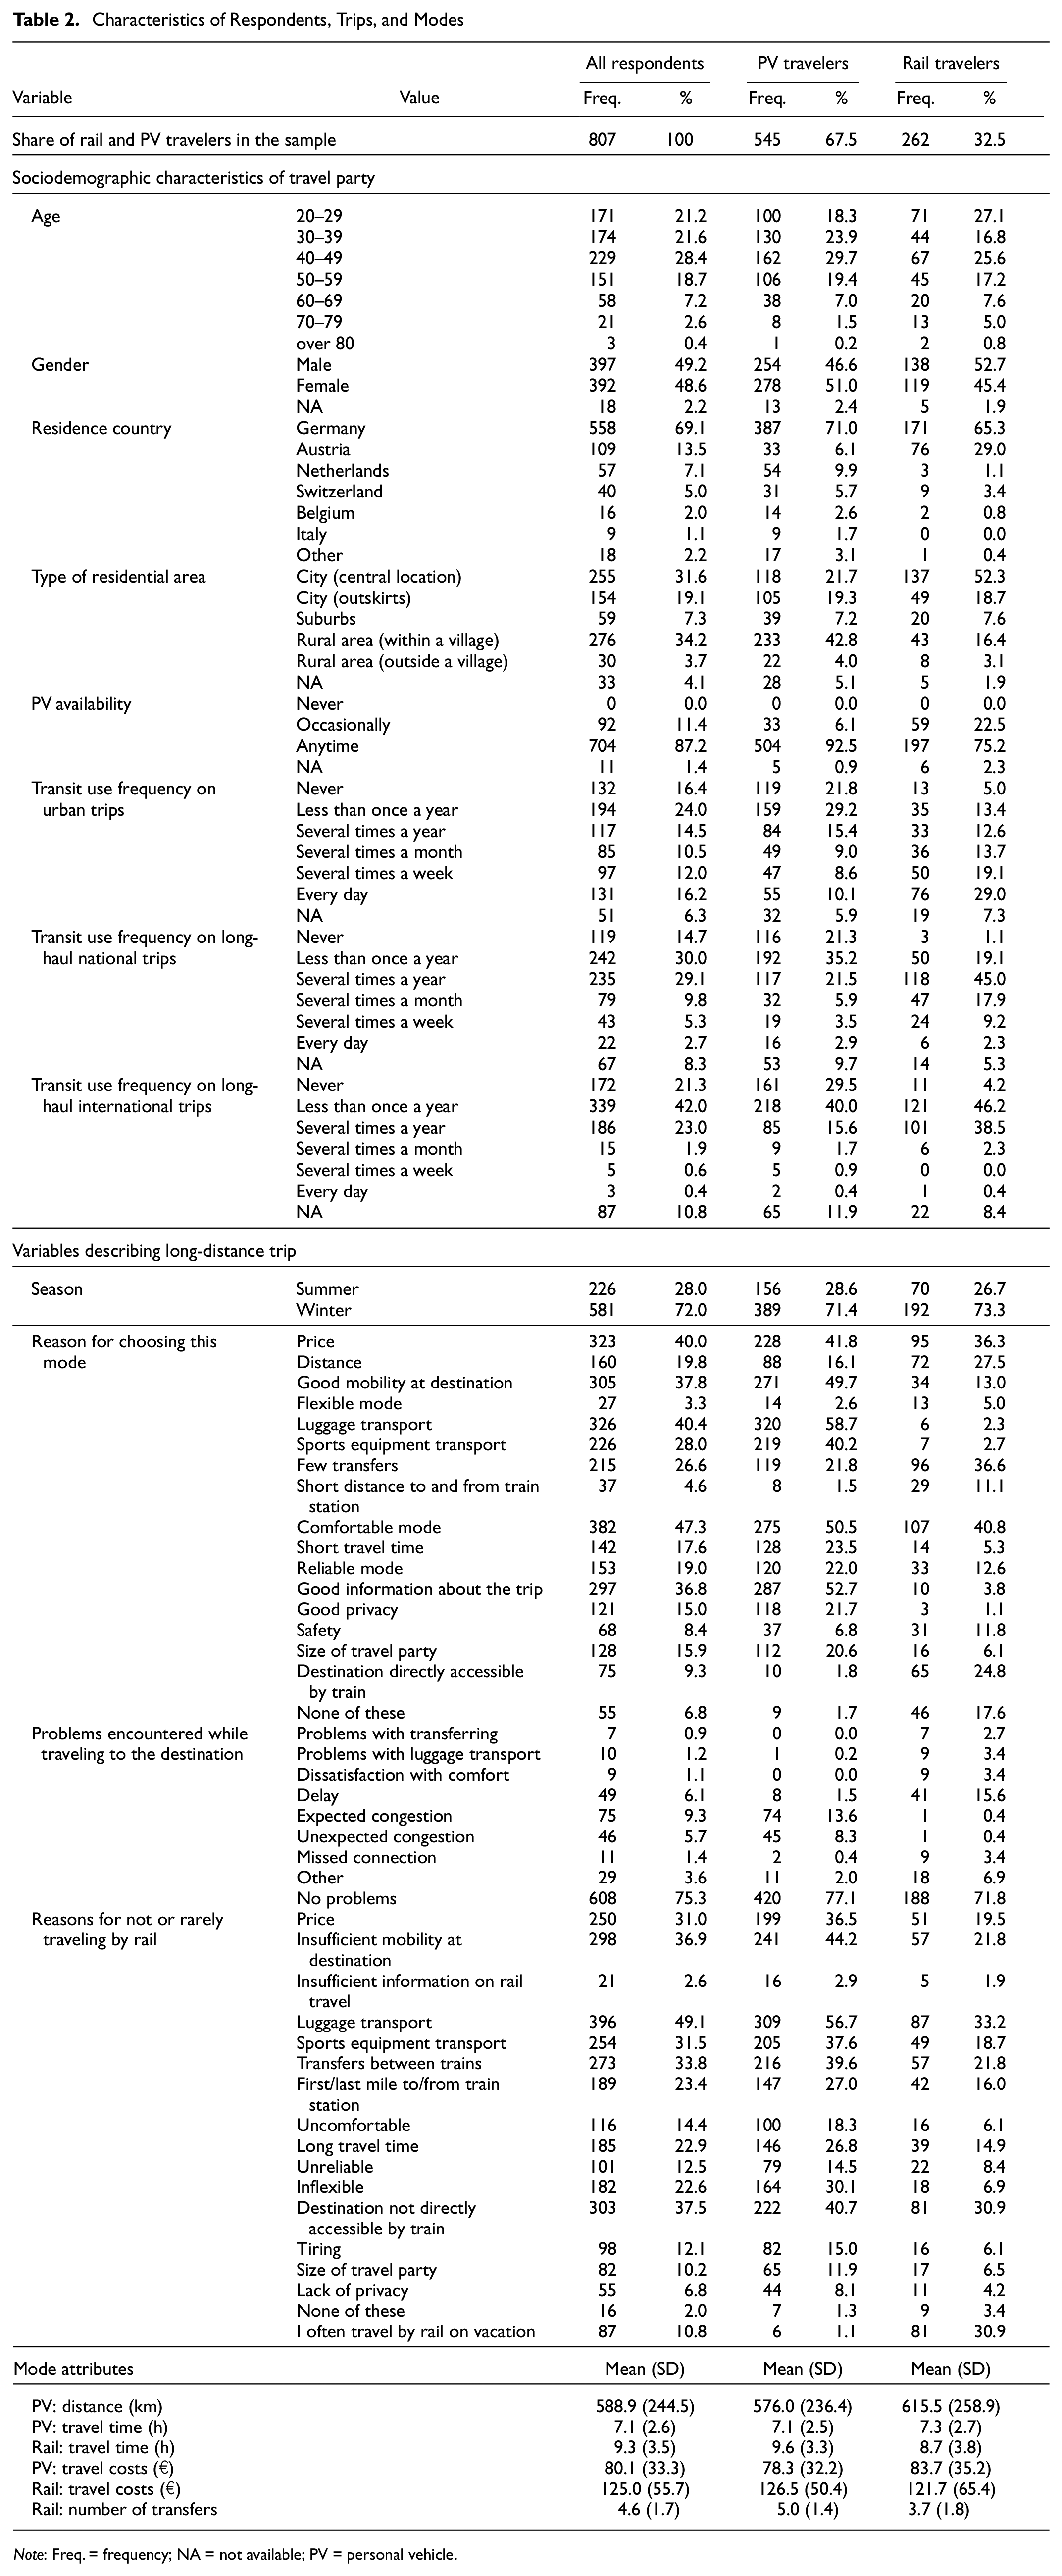
Note: Freq. = frequency; NA = not available; PV = personal vehicle.
The mode attributes in Table 2 show the average distance by PV, time, and cost of travel for both modes, and the number of transfers for rail, for all respondents, as well as broken down between those traveling by PV and rail. For example, the average travel time among those traveling by car (car was the chosen mode of transportation) was 7.1 h, whereas it could have been 9.6 h for this group (where rail was an alternative, nonchosen mode of transportation) had they chosen rail. Likewise, it took rail travelers an average of 8.7 h to make the trip by rail (rail was the chosen mode), and it would have taken them 7.3 h if they had chosen to drive (car was an alternative, nonchosen mode). In relation to transfers, rail travelers had to change trains on average 3.7 times, whereas car travelers would have had to make 5 transfers if they had chosen rail.
Figure 2 illustrates all trips reported by the interviewed tourists, in which red dots represent the origin locations, and green dots denote the mountain destinations they traveled to. The large proportion of tourists from northern Germany, eastern Austria and the Netherlands resulted in long travel distances that were, on average, close to 600 km.
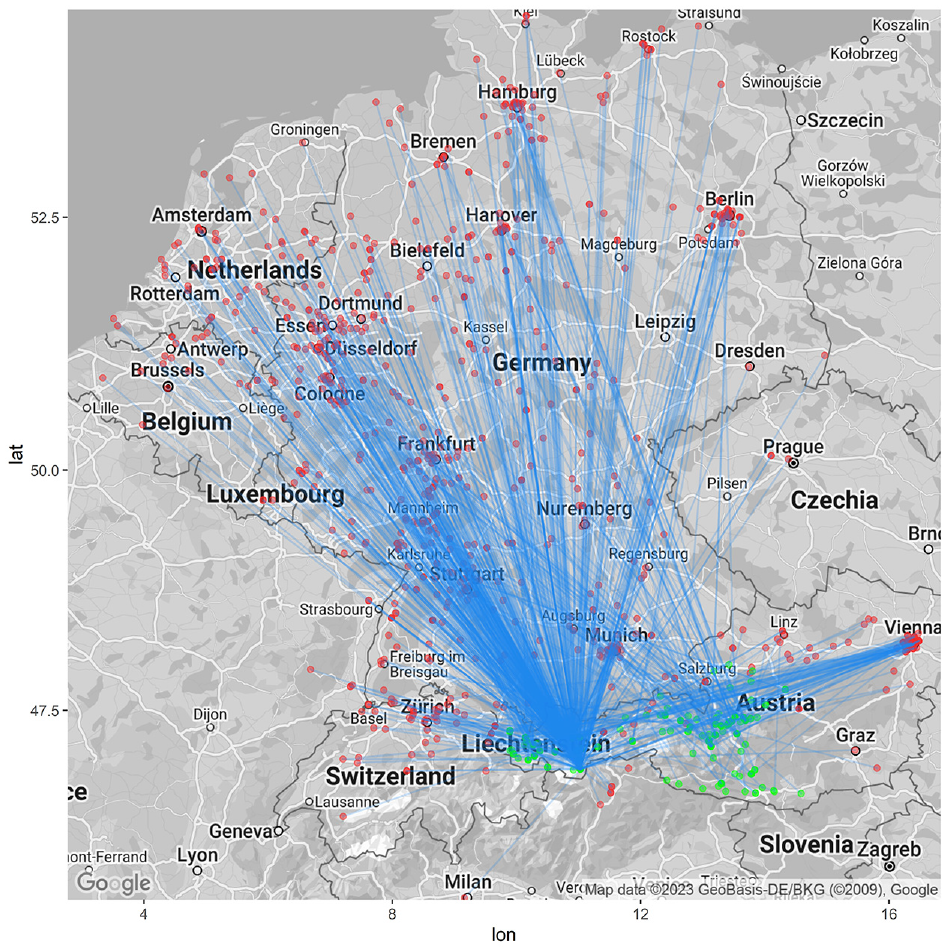
Trips observed in the sample.
Consequently, travel times were long and costs were correspondingly high, as shown in Figures 3 and 4. On average, for all cases, rail required greater travel time than PV (Figure 3a). Depending on the route and distance, the difference in travel time between rail and PV ran from 0% to as much as 50% (Figure 4a). If people chose rail, it was only if rail travel time is at least somewhat competitive with PV travel time (Figure 3b). A similar situation applied to travel cost. In general, rail was much more expensive than PV (Figure 3c), and the price spread could be very large even for the same distance (Figure 4b). There was a certain minimum and maximum price per kilometer (see Figure 4b: the visible cutoff of the point cloud at the bottom and top of the chart), but what happens in between depends on other factors, such as the rail operator’s pricing policy, seasonal offers, train occupancy, and timing of purchase. Except for certain exceptions for long distances, if people choose rail, then only if the cost of rail travel was comparable to that of a PV (Figure 3d).
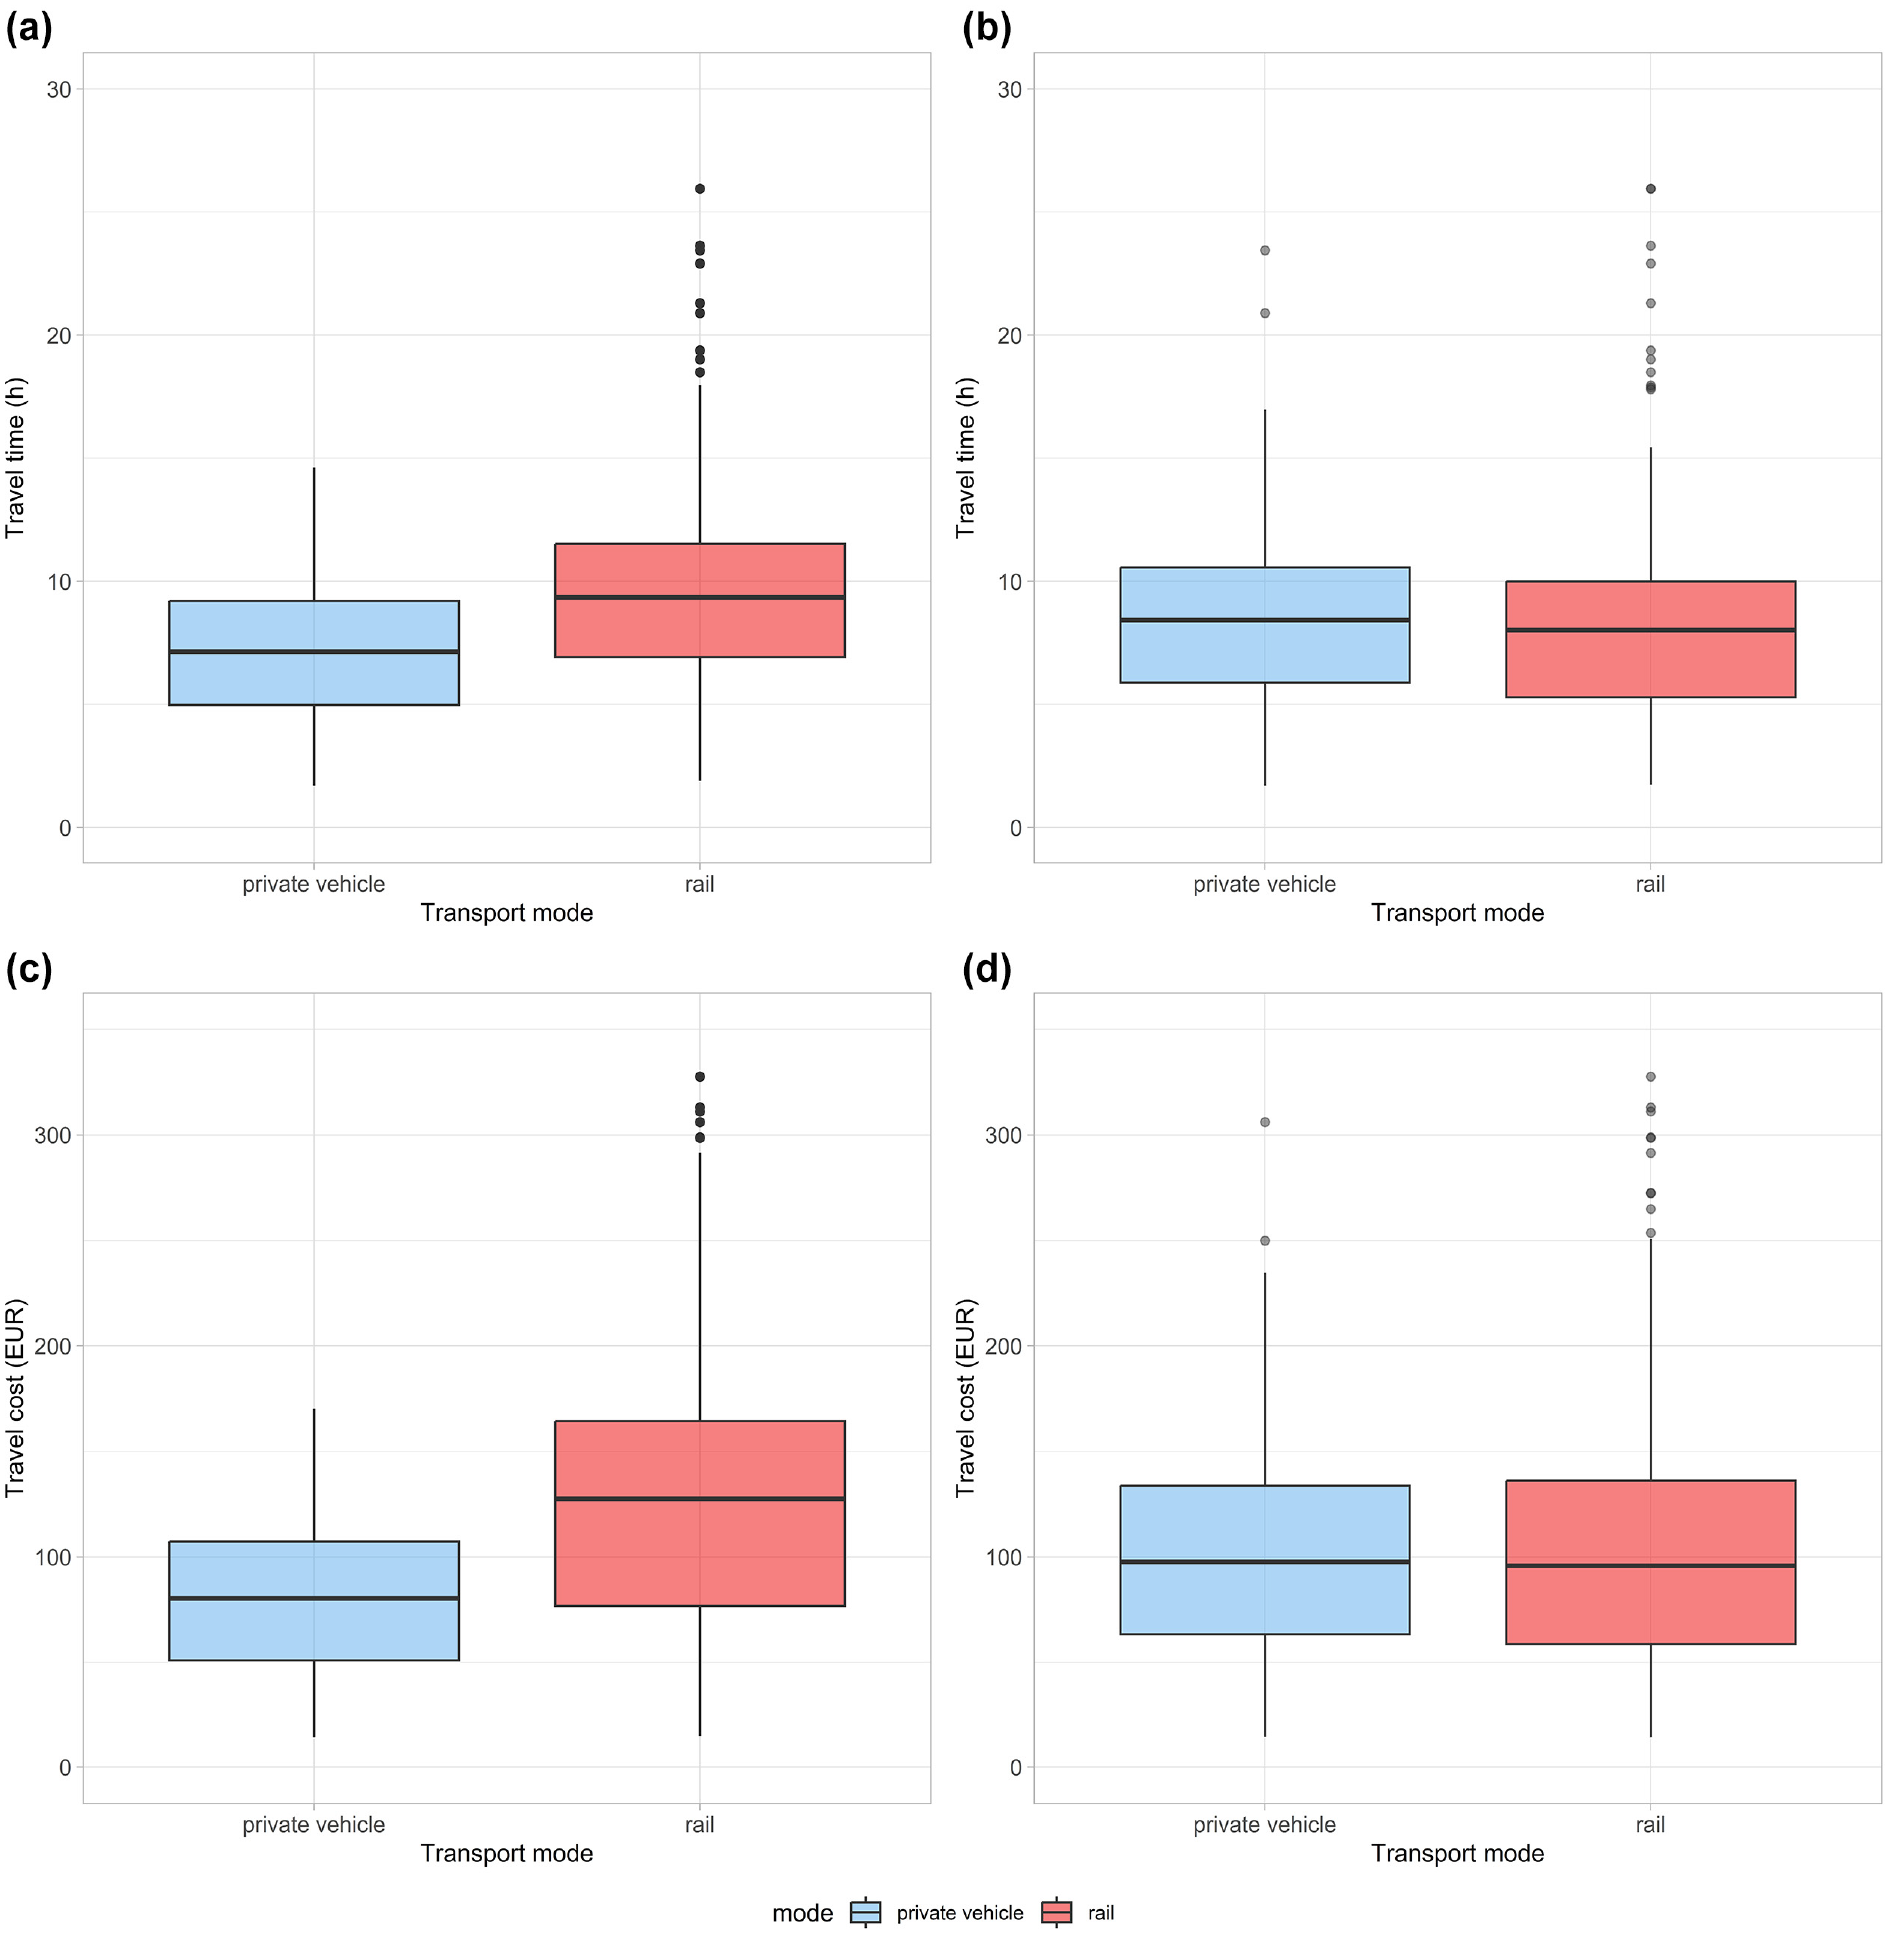
Travel time and travel cost distribution for all (chosen + unchosen) and chosen alternatives: (a) travel time: all cases, (b) travel time: chosen cases, (c) travel cost: all cases, and (d) travel cost: chosen cases.
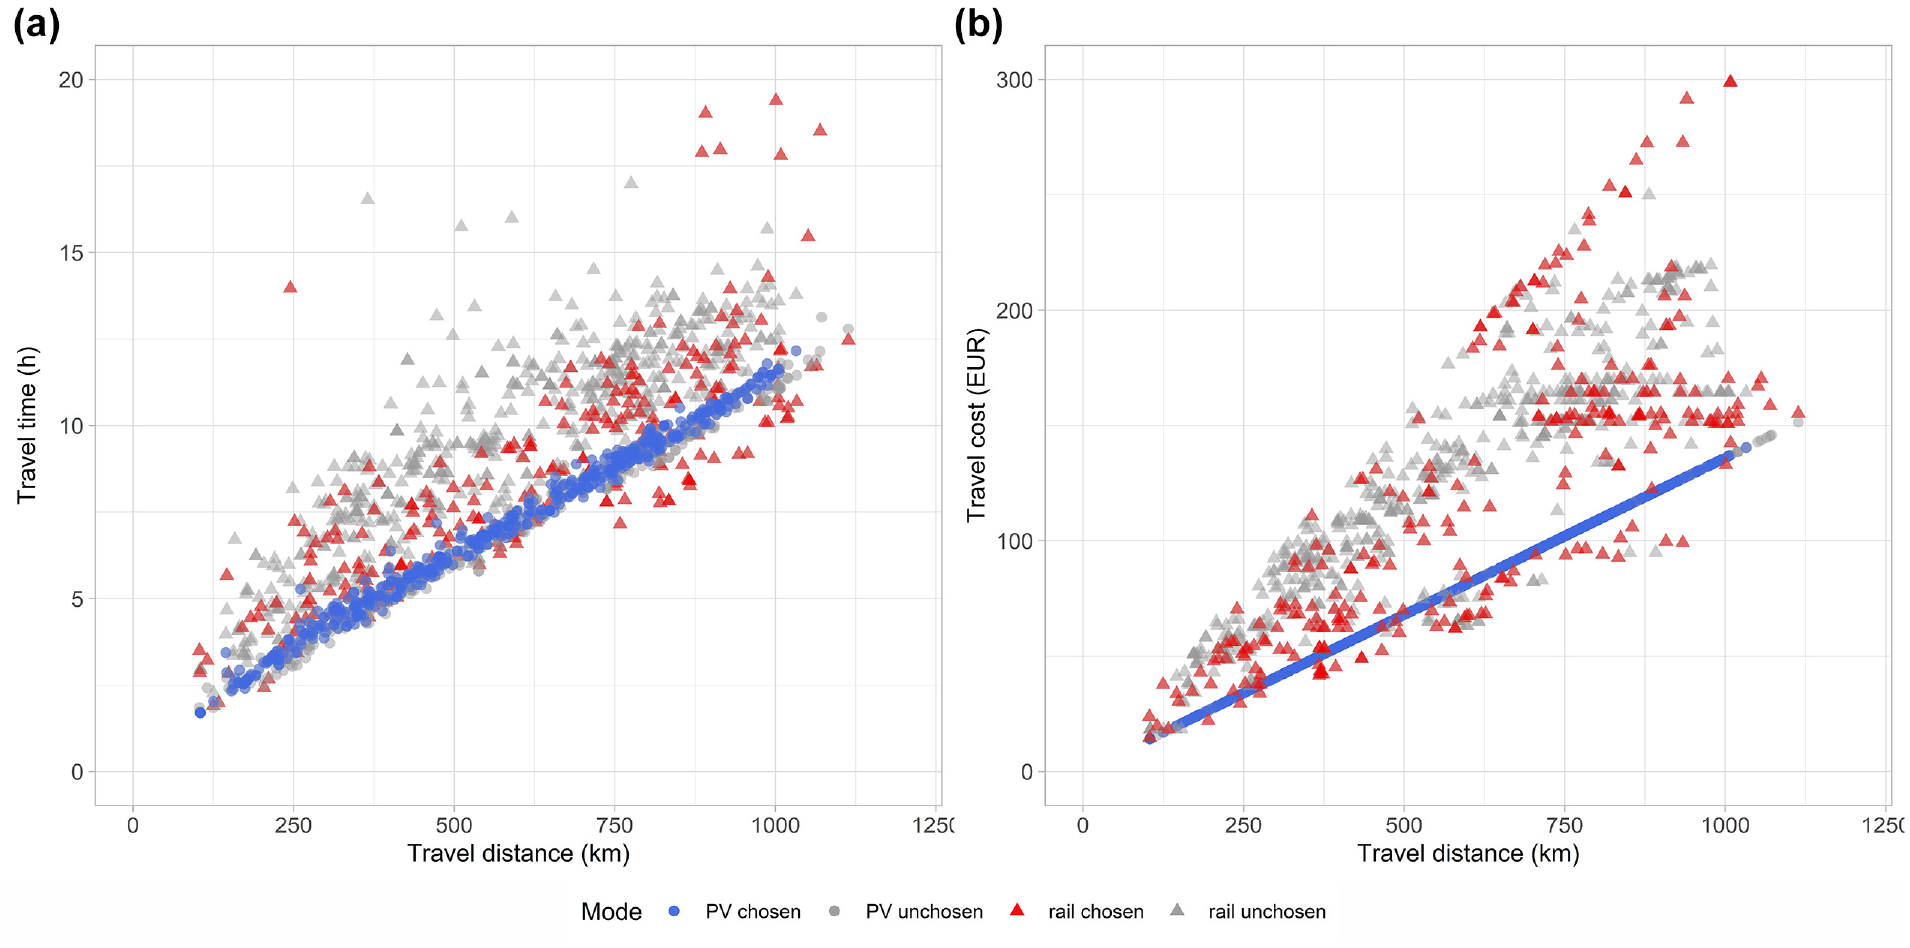
(a) Travel time and (b) cost depending on mode and distance.
Figure 5 shows the ratio of time and cost of rail to time and cost of PV on the same route, and which mode of transportation the respondent chose. There appeared to be a cutoff threshold for the travel cost ratio of rail to PV. Once the ratio exceeded about 1.5 (i.e., €150 rail cost when PV cost €100), rail was chosen far less frequently and PV was the preferred option. We obtained a similar picture for travel time with the threshold ratio around 1.2 to 1.3. In both cases there were some outliers in the upper part of the chart, indicating rail was chosen for very long trips (over 10 h) despite it being the more expensive and slower alternative—probably because very long distances can be difficult to drive in 1 day.
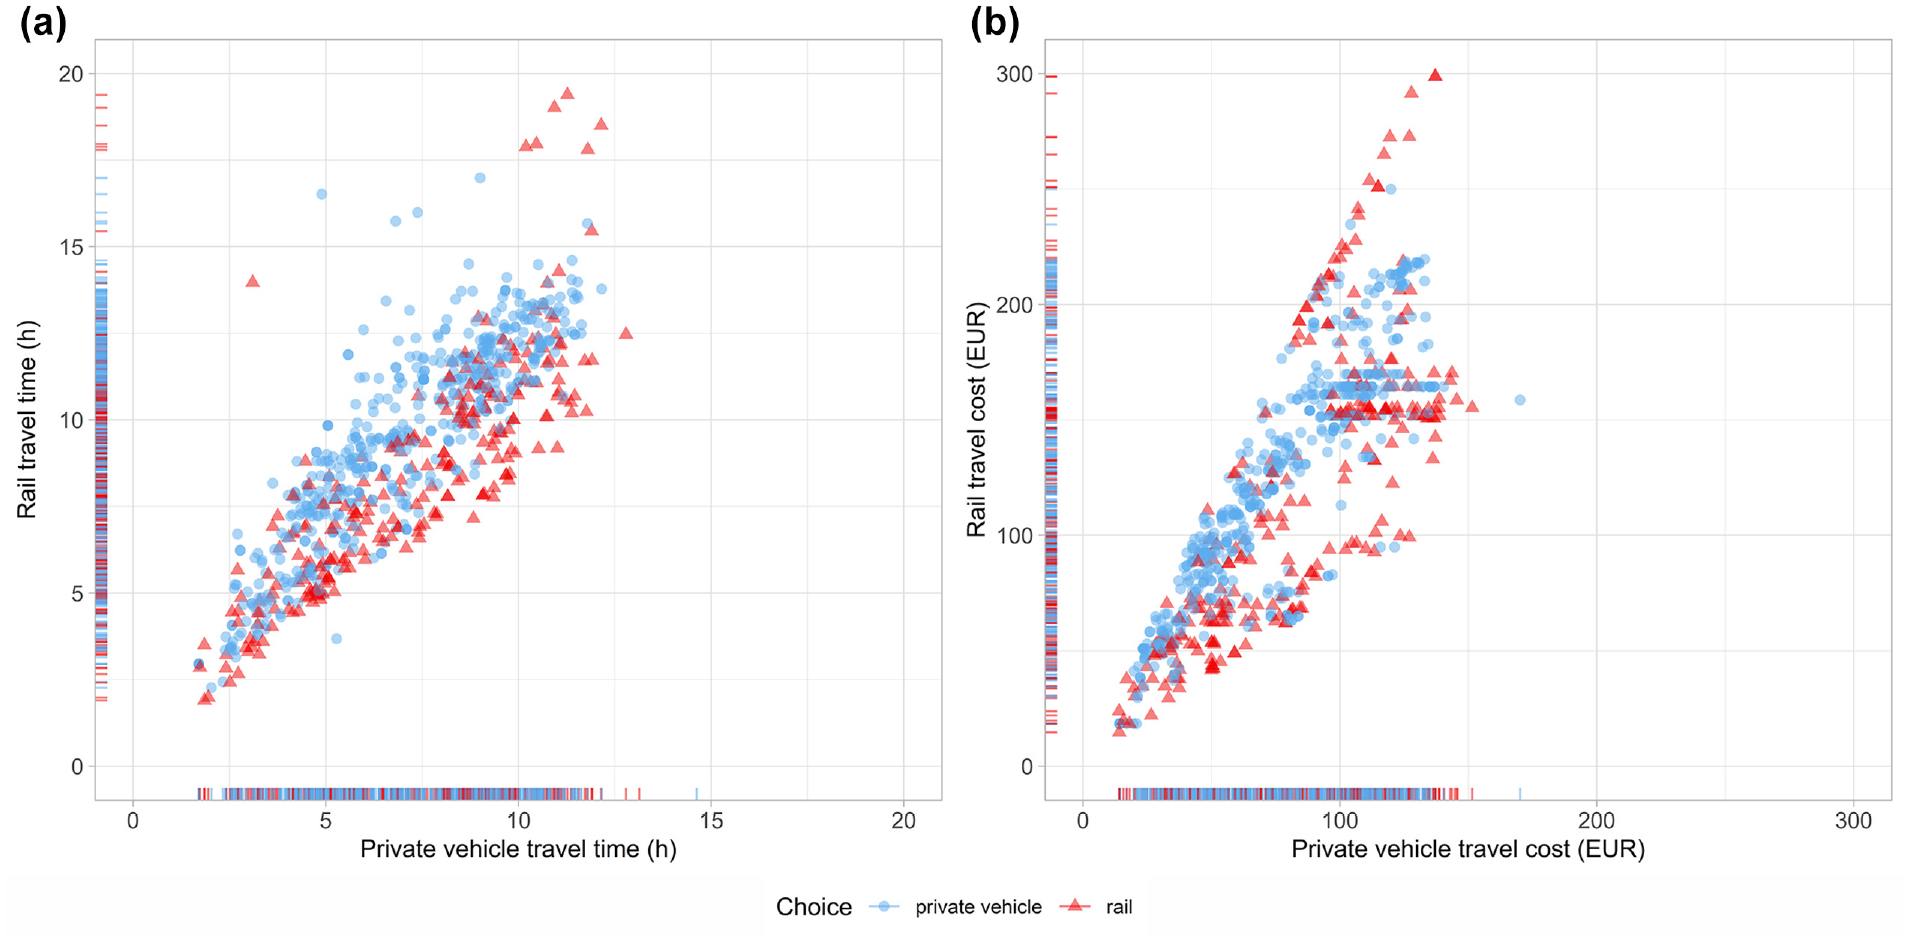
Ratio of (a) travel time and (b) travel cost by personal vehicle (PV) and rail.
Results
Transport Mode Choice
This study is based on the assumption that visitors behave rationally and maximize their utility when deciding about the transportation mode for long-distance vacation trips. We therefore used a multinomial logit model for modeling transport mode choice. We used statistical software R 4.2.2 ( 29 ) for all data processing tasks and the Apollo package for modeling ( 30 ).
From the data collected in the survey, we selected those variables that, based on the literature review and our own judgment, could potentially have an effect on the choice of transportation mode between PV and rail. However, the specification operating on all candidate variables of interest suffered from high multicollinearity between the model predictors. Therefore, we used backward elimination to remove selected variables from the model in a stepwise manner until only the theoretically justified and statistically significant explanatory variables remained.
The final specification (see Table 3) included travel time, travel cost in logarithmic transformation, dummy for middle-aged respondents (i.e., 30 to 59 years old), and seven dummy variables for declared reasons for choosing this particular mode. PV was the reference category, and all dummy variables were for rail.
Model Results
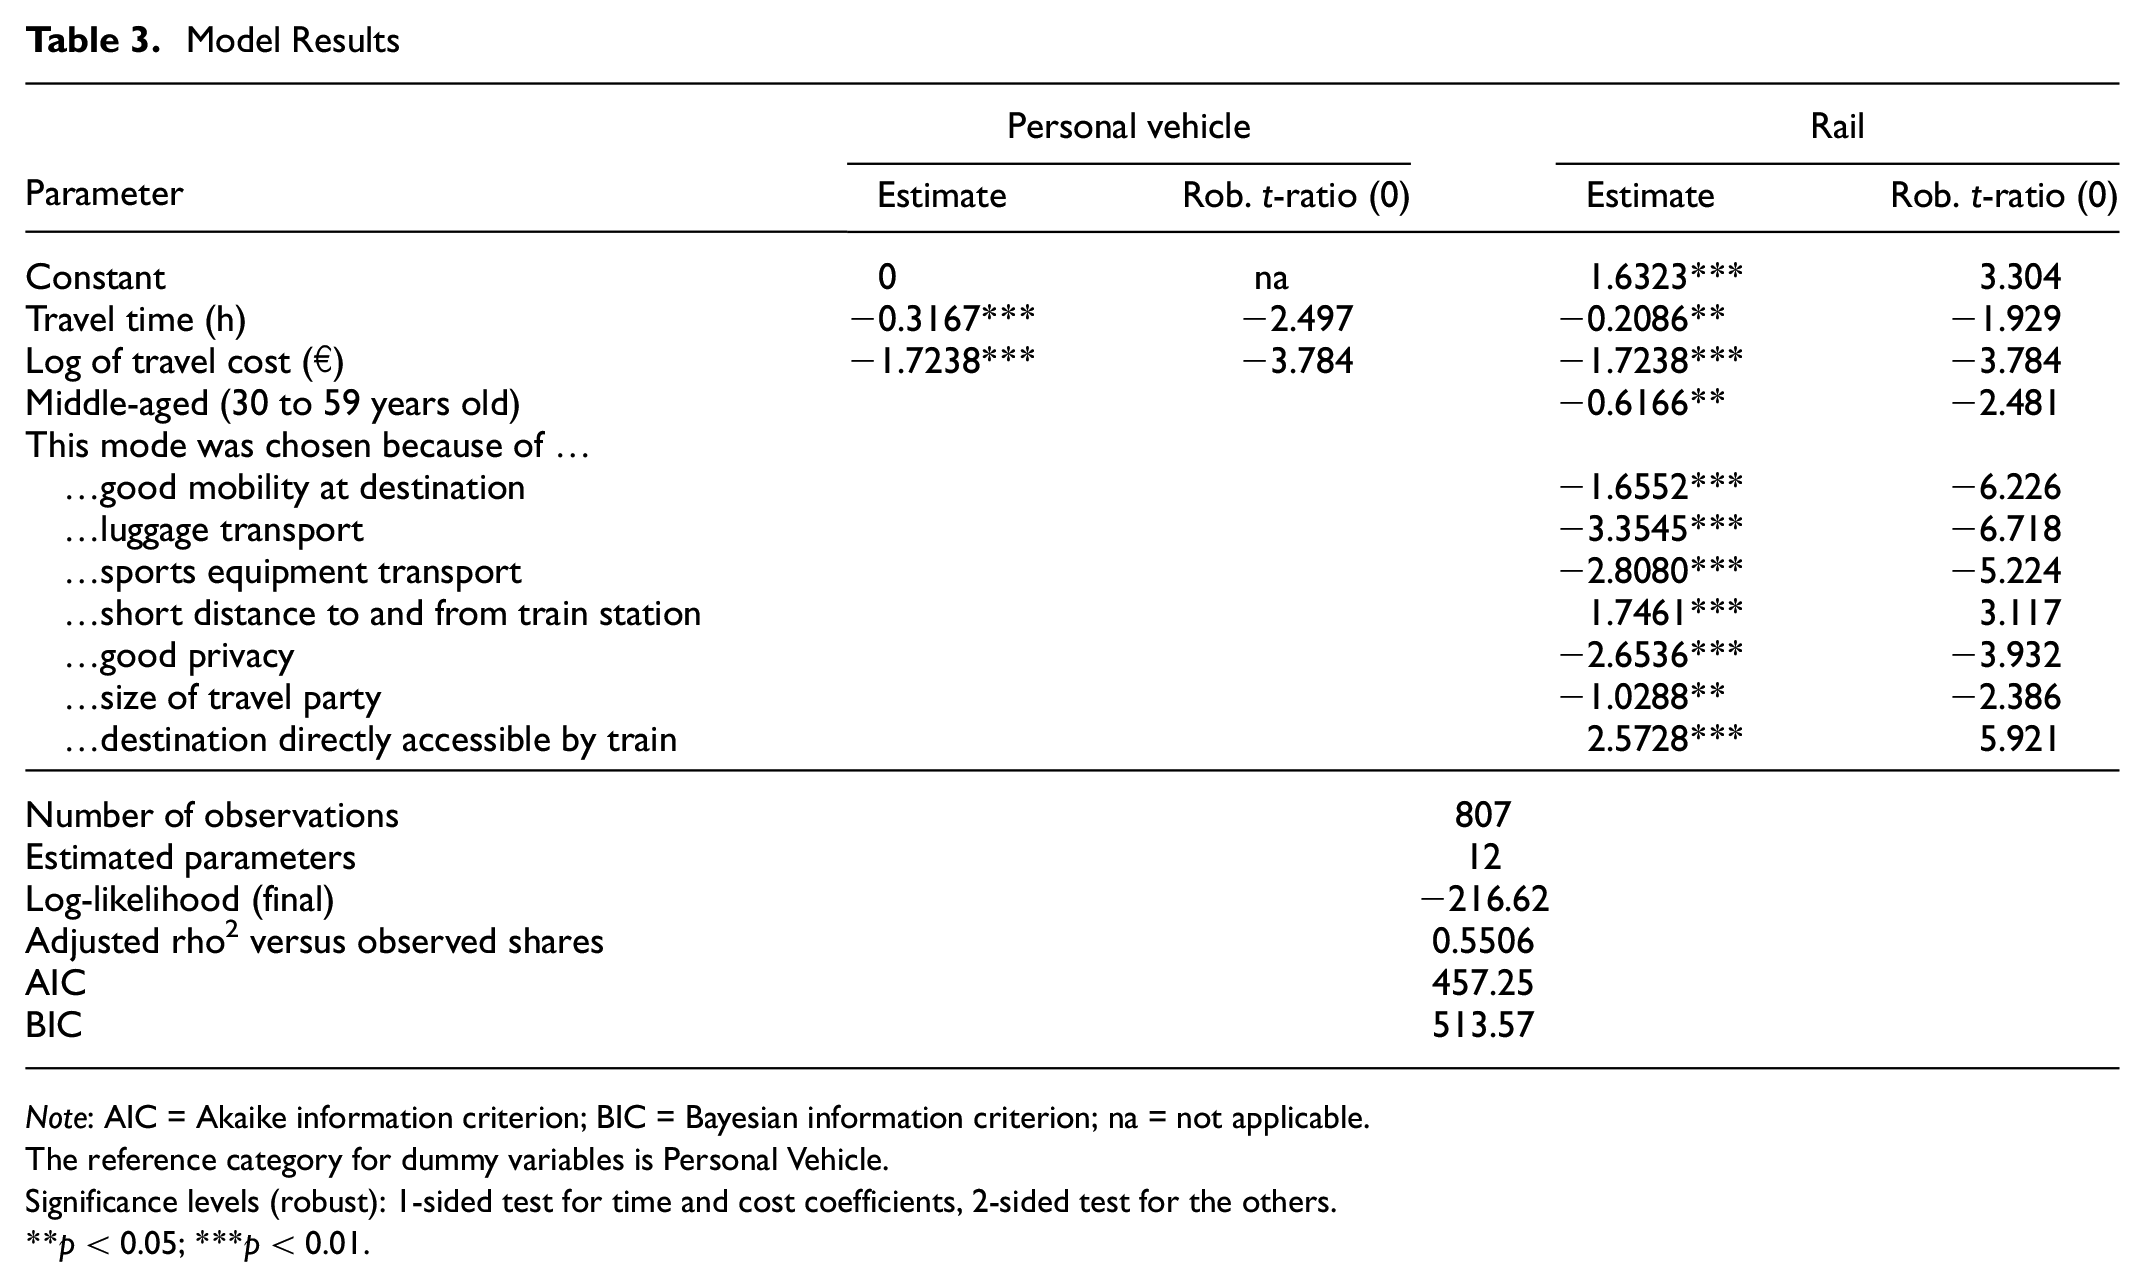
Note: AIC = Akaike information criterion; BIC = Bayesian information criterion; na = not applicable.The reference category for dummy variables is Personal Vehicle.
Significance levels (robust): 1-sided test for time and cost coefficients, 2-sided test for the others.
p < 0.05; ***p < 0.01.
Among the variables tested, gender, number of transfers for rail, and season were found to have no significant effect on mode choice. Country of residence, type of residential area, auto availability, and frequency of transit use were found to be significant, but were removed from the final specification because of their very high correlation with travel time.
All coefficients were statistically significant and had the expected signs. The coefficients for travel time were alternative-specific, whereas the coefficient for travel cost was generic: both variables had a negative effect on utility. The specification with alternative-specific cost coefficients did not outperform the specification with the generic cost coefficient. This finding was in line with Daly’s study: that travelers may evaluate time spent on travel differently depending on the mode, but cost is typically perceived equally across modes ( 31 ). An increase in fit was observed, however, with a log transformation of travel cost, as compared to a linear cost function (see Table A1 in the Appendix for the results of the model without the log transformation of travel cost). The p-value for the Ben-Akiva and Swait test (i.e., adjusted likelihood ratio test) of a model with and without logarithmic cost transformation was 0.00047, which confirmed that the former performed better (with the same number of parameters). The log transformation captured the diminishing effect of a cost increase on utility, that is, as the cost of travel increased, each additional one-unit change in the cost of travel had a decreasing impact on the utility. This represents the damping effect of cost ( 32 ) that is widely recognized in everyday travel behavior studies and national transportation models ( 33 ), but not yet widely investigated in the context of long-distance vacation travel (with rare exceptions, such as the research by Mabit et al. [ 18 ]).
The model revealed that middle-aged travelers were significantly less likely to travel by rail to their vacation destination. This is reasonable, as they typically travel with family, take more luggage and specific equipment, they mostly possess a PV, have higher incomes, greater comfort requirements, and because of professional activity may need to make arrangements that require more flexibility in trip planning, which are easier with PV than with rail.
Furthermore, we observed that respondents who put a high value on good mobility at the destination were less likely to choose rail. They wanted to avoid the risk of being constrained by public transportation service at the destination and thus having to adjust their vacation schedule: PV ensures independence and usually offers the most efficient use of time.
Transport of luggage and sports equipment was critical for the choice: participants declaring these issues significantly rejected the rail alternative. Despite the efforts of rail operators who have equipped railway cars with special luggage compartments, invested in low-floor cars, and even offer a (by no means attractive, cf. Bursa et al. [ 34 ]) door-to-door luggage transport service, bringing luggage by PV is clearly the most convenient and currently unrivaled option.
Likewise, the size of the travel group had a negative impact on the choice of rail. This was certainly directly related to the cost of the trip, since each additional person (e.g., up to five) in a car does not affect the cost of the trip, whereas in the case of rail it does, since separate tickets are required for each traveler (even with discounts for groups or children, the additional cost is always there). Valuing private space when traveling also significantly reduced the likelihood of choosing rail.
On the other hand, the choice of train for holiday travel was positively influenced by the existence of a direct rail connection to the destination, as were being a short distance from the terminal to the final destination (last mile), and proximity from home to the starting station (first mile).
From the rail operator’s point of view, it is important to understand how travelers may react to changes in the LoS of rail. To find that out, we calculated point elasticities with respect to time and cost (Table 4).
Time and Cost Point Elasticities
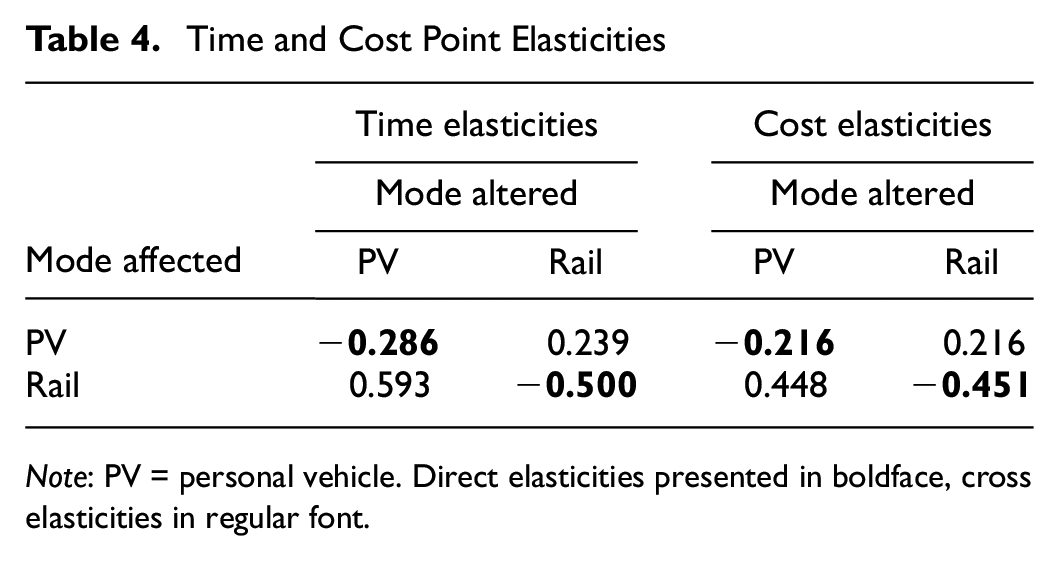
Note: PV = personal vehicle. Direct elasticities presented in boldface, cross elasticities in regular font.
The outcomes indicated that long-distance vacation car travel was quite inelastic with respect to both time and cost, although not as highly as in the case of intradestination travel (i.e., during the vacation) where the response to cost was marginal ( 22 ). Both time and cost elasticities for rail were nearly twice that of PV. Furthermore, the values were higher than typically observed in short-distance travel ( 35 , 36 ). Clearly, the distance effect manifested itself here, as travelers were more aware of the cost of travel on such nonrecurrent, long, and expensive trips. Our elasticities were, however, still lower than for other (nonholiday) private long-haul travel (see data obtained by Rich and Mabit [ 13 ]), which nonetheless demonstrated some resilience (despite distance and cost) of travelers to LoS changes in holiday travel.
We observed that time elasticities were slightly higher than those of cost. This is consistent with literature showing that people respond more to service improvements than to fare reductions ( 37 ). Furthermore, in more recent studies (cf. 38 ), noncommuting and discretionary travel appear to be more sensitive to changes in travel time than -costs.
Generally, our results matched almost precisely for PV, but less so for rail, the values reported in literature, such as with the holiday model devised by by Rich and Mabit: −0.25 car cost, −0.23 car time, −0.46 rail cost, −0.19 rail time ( 13 ), or with the UK values for interurban leisure car trips by Wardman: −0.23 car cost, −0.26 car time, −0.81 rail cost, and −0.75 rail time ( 35 , 36 ).
Value of Travel Time Savings
VTTS serves as a fundamental concept in travel demand modeling and is crucial for policy evaluation and project appraisal ( 39 ); it is defined as the price one would be willing to pay to save travel time. The literature on VTTS is broad, both on its applications in transportation as well as on the methodological aspects ( 40 ). The majority of these studies, however, deal with commute travel, the body of work on VTTS in long-distance travel is very limited. Given the complexity of the VTTS concept depending on travel purpose, distance, and so forth, we hypothesized that VTTS in the context of long-distance vacation trips would differ from the VTTS in regular travel (e.g., commute, business, other private purposes) and for nonvacation long-distance travel. In Table 5 we report the VTTS obtained for PV and rail.
VTTS for PV and rail in Euro/h
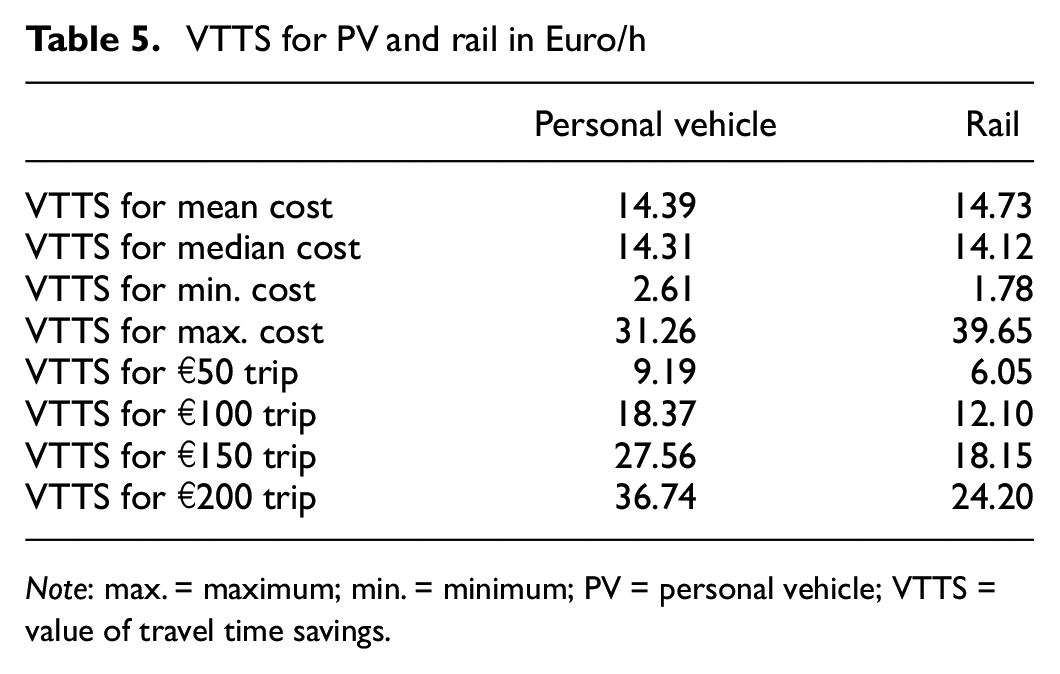
Note: max. = maximum; min. = minimum; PV = personal vehicle; VTTS = value of travel time savings.
Firstly, the (statistically significant) log form implied that VTTS increased with trip length, which was the result of declining sensitivity to cost ( 41 ). For longer (more expensive) trips, we observed higher willingness to pay for travel time savings than for shorter trips. The value of time grew at the rate of the increase in the cost of travel. For example, a doubling of the cost from €50 to €100 resulted in a two times increase in the observed VTTS for a car, from €9.19 to €18.37/h, and for rail from €6.05 to €12.10/h. Furthermore, we observed that the willingness to pay for a 1-h reduction in driving time was approximately 52% higher than the willingness to pay for such a reduction in rail travel time. Figure 6 presents the actual VTTS observed in our sample as a function of travel cost.
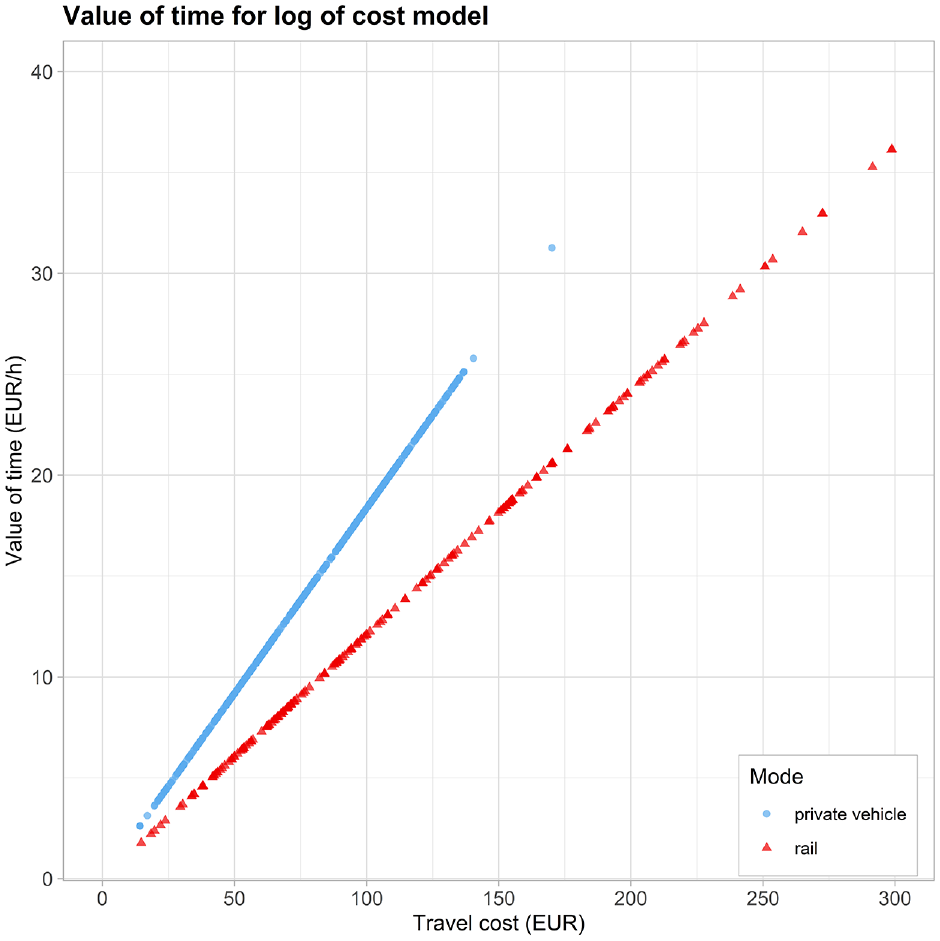
VTTS observed in data as a function of travel cost.
Secondly, our VTTS were higher than typical values reported in the (limited) literature on VTTS in noncommute travel. Swedish VTTS results for trips >100 km were €11.7/h for PV and €7.3/h for rail ( 19 ). Another Scandinavian study delivered similar average values of €10.8/h for PV and €7.2/h for rail, although they varied considerably depending on travel distance and duration ( 18 ). The implied metamodel VTTS by Wardman et al. for noncommute interurban car trips were €9.79/h for Austria, €9.11/h for Germany, €10.34/h for the Netherlands, and €11.44 /h for Switzerland ( 42 ). Overall, VTTS valuations for PV were on average 20% to 40% greater and for rail even 40% to 100% larger in our study than in the cited works. These differences might be attributed to the type of data used: according to Shires and de Jong, studies based on stated preference (SP) data generate lower values for passenger travel than studies based on actual observed choices (as in our case) ( 43 ). These differences might result from the (artificial) nature of SP surveys, the presentation format, or strategic bias, but also from imprecise RP measurements and unobserved covariates. The magnitude of this difference in our data corresponded approximately to that of meta-analyses (according to Wardman et al., RP/SP ratio is 1.46 [ 42 ]). We believe, however, that this may also be the result of what, in our view, is the inherently higher value placed on vacation time, which is typically capped at, for instance, 25 working days per year, is usually planned in advance, and constitutes a long-awaited event during the course of the working year.
Thirdly, the VTTS in our study were not only higher than those in the literature, but were also higher than average: the median net hourly wage rate (in 2016) in the countries from which the majority of the respondents originated was around €13 in Austria, €12 in Germany, and €15 in the Netherlands F( 44 ). This led us to conclude that the opportunity cost of leisure time for long-distance vacation travel does not necessarily correspond to wage rates ( 45 ). Again, this indicates that vacation time is very precious, and people are willing to pay more than they earn per hour to save an hour of travel time and arrive at the destination sooner. Moreover, rather than invest the time saved into more paid work ( 46 ), in long-distance travel it will more likely be used to engage in more activities, travel, or consumption at the destination (given the limited time budget)—a rebound effect that can, however, have negative environmental implications ( 47 ).
Some researchers postulate that travel does not have to be just a by-product of the activity, but can constitute the activity itself ( 48 ). This concept might be very applicable in the tourism context when people opt for PV to drive along scenic roads or choose the train to observe nature from panoramic windows. That is, they treat the ride itself as part of the vacation experience, not just a tiresome necessity to get from A to B, as in the daily commute. As found in other studies ( 49 ), our data indicated that travel time by rail was valued less than by PV (at about 65% of that by PV). It might be that the willingness to pay for time savings on rail is lower, since time spent on a train can (for some) be productive, enjoyable, and bring affective benefits ( 50 ) as opposed to undertaking “worthless” driving ( 46 ). However, we measured neither the quality nor the worthwhileness of travel time in our survey, so this is purely speculative.
Discussion and Conclusion
This article presents the results of a unique study that fills in some of the gaps in the literature on the determinants of mode choice for long-distance vacation travel, mode choice elasticities, and VTTS.
As in the study by Mabit et al. we detected a cost damping effect, but our results were based solely on RP data and pertained only to vacation travel ( 18 ). Our model revealed that both younger and older travelers were more likely to choose rail for long-distance trips, as found by Arbués et al. ( 51 ). We also confirmed the findings from a qualitative study by Price and Matthews, who identified general convenience (transfers, luggage transport, etc.) and cost to be the main barriers to rail use on long-distance trips, especially among families ( 50 ). This is particularly relevant because rail operators (Austrian, German, and Swiss) have been offering a door-to-door luggage delivery service for years, but this still apparently falls short of travelers’ expectations and does not appear to have persuaded them to choose rail. By contrast, direct connections to the destination and short first-/last mile had positive effects on the choice of rail.
The elasticities obtained clearly indicated that vacation travelers are quite resistant to changes in LoS. Changes in the cost and time of travel by PV induced only a very small shift in modal share. In contrast, the response to changes in LoS on rail was twice as high, which should guide rail operators and policy makers in designing their pricing policies. Moreover, the response to travel time was slightly higher than to travel cost. This means that travelers are more likely to switch from PV to rail if travel time gets worse than when costs increase. There would have to be a radical increase in the cost of traveling by car, or a radical decrease in the cost of traveling by train, for significant modal shifts to occur. Looking at the elasticities, a 100% increase in driving costs should lead to about a 22% reduction in car travel. Of course, with such a massive shift in travel costs, the elasticity values may no longer hold, as they may change in a nonlinear fashion. Considering the cost dumping evident in our data, a projection for a 100% driving-cost-increase scenario resulted in a drop in the PV share from 68% to 58%. This is not an irrelevant change, but it is unlikely that we would ever be able to observe whether this change actually manifested itself in vacation travel, since such an increase in the cost of driving would put a heavy burden on commuters, which would constitute significant political risk for those instituting such a policy.
The VTTS values we obtained indicated that tourists going to the Alps valued travel time highly—the longer the trip the more they valued it—that is, they appeared to be “cash-rich” and “time-poor” and wanted to reach their destinations as quickly as possible. They were therefore goal-/destination-oriented rather than process-/travel-oriented following the classification of McKercher and Tkaczynski ( 52 ). However, McKercher and Tkaczynski observed this phenomenon mainly on short distances up to 200 km, whereas in our case this occurred on long-distance trips.
The current study contributes to our understanding of the mode choice decisions of vacationers and how they evaluate travel time on long-distance trips, yet there are several further aspects that need exploring. We suggest that surveys collect data on luggage (type, amount, weight, and so on), since our research clearly showed that luggage is treated as a member of the travel party. We also need to learn more about the attributes pertaining to convenience and comfort on trains (e.g., seats, crowding, dining car, quiet zones, Wi-Fi) and in PVs (e.g., type, make and model, fuel consumption, size of trunk). Personal characteristics that might interact with rail attributes should also be considered (e.g., possession of a rail pass such as the GA Travelcard in Switzerland, the Climate Ticket in Austria, and the BahnCard in Germany), preferences for departure and arrival times, for 2nd- or 1st-class rail tickets, and so forth. Researchers should also distinguish within PV between traveling as a driver or as a passenger, and within rail between train categories (high-speed versus conventional rail, intercity, regional, night trains), although this would require very detailed data to reconstruct the unchosen alternatives, especially for rail. Another aspect worth looking at is the usability and worthwhileness of time spent on the train—night trains play a very special role here.
Finally, we call for including questions about the means of transportation chosen for the vacation trip in the information collected at the time of booking and checking into the hotel (currently only the following data are collected: country of residence, date and duration of visit). This would make it possible to determine the actual modal split among tourists and observe any changes in it, as well as to model and assess any apparent causal connections with the policies and actions being implemented.
Supplemental Material
sj-pdf-1-trr-10.1177_03611981241252837 – Supplemental material for Mode Choice and Value of Time on Long-Distance Vacation Trips
Supplemental material, sj-pdf-1-trr-10.1177_03611981241252837 for Mode Choice and Value of Time on Long-Distance Vacation Trips by Bartosz Bursa in Transportation Research Record
Footnotes
Acknowledgements
The author would like to thank all project partners and destination management organizations for their participation and support in the data collection. The author also thanks the three anonymous reviewers for their constructive comments, and Markus Mailer of the University of Innsbruck for the many productive discussions on the subject over the years.
Author Contributions
The author confirms sole responsibility for the following: study conception and design, data collection, analysis and interpretation of results, and manuscript preparation.
Declaration of Conflicting Interests
The author declared no potential conflicts of interest with respect to the research, authorship, and/or publication of this article.
Funding
The author disclosed receipt of the following financial support for the research, authorship, and/or publication of this article: The survey was carried out with funds granted under the EasyTravel project (grant no. 855031) funded by the Austrian Research Promotion Agency (FFG).
Supplemental Material
Supplemental material for this article is available online.
References
Supplementary Material
Please find the following supplemental material available below.
For Open Access articles published under a Creative Commons License, all supplemental material carries the same license as the article it is associated with.
For non-Open Access articles published, all supplemental material carries a non-exclusive license, and permission requests for re-use of supplemental material or any part of supplemental material shall be sent directly to the copyright owner as specified in the copyright notice associated with the article.