
Abstract
Cross-median crashes involve vehicles departing the roadway to the left, crossing the median of a divided highway, and colliding with a vehicle traveling in the opposite direction. These crashes are severe, often resulting in fatal or serious injuries. To mitigate this crash type, transportation agencies may install median barriers. The high-tension cable median barrier is a flexible system that is intended to contain or redirect vehicles entering the median—this barrier type has recently been installed along freeway segments throughout Pennsylvania. The purpose of this study is to develop crash modification factors for this barrier system. An empirical Bayes observational before–after study was used to develop the crash modification factors—various crash types, area types (urban versus rural), and barrier placement locations were considered. The results indicate that, when considering both urban and rural locations combined, the installation of high-tension cable median barriers is associated with an increase in total, fatal plus injury, property-damage only, and hit-barrier crashes on freeway segments. The expected number of cross-median, fatal plus suspected serious injury, and fatal plus suspected serious injury cross-median crashes is expected to decrease when installing high-tension cable median barriers. The crash modification factor for high-tension cable median barriers is higher for installations along the shoulder of the freeway segment when compared to installations in the center of the median.
Keywords
Crashes on freeways tend to involve high travel speeds and, as a result, lead to the most severe injury outcomes. Of particular concern are cross-median (CM) crashes in which a vehicle departs the roadway to the left, crosses the median of a divided highway, and enters oncoming traffic. While relatively infrequent—the U.S. Department of Transportation (U.S. DOT) reports that just 2%–5% of all interstate crashes are of this type—they often result in serious injuries or fatalities ( 1 ). Thus, effective countermeasures are needed to both mitigate these crashes and reduce their severity.
Median barriers are a type of safety countermeasure installed in the medians of freeway segments that are the primary countermeasure to reduce the opportunity for CM crashes ( 2 ). They are typically used on high-speed, divided highways with high traffic volumes. Rigid or semi-rigid barriers—made of concrete or metal—are effective at reducing CM crashes but are relatively expensive to install. By contrast, cable barriers are flexible systems made up of a series of steel cables supported by posts anchored to the ground and have lower impact severities when struck, relative to rigid or semi-rigid systems ( 3 ). High-tension cable median barriers (HTCMBs) are tensioned to absorb and redirect the energy of a colliding vehicle. Because they are not as rigid as metal or concrete barriers, they often have greater deflection distances after impact and, therefore, often require more lateral space to be installed than semi-rigid or rigid barriers.
There are relatively few studies on the safety effectiveness of HTCMBs as a countermeasure on divided highways. Earlier attempts to quantify the safety impacts of this treatment have relied on simple analysis methods. For example, several studies focused on relative changes in crash frequency or crash rates across the periods before and after the HTCMBs were installed ( 4 – 7 ). Such analysis methods fail to account for changes in traffic volumes or other factors that might have occurred during the analysis period or regression-to-the-mean bias. Storm et al. ( 8 ) performed a cross-sectional study using data from Minnesota that compared crash frequencies at sites with HTCMBs to those without. The cross-sectional method can help account for changes in traffic volumes or other features. However, the results of cross-sectional methods can be biased if the sites with and without the treatment (i.e., HTCMBs) have dissimilar features. Chimba ( 9 ) and Russo et al. ( 10 ) applied the empirical Bayes (EB) before–after method to HTCMB sites in Tennessee. This analysis method properly accounts for statistical factors, such as regression-to-the-mean, differences in traffic volume, and crash trends (time series effects) between the periods before and after the installation of HTCMBs ( 11 , 12 ), and is often considered the most robust countermeasure evaluation method.
Tables 1 and 2 provides a summary of crash modification factors (CMFs) for implementation of cable median barriers that are available in the Federal Highway Administration (FHWA) CMF Clearinghouse ( 13 ) or in National Cooperative Highway Research Program (NCHRP) Report 794 ( 14 ); only those CMFs that are rated 3 or more stars on the 5-star rating system are included. Overall, the results provide some consistent evidence to suggest that HTCMBs are associated with a decrease in the frequency of severe crashes; however, installing median barriers on divided highways may be associated with in an increase of lower injury severity crashes. For example, as shown in Table 1, the cable median barrier installation in Iowa resulted in the highest reduction in fatalities and a lower reduction in the minor injuries of CM crashes, while property-damage only (PDO) crashes increased ( 15 ). In line with expectations, the results also reveal that, in general, the implementation of cable median barriers has a greater safety benefit (lower CMF) on median-related crashes, including both CM crashes and other median-related crashes (M), than other types. In addition, most results for CM and M crashes are statistically significant while most results for the other types are not statistically significant or do not report standard errors. However, the CMFs shown in Table 1 indicate that most studies evaluate cable median barriers in rural areas. Thus, it appears little is known about the safety performance of HTCMBs in urban settings.
Summary of Crash Modification Factors (CMFs) for Implementation of Cable Median Barriers on Cross-Median-Related Crashes
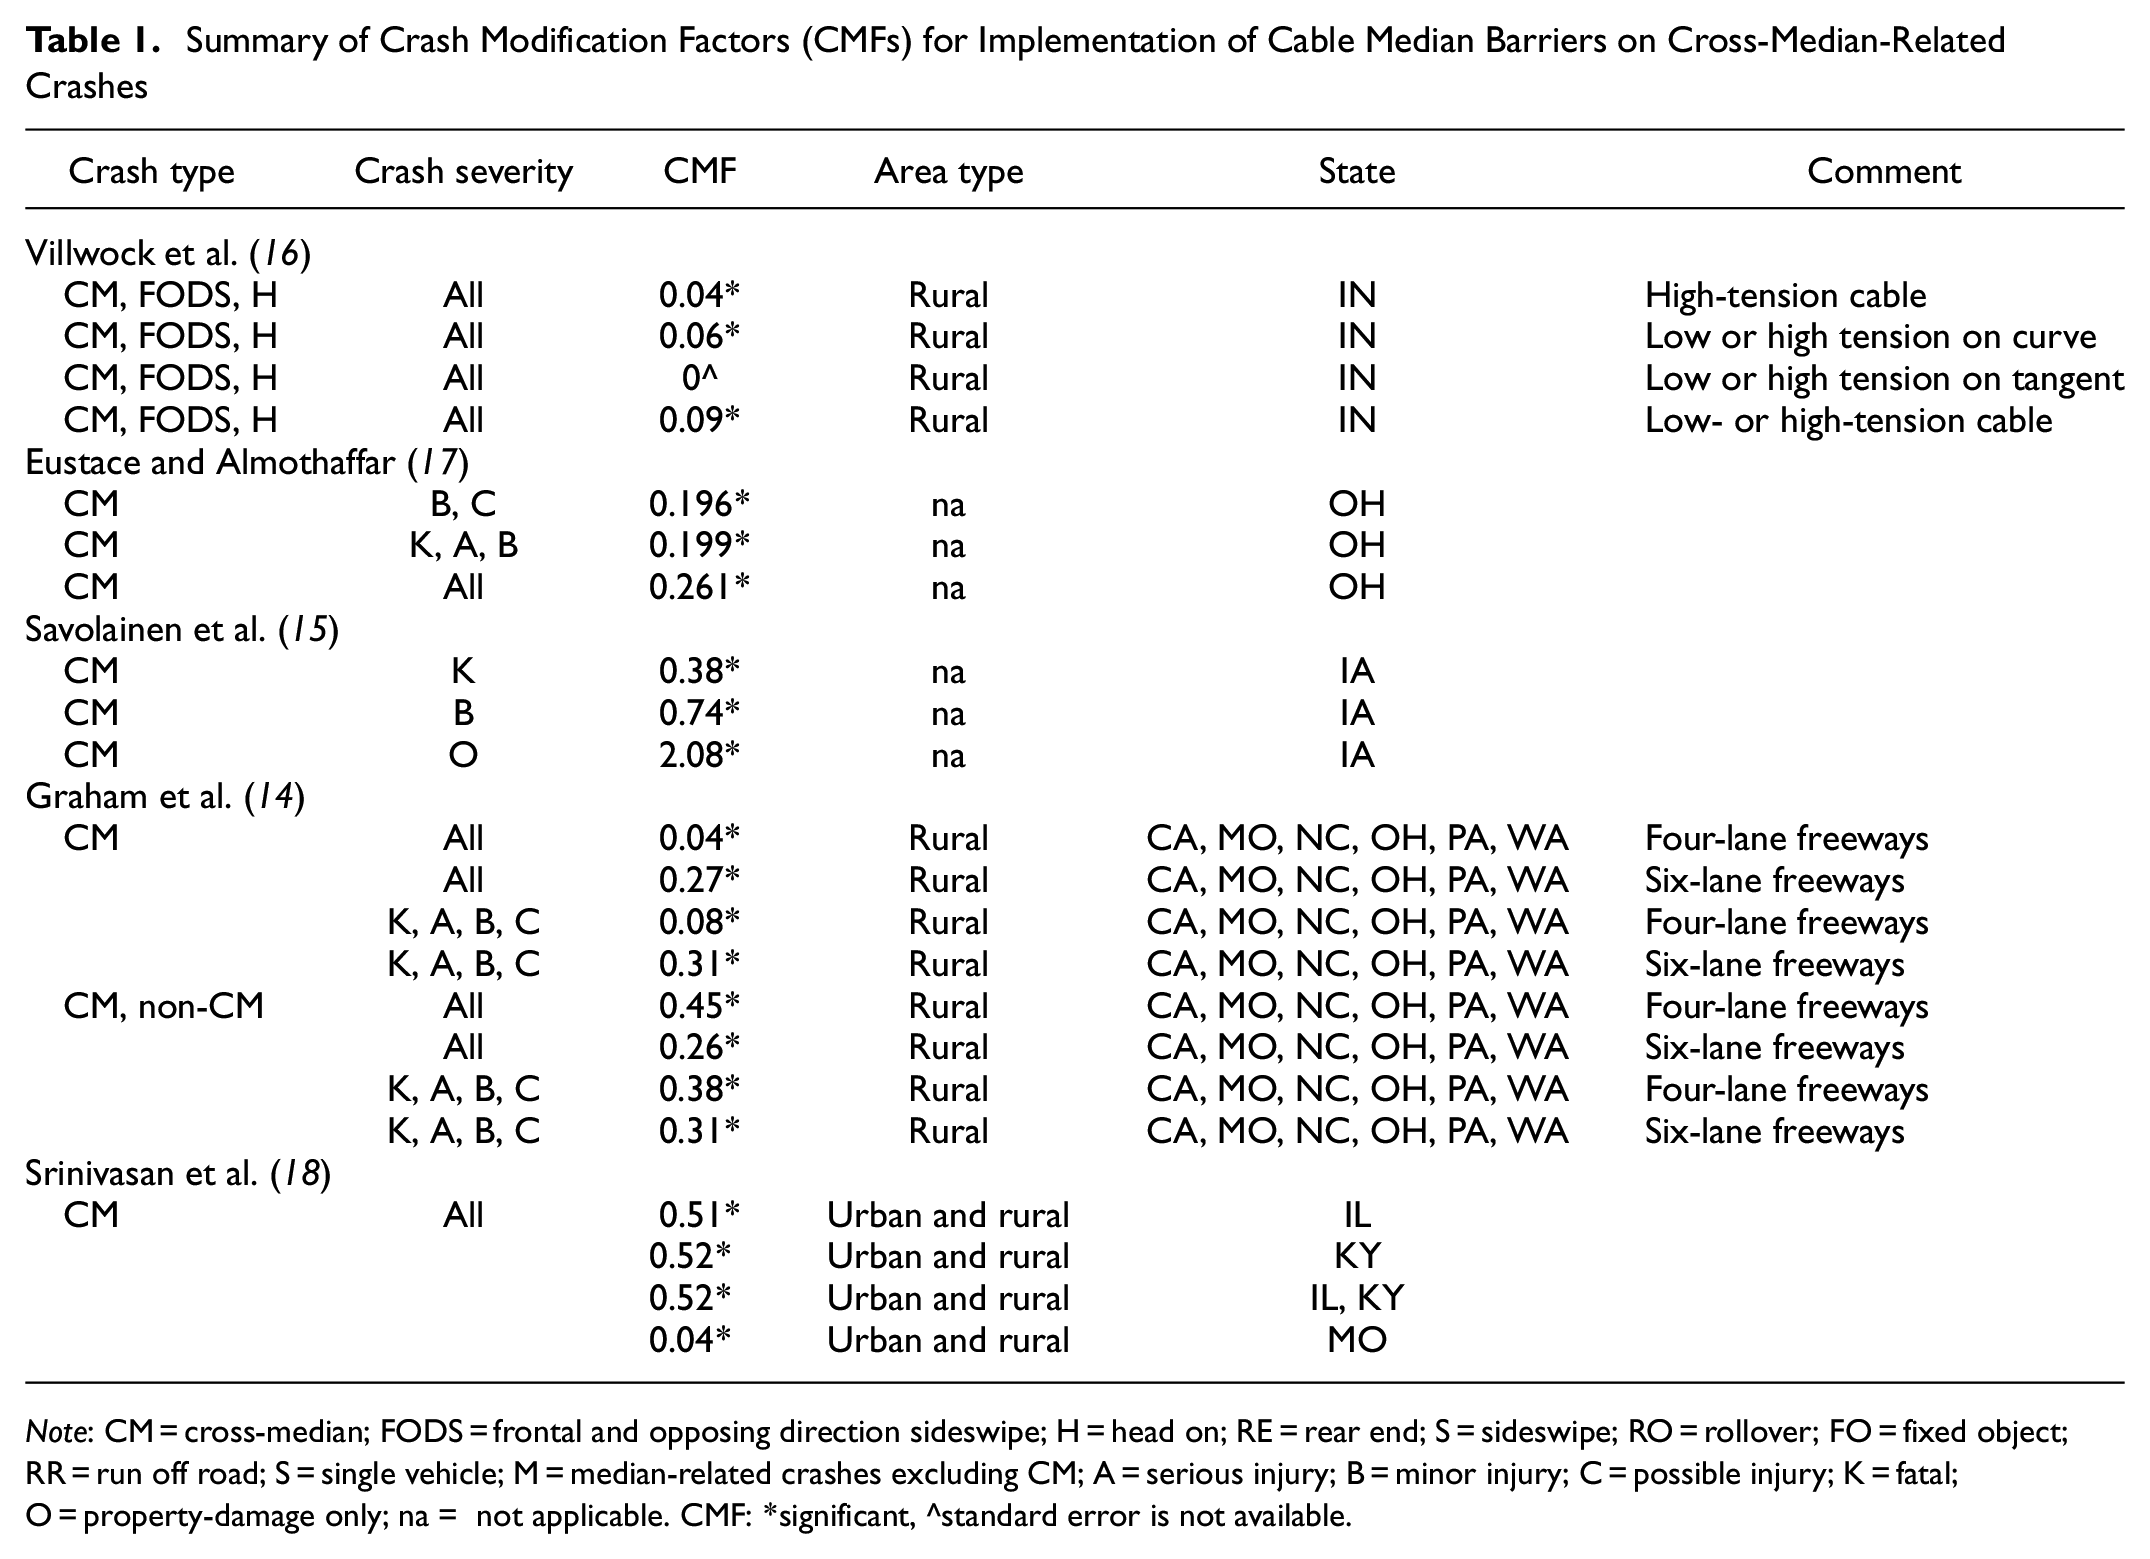
Note: CM = cross-median; FODS = frontal and opposing direction sideswipe; H = head on; RE = rear end; S = sideswipe; RO = rollover; FO = fixed object; RR = run off road; S = single vehicle; M = median-related crashes excluding CM; A = serious injury; B = minor injury; C = possible injury; K = fatal; O = property-damage only; na = not applicable. CMF: *significant, ^standard error is not available.
Summary of Crash Modification Factors (CMFs) for Implementation of Cable Median Barriers on Other Crash Types
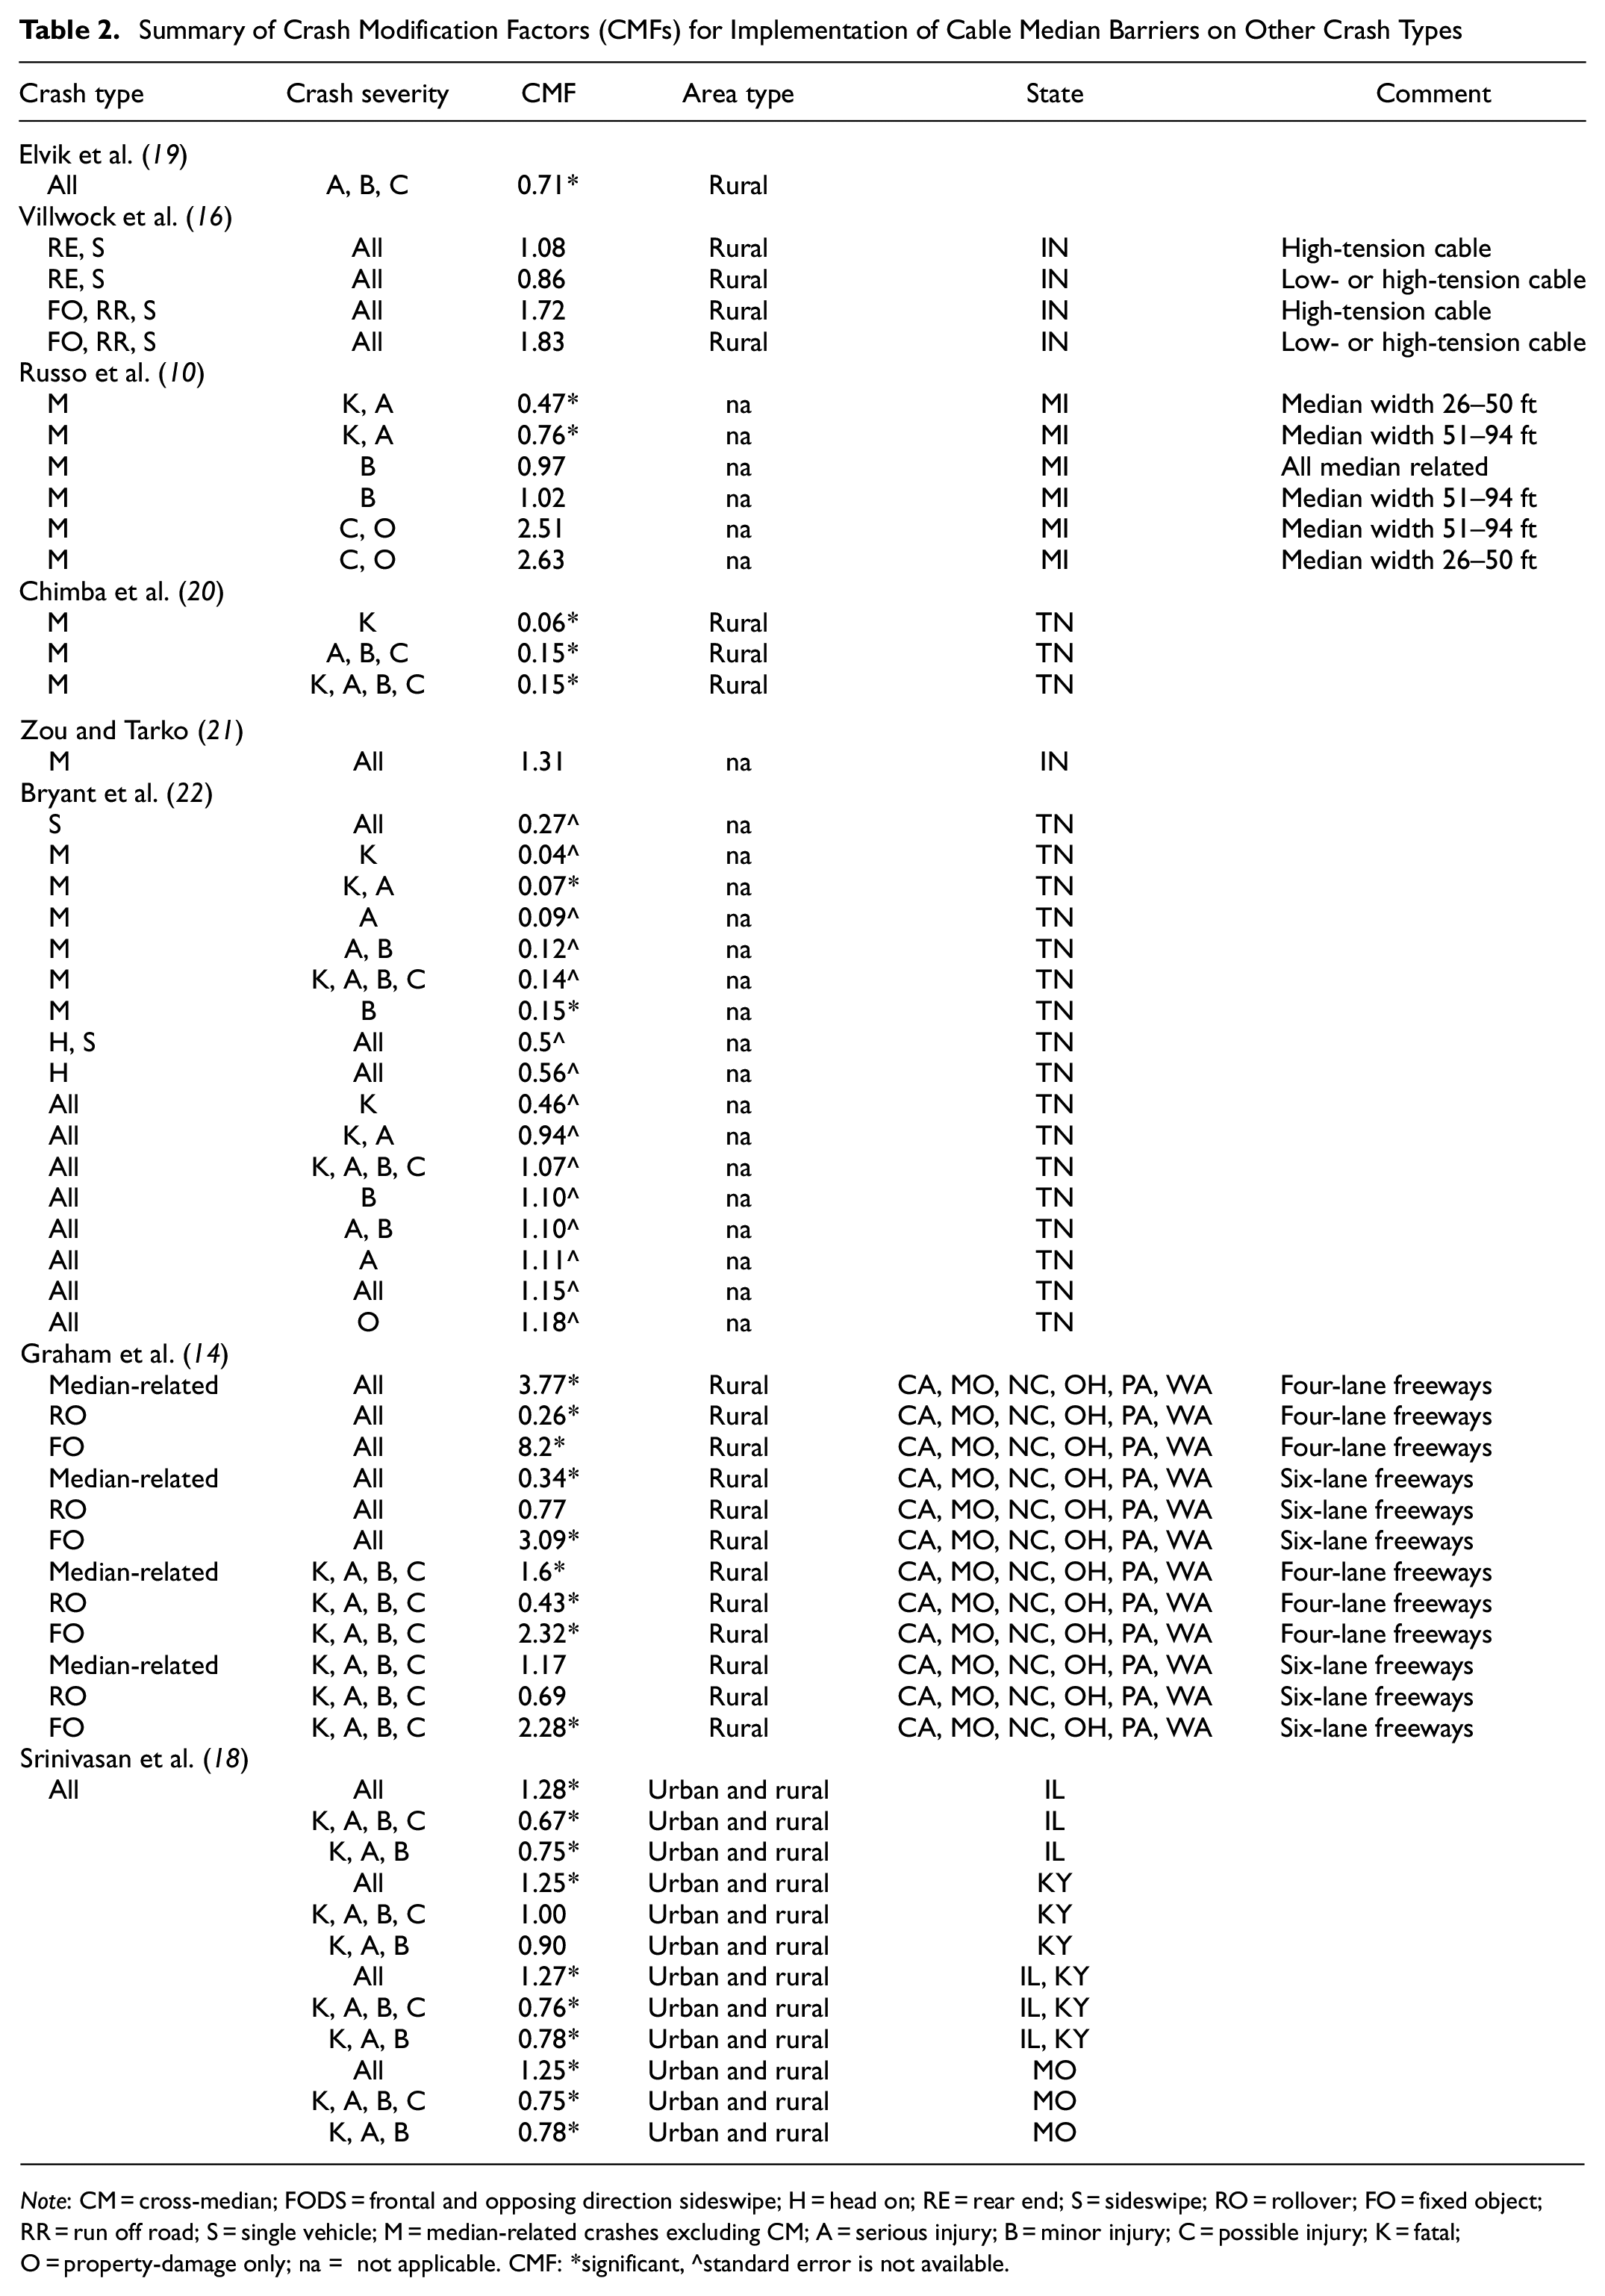
Note: CM = cross-median; FODS = frontal and opposing direction sideswipe; H = head on; RE = rear end; S = sideswipe; RO = rollover; FO = fixed object; RR = run off road; S = single vehicle; M = median-related crashes excluding CM; A = serious injury; B = minor injury; C = possible injury; K = fatal; O = property-damage only; na = not applicable. CMF: *significant, ^standard error is not available.
The objective of this paper is to provide additional evidence of the safety impacts of HTCMBs on freeway segments using data from Pennsylvania that include both rural and urban settings. A suite of CMFs for HTCMBs are estimated using the EB before–after framework, and unique CMFs are estimated for urban and rural area types. Various injury severity levels (total, fatal + injury [FI], fatal + suspected serious injury [KA], PDO) and crash types (all, hit-barrier [HB] and CM) are considered.
The remainder of this paper is organized as follows. The following section describes the EB before–after study methodology that was used. The next section summarizes the data that were available and collected as a part of this study. This is followed by a summary of the CMF estimation results. Finally, concluding remarks are provided.
Methodology
The EB before–after approach ( 11 ) was used to develop CMFs to describe the expected change in crash frequency at freeway segments where HTCMBs were installed. This method is widely accepted as the state-of-the-practice in observational before–after studies of crash data ( 12 ). The proposed EB analysis properly accounts for statistical factors such as regression-to-the-mean, differences in traffic volume, and crash trends (time series effects) between the periods before and after HTCMBs were installed.
The EB before–after process uses the following three steps to predict the change in safety performance expected because of the installation of HTCMBs.
Step 1: Develop safety performance functions (SPFs) to predict what the safety performance of freeway segments with HTCMBs installed would have been had the HTCMBs not been implemented.
Step 2: Estimate what the actual (reported) safety performance should be for treatment sites (i.e., segments where HTCMBs were installed) in the after period if HTCMBs were not installed.
Step 3: Compare the predicted performance obtained from Step 2 with the reported safety performance to determine the safety effect of HTCMBs.
The rest of this section describes these steps in more detail.
Step 1: Prediction of Safety Performance
In this step, a reference group is used to account for the effects of traffic volume changes and temporal effects on safety because of variations in weather, demographics, and crash reporting. This is done through the development of SPFs, which relate the frequency of different crash types and severities to traffic volumes and other safety-influencing factors for a reference group of sites. In this study, the reference group used was freeway segments without any median barriers installed, so that the final CMF would reflect the installation of HTCMBs on a segment without any prior median barrier.
Negative binomial count regression models were used to estimate all freeway segment SPFs in this study. The negative binomial regression model is the most used count regression model in the safety literature as it accounts for the overdispersion commonly observed in crash data. The general functional form of the negative binomial regression model is as follows:

where
The mean-variance relationship for the negative binomial distribution is as follows:

where
The more general form of the SPFs developed in this study—consistent with Equation 1—is as follows:
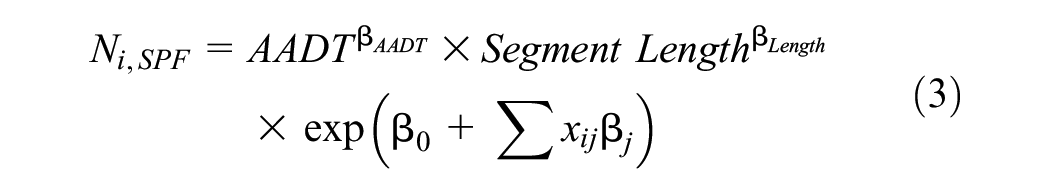
where
Step 2: Before–After Analysis with Empirical Bayes
In the EB method, observed and predicted crash frequencies obtained from a SPF are combined to produce an expected crash frequency at each site as follows:

where
The weight

Equations 3–5 are used to determine
The SPF is then used to calculate the predicted crash frequency,


where
The EB-adjusted value obtained from Equation 6 provides the expected crash frequency if no treatment was applied. This expected crash frequency was then compared with the reported crash frequency after the treatment was applied to assess the safety effects of the HTCMB.
Step 3: Compare Predicted and Actual Safety Performance
An unbiased estimate of the safety effect
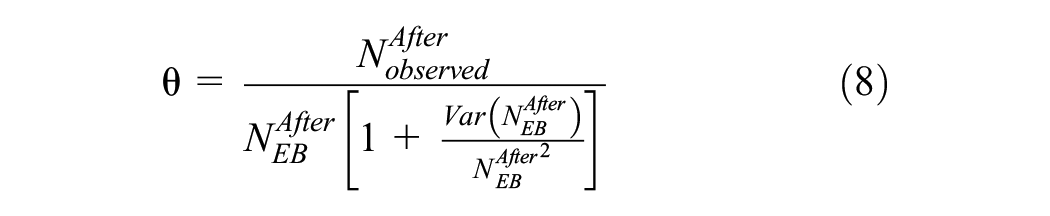
where
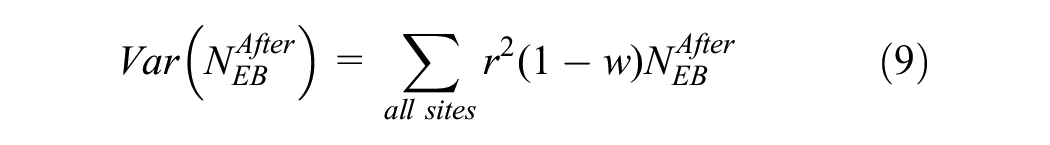
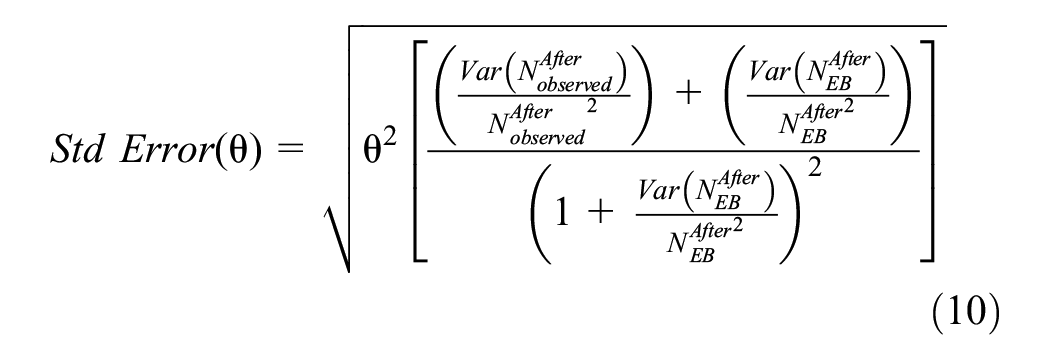
Finally, the standard error associated with this safety effect estimate was computed using Equations 10 and 11:

Data
An inventory of locations within Pennsylvania with HTCMBs was provided by the Pennsylvania Department of Transportation (PennDOT) for the purpose of this study. The inventory consisted of the following information for each site with HTCMBs within Pennsylvania.
Location of the HTCMBs, including: ○ county; ○ state route number; ○ beginning segment/offset location; ○ ending segment/offset location.
Installation date.
Installation type.
The set of all freeway segments in Pennsylvania was obtained from a previous study for use in this study ( 23 ). The database included the following information for each PennDOT-defined freeway segment in Pennsylvania:
county;
roadway name;
state route number;
segment number;
length;
number of lanes;
area type;
length and radius of curves within the segment;
pavement width;
inside and outside shoulder widths;
median width.
The KAI freeway database was originally used for network screening purposes and applied SPFs from the Highway Safety Manual (HSM) to estimate crash frequency for all Pennsylvania freeways. However, the freeway SPFs in the HSM include both freeway travel directions as a single “segment” for analysis. Keeping this definition might result in imbalances in traffic volumes, ramp presence, or other safety-influencing features among the opposing travel directions. Further, PennDOT defines and uses unique segments for each direction on divided roadway facilities, such as freeways. Thus, the research team split all bidirectional segments in the KAI database into two travel directions based on the PennDOT-defined segments; see Figure 1 for an illustration. Note that in most cases, this was done by using an even-numbered segment number for one travel direction and that number plus one for the other travel direction. The result is that the mileage of segments used in the analysis essentially represents twice the number of HTCMBs available, since now two roadway segments are influenced by a given HTCMB installation.
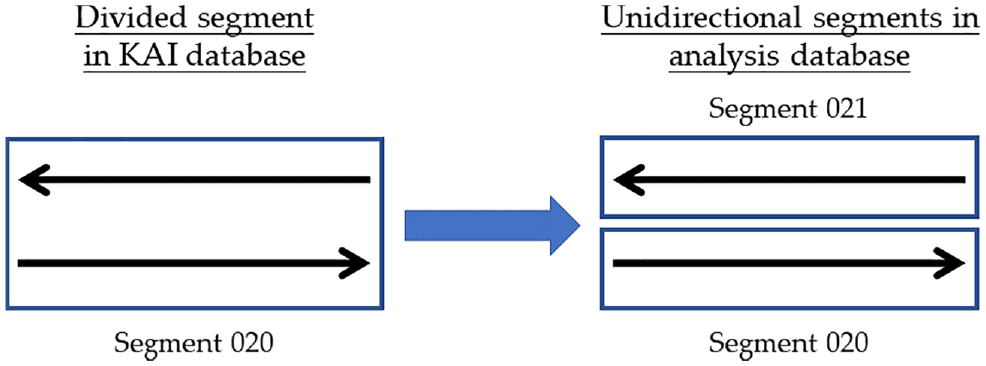
Illustration of conversion of bidirectional to unidirectional freeway segmentation.
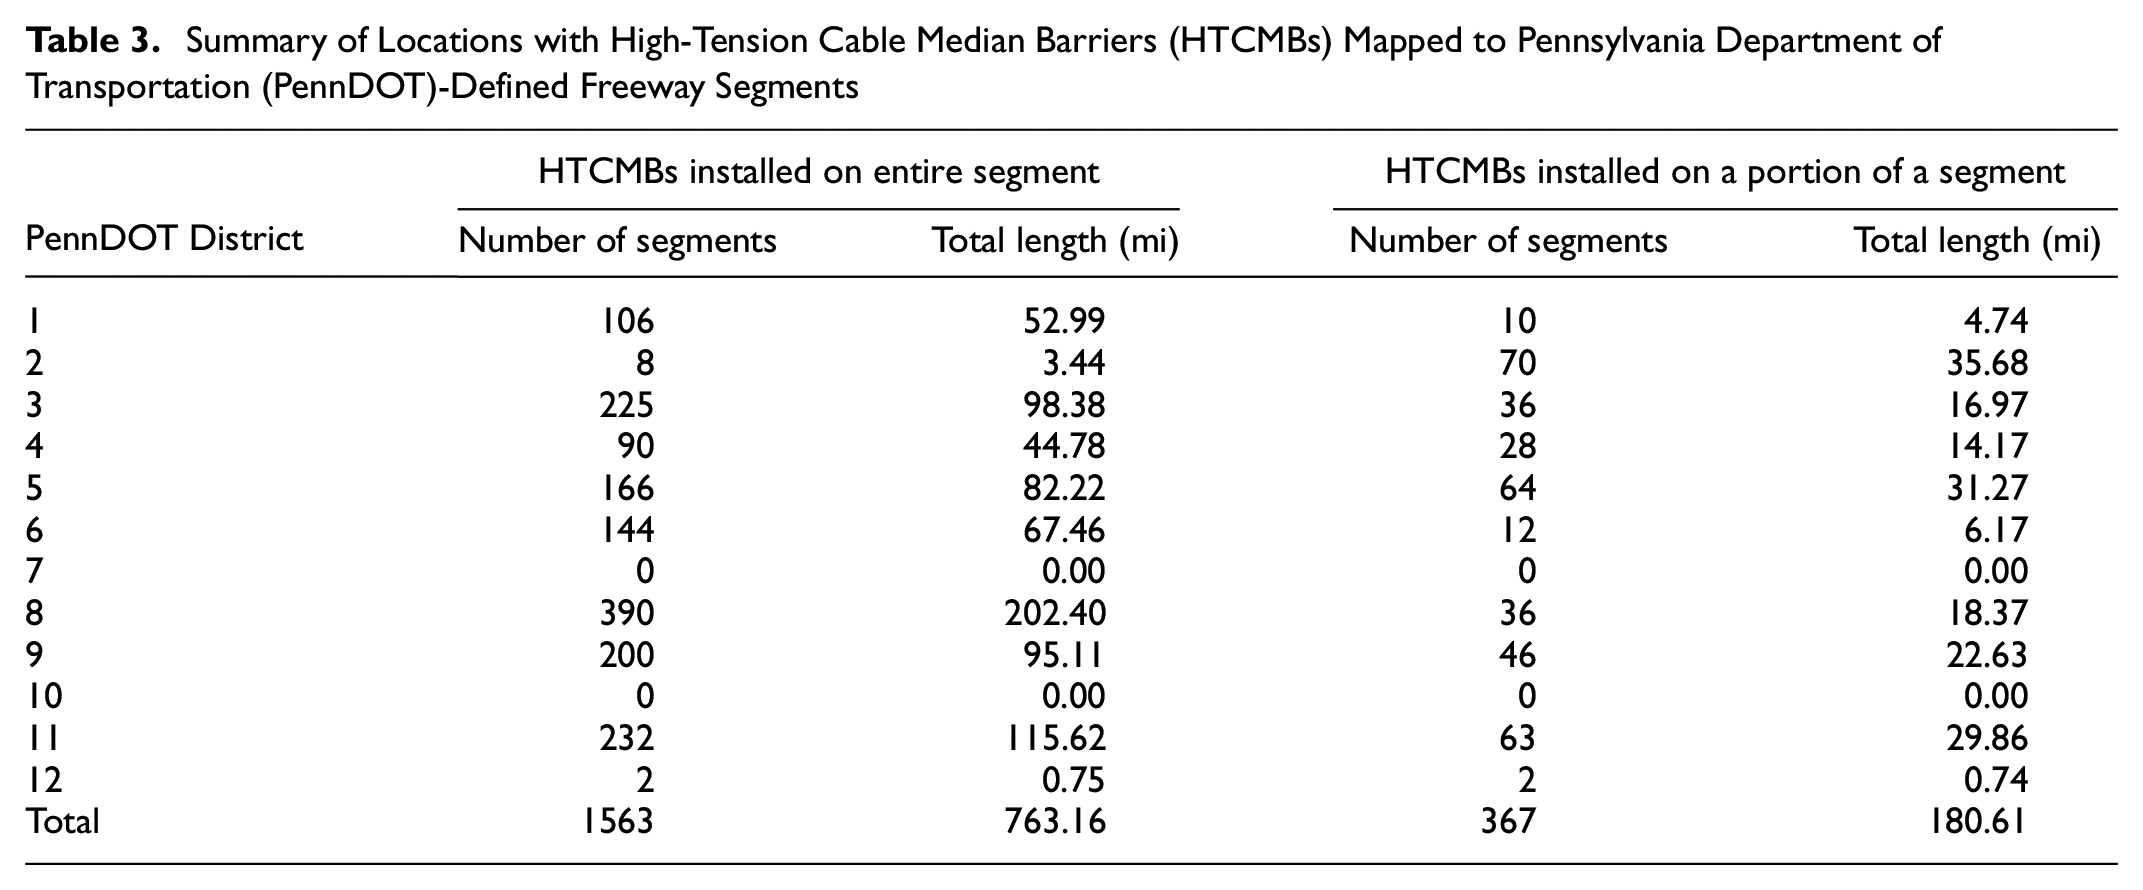
The research team matched the HTCMB installation locations provided by PennDOT to these freeway segments using the PennDOT roadway management system (RMS) linear referencing system information, specifically by matching county, state route, and segment numbers. In most cases, the starting/ending point of the HTCMBs did not exactly align with the segments defined by PennDOT. This resulted in some segments having HTCMBs installed on just a portion of its length. This partial installation of HTCMBs within a segment presents an issue, as crashes that occur on that segment may or may not be influenced by the presence of the HTCMB. For example, a segment may only have HTCMBs installed within a small fraction of its length but be considered as partial; in such a case, the HTCMBs would not be expected to have any significant safety benefits. The inclusion of these partial segments might negatively influence the assessment of the safety performance of HTCMBs by “watering down” their effects. For this reason, segments with partial installation of HTCMBs within the segment boundary were removed for further consideration in the analysis. This represented a total of 180.61 mi of roadway (about 19% of the total HTCMB installation length).
A summary of the locations with HTCMBs mapped to unidirectional segments converted from the original database is provided in Table 3. As shown, approximately 763 mi of PennDOT-defined segments have HTCMBs installed along their full length. This was the sample size of segments with HTCMBs available for this study. Table 4 provides a summary of these segments based on the installation year of the HTCMBs. While 2019 was the year with the largest number of HTCMBs installed, the majority of HTCMBs were installed between 2010 and 2018 (72% of total mileage). Using crash data from 2007–2021 thus provides at least three years of crash history in the before and after periods for most sites.
Summary of Locations with High-Tension Cable Median Barriers (HTCMBs) Mapped to Pennsylvania Department of Transportation (PennDOT)-Defined Freeway Segments
Summary of Locations with High-Tension Cable Median Barriers on Full Pennsylvania Department of Transportation Segments by Installation Date
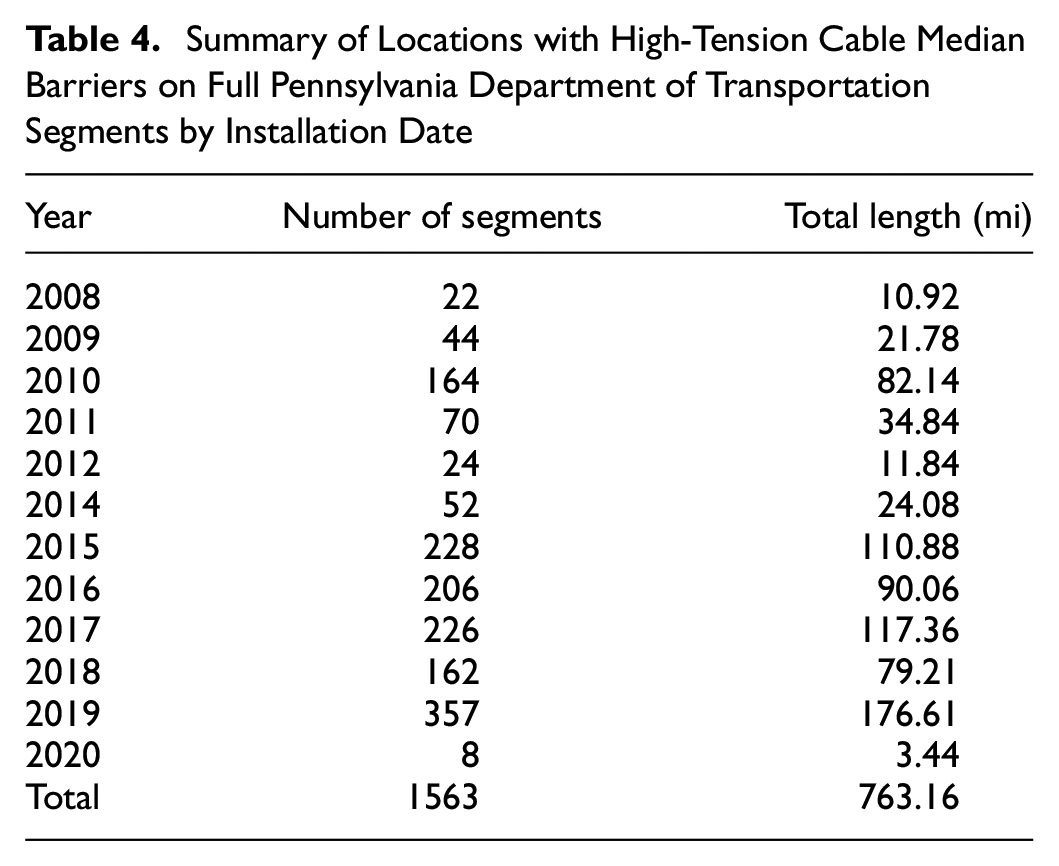
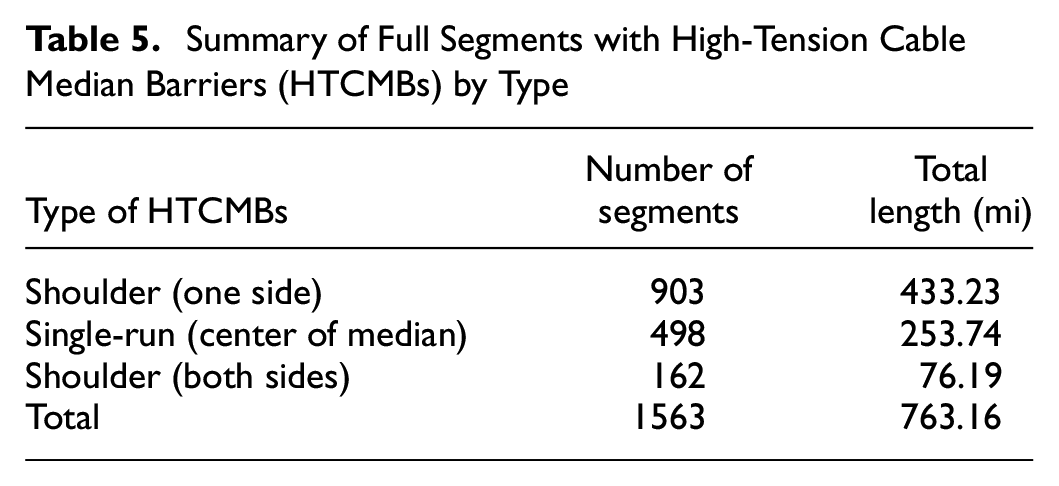
Table 5 provides a summary of locations with HTCMBs on unidirectional freeway segments based on the type of HTCMB installed. As shown, the majority of sites in Pennsylvania (56%) have HTCMBs installed adjacent to one inside shoulder of the median. The remaining installations are single-run HTCMBs installed in the center of the median (33%) or installed on both sides on the median, adjacent to the inside shoulder in opposing travel directions (21%).
Summary of Full Segments with High-Tension Cable Median Barriers (HTCMBs) by Type
Additional data elements were collected to supplement existing data using the PennDOT video photolog system ( 24 ). To balance between data completeness and accuracy, these data elements were collected in a categorical manner as follows.
Median barrier presence: for each segment, the presence of a median barrier within the segment was collected using the following categories: ○ median barrier exists for the entire segment (more than 90% of its length); ○ median barrier exists for most of the segment (between 50% and 90% of its length); ○ median barrier exists for some of the segment (less than 50% of its length); ○ median barrier exists for none of the segment (not observed on the segment).
Ramp locations: the number of on-ramps and the number of off-ramps within the segment.
Rumble strips: inside and outside shoulder rumble strip presence using categories that were similar to those for median barrier presence.
Roadside barrier: barriers on the outside (right-hand side) of the travel direction using categories similar to median barrier presence.
Finally, crash data from the years 2007–2021, inclusive, were obtained from the Pennsylvania Crash Information Tool (PCIT) website (https://crashinfo.penndot.pa.gov/PCIT/queryTool.html). These data included the following:
crash location, defined using the PennDOT linear referencing system, via county, state route number, segment number, and offset;
crash date;
collision type;
injury severity level.
Several of the crash data elements were used to identify crashes occurring on freeway segments of interest for the present study. For example, crashes in construction work zones were not included in the analysis files, as these conditions are temporary. Crashes were assigned to individual unidirectional roadway segments in the analysis database based on the location of the crash (county, route, segment). Crash counts for each roadway segment were then generated for each analysis year for various crash types that were considered in this analysis. These included the following:
all crashes;
all FI crashes;
all KA crashes;
all PDO crashes;
HB crashes (including both median and roadside barrier).
Finally, PennDOT provided a list of crashes that were specifically identified as CM crashes, which is the crash type expected to be mitigated with the installation of HTCMBs. These were identified by reviewing crash reports for all median crashes to determine which were specifically CM crashes. The crashes were then assigned to the unidirectional segment that the crash originated from. These CM crashes were included in the analysis database in several categories, including the following:
all CM crashes;
fatal + injury CM crashes;
KA CM crashes.
Table 6 provides summary statistics for all sites with HTCMBs installed. Note only urban sites are shown for brevity.
Summary of Sites with High-Tension Cable Median Barrier (Urban Sites) Safety Performance Functions
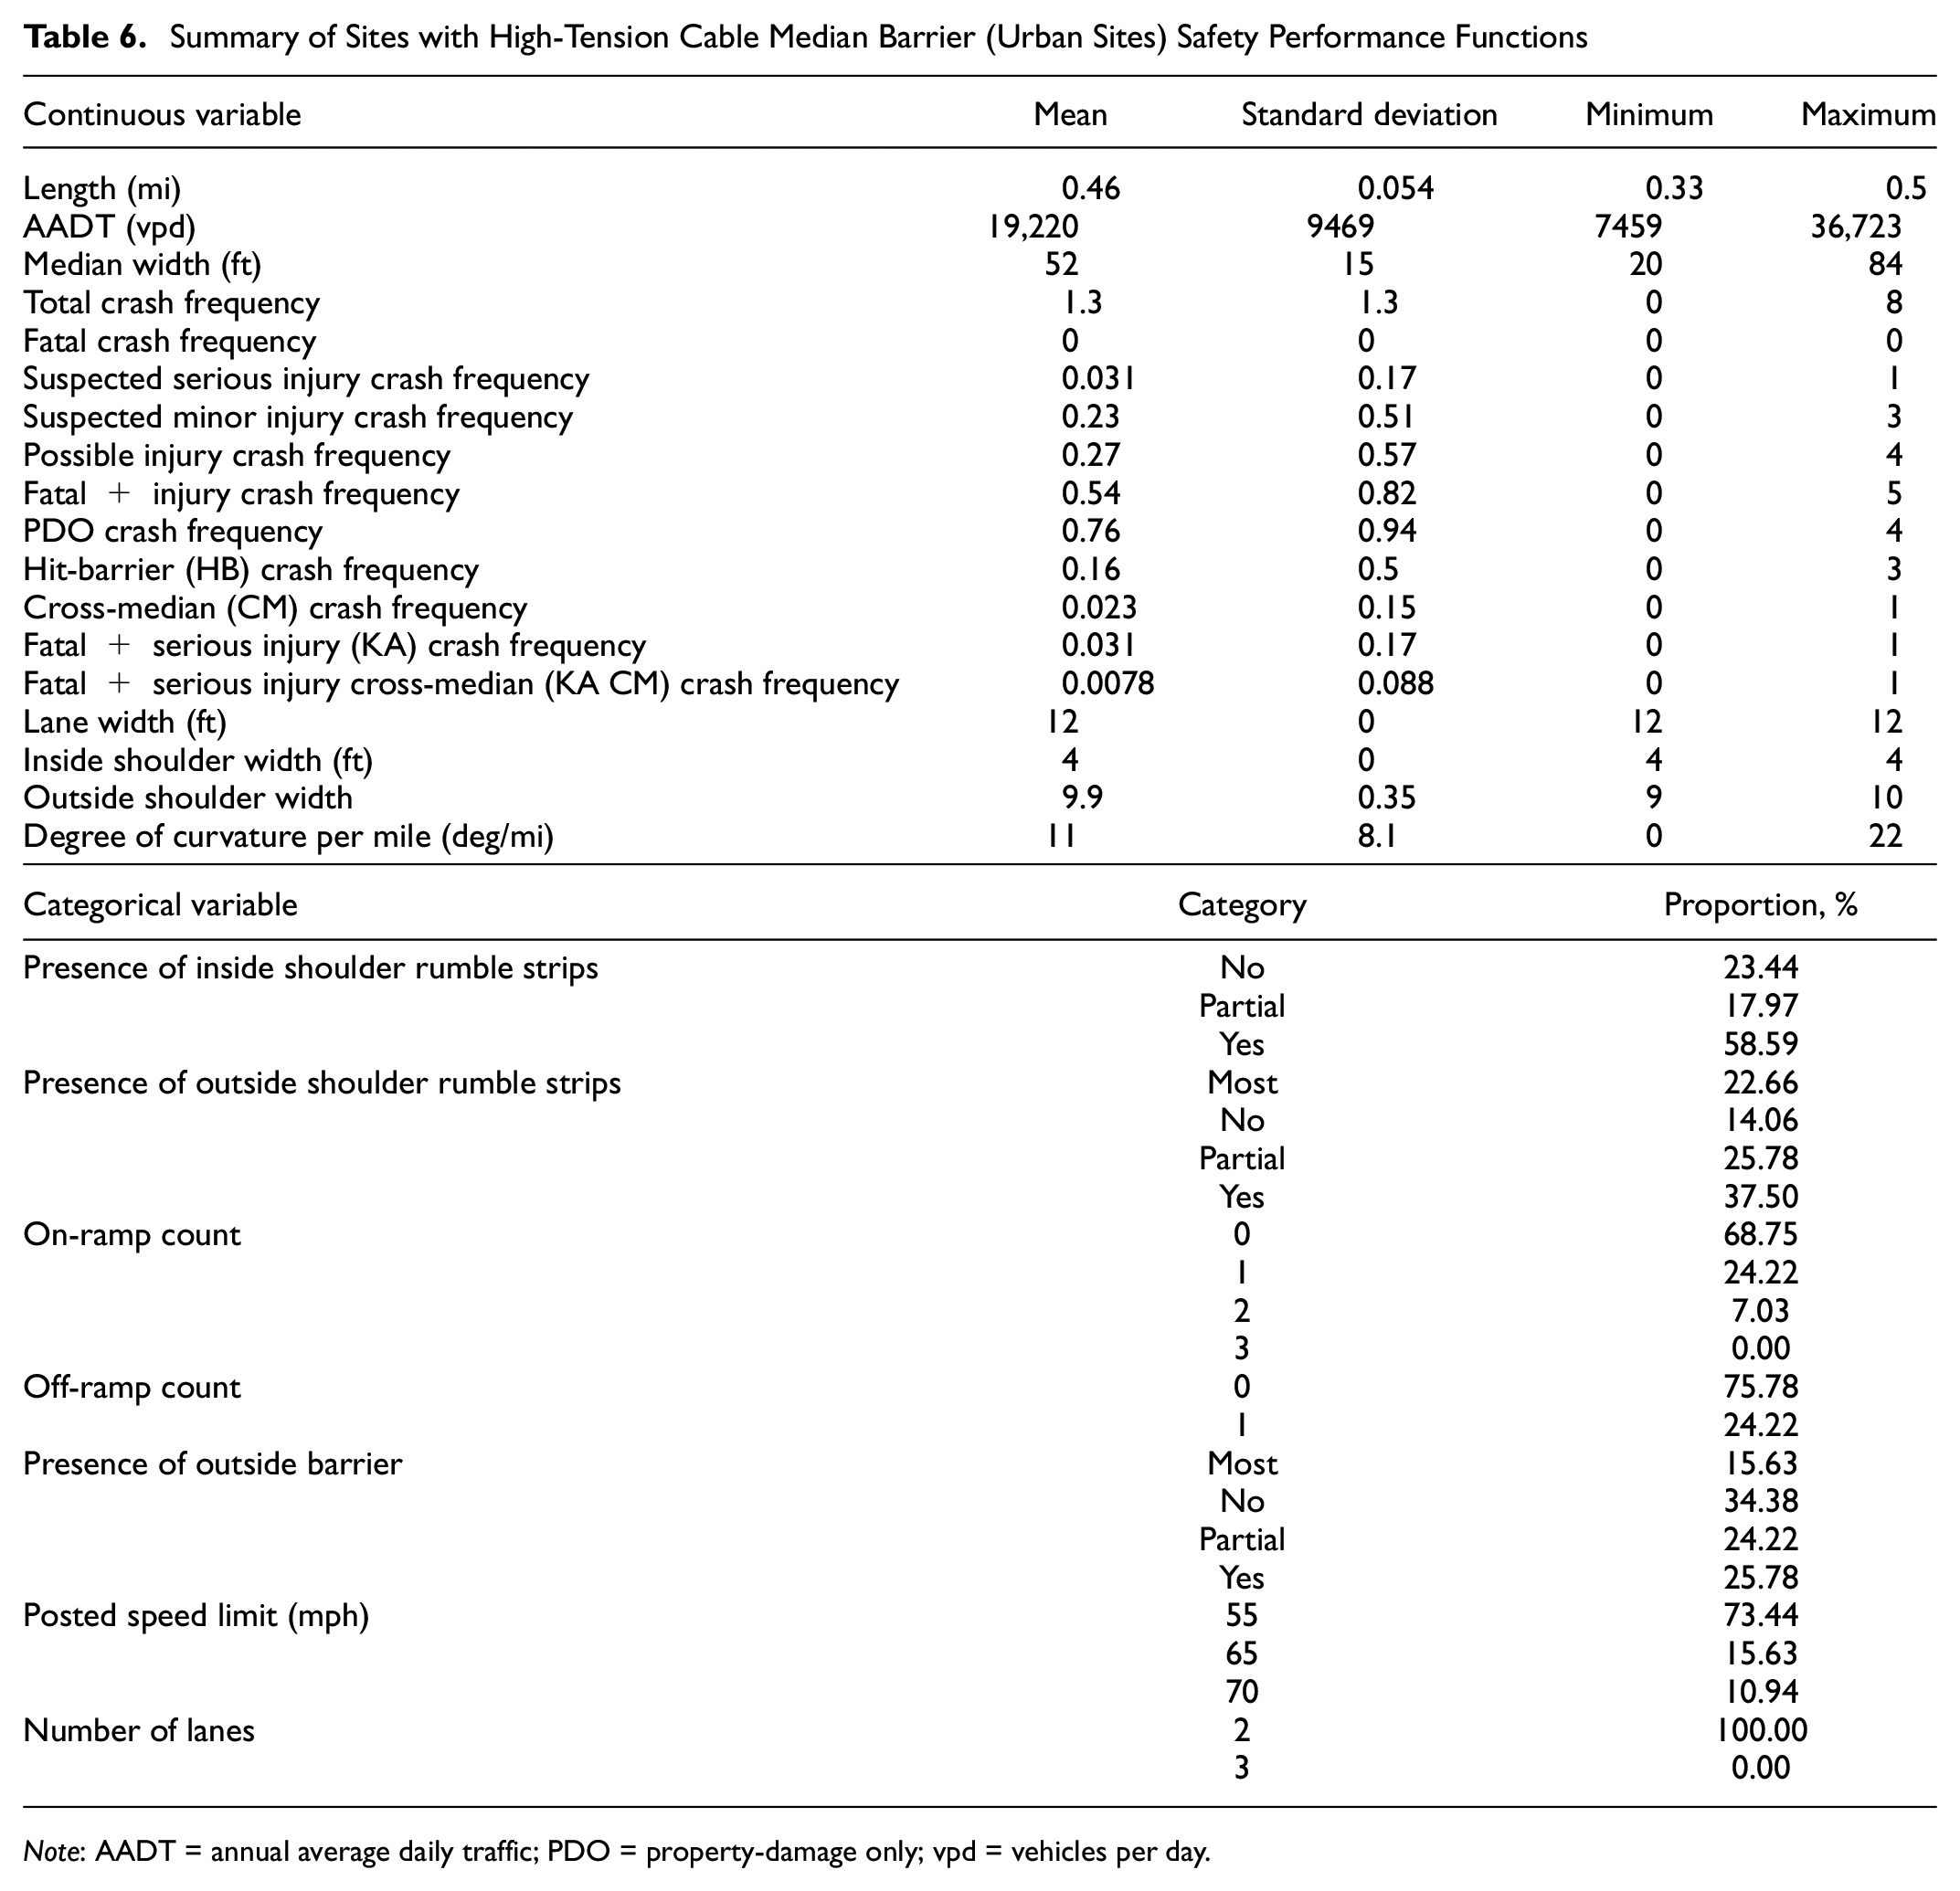
Note: AADT = annual average daily traffic; PDO = property-damage only; vpd = vehicles per day.
Results
This section describes the specific steps taken to estimate the CMFs developed using the EB before–after methodology described in the previous section. The remainder of this section is divided into several sections that discuss each of the steps in the EB method.
SPF Development
As described in Step 1 of the EB before–after process, SPFs are required to predict the safety performance of freeway segments at which HTCMBs are not installed. Unique SPFs were developed using observed crash data for this effort. The set of freeway segments with no median barrier installed were used as a reference group to develop these SPFs. In doing so, the resulting CMFs can describe the change in safety performance when HTCMBs were installed at a location without any existing median barrier present. A total of 836.75 mi (1717 segments) of freeways with no median barrier were available for SPF development. Each of these segments had 15 years of data available (2007–2021, inclusive). Of this, 666.33 mi (1363 segments) represented rural freeways and 170.42 mi (354 segments) represented urban freeways. A summary of the urban freeway database used for SPF development is provided in Table 7 since this area type is not represented in the current research literature about the safety performance of HTCMBs; however, details on the rural database is provided by Gayah et al. ( 25 ).
Summary of Data Used for Development of Urban Freeway Safety Performance Functions
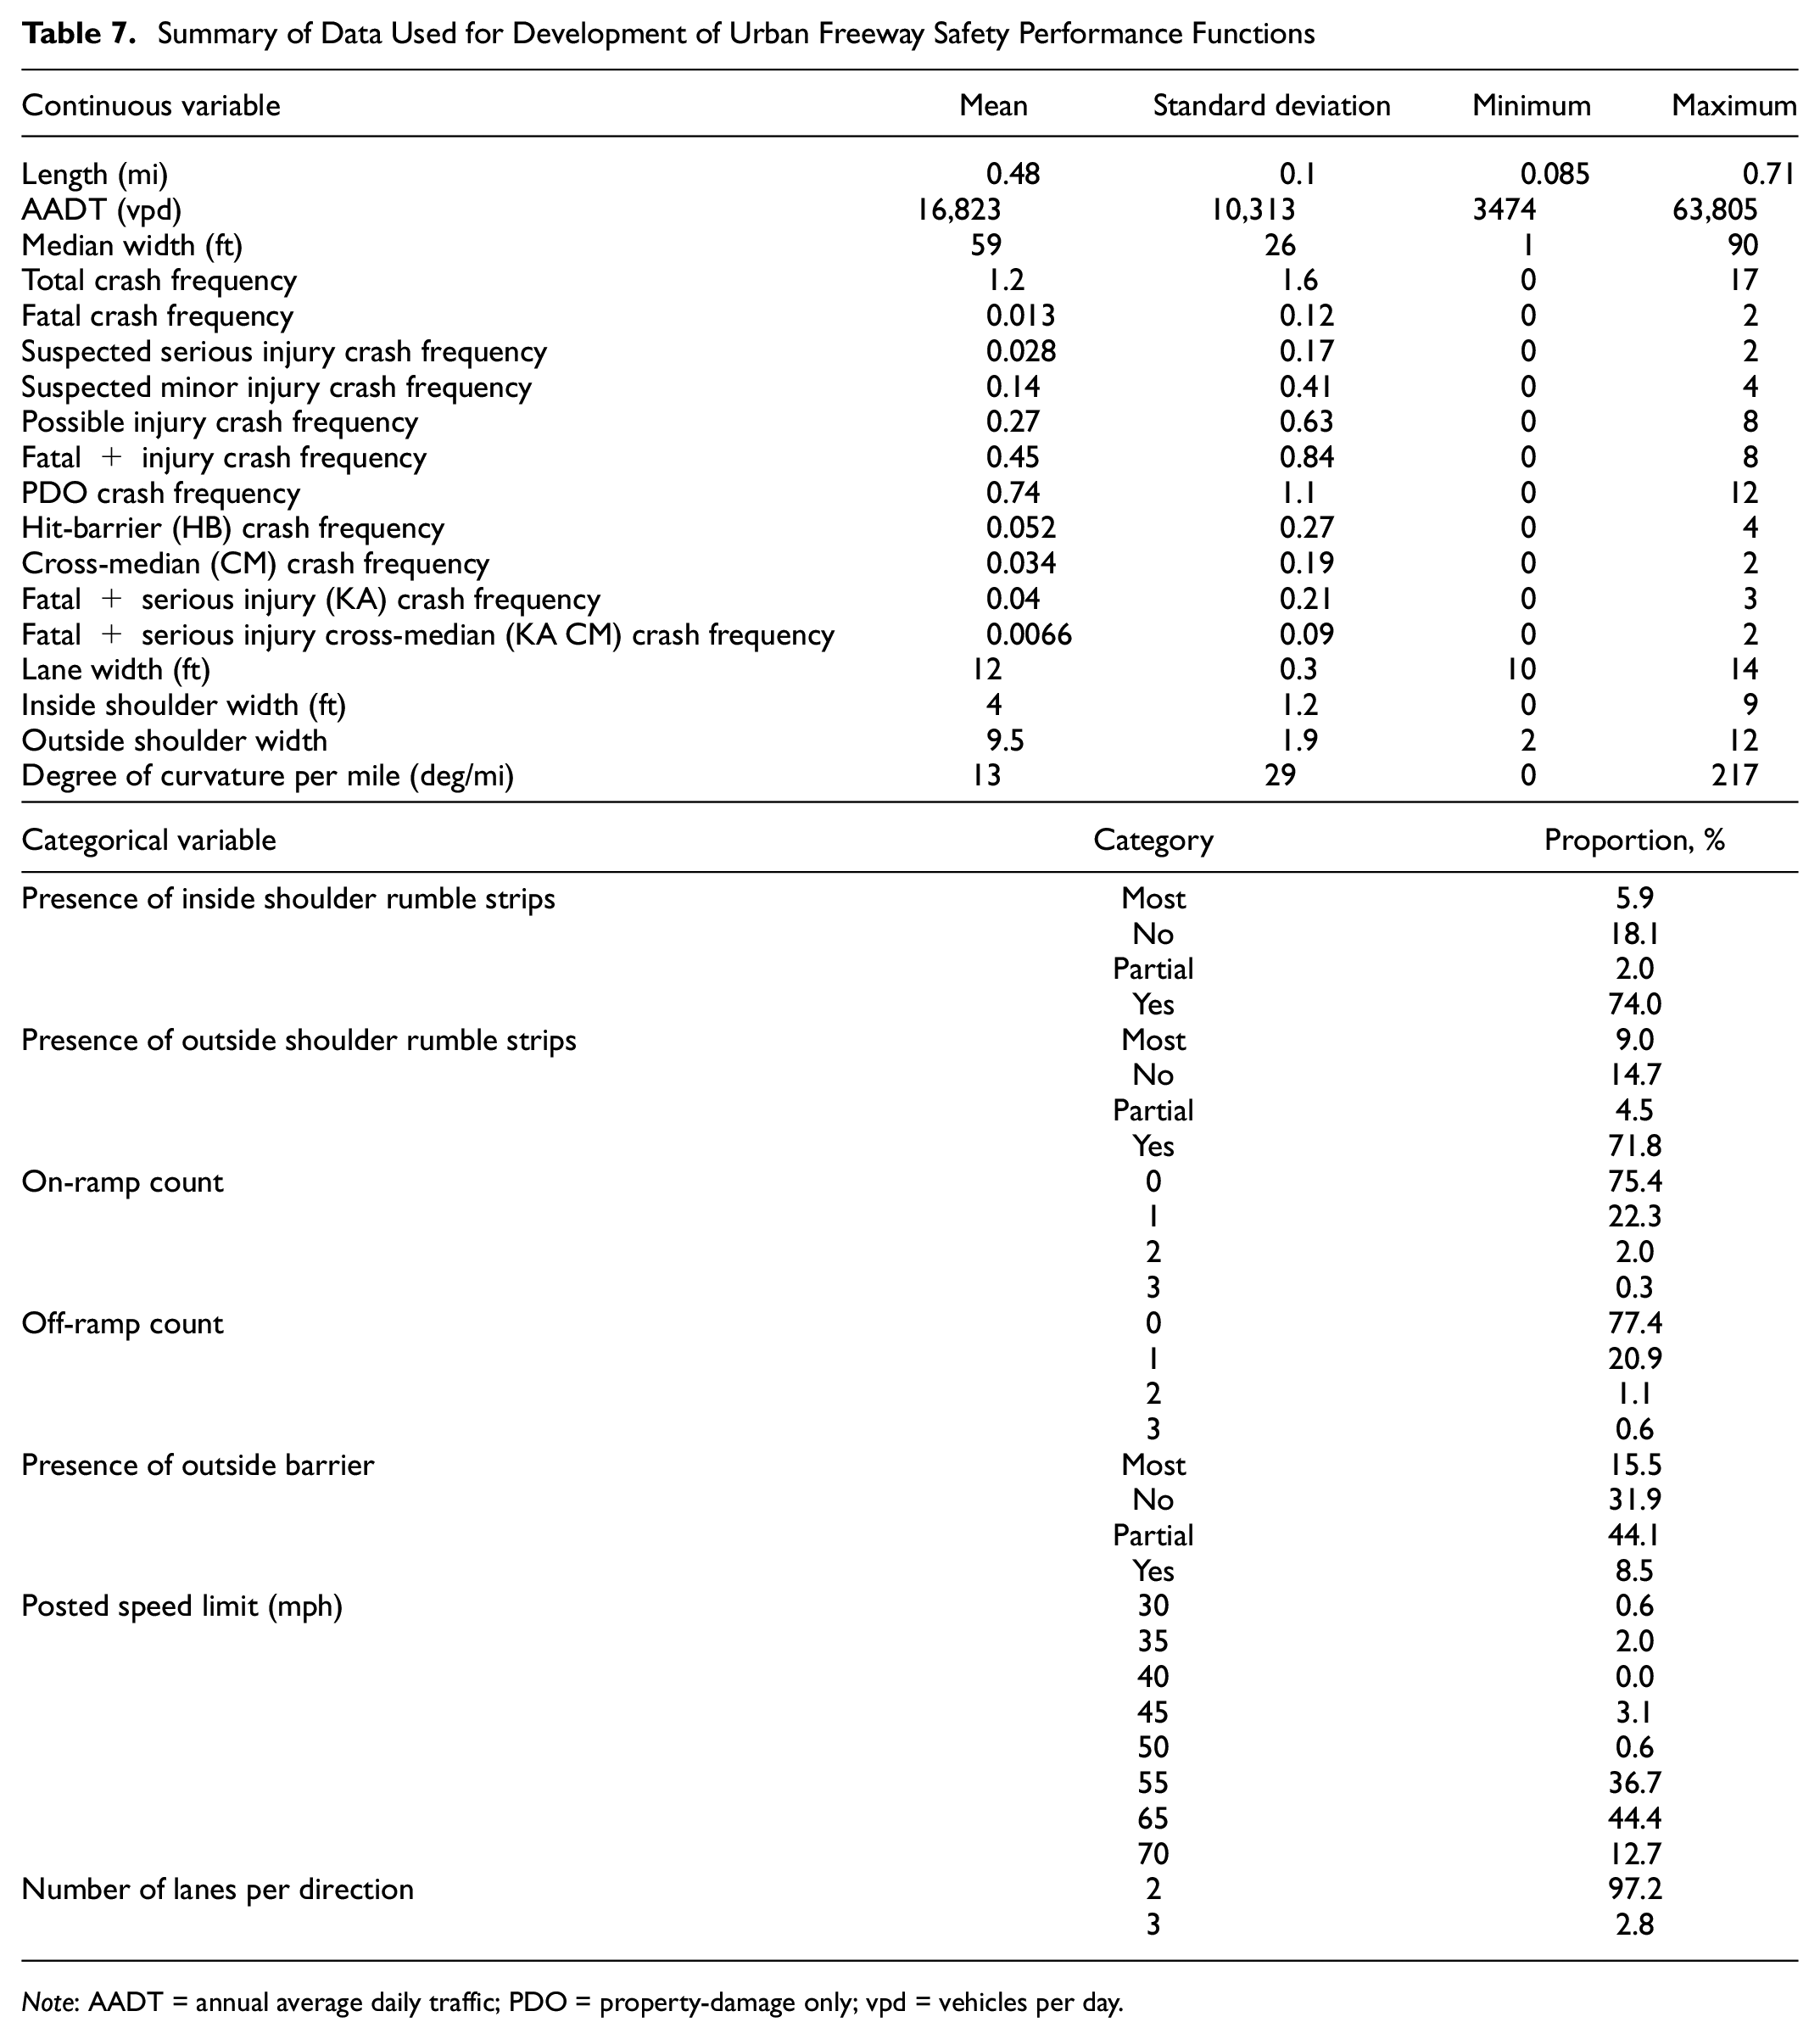
Note: AADT = annual average daily traffic; PDO = property-damage only; vpd = vehicles per day.
SPFs were developed separately for rural and urban freeway segments because of the differences in safety performance between these two freeway types. For each of the rural and urban settings, SPFs were developed for the following crash types:
all crashes;
FI crashes;
KA crashes;
PDO crashes;
HB crashes;
CM crashes;
KA CM crashes.
These SPFs were developed using PennDOT-defined roadway segments as the unit of analysis. Thus, individual segments were not further subdivided into basic freeway segments or speed change lanes as is done in the HSM ( 26 ). Instead, the existence of on- and off-ramps was incorporated into the SPFs as indicator variables. While this is less detailed than the HSM method, this provided the best balance between data collection and accuracy from a safety prediction standpoint. Note also that the SPFs included indicator variables to account for each year in the analysis period (using 2007 as the base condition). This was done to account for changes in safety performance over time, since the analysis period is long (2007–2021). Also, variables were tested for correlation and significantly correlated variables were not included in the model.
An example SPF for total crash frequency on urban freeway segments is provided in Table 8. Again, the urban SPF is specifically shown here since CMFs have not yet been developed for this area type in the literature. However, the set of all urban and rural SPFs can be found in Gayah et al. ( 25 ). The resulting SPFs seem reasonable and have coefficient estimates that align with engineering expectations. For example, Table 8 shows that total crash frequency on urban freeway segments is expected to increase with traffic volume, segment length, the presence of outside barriers, lack of shoulder rumble strips, narrow shoulders, lower speed limits, presence of on- and off-ramps within the segment, and increased roadway curvature. Note that the coefficient associated with segment length is statistically different from 1, which would mean crash frequency is not proportional to segment length. This is likely caused by segment length being correlated with other unobserved variables, partially because of how PennDOT defines these segments. This is not atypical; see, for example, the discussion by Hauer ( 27 ). Since this SPF is being used for predictive as opposed to explanatory purposes, this coefficient was maintained in the SPF. The finding that an expected increase in crash frequency is associated with lower posted speeds limits may seem counter-intuitive but represents the complex relationship between speeds and crash frequency. Similar findings were observed by Montella et al. ( 28 ).
Safety Performance Function Developed for Total Crash Frequency on Urban Freeway Segments
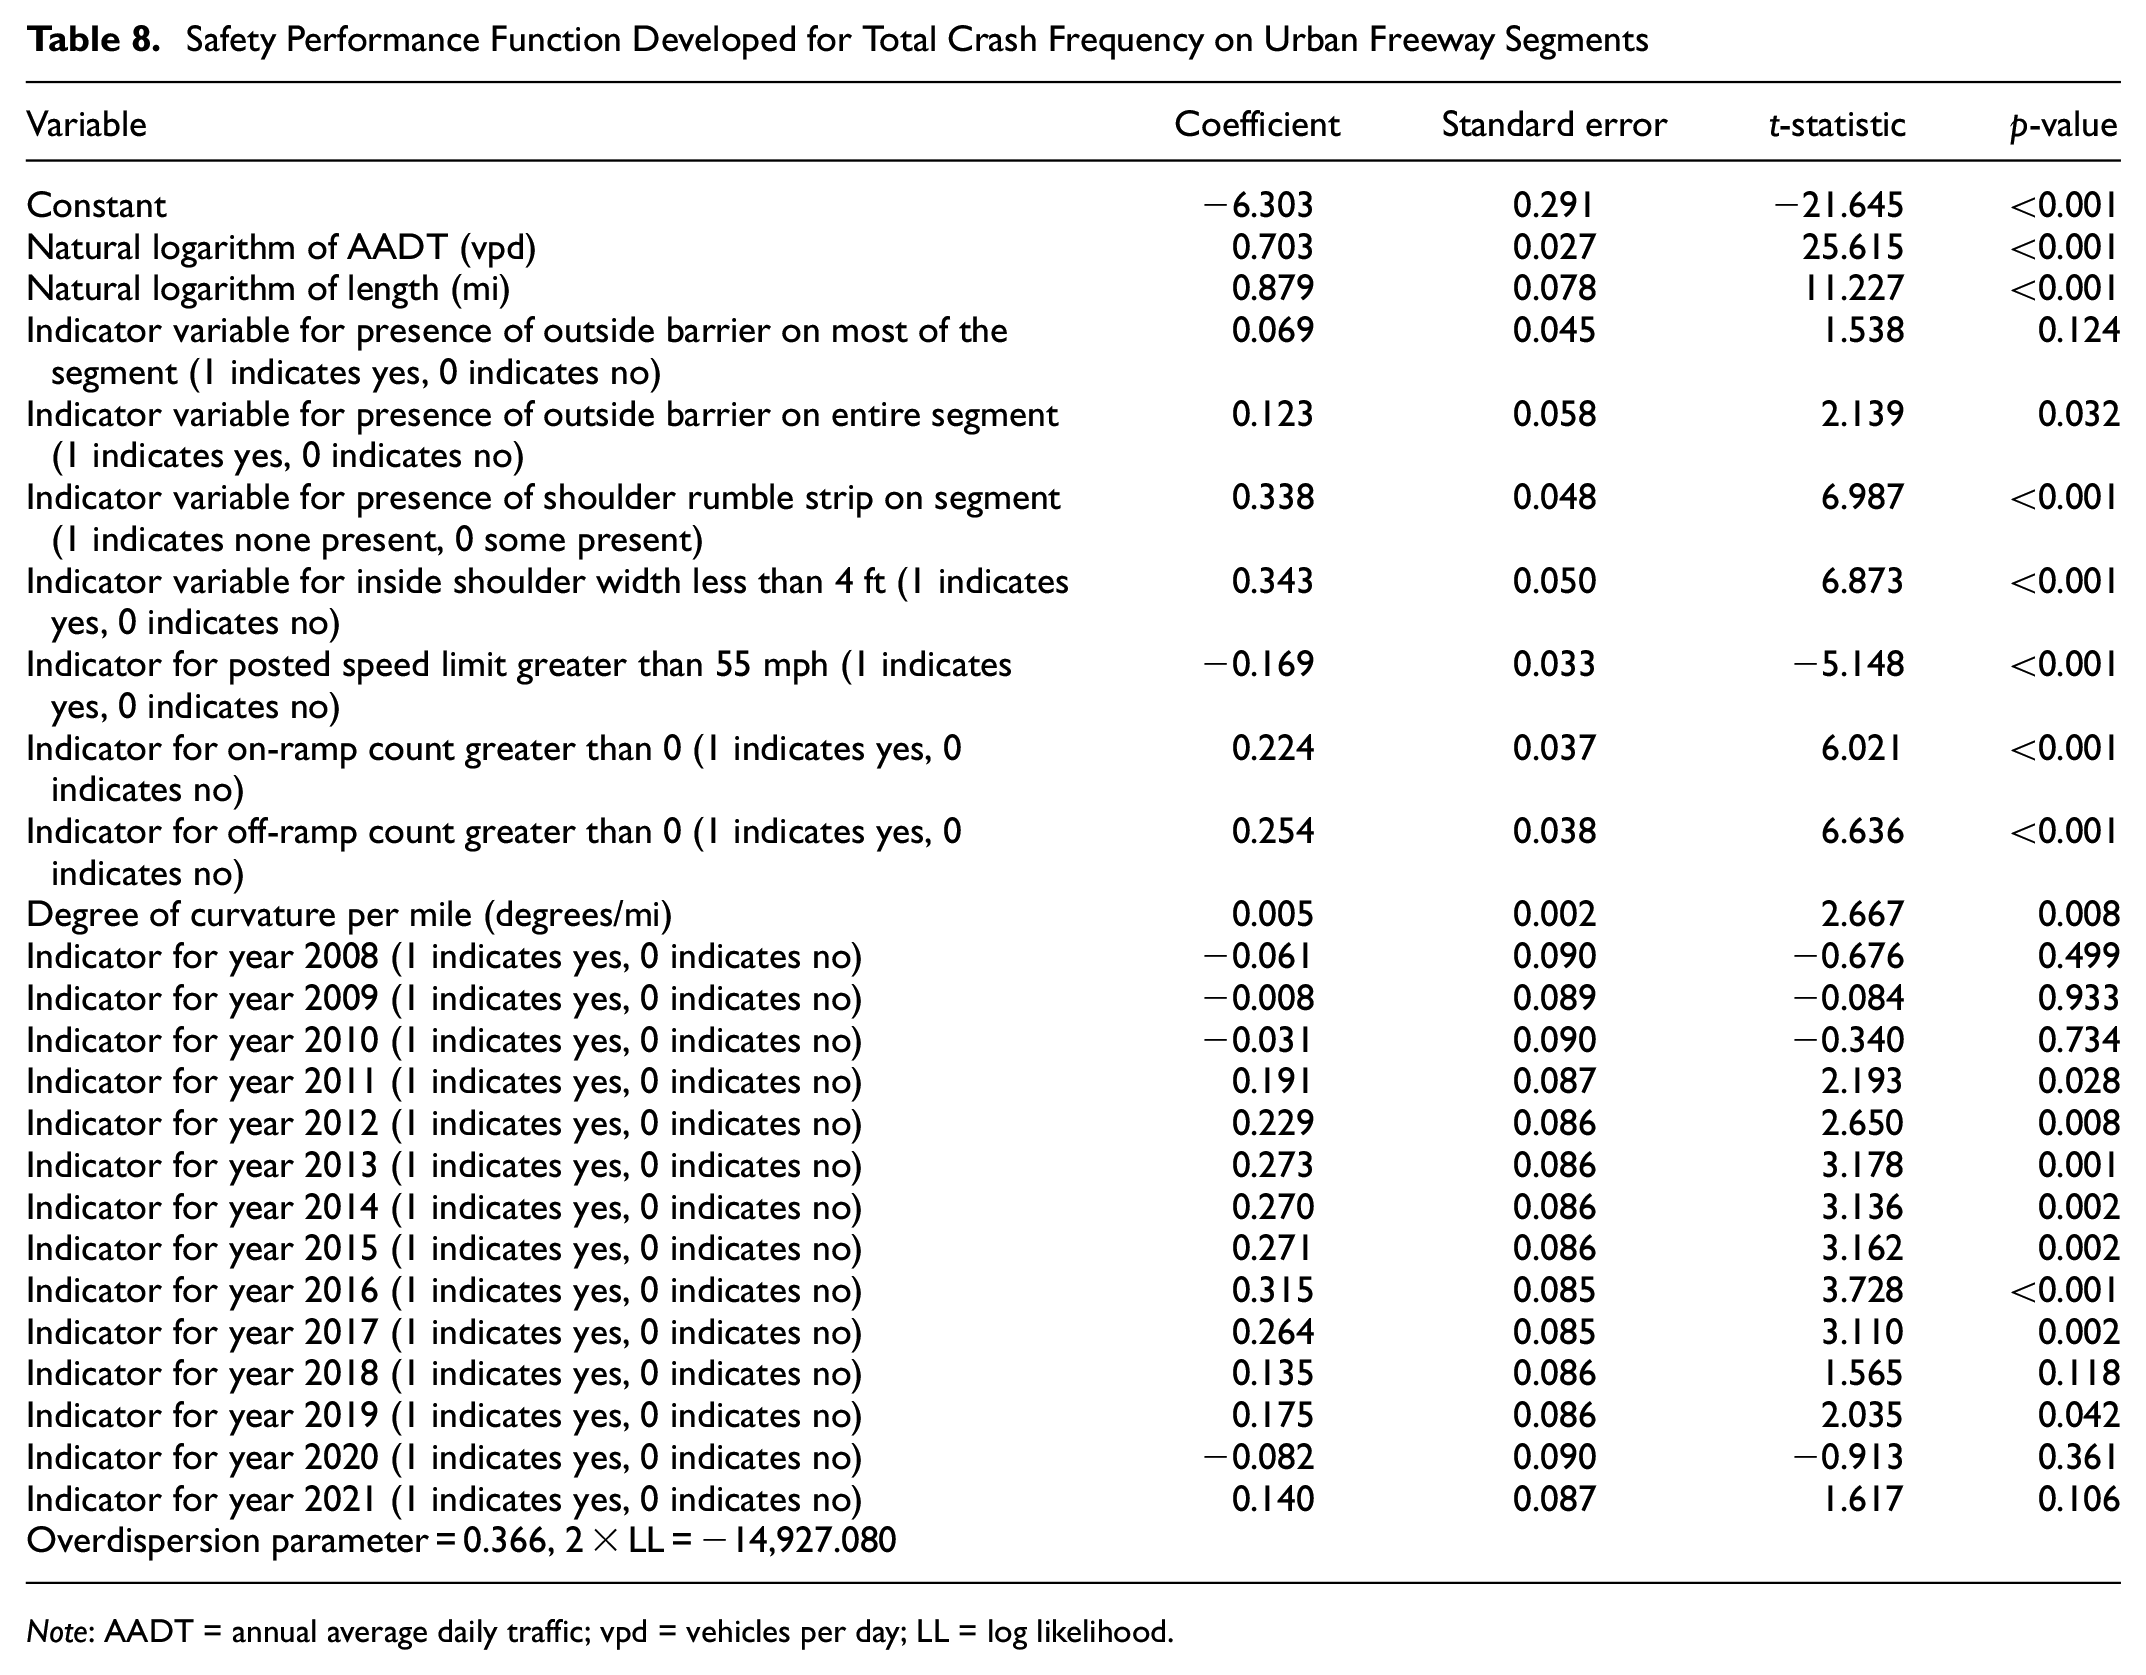
Note: AADT = annual average daily traffic; vpd = vehicles per day; LL = log likelihood.
Cumulative residual (CURE) plots were used to verify that the SPFs have a good fit to the observed data; see the example in Figure 2. The CURE plot compared to traffic volume shows almost all observations within the 95% CI, while the CURE plot compared to predicted traffic volume has 17% of observations falling outside this CI. However, the overall fit seems strong given the small overdispersion parameter (0.366) and the result of a chi-square test using the ratio of log-likelihood for the estimated model and a null model is statistically significant at the 99.9% confidence level.
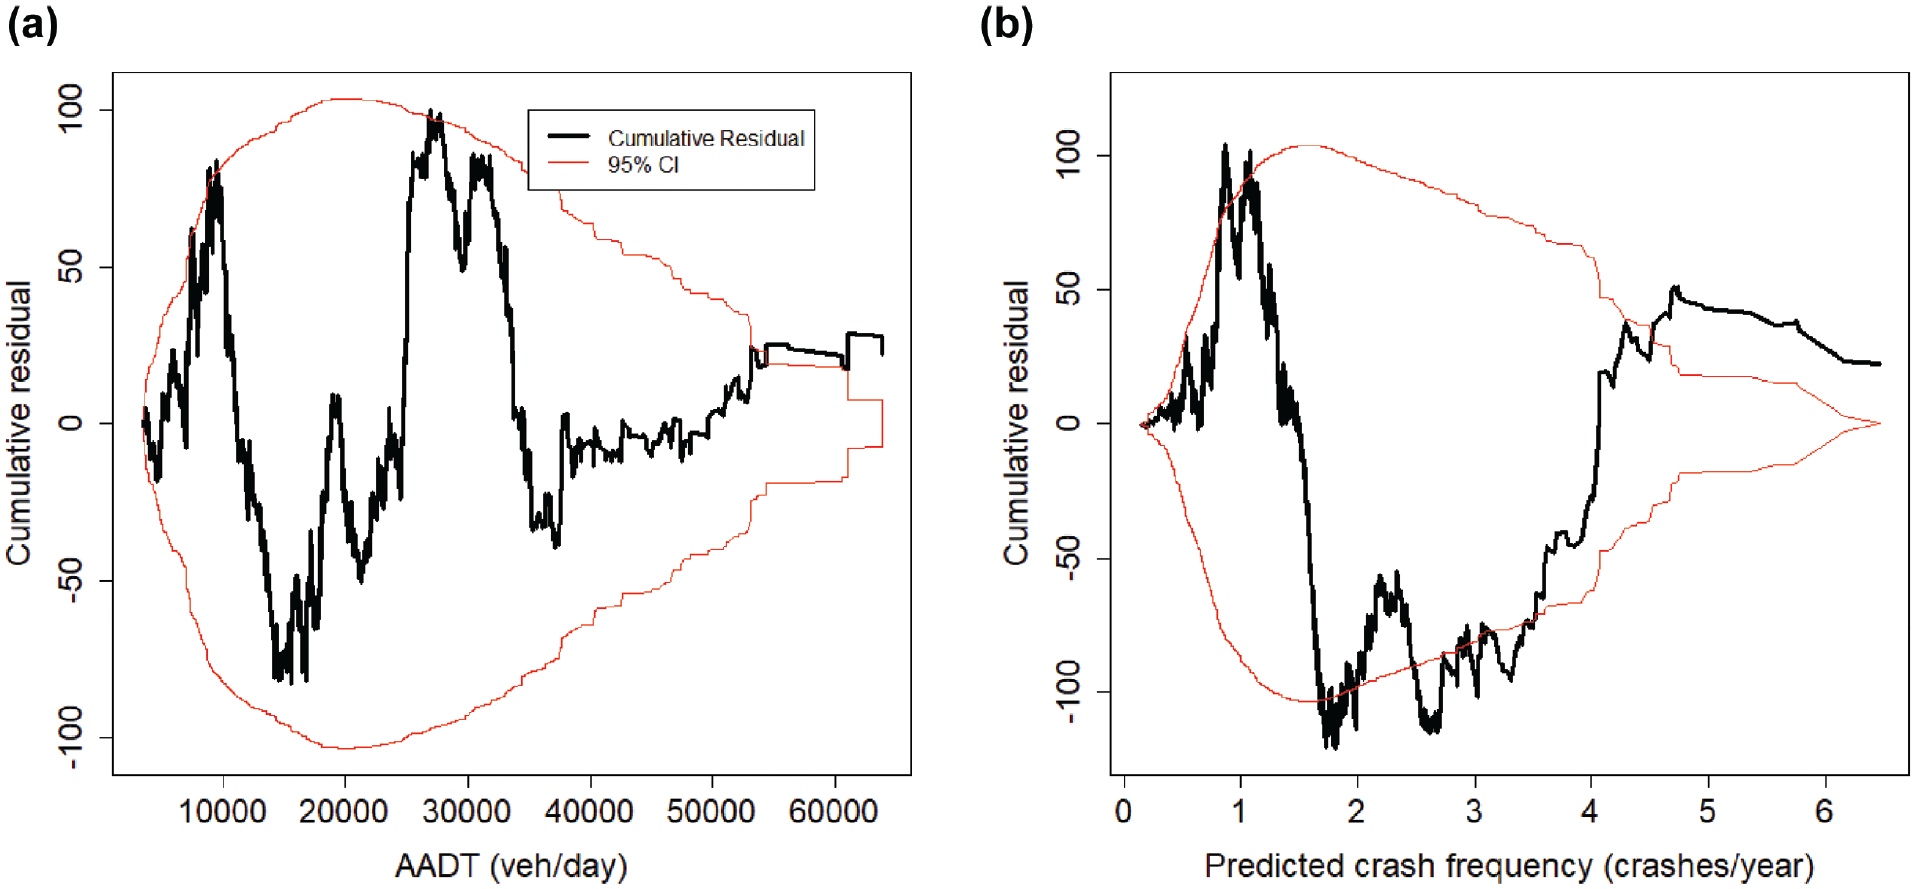
Cumulative residual plots for total crash frequency on urban freeway segment safety performance function: (a) versus traffic volume; (b) versus predicted crash frequency.
Comparison of Predicted and Actual Safety Performance
Table 9 provides a summary of the CMFs estimated across all freeway locations in Pennsylvania for all crashes (total), FI crashes, PDO crashes, HB crashes, CM crashes, KA crashes, and KA CM crashes. The standard errors of all CMFs were also estimated and used to identify if the CMF was statistically significant at the 95% confidence level; those that are statistically significant are noted in the table. As shown, the installation of HTCMBs is found to be associated with a statistically significant increase in total crash frequency of approximately 13.3%, a statistically significant increase in PDO crash frequency of approximately 20.2%, and a statistically significant increase in HB crash frequency of approximately 183.5%. These results are in line with expectations: the barrier serves as another object in the median that a vehicle can strike, which would increase the number of crashes, particularly HB crashes, and these crashes tend to be PDO crashes. An increase in FI crash frequency of 2.6% was observed; while not statistically significant, this is slightly counter-intuitive as it would be expected that HTCMBs help to reduce the severity of CM crashes. Digging deeper, HTCMBs were found to be associated with a decrease in CM crashes of 79.1%, KA crashes of 34.2%, and KA CM crashes of 89.9%, and all of these changes are statistically significant. This is also in line with expectations, as HTCMBs would reduce CM crashes significantly, and these crashes tend to lead to the most severe injury outcomes.
Summary of High-Tension Cable Median Barrier Crash Modification Factors (CMFs) for All Freeway Segments
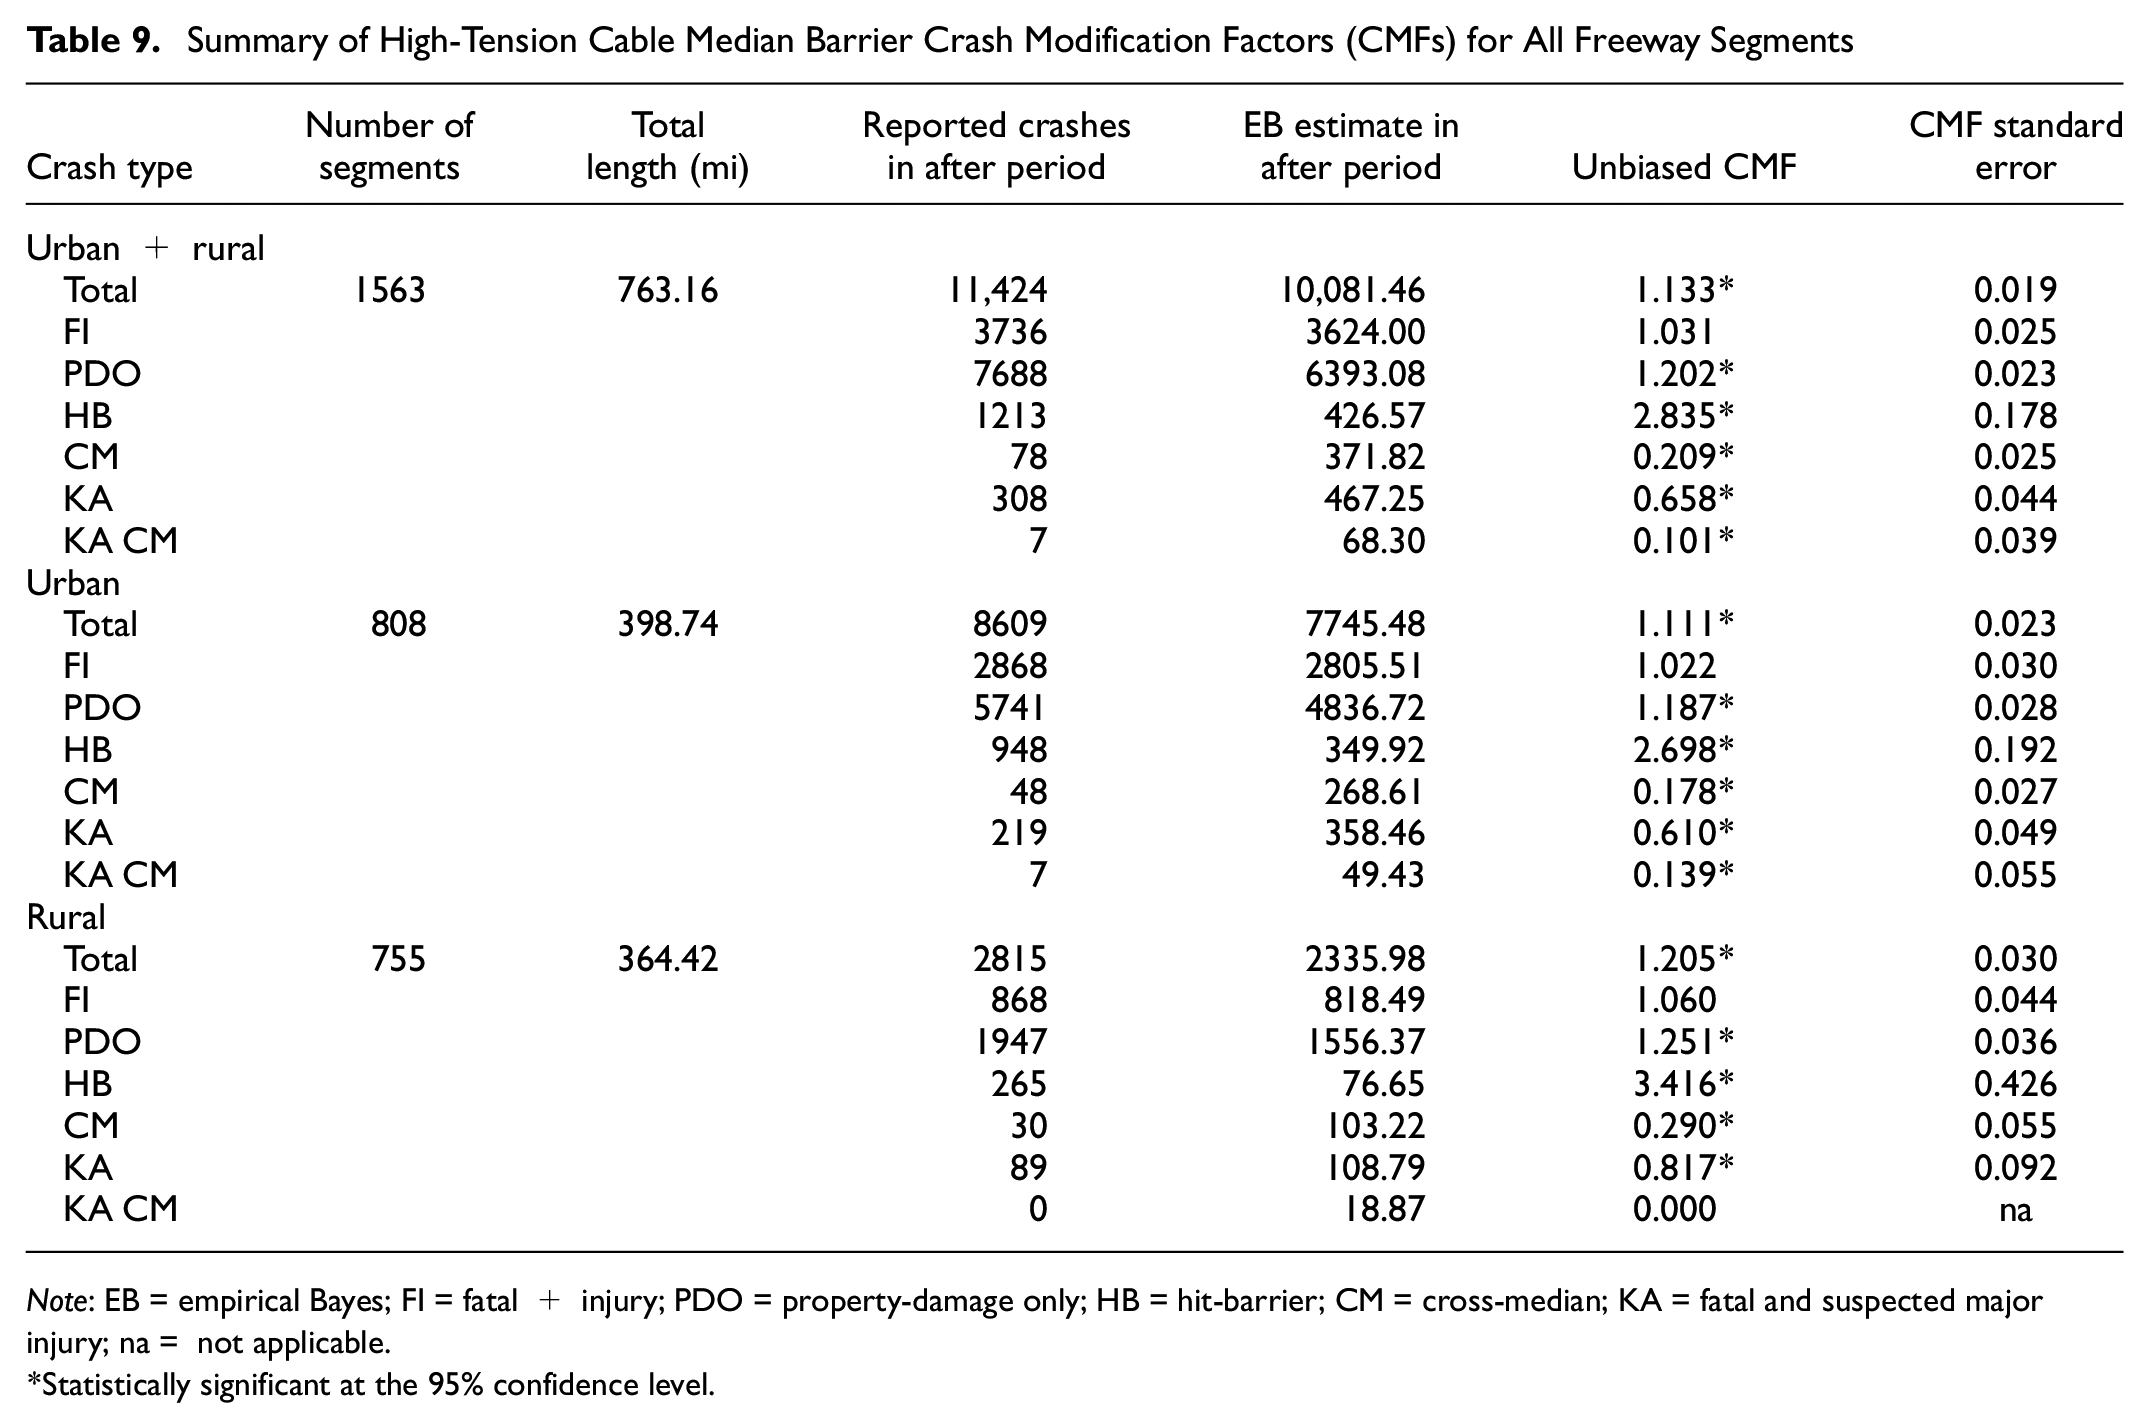
Note: EB = empirical Bayes; FI = fatal + injury; PDO = property-damage only; HB = hit-barrier; CM = cross-median; KA = fatal and suspected major injury; na = not applicable.
Statistically significant at the 95% confidence level.
Note that while the CMF for KA CM crashes is statistically significant, the relatively low number of crashes expected in the after period (68.3) and observed in the after period (7) means that the actual CMF estimate would be highly subject to randomness in the number of observed crashes. Thus, while HTCMBs are expected to significantly decrease this crash type, a more precise estimate of the magnitude of this decrease should be further refined when additional years of crash data are available.
Table 9 also provides a summary of the CMFs for urban freeway segments and rural freeway segments, respectively. The results are generally consistent with the results for all freeway segments. The results suggest that total, PDO, and HB crash frequency tends to increase more on rural segments than on urban segments, and the decrease in CM and KA crashes is lower on rural segments than on urban segments. Nevertheless, HTCMBs appear to provide a significant safety benefit for CM crashes and crashes of the highest injury severity levels on both urban and rural freeway segments.
CMFs were also estimated for the two most common installation locations of HTCMBs on Pennsylvania freeway segments: shoulder (one side) and center of median (single-run). The CMF results are provided in Table 10, and the findings are consistent with the previous findings for all HTCMB installations. HTCMBs installed along the shoulder are associated with larger increases in HB crash frequency (213%) than HTCMBs installed in the center of the median (130%); this is expected because of the proximity of the HTCMBs to the travel lanes, where installations along the center of the median would be equidistant from both directions of travel, while shoulder installations will be close to one travel direction. However, the shoulder installation is associated with a smaller increase in total and PDO crash frequency. One potential explanation for this is that minor crashes near the shoulder may be more likely to go unreported, as opposed to those that occur within the median. However, both installation types seem to be associated with nearly equal reductions in CM, KA, and KA CM crash frequency. Because of data collection limits, it was not possible to differentiate if the HTCMBs were placed on the nearest shoulder of the unidirectional segment or on the opposite side of the median for the shoulder (one side) installation type.
Summary of High-Tension Cable Median Barrier Crash Modification Factors (CMFs) on Urban and Rural Segments by Type
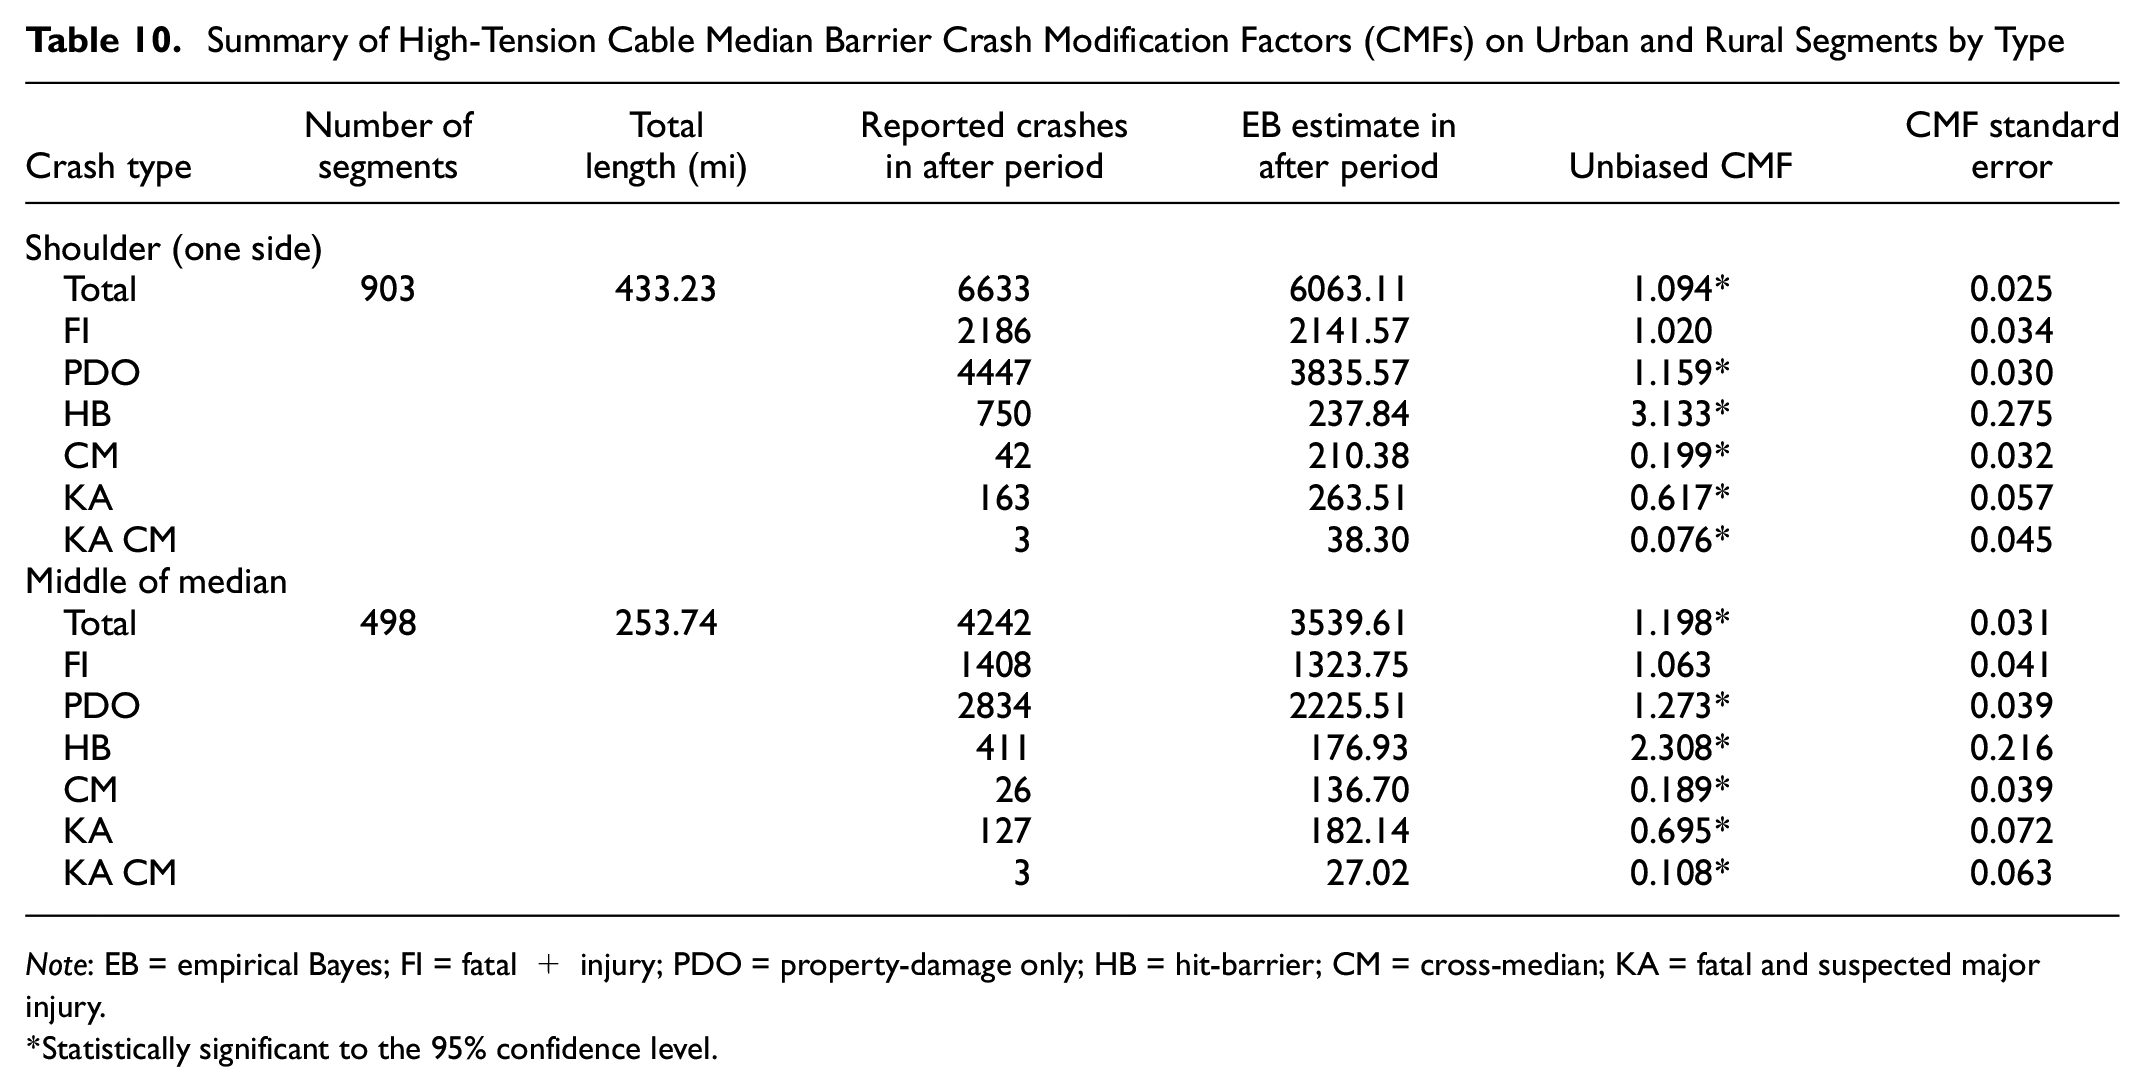
Note: EB = empirical Bayes; FI = fatal + injury; PDO = property-damage only; HB = hit-barrier; CM = cross-median; KA = fatal and suspected major injury.
Statistically significant to the 95% confidence level.
Concluding Remarks
The purpose of this evaluation was to estimate CMFs for HTCMB installations on freeways in Pennsylvania. An EB before–after observational study design was used to estimate the CMFs for a variety of crash types (total, HB, CM) and severity levels (total, FI, KA, PDO). CMFs were estimated for both rural and urban locations in combination and separately. The CMFs for urban application of HTCMBs provide a contribution to the literature as previous studies focused on rural settings.
The results of the evaluation indicate that, when combining rural and urban segments together, total (CMF = 1.133), FI (CMF = 1.031), PDO (CMF = 1.202), and HB crashes (CMF = 2.835) were expected to increase after installation of HTCMBs. With the exception of the total FI crash type, the results were statistically significant. The results are consistent with engineering expectations because, when an object (such as a longitudinal barrier) is placed adjacent to the traveled way, it is expected that the number of reported run-off-road crashes will increase because the barrier limits the lateral distance for a vehicle to recover and presents a new object for a vehicle to strike. When combining all rural and urban freeway segments, the CMFs for CM (0.209), KA (0.658), and KA CM crashes (0.101) were all less than 1.0 and statistically significant, indicating that HTCMBs are expected to be associated with a decrease in these crash types. These results were also consistent with engineering expectations, as the longitudinal barrier is intended to mitigate severe crashes resulting from vehicles crossing the median and colliding with vehicles traveling in the opposite direction.
The separate rural and urban CMFs are similar to the CMFs for all freeway segments combined. When considering the placement of the HTCMBs, the results are also similar to the CMFs for all rural and urban segments combined. An important distinction with respect to placement, however, is that the HB CMF is 3.133 when the HTCMBs are installed along the shoulder of the freeway in one direction of travel, while the CMF is 2.308 when the HTCMBs are installed in the center of the median. This suggests that the lateral distance from the inside edge of the traveled way may influence the expected number of crashes with the barrier—placing the barrier further from the edge of the traveled way may result in fewer expected HB crashes than placing it along the edge of the traveled way.
Note that the CMFs were estimated using unidirectional segments. However, since the CMFs represent the relative crash frequency, the expected change in crash frequency for a segment in both directions of travel on a divided highway, for a given median, would be the same relative value. Thus, the values represent the percent change in crashes associated with a single HTCMB installation.
One potential limitation of the present study is that the SPFs were developed without treating segment length as an offset variable, since the relationship between crash frequency and segment length was not proportional in the sample. This is not typical of SPFs developed in the HSM or other sources ( 29 , 30 ), which assume a proportional relationship between segment length and expected crash frequency. However, as mentioned by Hauer ( 27 ), the non-proportional relationship may be caused by unobserved heterogeneity, particularly when roadways are segmented based on unknown criteria. The authors do not believe that this would significantly affect the CMF estimates; for example, the CMF for total crashes on urban roadway segments was compared with and without assuming the proportional relationship and the differences were negligible. Still, this should be noted and considered as a potential for future research. Future research is also recommended to combine data from Pennsylvania used in this study with those of other states. In addition, analyses using data on the actual offset of the HTCMBs from the travel way could help practitioners better understand relationships between HTCMB location and safety impacts.
Footnotes
Acknowledgements
The authors would like to acknowledge the Pennsylvania Department of Transportation (PSU WO 14) for supporting this study. Mr. Dillan Bujak from Bureau of Operations served as the project technical advisor. The authors also acknowledge Pete Jenior and Kittelson and Associates, Inc., for providing the initial database of freeway segments in Pennsylvania.
Author Contributions
The authors confirm contribution to the paper as follows: study conception and design: V. Gayah, E. Donnell; data collection: V. Gayah, A. Prajapati, H. Liu, E. Donnell; analysis and interpretation of results: V. Gayah, E. Donnell, A. Prajapati, H. Liu; draft manuscript preparation: V. Gayah, E. Donnell. All authors reviewed the results and approved the final version of the manuscript.
Declaration of Conflicting Interests
The author(s) declared no potential conflicts of interest with respect to the research, authorship, and/or publication of this article.
Funding
The author(s) disclosed receipt of the following financial support for the research, authorship, and/or publication of this article: This research was supported by the Pennsylvania Department of Transportation via project entitled “Crash Modification Factors for high-tension cable median barriers”.
Data Accessibility Statement
The data resources are declared in the paper; data may not be shared.
The contents of this paper reflect the views of the authors who are responsible for the facts and accuracy of the data presented here. The contents do not necessarily reflect the official views or policies of the Federal Highway Administration or the Commonwealth of Pennsylvania at the time of publication. This paper does not constitute a standard, specification or regulation.