
Abstract
In this paper, we propose a novel cost function to be embedded in a distributed algorithm for cooperative rerouting of connected and automated vehicles (CAVs) in urban networks. The computation is performed by intersection units managing the portion of the network for which they are in charge by sending updated routes to follow to the CAVs there. Moreover, the intersection units communicate among each other to be updated on the situation of the (in general nonhomogeneous) links of the network. The proposed approach allows the decomposition of the problem into subproblems, which are resolved distributively with little information exchange. The problems are constructed to obtain a fair compromise between user equilibrium and system optimum, taking advantage of the strengths and coping with the limitations of both. We 1) show the results obtained by running simulations with CAVs on the Sioux Falls network compared with a baseline scenario; 2) analyze the results obtained with different penetration rates of CAVs; and 3) provide a sensitivity analysis to investigate how parameters in our approach affect the results of the experiments.
Keywords
Connected and automated vehicles (CAVs) are becoming a reality and, together with opportunities ( 1 – 5 ), challenges arise likewise, including, for example, how to integrate CAVs with human-driven vehicles, guarantee connectivity, and develop CAV real-time planning and control strategies ( 6 , 7 ). Among such challenges is vehicle routing, that is, determining a proper route for the CAVs to follow. Route search and planning have been widely researched, considering their use in spatial data management and location-based social services, and multimodal route planning in transportation systems ( 8 , 9 ).
A comparative study of vehicle route planning in smart cities is presented by Nha et al. ( 10 ). Route planning is a specific type of vehicle routing problem: the former aims to find a route between two locations (origin and destination), whereas the latter focuses on serving several customers by several vehicles. As a consequence of the definition of the two problems, whereas vehicle routing problems are generally proven to be NP-hard ( 11 ), route planning is solvable by optimal methods. Nha et al. identified three categories of algorithm in this research: 1) optimal, 2) heuristic, and 3) hybrid algorithms. Optimal algorithms guarantee to find the global optimal solution through the exploration of the whole set of available solutions; examples of such methods include the Dijkstra algorithm and incremental graphs. Heuristic-based approaches explore a subset of the available solutions and usually find an approximate optimal solution with qualities close to those of the global optimal one; examples include A*, genetic algorithms, ant colony optimization, and tabu search ( 12 , 13 ). Finally, hybrid algorithms leverage the strengths of both of the previous approaches: an example of a hybrid method could apply a combination of Dijkstra- and genetic algorithms.
In the research by Taha and AbuAli, the authors consider the problem of routing from a broader perspective, including vehicular communication, sensing, localization, Internet of Things, computing, and machine learning ( 14 ). They also present a review of route planning metrics, outlining their evolution from the traditional distance/time/cost to metrics that are more relevant to vehicle autonomy such as scenery and safety. Such discussions have expanded to encompass the complexity of route planning in the presence of autonomous vehicles, and how this complexity can be managed. Finally, they highlight the necessity for considering traffic management during events or emergencies, so that both traffic management directives and autonomous intervehicle collaboration might lead to safer and faster resolutions of congestion.
Other major efforts focus on the optimization of multiobjective routing problems. In a study by Zajac and Huber, the authors offer an overview of which application-oriented, multiobjective routing problems are treated and which trade-offs are investigated ( 15 ). Algorithmic approaches are analyzed with regard to their fitness assignment strategy, namely how the multiple objectives are handled, and their search strategy to solve the problem. A rich classification is presented, based on the objective types: 1) related to flows/tours (such as distance, reliability, environment, health risk, military risk); 2) related to nodes/arcs/edges (such as comfort, time to destination, customer cost); and 3) related to resources (such as facilities, transportation goods, goods).
Most of the previous approaches aim at minimizing a, so to speak, user-centered cost, which usually depends on factors such as the time from the origin to the destination, speed, and waiting time for every single vehicle. In this regard, an interesting concept was proposed in Menelaou et al.’s research to minimize traffic congestion through continuous-time route reservations with travel time predictions ( 16 ). Nevertheless, the current fastest/shortest routes are not always the most appropriate to follow, as pointed out by Li et al.: the authors propose a double rewarded value iteration network to model current and future states and learn the experienced drivers’ routing decisions based on their estimation of traffic trends ( 17 ). This is to take advantage of the knowledge of experienced drivers about the topology and traffic trends of the roads they are traversing. On the other hand, only a few works address the routing problem by affecting the macroscopic traffic variables, thus minimizing traffic congestion considering current measurements of the density, volume, and mean speed of the traffic. For example, Wuthishuwong and Traechtler use a discrete consensus algorithm to coordinate autonomous agents and redistribute the traffic through rerouting ( 18 ). However, the latter type of approach typically operates under the assumption that the intersections lie in a network of roads with a common fundamental diagram, which is not realistic.
A crucial point in this context is understanding whether and how the adoption of a system optimum (SO) solution (i.e., minimizing only network-level objectives) affects the behavior of an urban network with CAVs and what is its role in relation to the user equilibrium (UE) solution (i.e., minimizing only user-level objectives). A comprehensive review is offered by Morandi, who discusses possible ways of bridging the gap between the two optima ( 19 ). Specifically, UE results from a user-centered traffic assignment in which each user self-interestedly chooses the most convenient route. When the equilibrium is reached, all users sharing the same origin and destination will experience the same travel time, therefore, guaranteeing respect for fairness. However, the UE generally does not minimize the system’s total performance. On the other hand, the SO results from a systemwide traffic assignment in which drivers are routed on the network in such a way that the total travel time is minimized. However, if SO is achieved, some users may experience travel times that are higher than other users traveling from the same origin to the same destination, which may be considered unfair.
Chen et al. developed a route control scheme to achieve the SO of a network by controlling a portion of CAVs in an attempt to demonstrate the potential of automated vehicles as control actuators for improving traffic network performance ( 20 ). Their results show that a minimum control ratio can be identified. Furthermore, they propose a joint route control for CAVs and pricing for an uncontrolled vehicles scheme that demonstrate the synergistic effect of the joint scheme on reducing the minimum control ratio and the financial burden on travelers. A multiclass model dynamic traffic assignment is developed by Ngoduy et al. to equally distribute the total queues over the links while considering explicitly the variations in capacity and backward wave speeds ( 21 ). The results show that the introduction of automated vehicles changes the traffic flow dynamics. This leads to a reduction in the spillback and total system travel time—even more so with increased penetration rates and total demands when heavy traffic congestion occurs.
The aforementioned studies analyzing SO assume the presence of a central unit to handle the load of information and yield the optimal solution. Therefore, they focus on redefining the optimization problem to favor its scalability and tractability. On the other hand, a distributed approach might be utilized instead. The impact of distributed dynamic routing under different market penetration rates of CAVs and congestion levels on urban roads is investigated by Alfaseeh et al., in an agent-based traffic simulation study of downtown Toronto’s network ( 22 ). The results show that the higher the market penetration rates of CAVs—especially in the case of highly congested urban networks—the higher the average speed, the lower the mean travel time, and the higher the throughput. More research work in the field of distributed routing has been proposed, especially exploiting the VANET technology ( 23 ). Examples of the latter are found in Mostafizi et al., in which the authors propose a decentralized routing framework with a heuristic algorithm, considering the travel speed to be inversely proportional to the number of vehicles in the roads ( 24 ); in a study by Sun et al., proposing ant colony optimization on vehicles at intersections, broadcasting messages to build multihop links ( 25 ); in a study by Mahajan et al. in which intelligent vehicles cooperate by delegating virtual agents to share their planned future routes with roadside agents ( 26 ); in Yao et al.’s research, adopting a distributed routing strategy using past vehicle traces via the hidden Markov model to predict the vehicles’ future positions and the packet transmission probability for a specific mobile destination ( 27 ); and in Lin et al.’s study in which the authors propose a moving zone-based routing protocol that divides the network into multiple moving zones formed by vehicles, grouped and led by a “captain” vehicle, which have the same movement model ( 28 ). In all the previous research, however, there are limitations, including performance not considering the actual traffic situation of the network, or being too inclined toward UE that congestion might effortlessly arise.
In this work, we propose a novel cost function be integrated in a cooperative real-time rerouting algorithm for CAVs to obtain an efficient redistribution of the flows in an urban network. The function is constructed so that the algorithm solution leans toward a UE as long as possible, while still coping with the overall system performance for volumes of vehicles. Moreover, we argue its predisposition to be solved in a distributed fashion. In what follows, we present the proposed methodology and how it relates to the formulation of the UE and SO problems. Then, we show the results obtained by 1) running a simulation in which we tested our methodology compared with a baseline on the Sioux Falls network; 2) analyzing the results obtained considering different penetration rates; and 3) performing a sensitivity analysis. Finally, we summarize our work and suggest directions for future research.
Methodology
In this section, we underline the proposed methodology, starting from the framework and assumptions, followed by presentation of the cost function to be utilized by a routing algorithm, in this case, its utilization in the Dijkstra algorithm ( 29 ).
Framework and Assumptions
We considered a network of intersections connecting links, where each link is characterized by a potentially different fundamental diagram. We assumed the presence of intersection unit devices (IUs) able to communicate with each other and with the CAVs. We defined a route to be followed by a CAV as the sequence of intersections (or, interchangeably, IUs) to drive through from an origin intersection to a destination intersection. Despite the so-defined route not being realistic since CAVs do not have origins and destinations exactly at intersections, we retained this definition for the sake of simplicity and will consider necessary modifications in future developments. Figure 1 gives a practical example of the network considered. The role of the IUs is to sense the presence of the CAVs within their area of competence and/or be informed by them via communication to reinforce the reliability of the sensed data. Furthermore, the IUs communicate and propagate information among each other to make sure that each of them has an updated “situation” of the network, which is described by the number of vehicles driving on each link at a given time. Other information about the links in the network is necessary, namely the capacity volume and density (i.e., number of vehicles at capacity), and the jam density (i.e., maximum number of vehicles). The latter, in general, result from a fundamental diagram that is different for each link and is, for example, uploaded to the IUs beforehand, therefore offline, or estimated online via available techniques such as that presented by Tajdari and Roncoli ( 30 ). The IUs update and deliver the route to be followed by every CAV within its range, which encompasses the vehicles within its inflowing links driving toward the IU itself. The CAVs can employ their communication capabilities to inform an IU when arriving within its area of competence, as already mentioned. Moreover, the CAVs will receive the updated route and actuate some techniques to track thereof. The tracking techniques are not the object of this study, but they can, for example, address intersection coordination and minimization of the error to the reference route as in Vitale and Roncoli’s research ( 31 – 33 ).
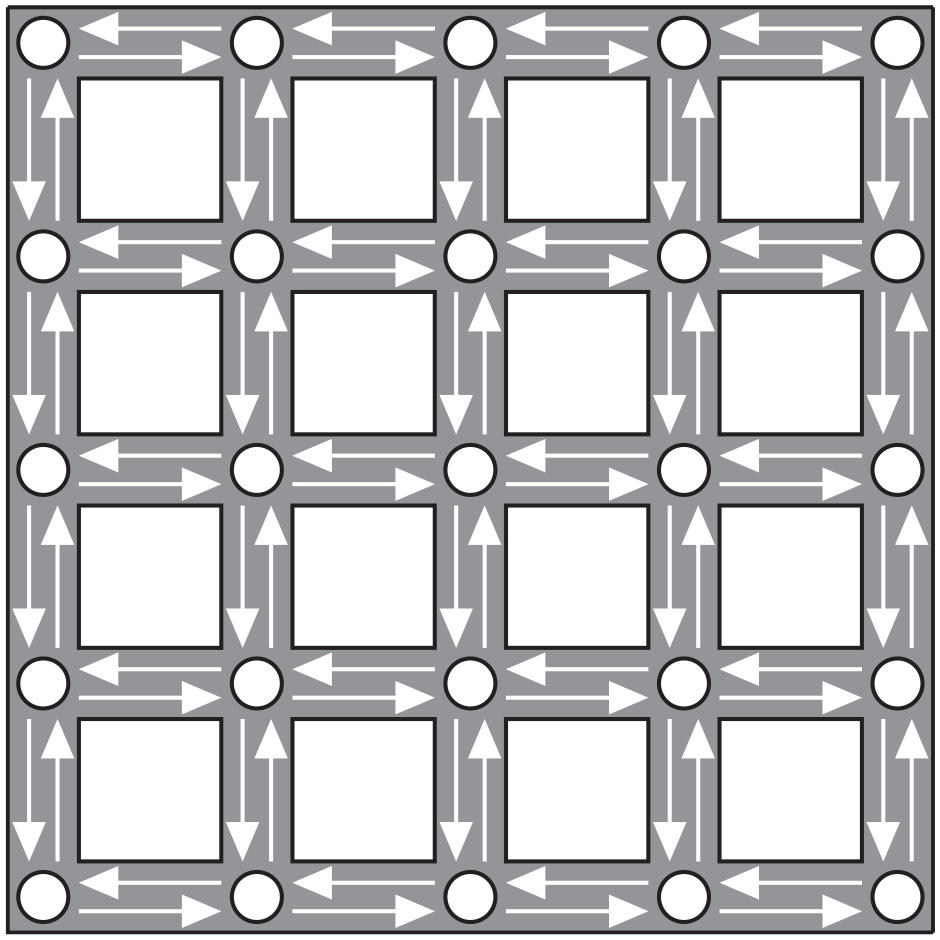
The network considered. The white circles represent the IUs, which are placed at the intersections.
Applicability and Limitations
The positive outcome of the proposed method is influenced by the possibility of successfully installing the IUs in the appropriate locations. In this paper, to simplify presentation of the strategy, we have assumed that there is an IU for each intersection and they are capable of communicating with other IUs and CAVs and sensing the vehicles. However, different positions in the network could be explored, given that they still provide useful (for the proposed method) information and are able to communicate. This scenario is the subject of investigation in the research community and did not seem to pose a problem for the implementation of our technique ( 34 , 35 ). Moreover, continuous advances are being introduced in the field of vehicular communication, considering the currently available technologies and ongoing research about communication via, for example, dedicated short-range communication (DSRC/IEEE 802.11p), Wi-Fi, 5G, and beyond ( 36 – 38 ). For these reasons, we believed that the proposed distributed algorithm represented a realistic implementation and deployment option.
Proposed Cost Function
Consider an intersection (where an IU is placed) computing the route of a vehicle from such an intersection to its destination. According to the algorithm in use, the next IU is
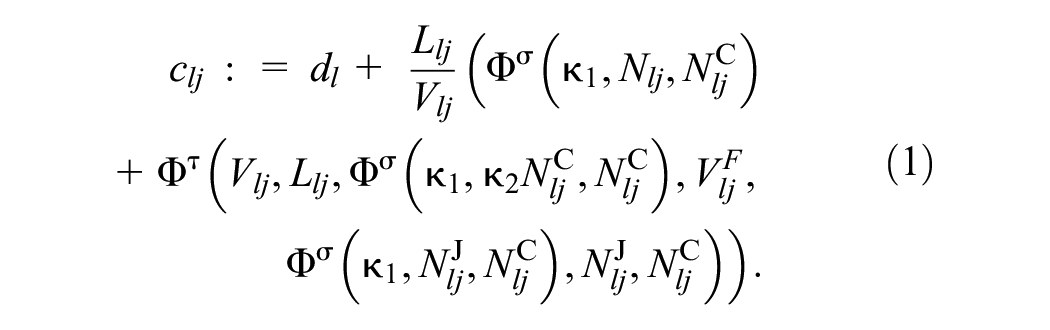
The first term,
where the subscripts
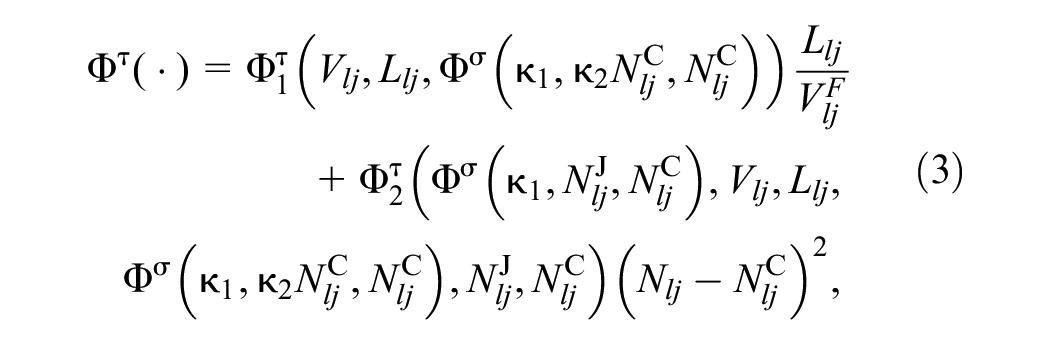
namely, a function scaling the time needed to drive through Link
allows a higher weight to be assigned to the time needed to drive through Link
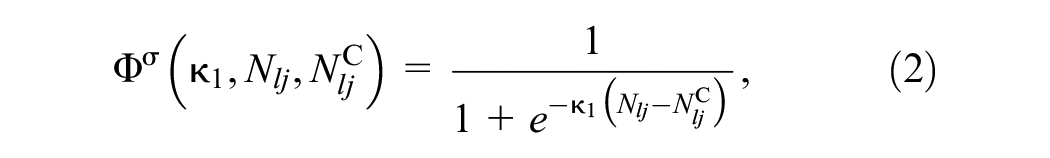
allows us to consider the travel time cost as a square function and rescale it so that it will meet the sigmoid function at the full congestion number of vehicles. Note that at full congestion (i.e., when
Note that, in the total cost (Equation 1), whereas the second element allows a load-sharing process among the links, the third one takes into account the time needed to traverse a link. Both the terms
The two main cost terms,
Application to the Dijkstra Algorithm
The algorithm run by the IUs is a modified version of the Dijkstra algorithm (
29
), in which we modify the cost function by considering Equation 1. Although it would be possible to utilize other shortest-path routing algorithms employing the proposed cost, in the present study we focused on Dijkstra, owing to its popularity and proven optimality, leaving the investigation of other algorithms as a future research direction. A CAV driving toward an intersection communicates with the relative IU as soon as it is within its communication range (and/or is sensed by the IU itself). At this point, and at every time instant thereafter, the IU runs Algorithm 1 (rerouting algorithm) for the CAV until it exits its range. The input needed for the algorithm to run includes the network graph
The remainder of the algorithm updates the least distant neighbor and sets the predecessor (Lines 11 to 13). Finally, if the CAV has just entered or exited Link
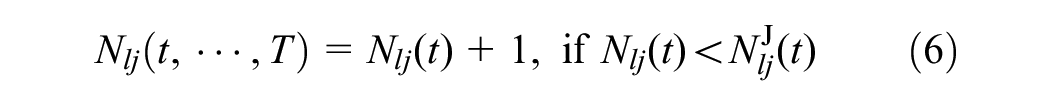

which is evaluated every time a vehicle requests to enter the Link
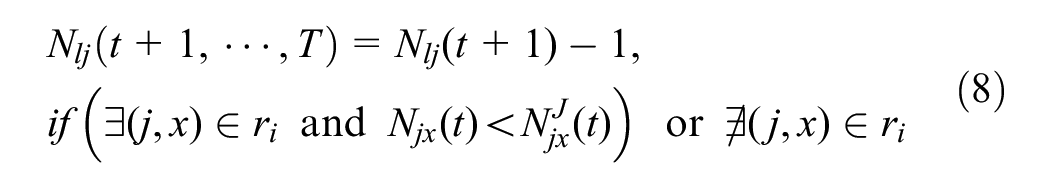

Note that the increased update in Equations 6 and 7 takes place immediately at time
Given the nature of the proposed solution, with the possibility that every IU takes care of the CAVs within its respective range while communicating to achieve better performances, we can conclude that this algorithm falls in the category of distributed routing ( 24 – 28 ) via sharing of the vehicle load among the links in the urban network.
User Equilibrium and System Optimum
In the following, we provide the UE and SO problem formulation definitions as widely employed ( 19 ) and highlight how they relate to our methodology.
UE is defined as
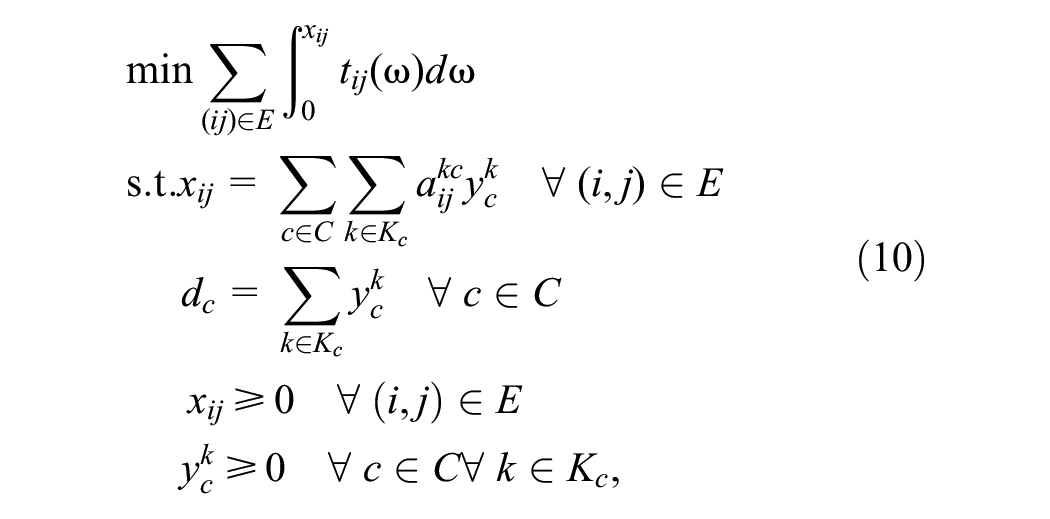
where the cost function is the sum over all the links of the integral between 0 and the link flow,
SO is defined as
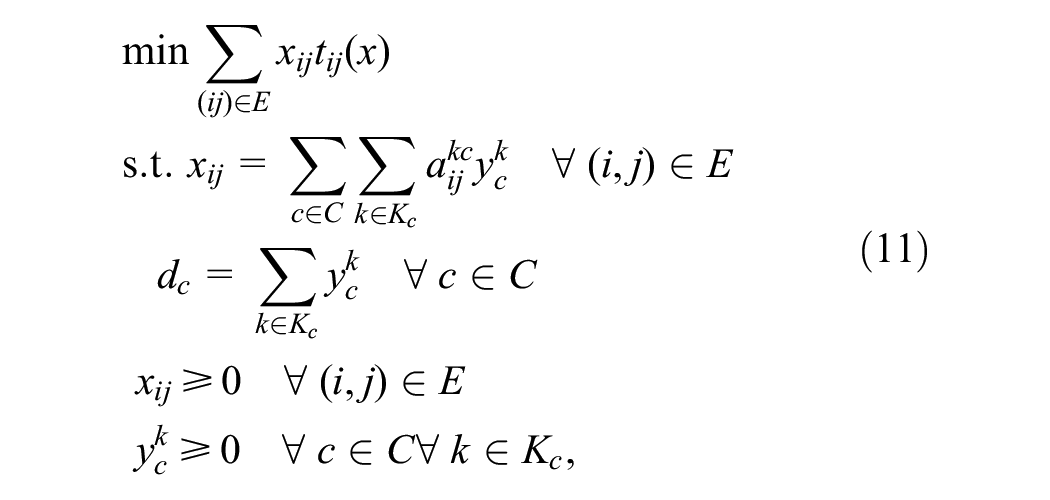
where the cost function is the sum over all the links of their latency function multiplied by their flow. As an analogy to our method, consider travel time,
whereas the travel time is
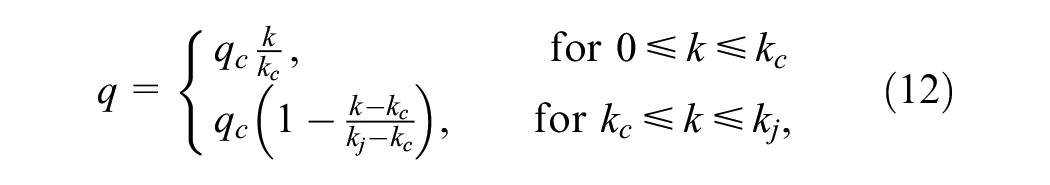
For this reason, the proposed method incorporates the cost function (Equation 1) that rapidly increases until the critical number and then continues to increase slowly while tending toward a constant value that, for convenience, is set to 1 before being multiplied by the factor
Signalized Traffic Networks
If the network contains intersections that are equipped with traffic signals, there are some considerations to be made. First of all, this would affect the way travel time is computed in the cost function, and in particular in Equation 3. Second, the vehicle speed–number relation may need modification depending on the type of control method in use.
Recalling the review of approaches at signalized intersections carried out in Wang et al. ( 39 ), signalized traffic control can be classified into 1) fixed-time control, 2) actuated control, and 3) adaptive control. Fixed-time control is achieved using historical traffic averages over a given period of the day and repeated throughout that period, whereas actuated control senses arrivals on the active approach, altering (slightly) the green time duration based on the presence of vehicles. Consequently, these types of control do not cause major changes to any demand fluctuation or dynamic variation. Therefore, since the signal settings could be integrated into the estimated capacities, thus reflected in the fundamental diagram, our methodology is applicable without relevant modifications to this scenario.
In the case of adaptive control, such as the max-pressure controller ( 40 ), discussions might be more complex. A typical objective is to prioritize those links experiencing a higher volume of traffic (see Zhou and Roncoli [ 41 ]), which, in turn, implies their delay is increased (or average speed is increased). Therefore, it would be interesting to consider extending the cost function in Equation 1, and even derive and tune it by means of data-driven and reinforcement learning strategies, which are topical subjects in lines of research investigating the future traffic environment ( 42 ). Other possible approaches proposed in literature regard multicommodity routing (e.g., in De Souza et al. [ 43 ]). To implement a naive version of the latter, our methodology could take into account the speed constraint of each CAV and reroute it toward more appropriate links. Finally, it is worth investigating the possibility of our strategy being employed as an input to a signal timing algorithm, even running this in an iterative fashion, similar to, for example, Li et al. ( 44 ). Nevertheless, more in-depth research is required to investigate possible exploitation of the traffic signal cycle plans to modify the cost function.
Simulation Experiments
In this section, we present the results obtained by running a set of simulation experiments. First, we describe the setting, then we show the results for a baseline technique, namely a basic Dijkstra, where routes are computed considering the time needed to travel in free-flow, also known as an all-or-nothing strategy, therefore without checking the actual situation of the congestion, and those applying the proposed algorithm for comparison. Then, we investigate the behavior of the proposed algorithm with various penetration rates and perform a sensitivity analysis.
Experimental Settings
We adopted the widely employed Sioux Falls network (see, e.g., Zhou and Roncoli [
41
], Rahman and Hasan [
45
], Huang et al. [
46
], and Pel and Nicholson [
47
]), as illustrated in Figure 3 and described in Transportation Networks for Research (
48
), with minor modifications to adapt it to a more interesting and relevant scenario for this study. We retained all the information about the structure of the networks, that is, the same 24 nodes (corresponding to the positions of the IUs) and 76 links. However, the cited reference assumes the free-flow time needed to traverse a link (in minutes) to be equal to the length thereof (in miles). As a consequence, the free-flow speed is 60 mph for all the links. To make this more suitable for an urban environment, we considered the length of the links (between 2 and 10 mi) to be a tenth of the reported value. We also resized the density at capacity, or critical density, accordingly and set the capacity flow considering a triangular fundamental diagram, whereas the jam density was arbitrarily set to four times the critical density. Moreover, we set different values for the free-flow speed on the links, so that they resembled the maximum speed limits in the actual city that the network was an abstraction of. Table 1 shows the data utilized for the network. Despite the above-mentioned modifications, we kept the hourly number of trips as per the original values (
48
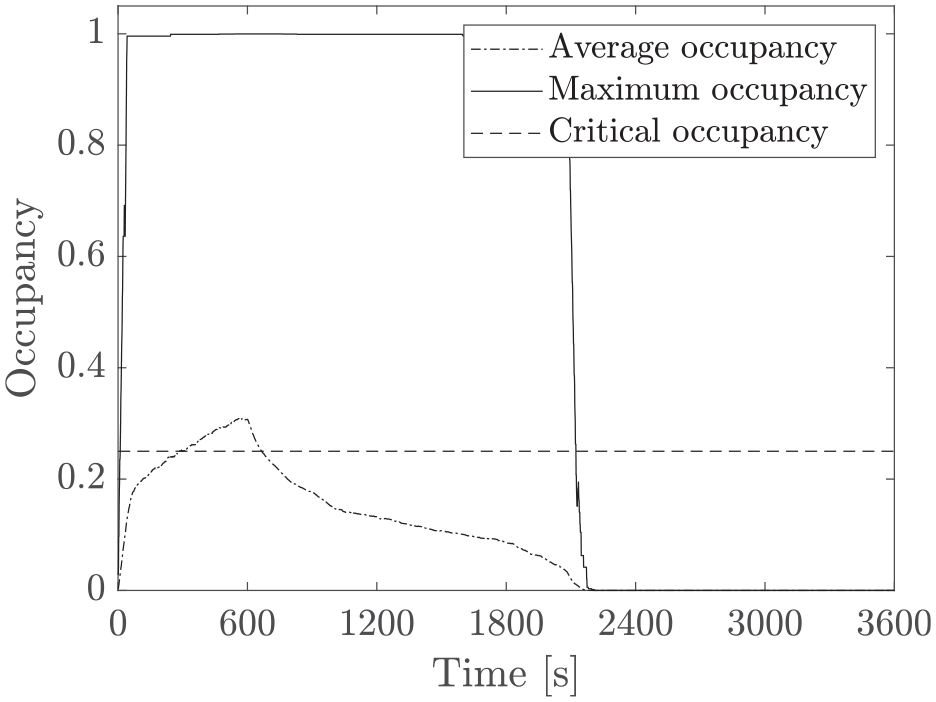
), here omitted for the sake of conciseness, which in total was 360,600. However, we only considersed vehicles entering the network within 10 min and ran the simulations for half an hour to ensure that all of them had exited. We generated vehicles in the network with random entering times, origins and destinations, in such a way as to meet the above-mentioned trips for each path. Ultimately, the total number of vehicles resulting from a 10-min demand was 59,898. For the sake of clarity of terminology, in what follows, we define the occupancy as
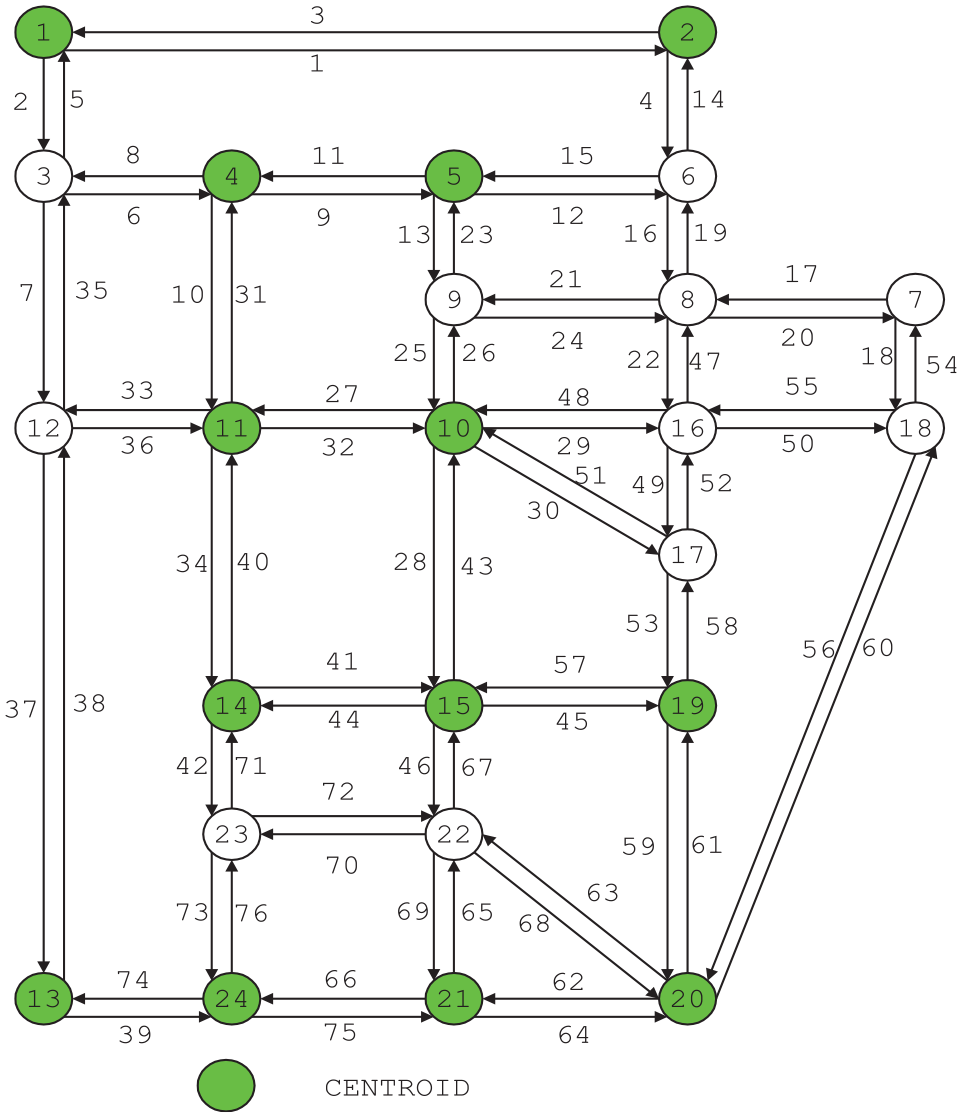
Sioux Falls network.
Sioux Falls Network Revisited as Used in this Paper
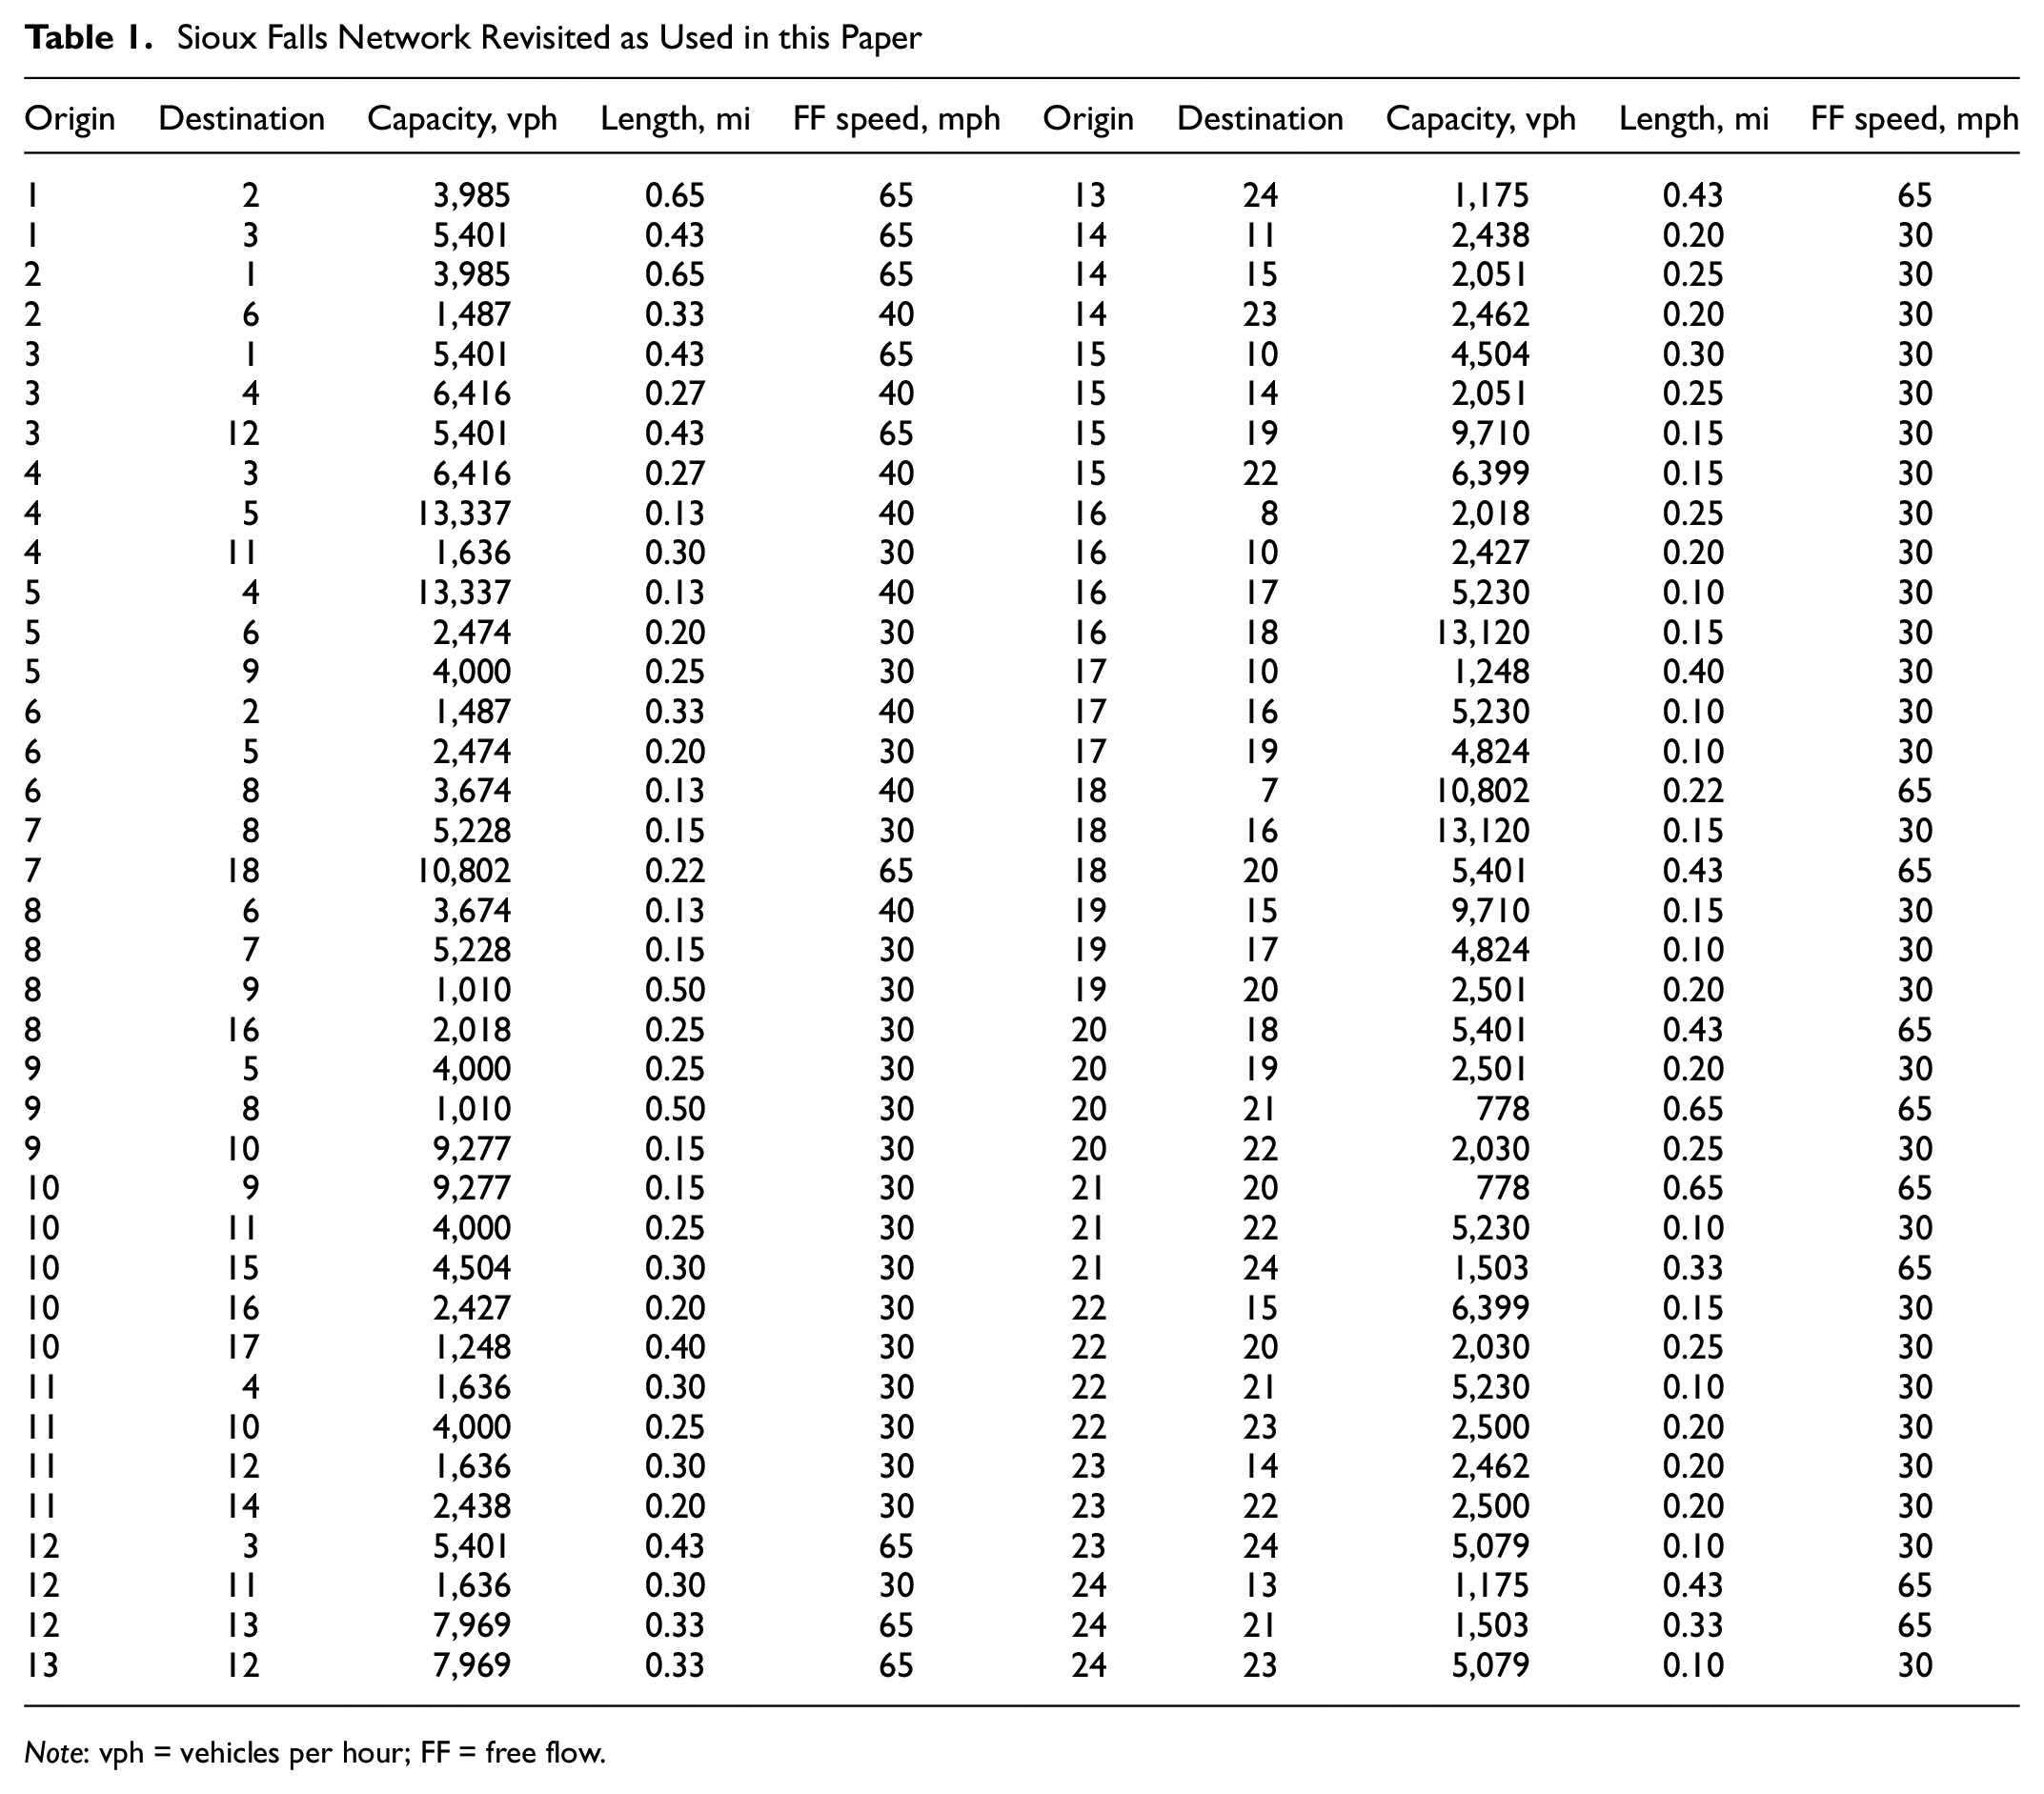
Note: vph = vehicles per hour; FF = free flow.
Comparison with a Baseline
For this simulation, we ran a baseline Dijkstra algorithm in which the links were chosen based on free-flow travel time without accounting for the actual situation of the network, and the proposed algorithm with parameters
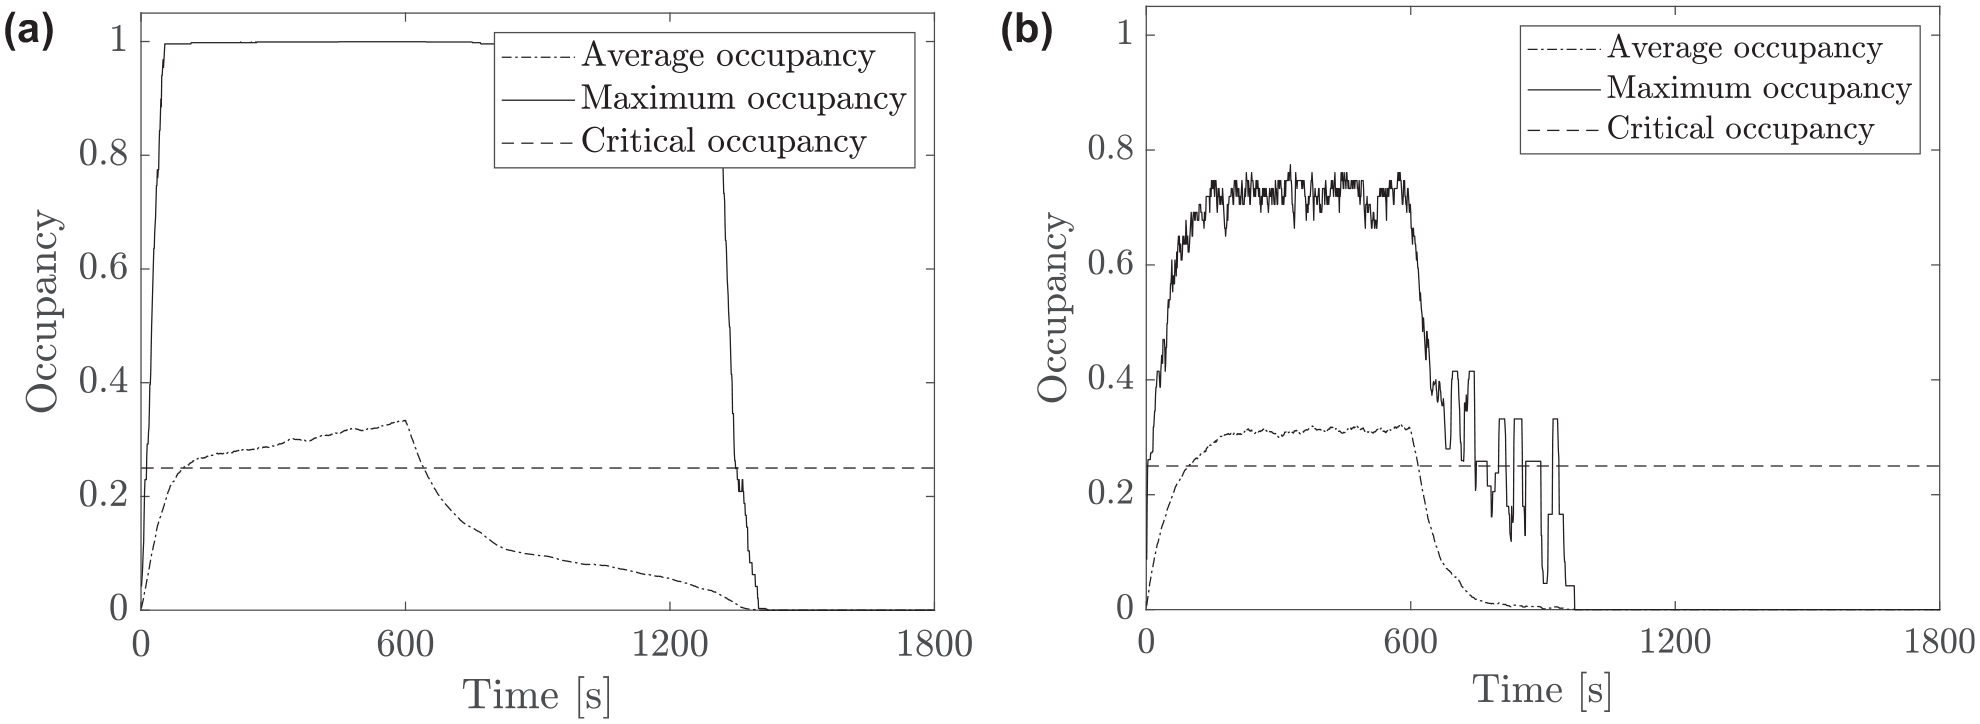
Occupancy averaged by the whole network and maximum occupancy reached by any link in the network for (a) the baseline and (b) the proposed algorithm simulation.
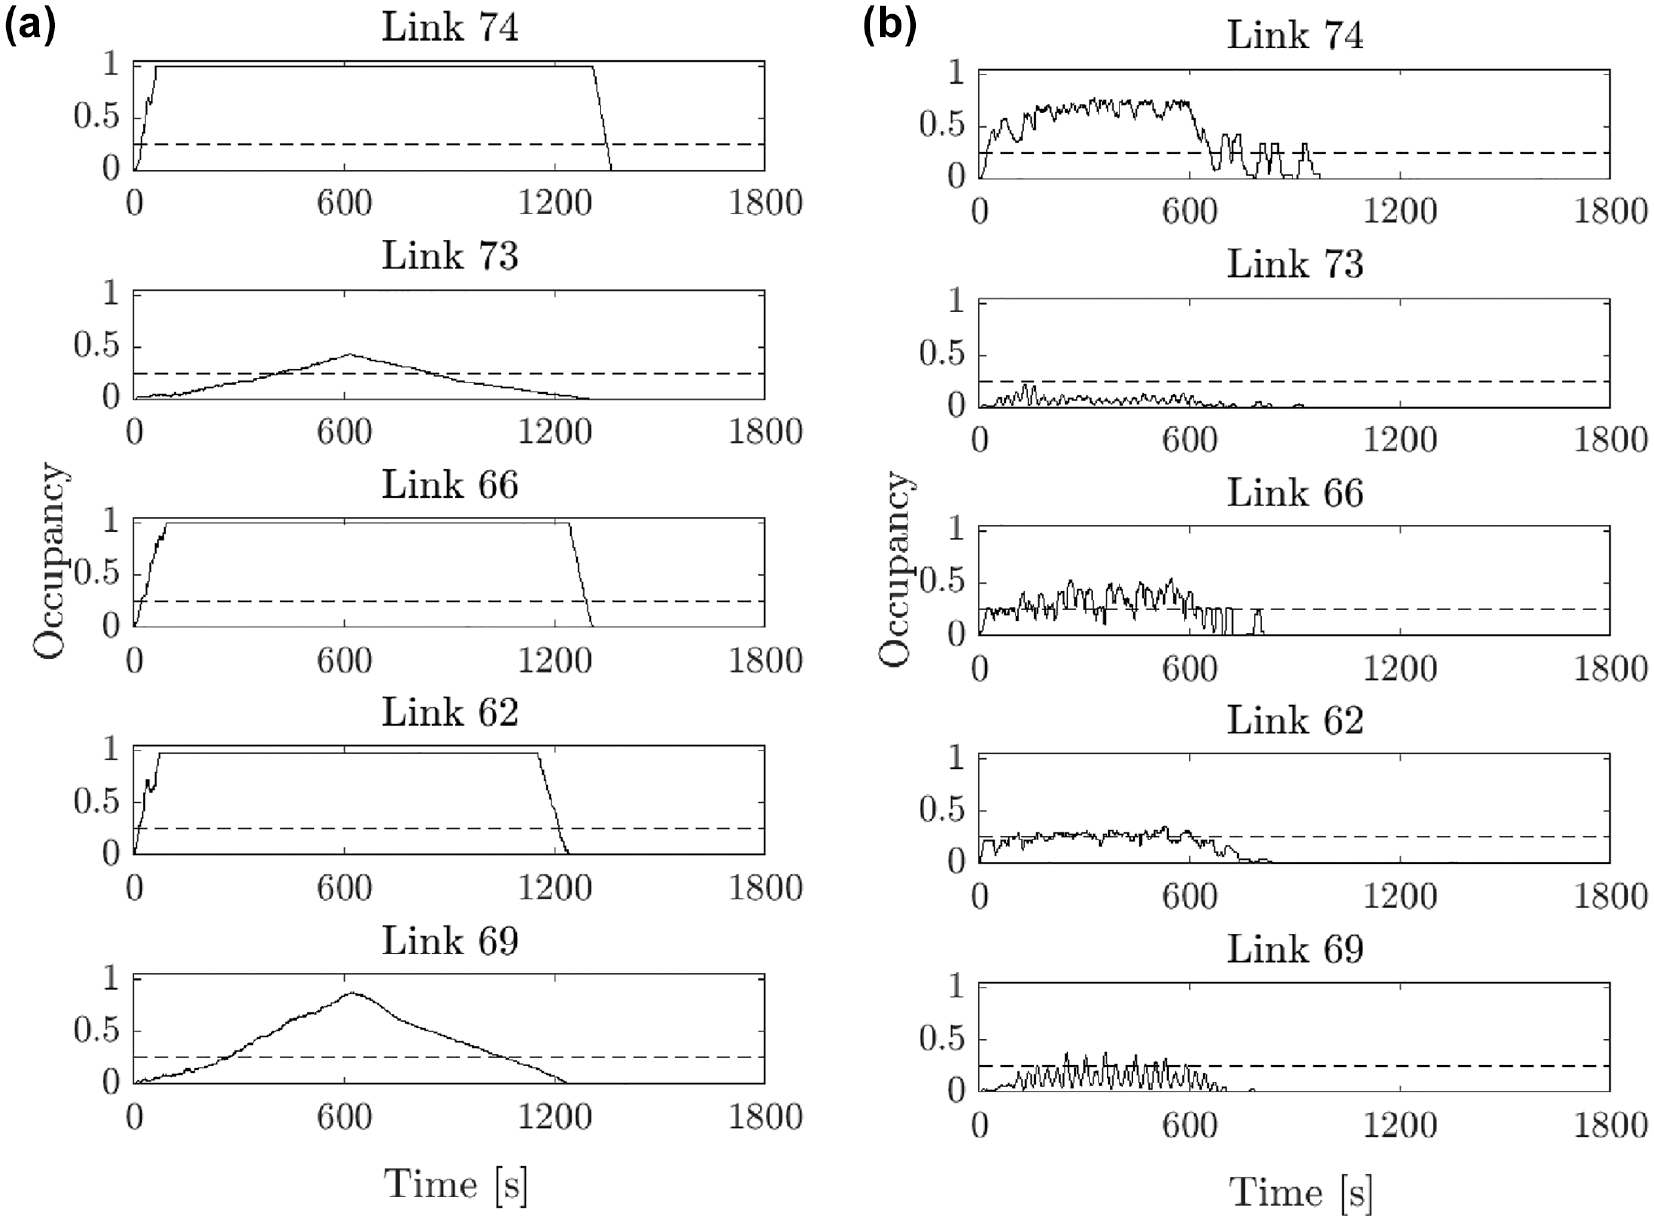
Occupancy levels reached by Links 74, 73, 66, 69, and 62 for (a) the baseline and (b) the proposed algorithm simulation.
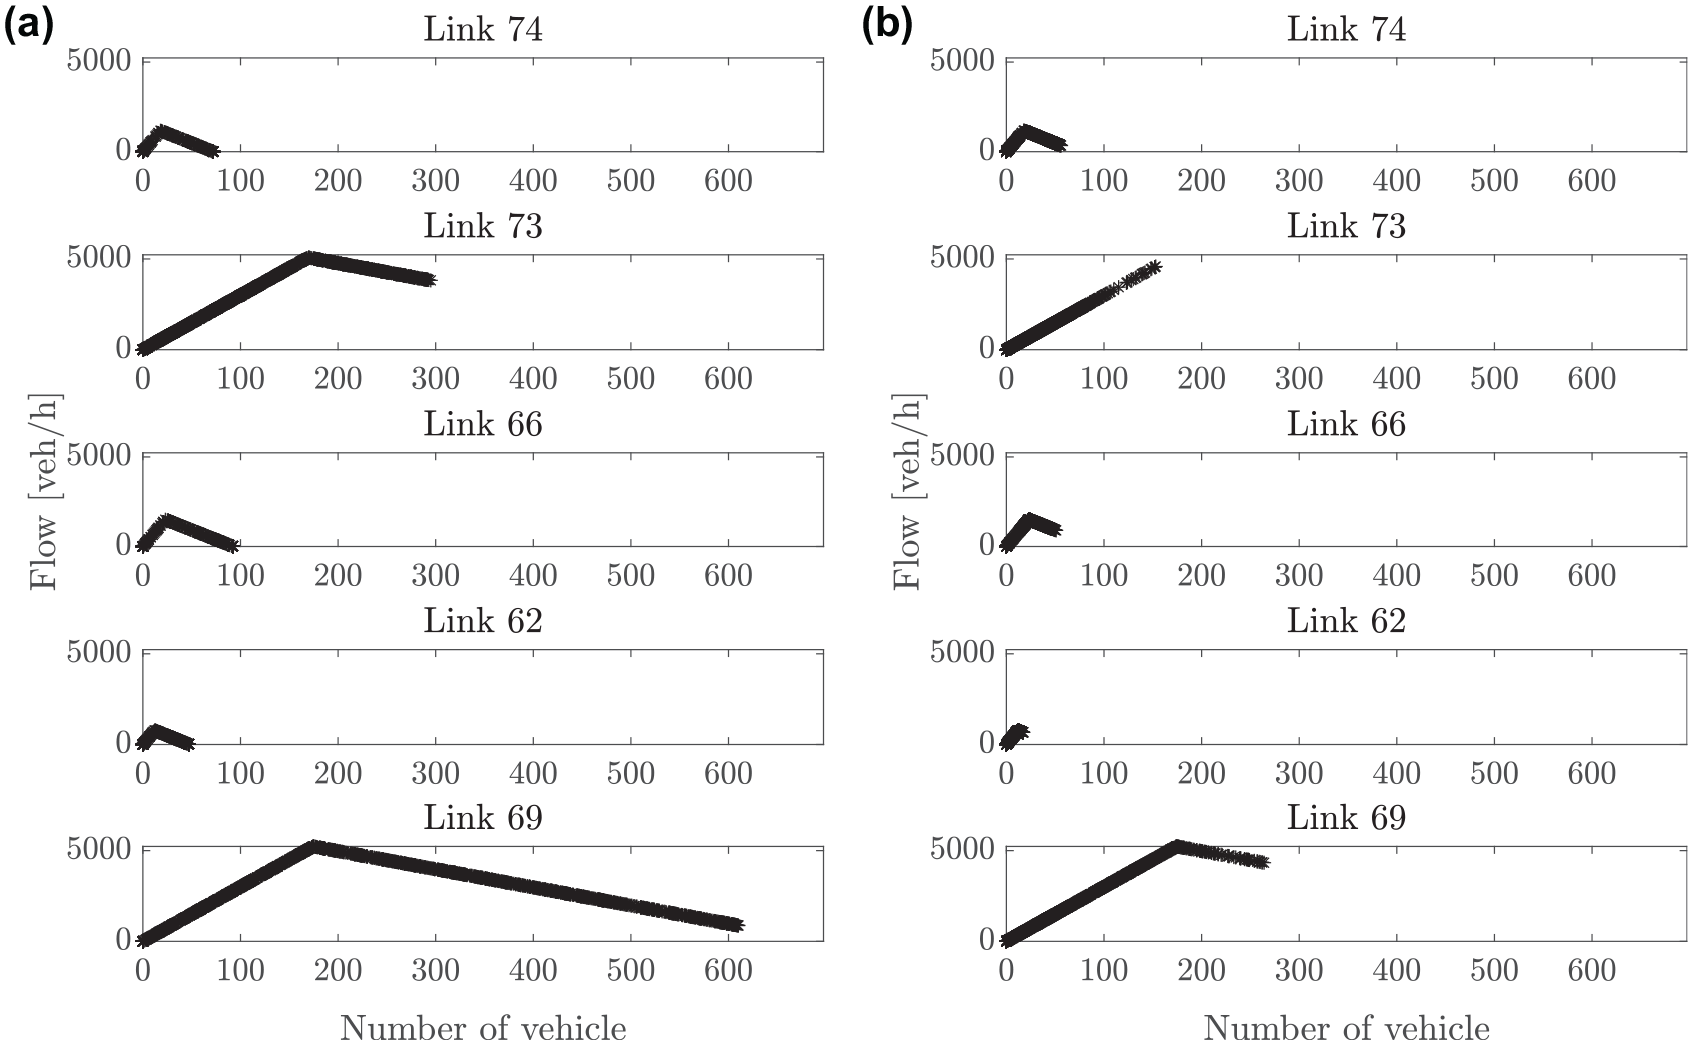
Fundamental diagram (expressed as number of vehicles–flow) of Links 74, 73, 66, 69, and 62 for (a) the baseline and (b) the proposed algorithm simulation.
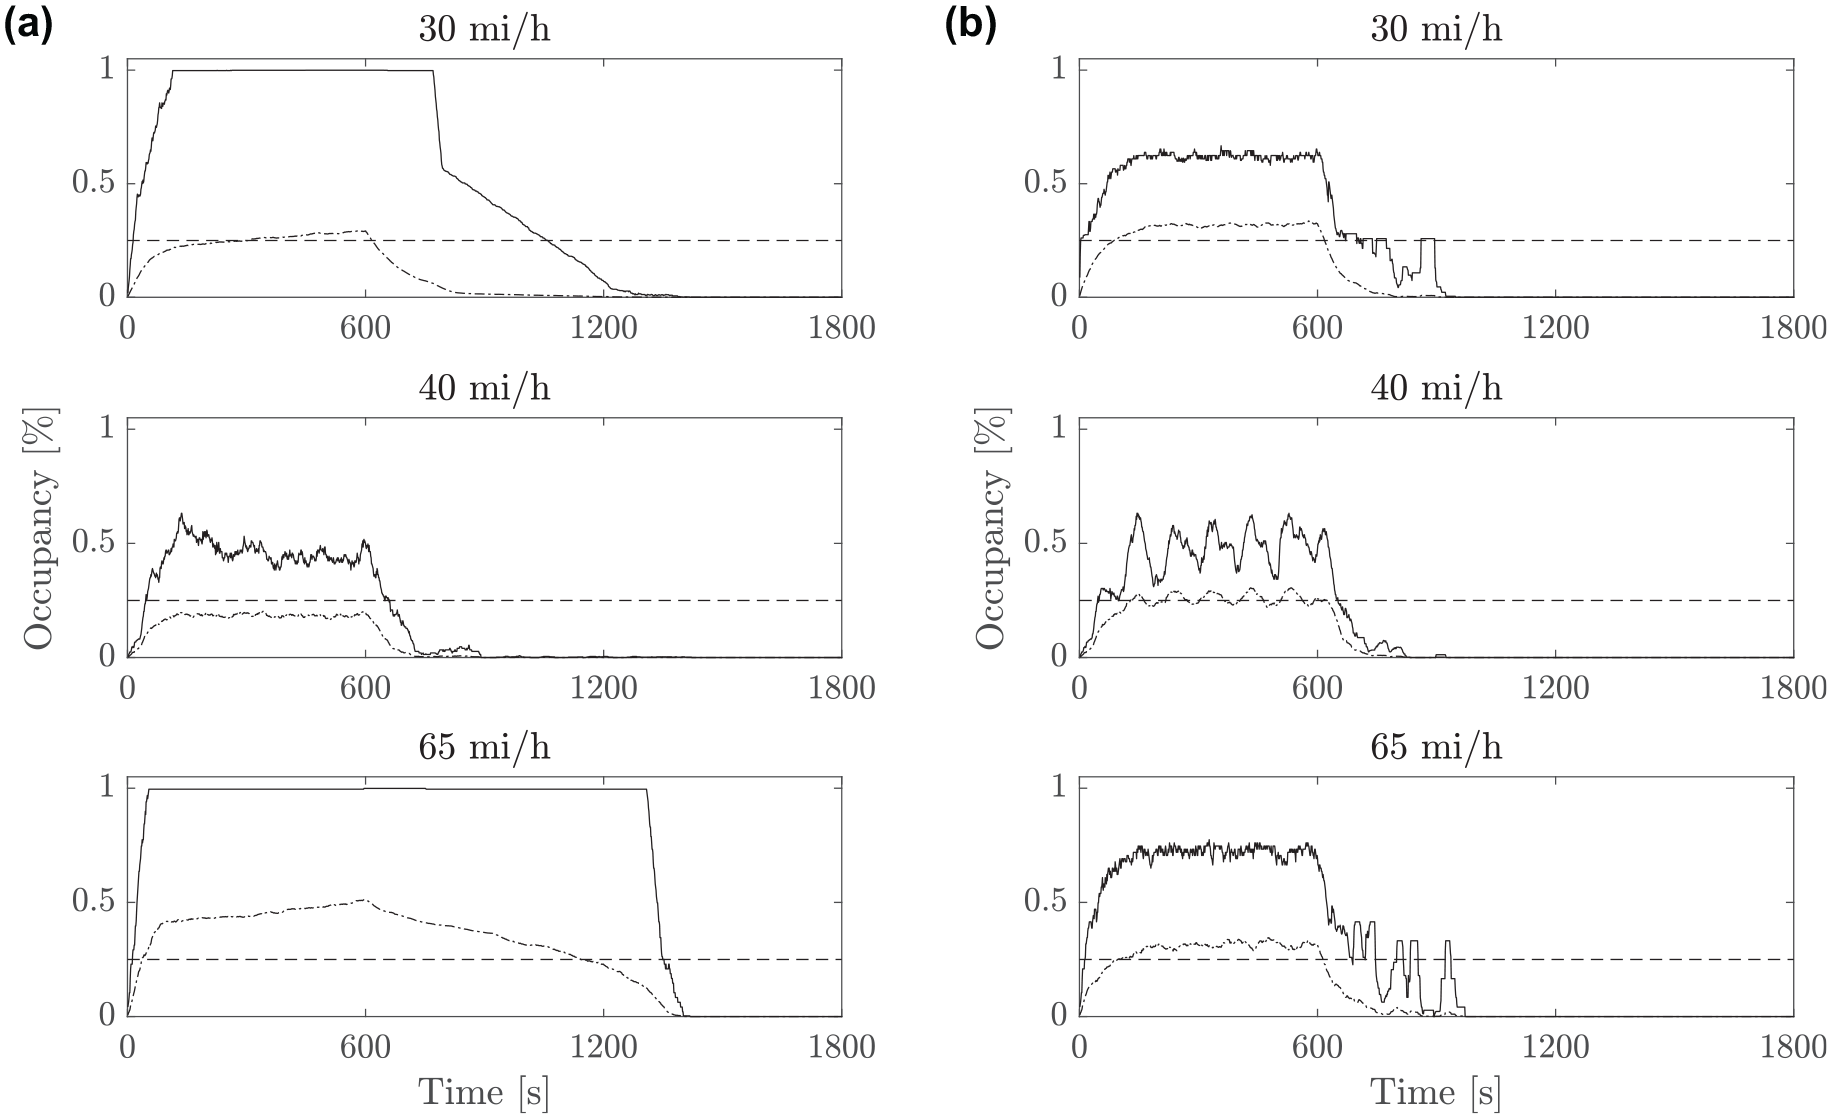
Occupancy averaged and categorized into four groups: 1) links with maximum speed 30 mph, 2) links with maximum speed 40 mph, and 3) links with maximum speed 65 mph. Results for (a) the baseline and (b) the proposed algorithm simulation.
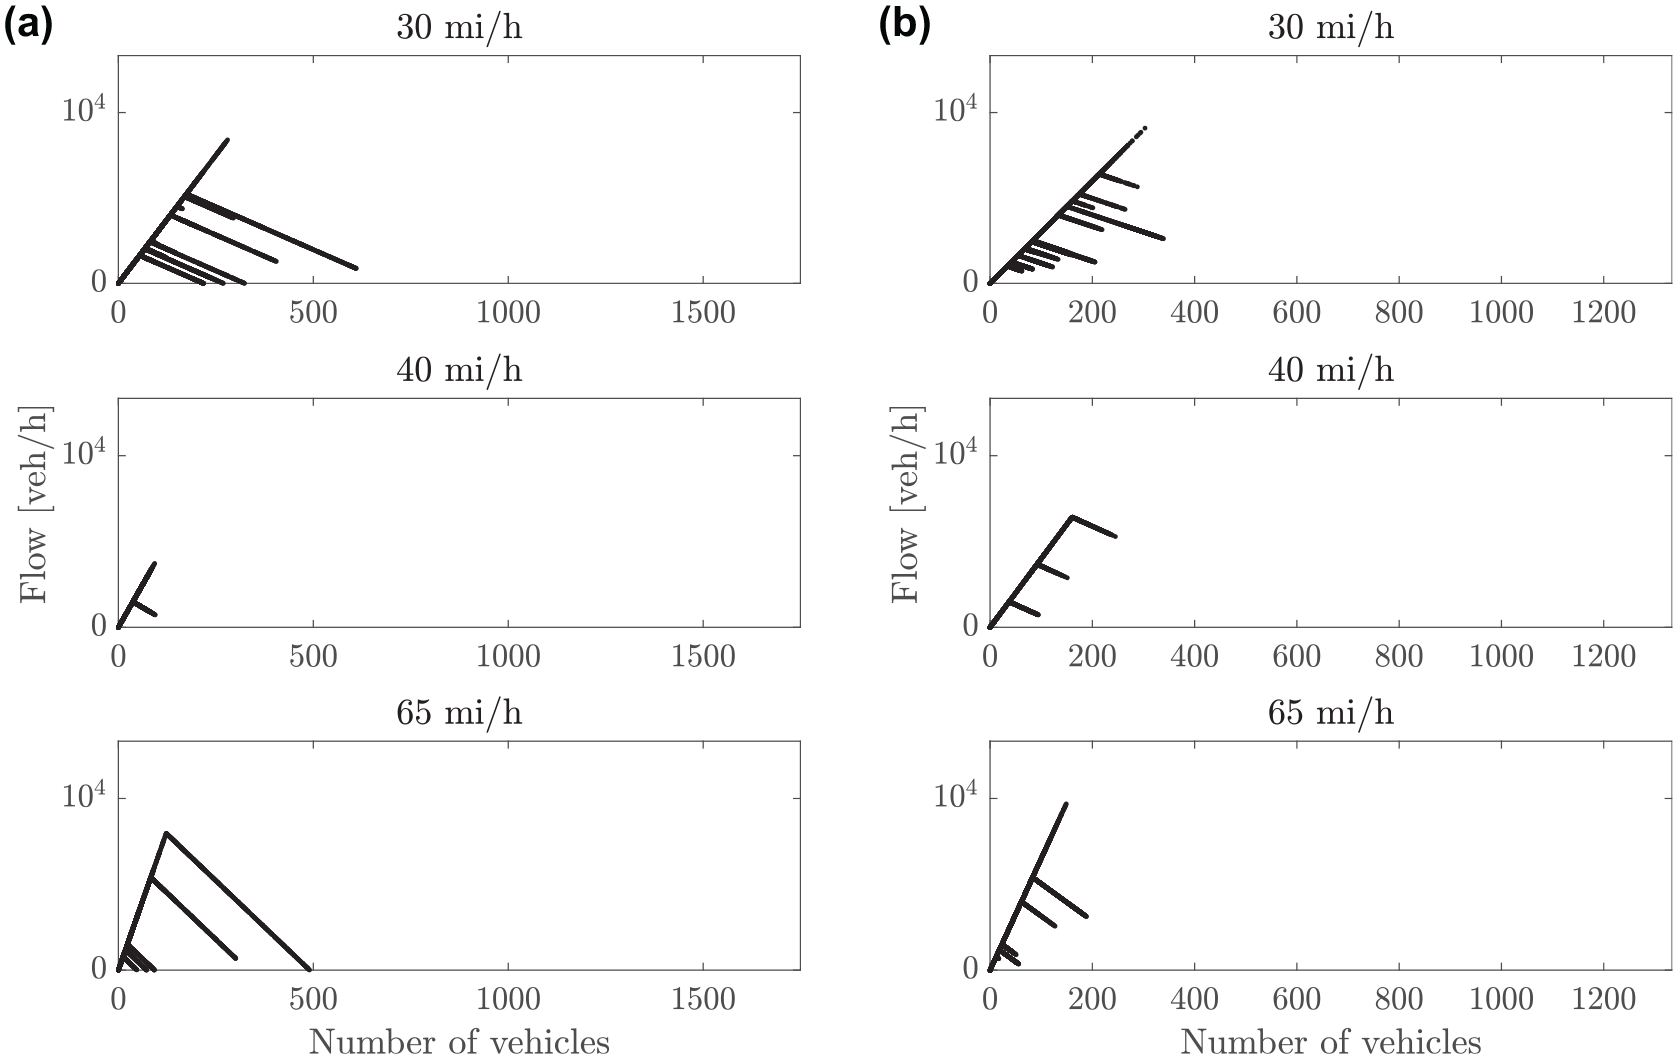
Fundamental diagram (expressed as number of vehicles–flow) for the links aggregated into four groups: 1) links with maximum speed 30 mph, 2) links with maximum speed 40 mph, and 3) links with maximum speed 65 mph. Results for (a) the baseline and (b) the proposed algorithm simulation.
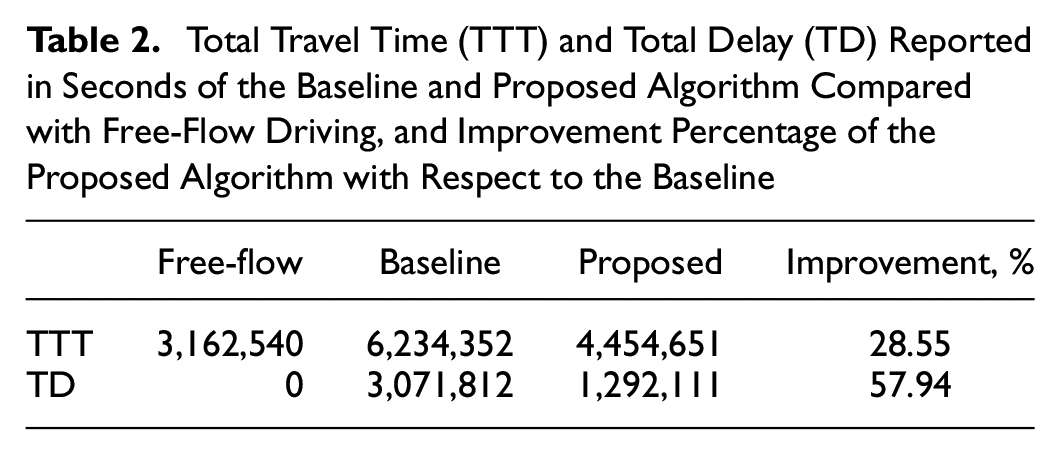
Total Travel Time (TTT) and Total Delay (TD) Reported in Seconds of the Baseline and Proposed Algorithm Compared with Free-Flow Driving, and Improvement Percentage of the Proposed Algorithm with Respect to the Baseline
Penetration Rate
In the following, we discuss how different penetration rates, specifically the percentage of vehicles that were CAVs, affected the behavior of our algorithm. To do so, we ran several simulations in which we randomly sampled the vehicles according to a given percentage of CAVs following the proposed algorithm, while the others followed the baseline algorithm, therefore they behaved like human-driven vehicles whose drivers had knowledge of the physical characteristics of the network (length of the links and maximum speed) but had no information about the possible congestion building up there. The parameters in use were
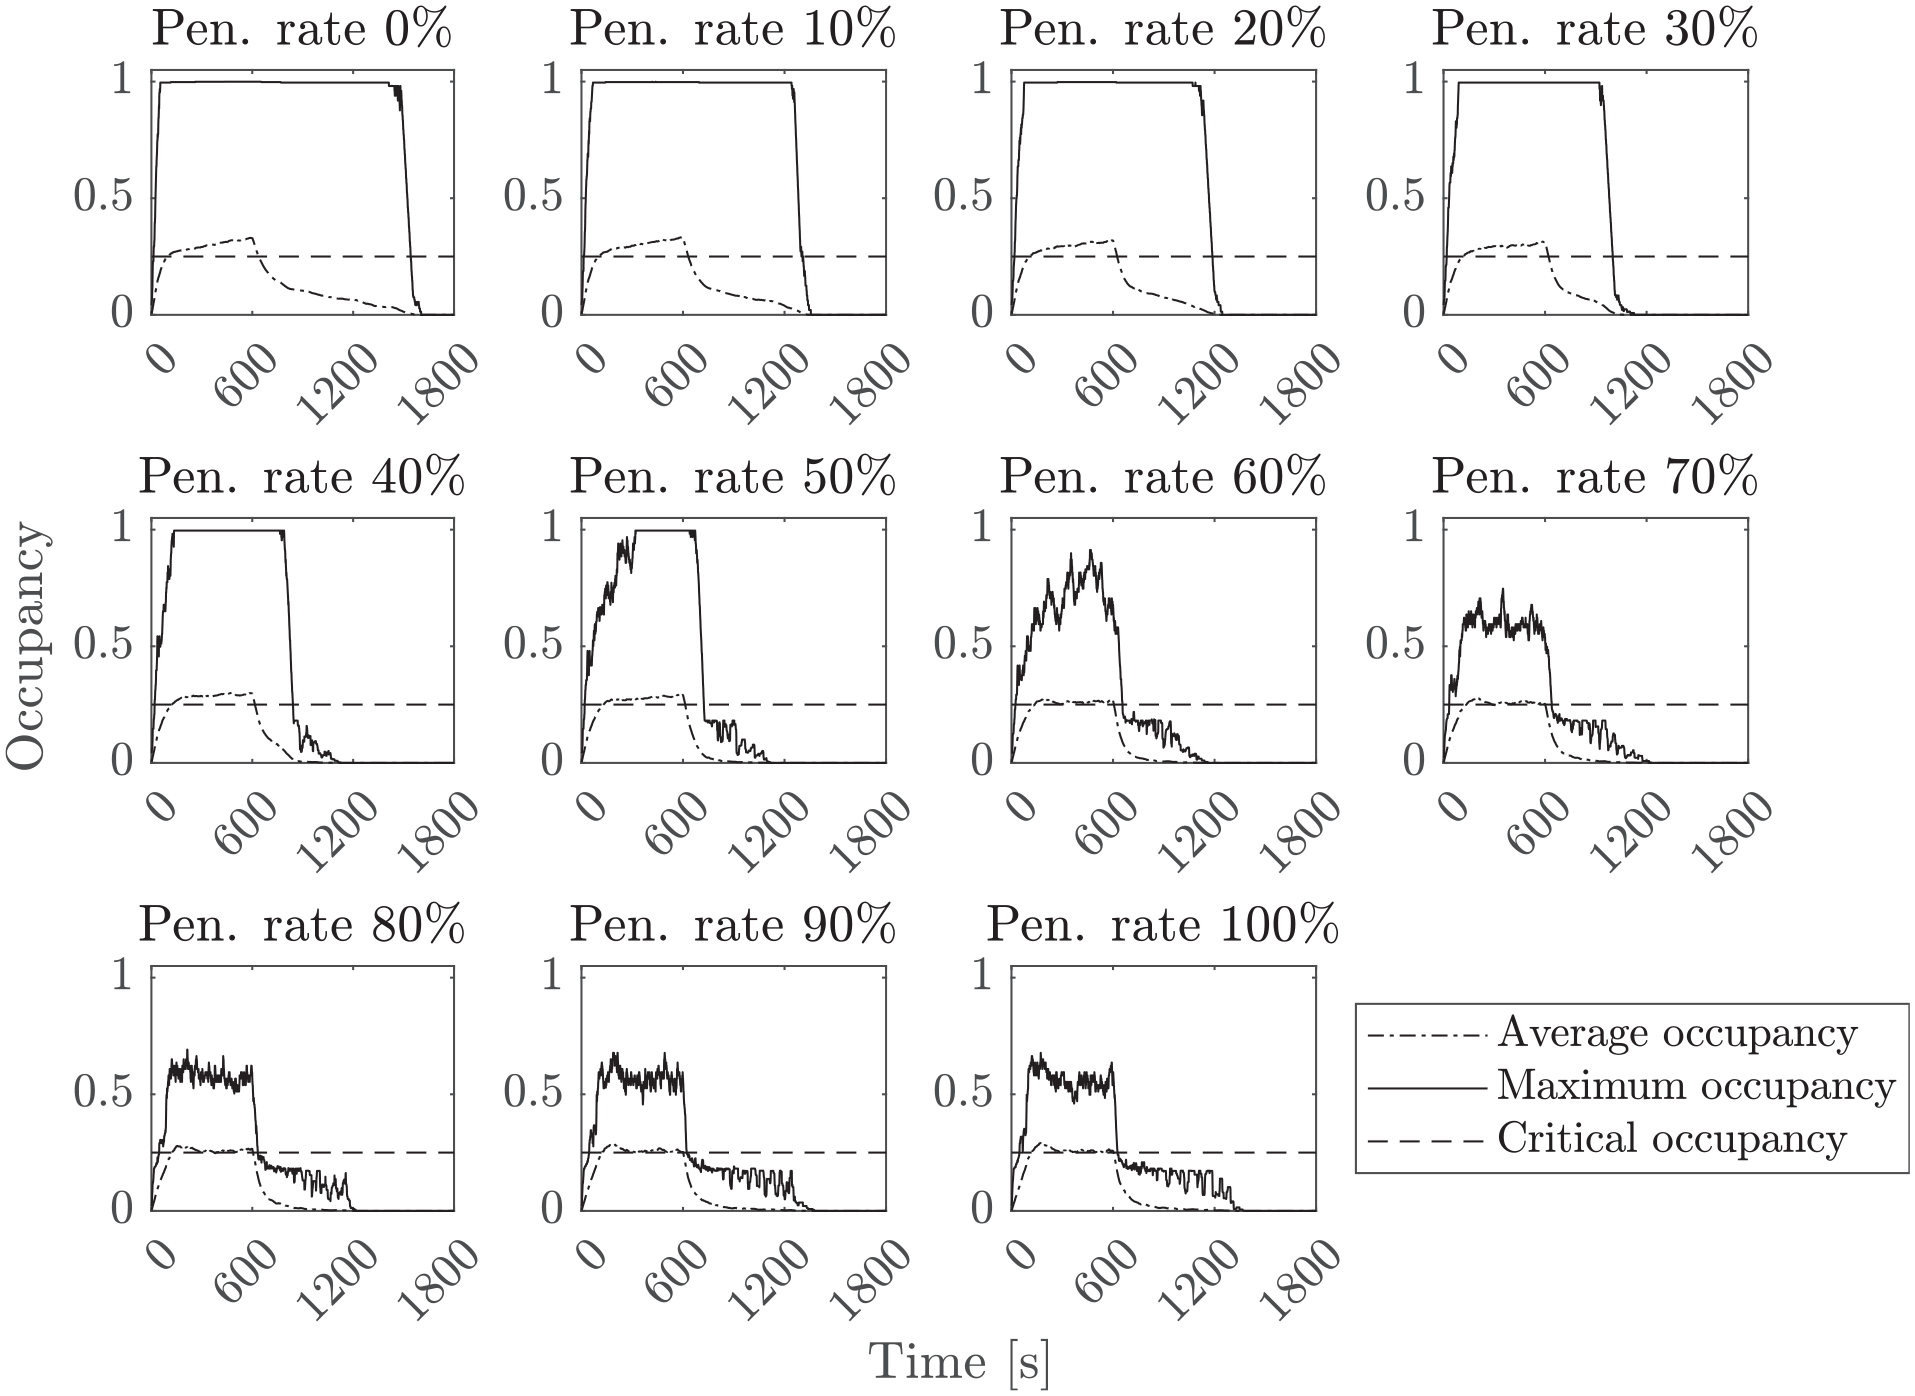
Maximum and average occupancy as the penetration rate varies.
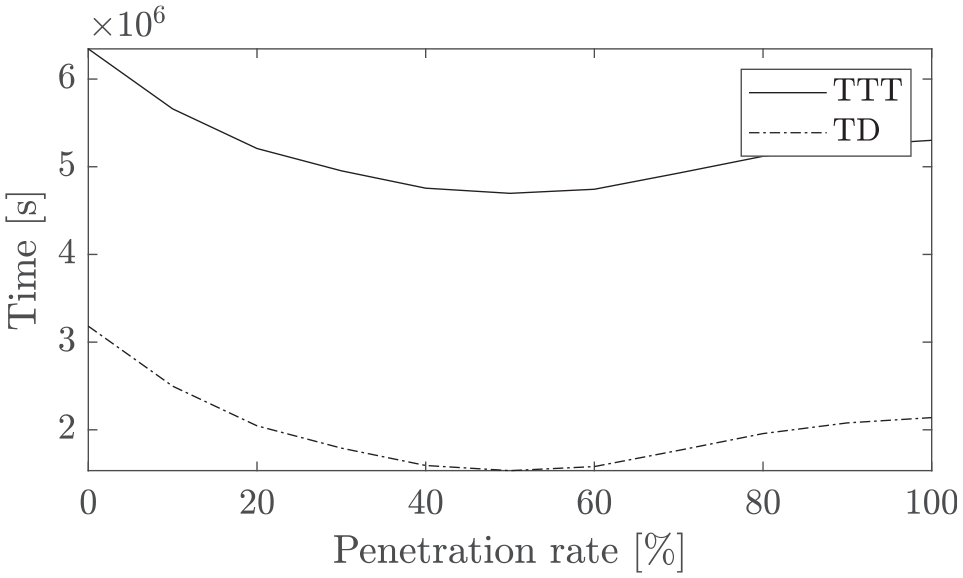
Total travel time (TTT) and total delay (TD) as the penetration rate varies.
Human Drivers’ Route-Switching Behavior
In our simulation experiments, we assessed the performance of the proposed algorithm for different penetration rates of CAVs, considering a percentage of human-driven vehicles that behave according to the baseline (all-or-nothing) assignment strategy. Nevertheless, the latter is a simplistic assumption that does not take into account the route changes made by human drivers. In fact, the UE usually assumes that human drivers behave according to some rational precepts of an objective to optimize, such as travel time. Early research studies (49) elaborated on the boundedly rational UE in transportation systems, claiming that it is appropriate to introduce a stochastic UE, occurring when users can no longer improve their perceived utility, which now includes a random component, presumably because of perception errors and other sources of randomness in system performance or user behavior. The existence of such a newly defined equilibrium is not guaranteed and strongly depends on the specific rule followed by the users. Such a rule determines the degree of user satisfaction with the current situation and, therefore, the willingness to not change path if unforeseen delays are experienced. Such a degree of satisfaction, however, falls within a certain range of outcomes delimited by some threshold. In typical day-to-day scenarios, and under heavy congestion, users will be pushed to adjust their perception of satisfaction and modify their routes. Such a modification should be permanent so that users are not obliged to make decisions frequently and it might lead to a new equilibrium which is, however, not unique. Owing to these complications and high uncertainty, it is worth considering such behaviors to extend this work in the future.
Sensitivity Analysis
We conducted a sensitivity analysis to assess the behavior and highlight possible trade-offs that may arise between guaranteeing the dispersion of the traffic to lighten the network and lowering the time delays for the CAVs. In particular, we aimed to investigate the results for
Congestion and Travel Time
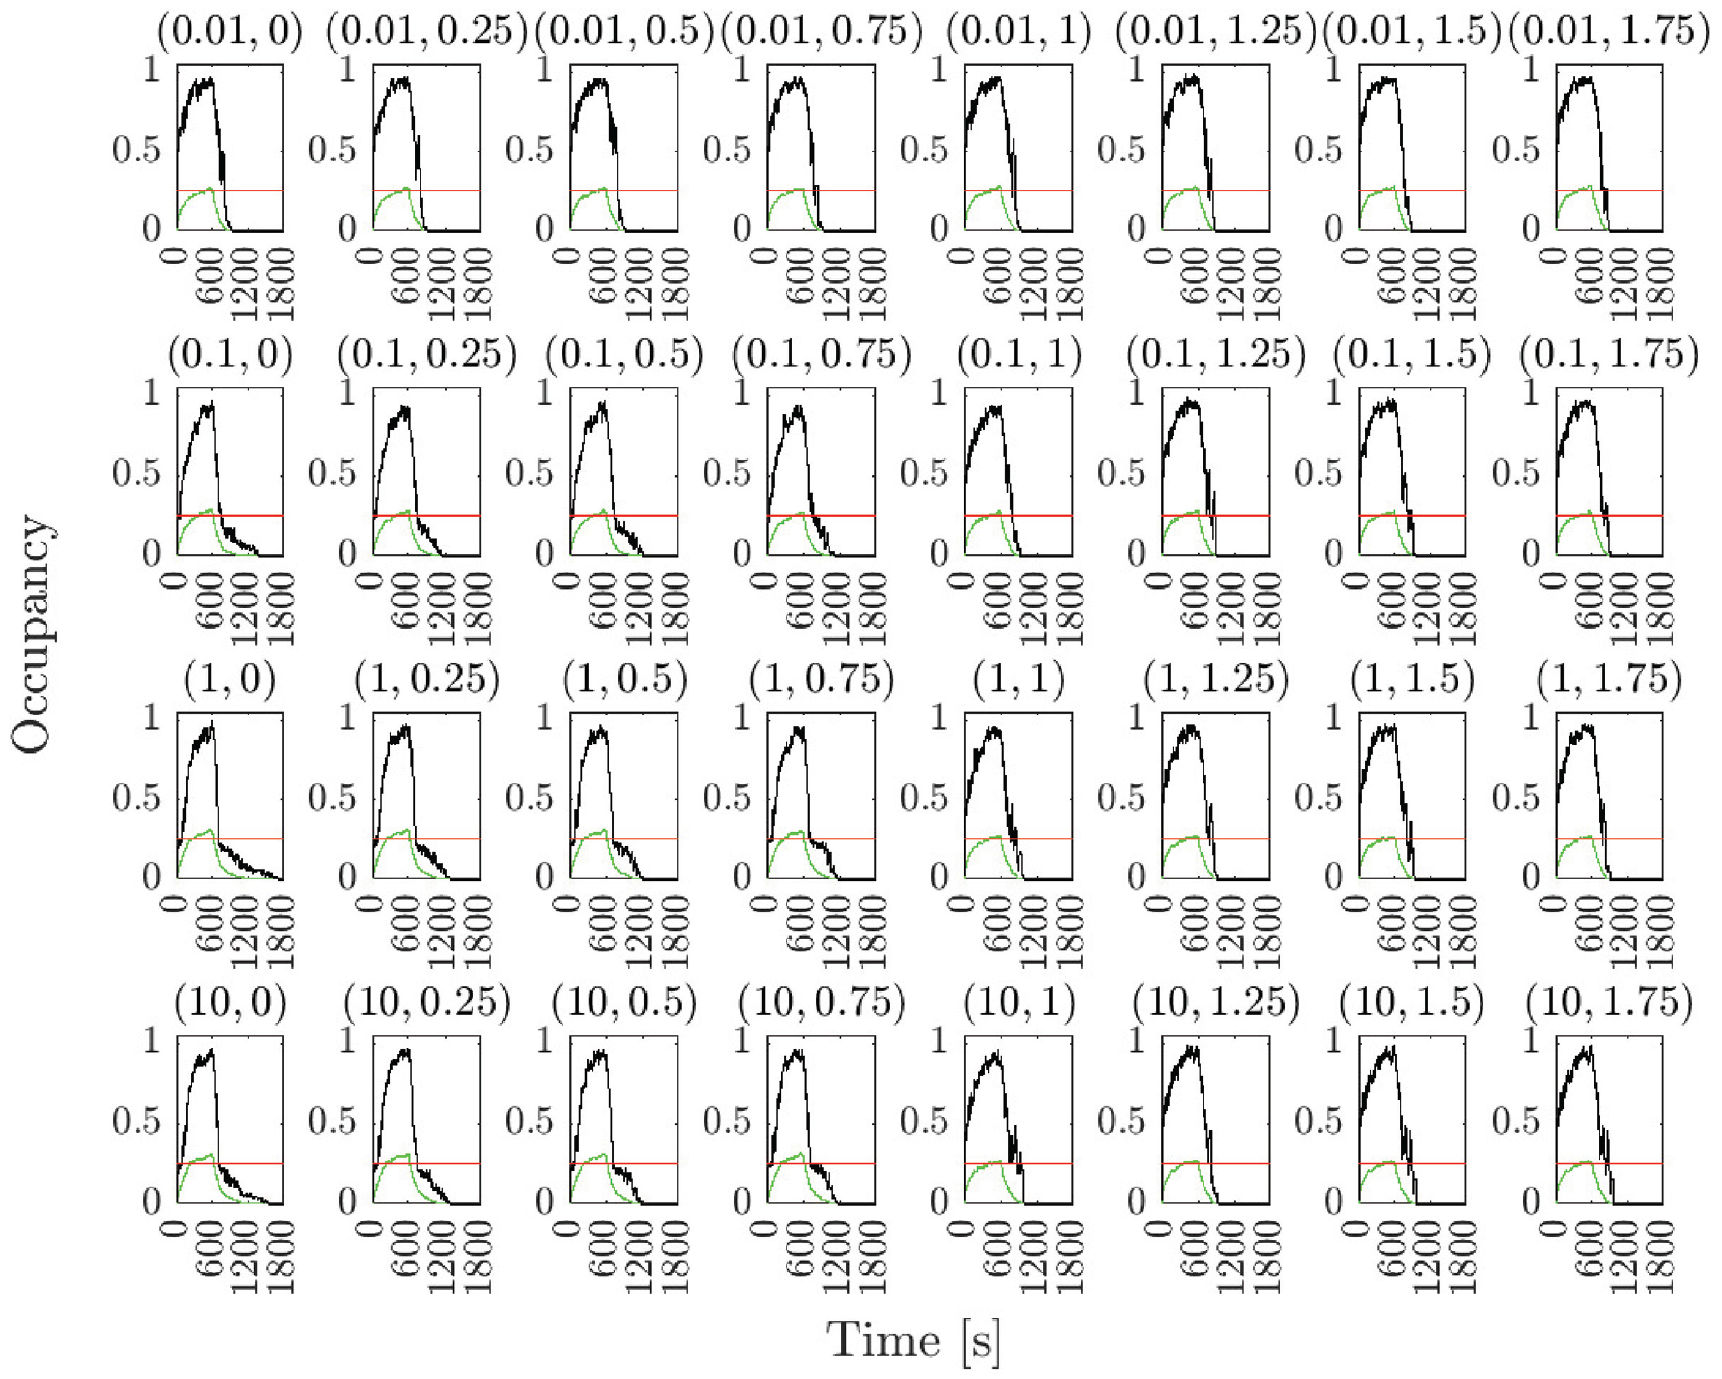
Figure 11 did not exhibit stark differences in the resulting occupancy while employing different parameters. We observed that, in general, higher
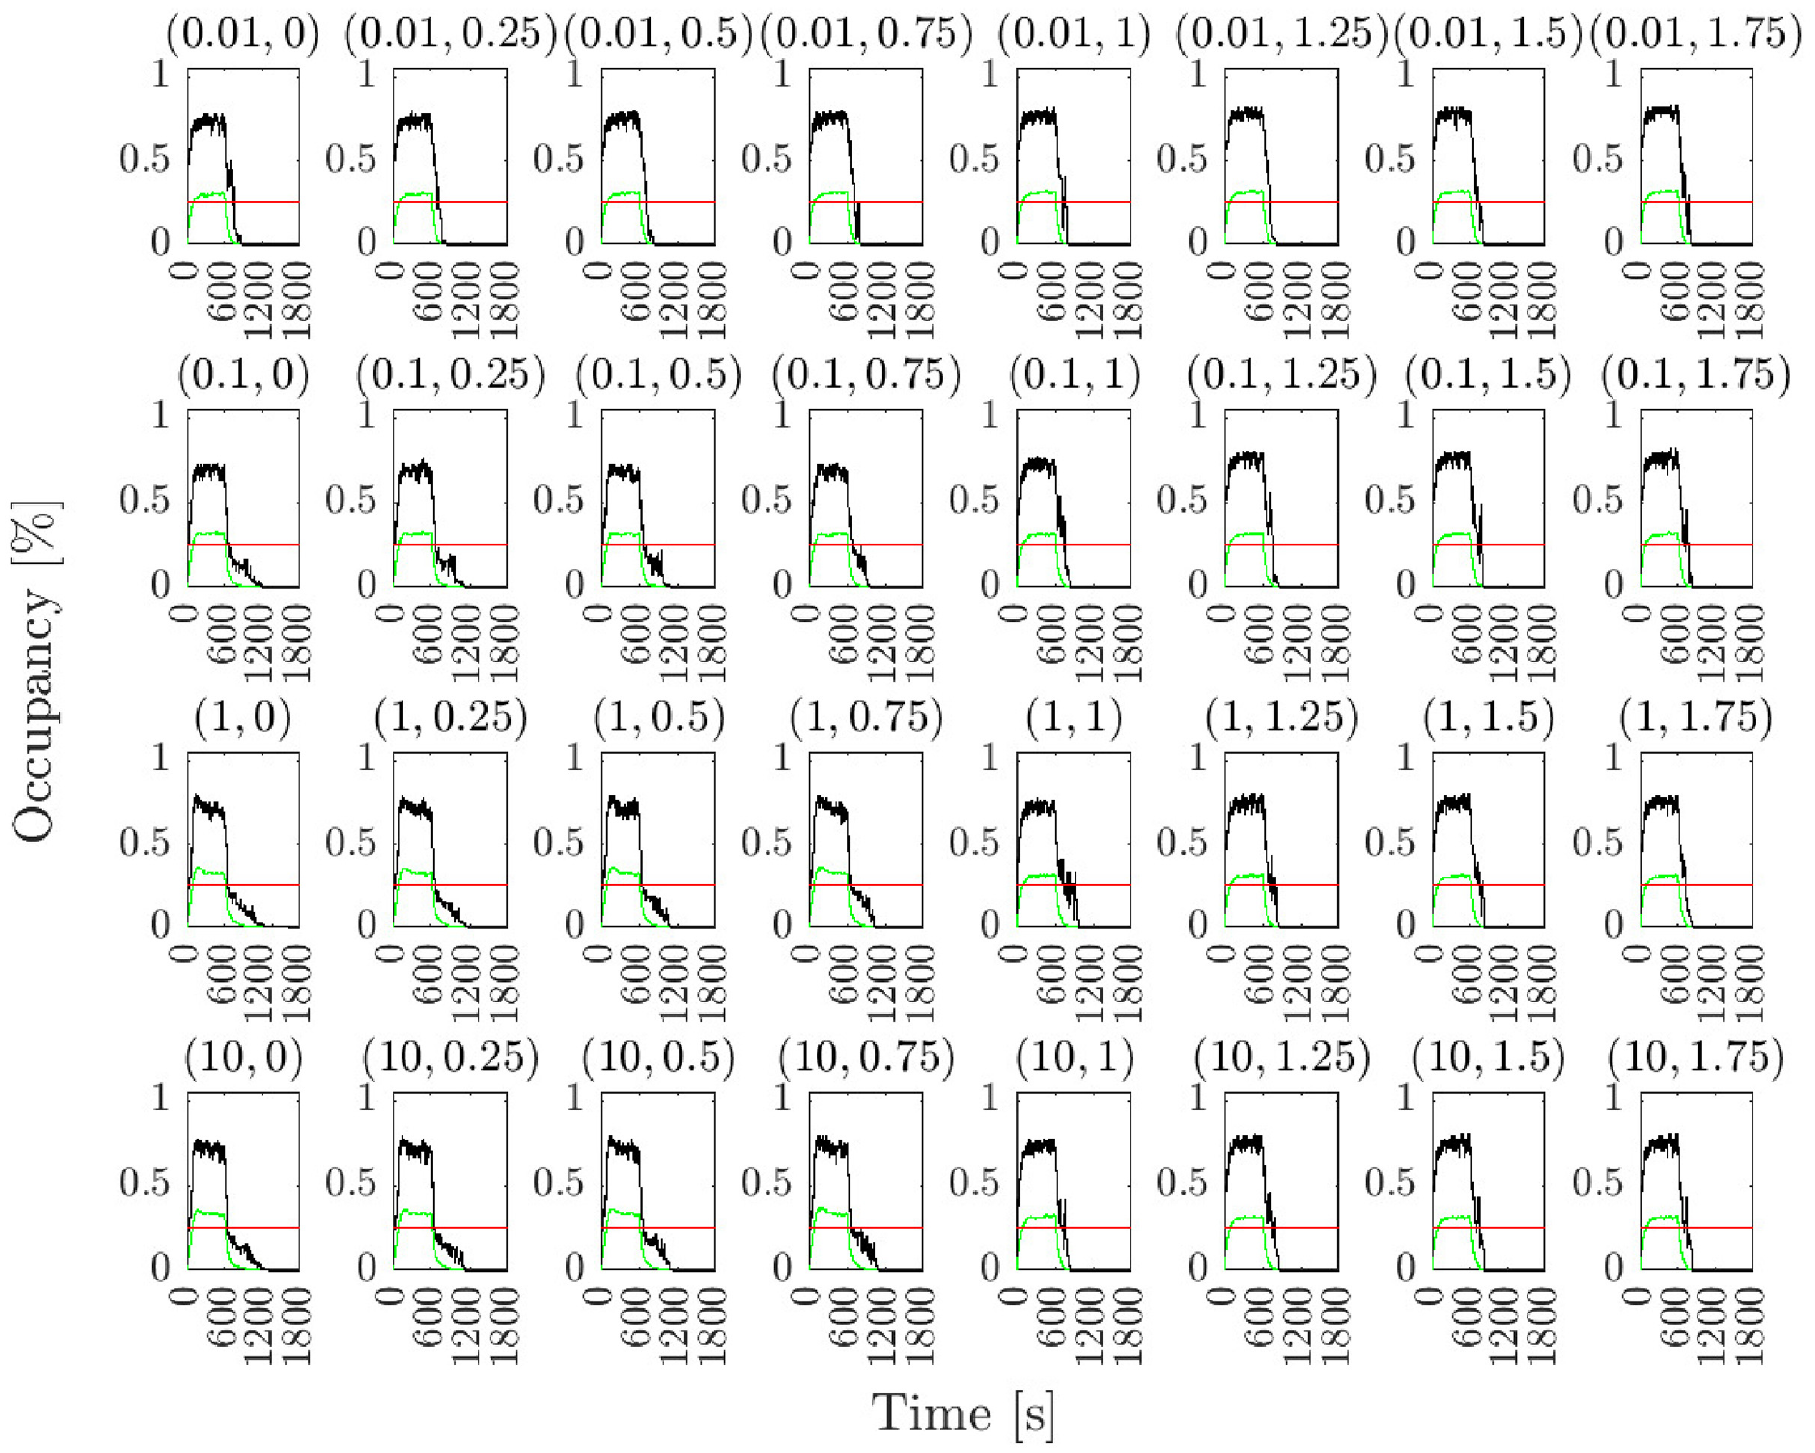
Maximum and average occupancy as the pair
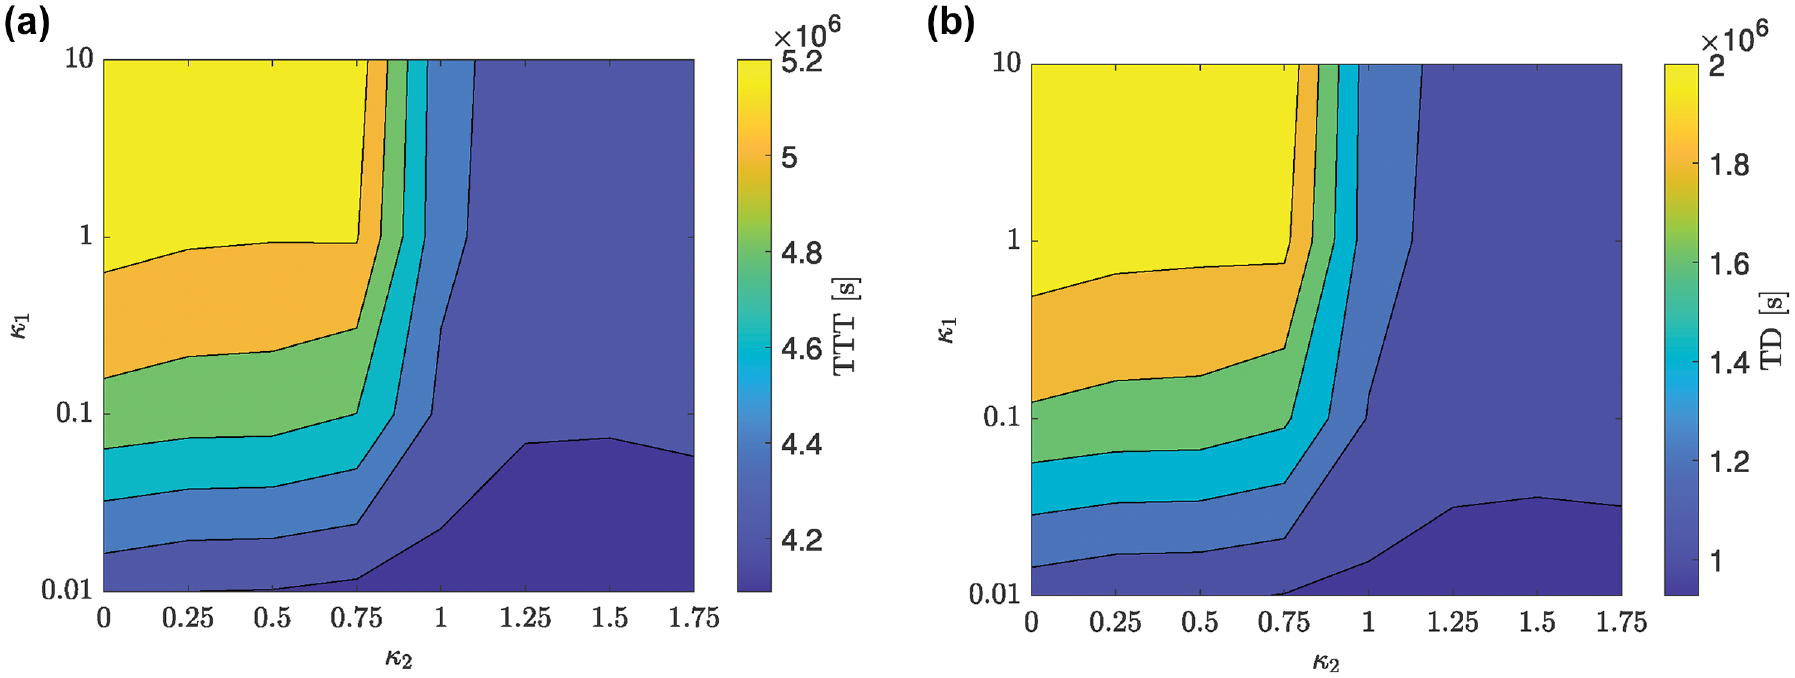
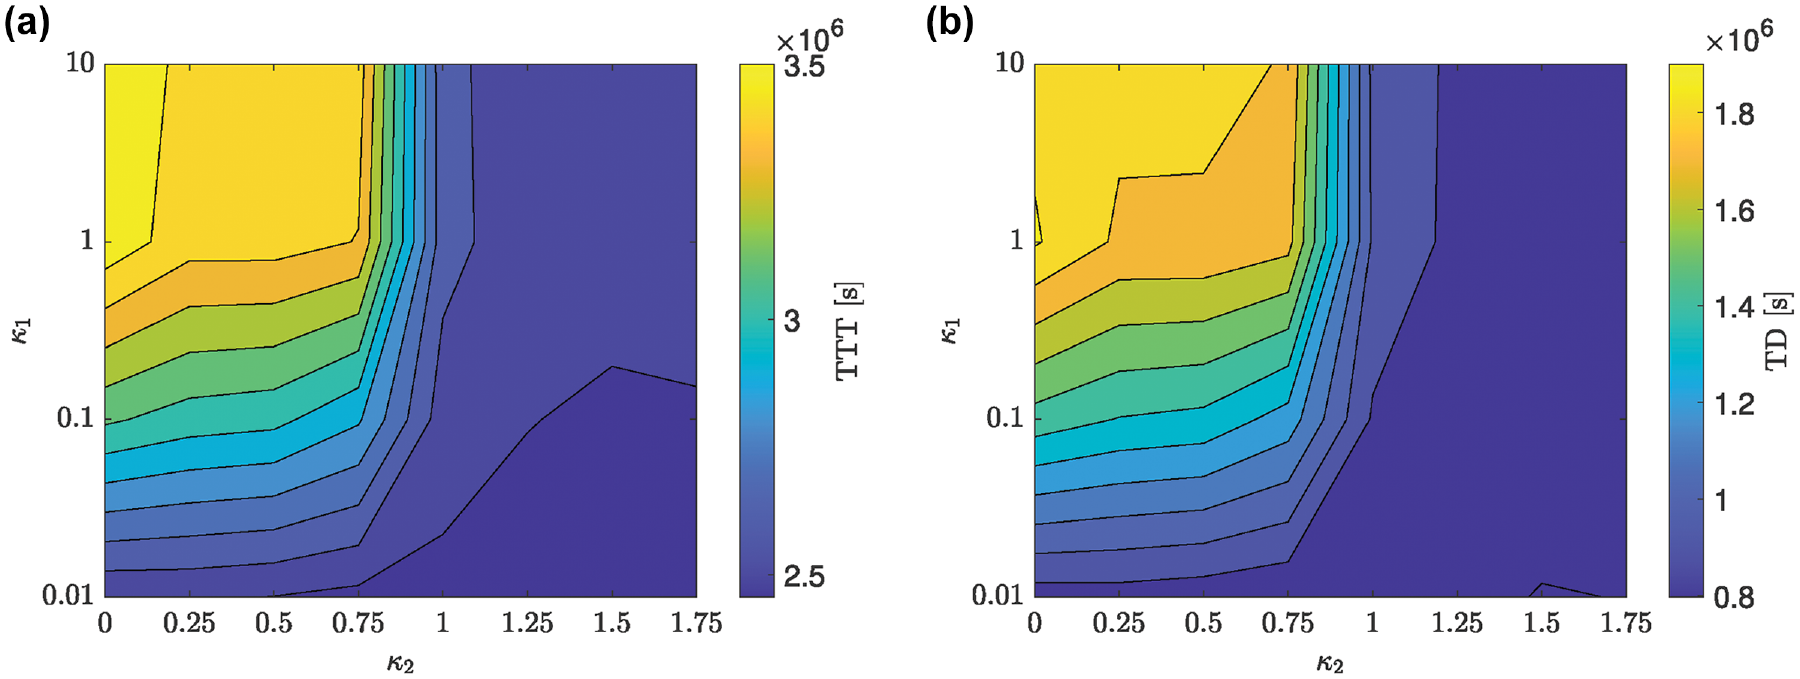
Total travel time (TTT) and total delay (TD) as the pair
Emissions
For a more comprehensive analysis of our method, we include some results about pollutant emissions. To this end, and in light of the previous sensitivity analysis, we chose
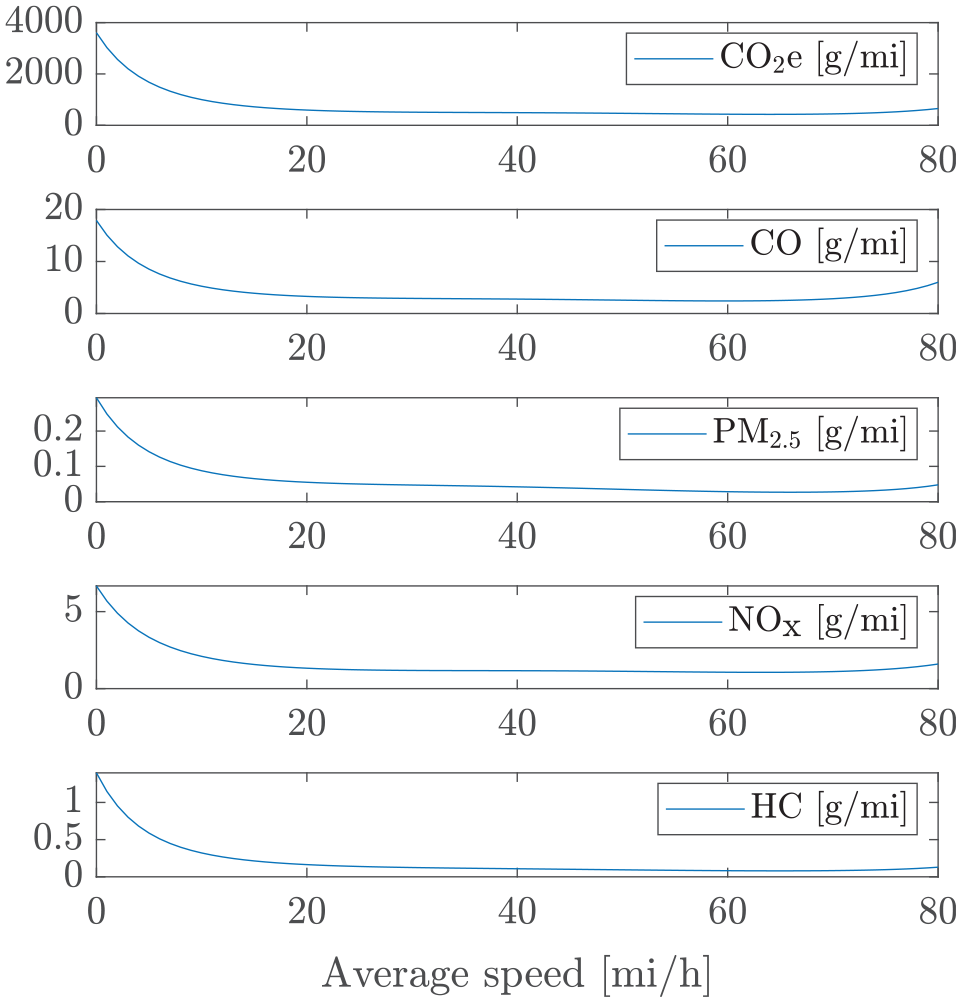
Emissions values referring to greenhouse gases in carbon dioxide equivalent units
Total Emissions, Mean, and Standard Deviation of Single Emissions (g/mi) for the Baseline and Proposed Algorithm, and the Percentage of Improvement for the Different Pollutants
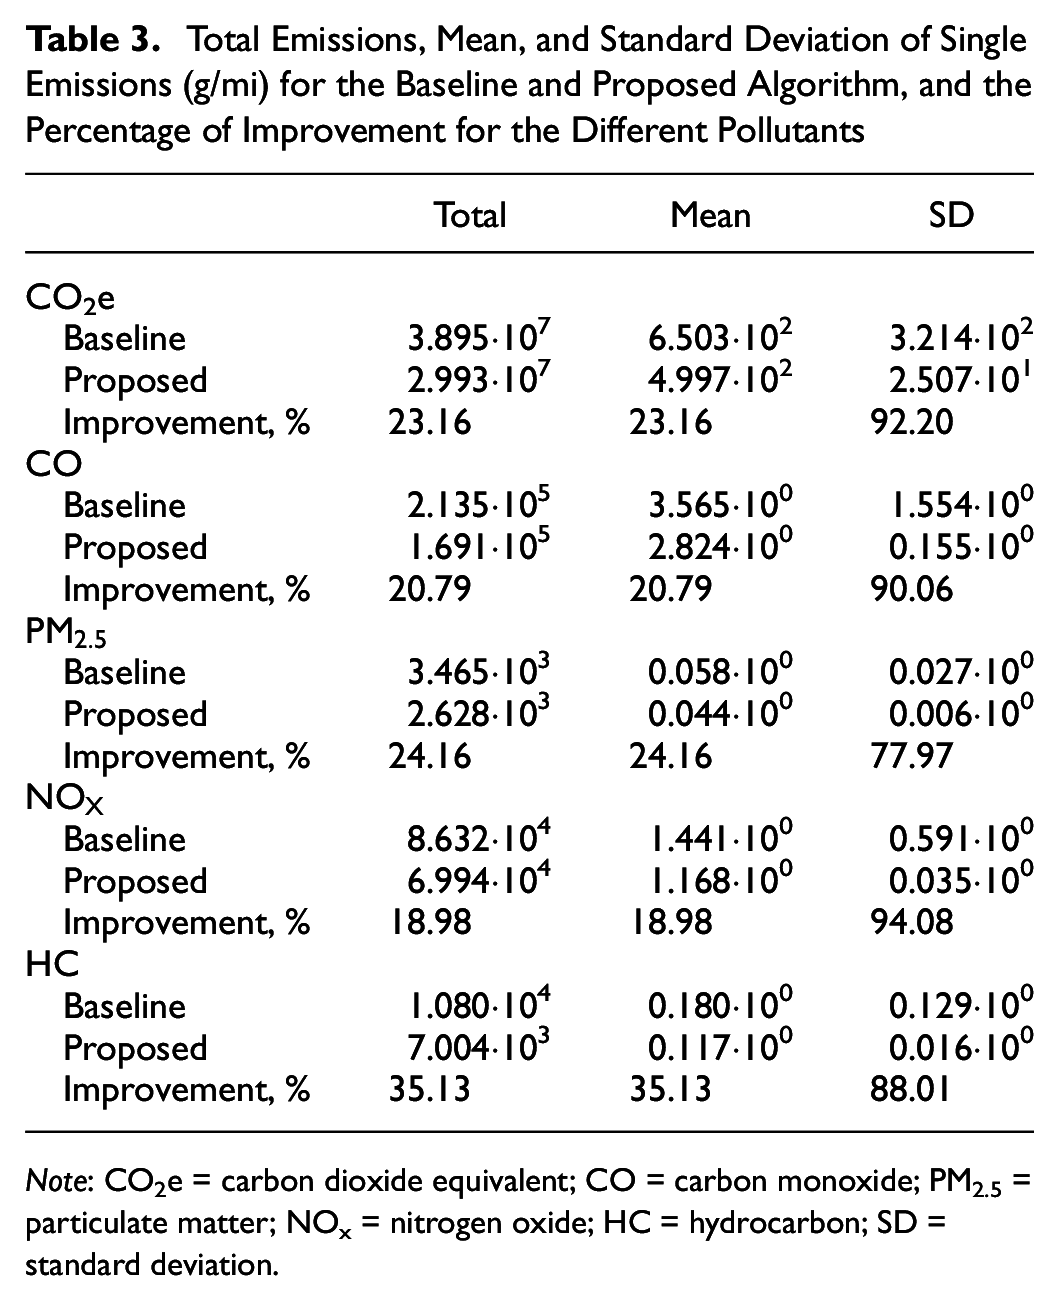
Note: CO2e = carbon dioxide equivalent; CO = carbon monoxide; PM2.5 = particulate matter; NOx = nitrogen oxide; HC = hydrocarbon; SD = standard deviation.
Applicability to Different Networks
Although our formulation implied the adjustment of a cost function based on some general properties of the network, namely the fundamental diagram of its links and related current number of vehicles and average speed, we determined that it would be interesting to conduct further research on the applicability of our method on networks with a different topology and evaluating the necessity of changing the parameters based on the findings. To investigate these issues, we employed a modified version of the Sioux Falls network to mimic the presence of a motorway along the Links 36, 32, 29, and 50 and in the opposite direction along the Links 55-48-27-33. We considered a free-flow speed of 65 mph and capacity of 7,000 vph on these links and deleted Links 10, 31, 25, 26, 22, 47, 34, 40, 28, 43, 30, 51, 49, and 52 to eliminate the intersections on the motorway. We also discarded traffic demand between the origin and destination nodes that did not match the new topology (e.g., vehicles departing from Node 10 and arriving at Node 16). The remaining settings were identical to those of the previous simulations with 10 min of vehicles entering the network for a total of 26,774 vehicles. Figure 14 shows that it took more than half an hour to discharge all the vehicles for the baseline algorithm. Figure 15 shows similar behaviors with respect to the previously obtained results, reinforcing the previous discussion about
Occupancy averaged by the whole network and maximum occupancy reached by any link in the network for the baseline algorithm simulation on the modified topology network.
Maximum and average occupancy as the pair
Total travel time (TTT) and total delay (TD) as the pair
Future Developments
We wish to summarize the future lines of research introduced by this paper. First of all, further investigation on the construction of the cost function is necessary. It would be particuarly interesting to evaluate a different factor to amplify the functions
Moreover, as already mentioned, to consider more realistic behaviors in the presence of human-driven vehicles, switching route patterns should be considered. In particular, defining or identifying the thresholds within which users would act in favor of the introduction of a boundedly rational UE could lead to the addition of new components in the proposed cost function.
Finally, it would be interesting to assess the resilience to communication delays, packet loss, and altered information exchange.
Conclusions
This study proposed a novel cost function applied to an algorithm for the rerouting of CAVs, showing its capacity to disperse traffic by constructing an appropriate cost function, which was then tested on a modified version of the Dijkstra algorithm. The cost function computed the cost to drive through a link between intersections, considering both the current travel time and the network situation given by the number of vehicles on each link. We designed our technique to be solved in a distributed fashion, allowing scalability at the cost of a small amount of data exchange.
We obtained convincing results for the effectiveness of the proposed algorithm as compared to a baseline technique in relation to both lowering congestion and decreasing the travel- and delay time for the CAVs. We investigated the results obtained with different CAV penetration rates, highlighting the trade-off between favoring system performance and lowering travel time by selecting opportune parameters of the proposed algorithm, since a higher percentage of CAVs would make the system so cooperative that self-interest would be dismissed. Furthermore, we conducted sensitivity experiments to shed light on how the algorithm parameters should be selected based on their ability to disperse traffic, and on the TTT and TD. Such analyses, carried out on two networks with different topologies, revealed similar patterns for the same sets of parameters. Selection of an appropriate set of parameters could be based on the main goal of the operation, namely, dispersing more traffic, anticipating congestion forming or worsening, or decreasing the current travel time, ignoring the effects on future congestion patterns. The different parameter choices did not lead to massive differences that undermined the validity of the proposed approach, on the contrary, all demonstrated massive improvements. Moreover, we further validated improvements in the performance of the proposed strategy by evaluating levels of emissions, which exhibited a substantial reduction with respect to the baseline.
Footnotes
Acknowledgements
The calculations presented were performed using the computer resources of the Aalto University School of Science “Science-IT” project.
Author Contributions
The authors confirm contribution to the paper as follows: study conception and design: F. Vitale, C. Roncoli; data collection: F. Vitale; analysis and interpretation of results: F. Vitale, C. Roncoli; draft manuscript preparation: F. Vitale. C. Roncoli. All authors reviewed the results and approved the final version of the manuscript.
Declaration of Conflicting Interests
The authors declared no potential conflicts of interest with respect to the research, authorship, and/or publication of this article.
Funding
The authors disclosed receipt of the following financial support for the research, authorship, and/or publication of this article: This work was supported by the Academy of Finland project ALCOSTO (grant no. 349327).