
Abstract
Pavement performance evaluation with respect to fatigue cracking has seen a major shift toward more rigorous mechanistic models that can capture the complex damage response of the mixtures more accurately. This study utilized two mechanistic methods (cohesive zone [CZ]-based fracture modeling and continuum damage [CD] modeling) to study the cracking behavior of asphalt mixtures and subsequently predict the damage-associated performance of pavements. A Superpave mixture designed for Brazilian highway conditions was selected to evaluate the two modeling approaches for the performance of the mixture when utilized as a surface course within typical Brazilian highway pavements. The mixture was first evaluated for its linear viscoelastic properties, and then the damage characteristics of the mixture were obtained through two different experiments: the semi-circular bending (SCB) beam test and the cyclic fatigue (CF) test. The SCB tests performed at different loading rates were used to obtain the model parameters of the nonlinear viscoelastic CZ model with a Gaussian damage evolution criterion, while the CF tests were performed at different strain amplitudes, and the mixture-specific damage characteristic curve and the fatigue failure criterion were obtained using the simplified-viscoelastic continuum damage model. From a design perspective, three pavement structures that varied in geometry (pavement layer thickness) and underlying layer properties were selected while retaining the same asphalt mixture. The three pavement scenarios were evaluated for the fatigue cracking performance from each of the mechanistic modeling methods. The results indicate that both methods rank the performance of the pavement structures in a similar manner, while the damage initiation and progression were seen to be different because of the different mechanics in modeling cracks.
Keywords
Pavement performance modeling with respect to cracking distress predictions has seen significant changes over the last couple of decades as researchers target more rigorous mechanics-based approaches to tackle the complex cracking phenomenon observed within the asphalt layer. The successful distress prediction within the pavement structure is inevitably tied to the accuracy and efficacy of the damage models used to describe the complex cracking behavior. Often, the performance prediction is carried out using a finite-element model ( 1 – 3 ) or a discrete element model ( 4 ) of the pavement structure while incorporating the required design aspects and the necessary layer properties that are directly used as inputs into the model. Such an analysis can be broadly classified as a single-scale modeling framework where the pertinent length scale is the pavement structure, and all the necessary inputs for the pavement model are known a priori or obtained through a series of field experiments, laboratory experiments, or both. Such a modeling framework for the pavement structure is quite useful, as the material properties need to be evaluated only once ( 1 ).
The main challenge of the single-scale pavement modeling approach arises when modeling damage within the asphalt layer. Damage in the form of cracks is a major type of distress that is most commonly observed within asphalt concrete (AC) pavements, which can be attributed to fatigue cracking, thermal cracking, and/or reflective cracking. Characterizing the cracking problem within the AC mixture is not an easy task as one needs to consider several different factors, such as heterogeneity, anisotropy, time-history-rate temperature-dependent behavior, and the presence of voids and their complex interactions that contribute to its behavior and as such exhibits a complex nonlinear damage response.
Within the purely mechanistic models utilized for damage characterization of asphalt mixtures, the continuum damage (CD) and the fracture mechanics-based modeling approaches are the primary methods. These two methods have been extensively used to model the complex damage response within AC mixtures and pavement structures. While both models target the damage prediction of the asphalt mixture while considering some of the factors mentioned earlier, they are fundamentally different with respect to how they treat damage and its evolution. When modeling bituminous materials using CD theories, they consider specific microscale behaviors (micro-cracking, moisture damage, healing, and nonlinear viscoelasticity, among others) through changes in the response from macroscale observations. Two pavement assessment tools have evolved significantly within the CD modeling framework which are the pavement analysis using nonlinear damage approach (PANDA) ( 5 ) and the layer viscoelastic continuum damage (LVECD) program.
Of interest to the current study is the LVECD program, which has its basis in the works by Schapery ( 6 , 7 ) and has been extensively developed to model the fatigue cracking response of asphalt mixtures ( 8 – 11 ). The LVECD program, now known as FlexPAVETM, is an outcome of the work of Eslaminia et al. ( 12 , 13 ). It incorporates the pavement structure as a three-dimensional finite-element method (3D-FEM) model, which is subjected to moving loads, and the fatigue damage within the AC layer is modeled using the simplified-viscoelastic continuum damage (S-VECD) model ( 14 , 15 ). FlexPAVETM has been successfully implemented to determine pavement performance with respect to fatigue cracking ( 16 – 18 ).
Another purely mechanistic approach toward the damage modeling of AC mixtures and pavements is based on fracture mechanics models that attempt to explicitly model the cracking phenomena. Central to this approach has been the use of cohesive zone (CZ) modeling to scientifically characterize the fracture process zone ( 19 , 20 ). Researchers have studied the rate-dependent ( 21 ), mode-dependent ( 22 ), temperature-dependent, and microstructural influence ( 23 , 24 ) on the fracture process within AC mixtures. More recently, researchers have incorporated the CZ modeling technique to investigate the fatigue cracking behavior ( 25 – 27 ) and the thermally induced reflective cracking ( 28 ) of mixtures within a pavement structure.
As described above, both methodologies have been shown to serve as powerful tools in the analysis and design of asphaltic pavement structures for fatigue cracking susceptibility. As such, the focus of this study is to use both modeling methods (i.e., CD modeling and CZ fracture modeling) for identifying AC mixture characteristics and predicting pavement performance. To that end, we chose a typical AC mixture and pavement structures common in Brazil and the model simulation results are compared, which can provide useful insights into each method.
Damage Modeling of Bituminous Mixtures
As outlined in the introduction, there are several approaches to modeling the damage behavior within viscoelastic composite media, such as AC, and the current study investigates two widely adopted approaches to modeling damage within such materials, which are the fracture mechanics-based CZ modeling and the CD modeling approach. The following section describes in brevity the theoretical background of the two methodologies adopted for the current study.
Cohesive Zone Fracture Modeling Approach
In the CZ modeling approach, damage is explicitly modeled to represent the complex fracture process zone ahead of a crack tip where the process of fracture is represented as a gradual phenomenon that ultimately leads to the creation of new surfaces (crack propagation). The CZ model is implemented within a finite-element description of the body in question where the model essentially describes the behavior of a mechanical element that depicts the explicit crack.
The current study utilized the nonlinear viscoelastic cohesive zone (NVCZ) model proposed by Yoon and Allen ( 19 ), which is shown to be effective in capturing the complex fracture response of AC mixtures ( 20 ). The NVCZ model’s behavior is essentially governed by a traction-separation law, which is depicted in Equations 1–3:
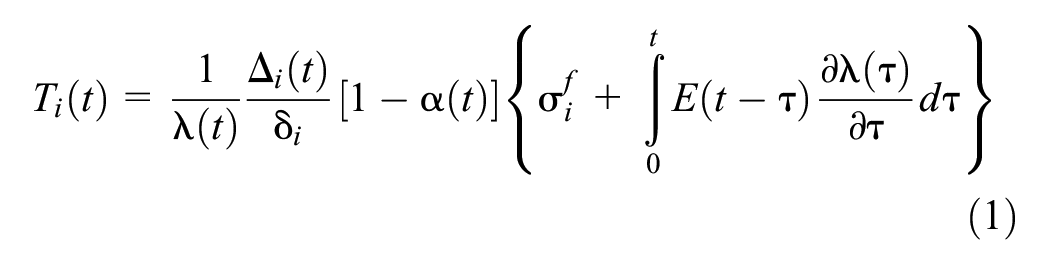
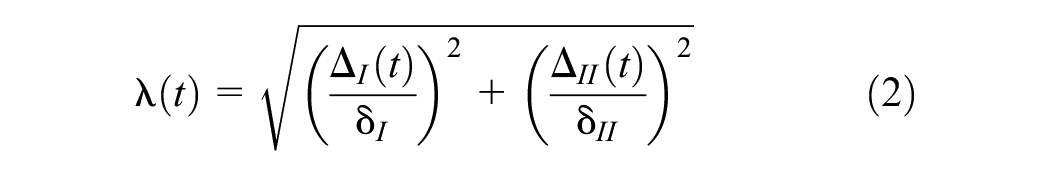
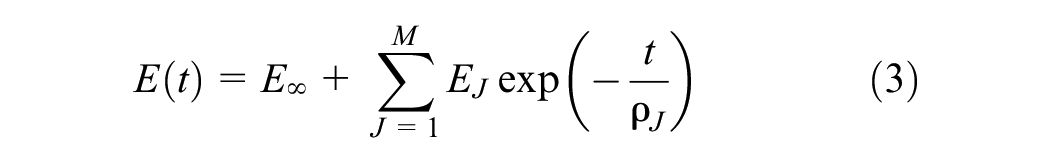
where
Different damage evolution criteria have been proposed and used to model the mixture fracture response. Recently, Kim et al. ( 26 ) and Kommidi et al. ( 27 ) demonstrated the application of a Gaussian damage evolution criterion to model the rate-dependent fracture response of bituminous materials. They showed that the model can accurately describe the predominant rate-dependent effects within asphalt mixtures and fine aggregate matrix using a single set of parameters within the Gaussian damage evolution model, shown in Equations 4 and 5 and used in this study to represent the rate-dependent fracture:
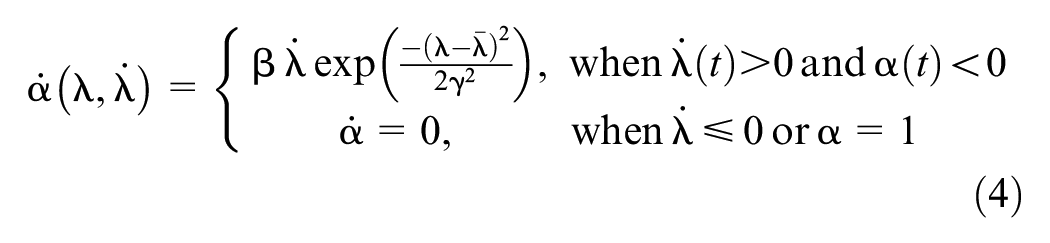

where
Continuum Damage Modeling Approach
Different from CZ modeling, the CD modeling method does not aim to explicitly characterize cracks; rather, the theory attempts to characterize the damage evolution from a structural integrity change. As such, the CD model characterizes the observed changes in the constitutive relationship as damage accumulates within the material from fatigue ( 14 ).
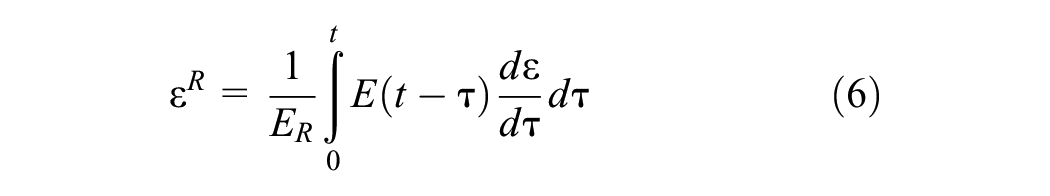
The current study incorporates the S-VECD model ( 14 ), which is based on three main theoretical concepts: (i) the elastic-viscoelastic correspondence principle; (ii) the CD mechanics-based work potential theory ( 7 ); and (iii) the time-temperature superposition principle with growing damage ( 29 , 30 ). The elastic-viscoelastic correspondence principle while utilizing the pseudo-strain concept allows one to reduce the viscoelastic behavior of the material into the corresponding elastic behavior. The pseudo-strain definition is depicted in Equation 6, which can essentially be thought to be the LVE stress. Central to the CD modeling approach is the work potential theory for modeling the effects of microcracks via internal state variables, enabling the material to be considered as a continuous and homogeneous body. The time-temperature superposition principle with growing damage combines the effects of time, rate, and temperature. The S-VECD theory quantifies the damage by using an internal state variable (S) that accounts for microstructural changes in the material, such as AC mixtures. The essence of the main components within the S-VECD model is described in Equations 6–9:


where ε
R
is the pseudo-strain; ε is the actual strain; E
R
is the reference modulus;
The relationship between the internal state variable that represents damage (S) and pseudo-stiffness (C) is known as the material-specific damage characteristic curve where C11 and C12 are the model coefficients. The damage characteristic curve (the C versus S curve) only defines the damage evolution within the material, so a fatigue failure criterion defining the material failure is necessary. Toward that end, Sabouri and Kim ( 31 ) proposed a fatigue failure criterion based on the average pseudo-strain energy release rate (G R ), which is calculated according to Equation 10:


where

where K1 is the loading shape factor,
Materials, Tests, and Mixture Properties
The current study utilized a Superpave mixture with a nominal maximum aggregate size of 19.0 mm; the gradation chart of the designed mixture is shown in Figure 1. The aggregates used in the composition of the Superpave mixture were granitic gneiss from a typical quarry in the state of Minas Gerais, Brazil. A performance grade (PG) 64S-16 asphalt binder was utilized for producing the mixture with an asphalt content of 4.51%. All the AC mixture specimens used in this study were laboratory produced, and three key laboratory tests (i.e., the dynamic modulus test, semi-circular bending [SCB] beam test, and cyclic fatigue [CF] test) were conducted to characterize the LVE constitutive behavior and damage-associated response, as detailed further in the next sections.
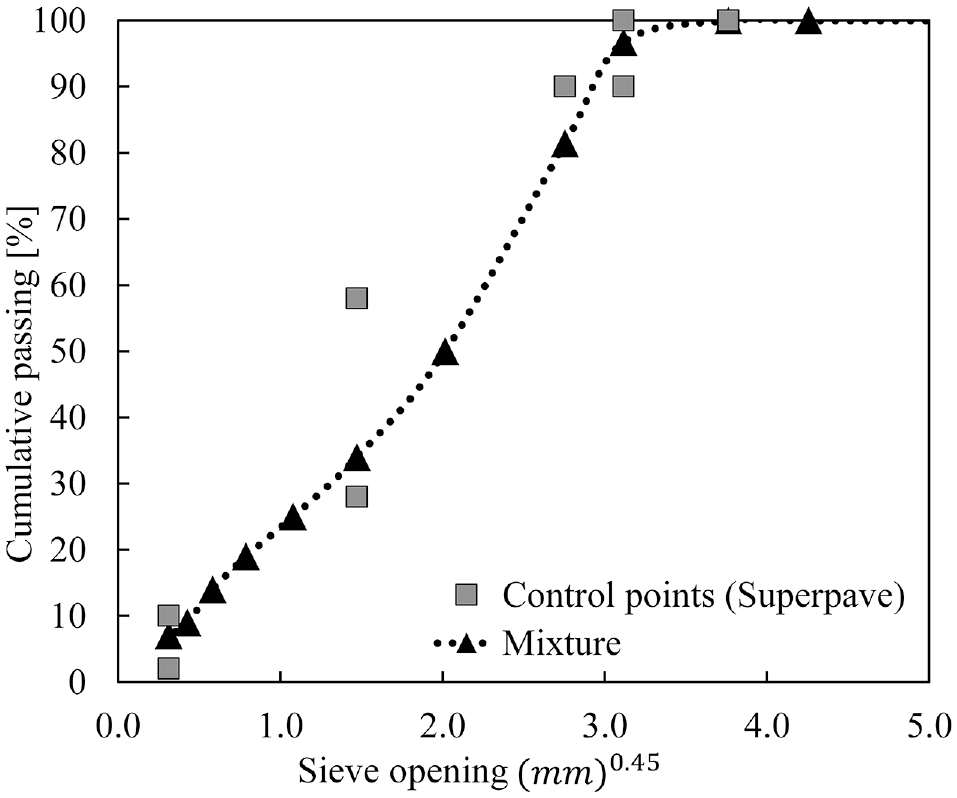
Gradation curve of the Superpave mixture selected in this study.
Dynamic Modulus Experiment for Linear Viscoelastic Properties of the AC Mixture
To characterize the linear viscoelastic constitutive behavior of the AC mixture, dynamic modulus (DM) tests in uniaxial compression were conducted on three replicate specimens following the standard AASHTO T 342. The test involved performing frequency sweep tests at different temperatures on a cylindrical specimen (diameter of 100 mm and height of 150 mm) with a target air void content of 5.5% ± 0.5%. Each sample was tested at frequencies of 25, 10, 5, 1, 0.5, and 0.1 Hz (from the highest to the lowest), which were conducted at temperatures of 4°C, 20°C, 40°C, and 54°C (from the lowest to the highest). An axial strain amplitude in the range of 50–75 μ-strains was applied to the specimens during the frequency sweep experiment to be well within the linear regime. To analyze the results, master curves of the dynamic modulus (|E*|) and phase angle (φ) at a reference temperature of 25°C were constructed using the time-temperature superposition principle and the corresponding shift factors. The resultant data was then used to fit a linear viscoelastic model using the generalized Maxwell model represented using the Prony series. The resultant fit to the experimental data and the relaxation modulus, E(t), are shown in Figure 2, a and b , respectively, while the Prony series parameters are presented in Table 1.
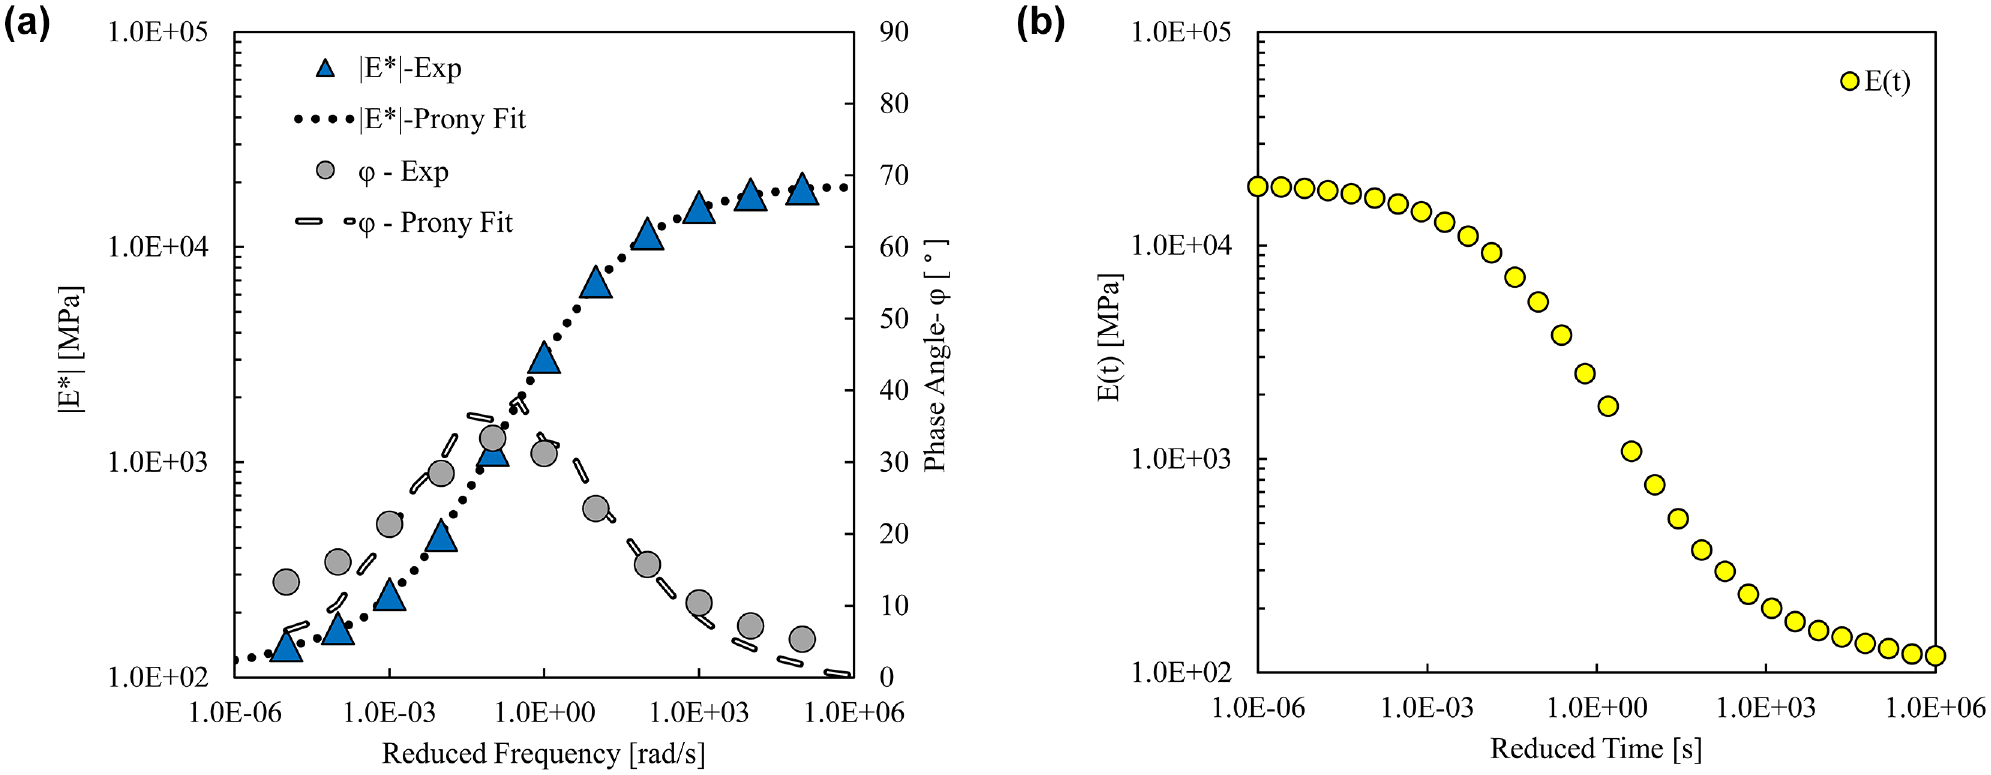
(a) Dynamic modulus and phase angle master curves with reduced loading frequency and (b) relaxation modulus E(t) (both at a reference temperature of 25°C).
Prony Series Parameters for the Asphalt Concrete Mixture
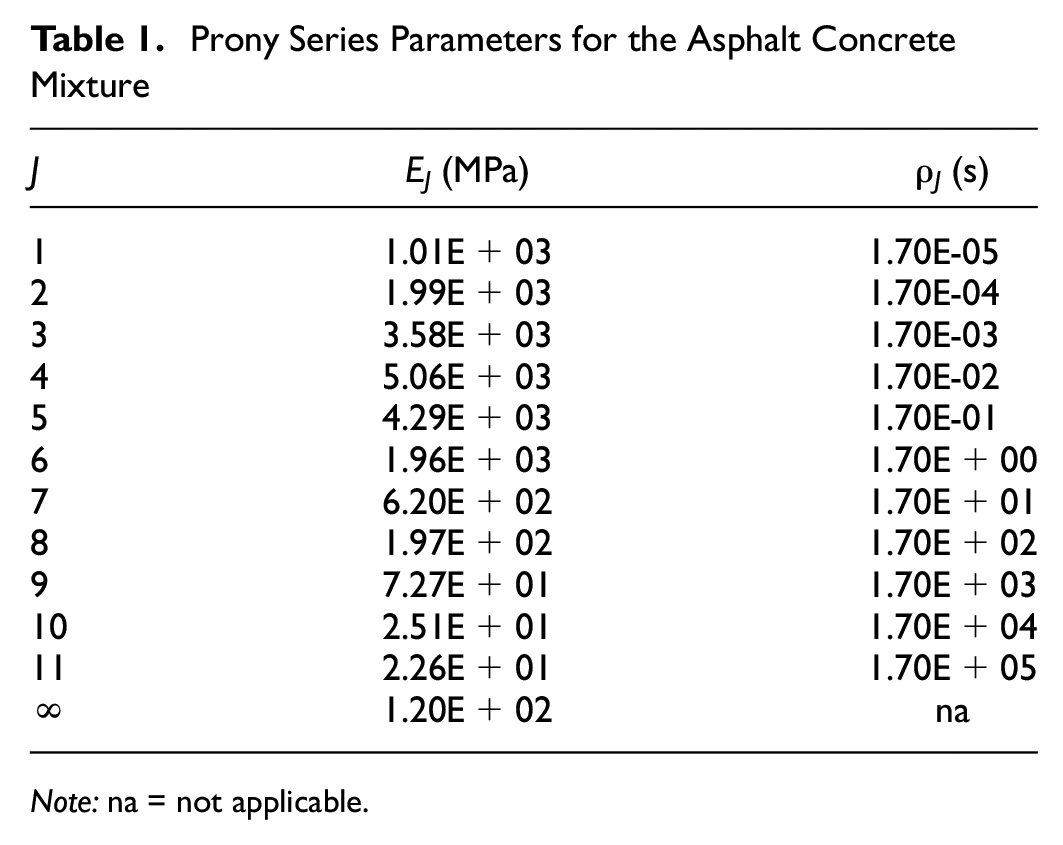
Note: na = not applicable.
Damage Characterization of the AC Mixture
For characterizing the damage response of the AC mixture, the SCB test and CF test were performed. The SCB tests performed at different loading rates were used to obtain the model parameters of the NVCZ model with a Gaussian distribution damage evolution criterion. The CF tests were performed at different strain amplitudes, and the mixture-specific damage characteristic curve and the fatigue failure criterion were established using the S-VECD model.
Semi-Circular Bending Test
One of the key experimental procedures for obtaining the fracture properties of the mixture is the SCB experiment. The relative ease, simplicity, and ability to prepare multiple specimens have made SCB testing attractive for characterizing the temperature-, rate-, and mode-dependent fracture properties of bituminous mixtures. In this study, the damage response of the selected mixture was obtained using a monotonic SCB experiment performed on mixture specimens with a diameter of 150 mm and thickness of 50 mm with a vertical notch (10 mm high and 2.5 mm wide). To capture the rate-dependent damage response of the mixture, SCB tests were performed at three different loading rates of 1, 10, and 50 mm/min at 25°C with three replicates for each loading rate.
To characterize the rate-dependent fracture properties of the mixture, the experimental results were calibrated using a finite-element model of the SCB testing while incorporating the NVCZ model depicted in Equations 1–5 to predict damage within the mixture. Figure 3 depicts the SCB model employed to simulate the experimental results. The finite-element model is a 2D mesh structure with boundary conditions applied to mimic the SCB testing. The 2D model was adopted in this study by assuming a homogeneous AC mixture, which deviates from the actual 3D nature of AC because of its microstructural heterogeneity, while the simplification provides the modeling efficiency. The load point displacement (LPD) boundary condition, similar to the loading rates specified during the experiment, is applied at the top node, and the bottom two nodes are restricted to allow only horizontal movement. The SCB mesh depicted in Figure 3 is composed of linear triangular elements equipped with an adaptive meshing strategy, which enables the activation of CZ elements. The central region was meshed with the smallest element size of 0.75 mm with increasing elements up to 5 mm at the edge of the specimen. The denser mesh above the notch is crucial to accommodate anticipated high-stress concentrations and crack initiation and propagation. To simulate the response at each loading rate, a time step size of 0.005 s was selected. The mesh geometry and time step were selected based on prior model sensitivity analysis. The viscoelastic properties identified from the dynamic modulus test were used for bulk elements, while damage within the mixture was incorporated through the NVCZ model described earlier. It can be observed that a finer mesh was utilized along the center line and around the notch to effectively capture the fracture process within the mixture because of the high-stress intensities. Also, it is noted that the same SCB mesh was utilized for simulating cases at different loading rates.
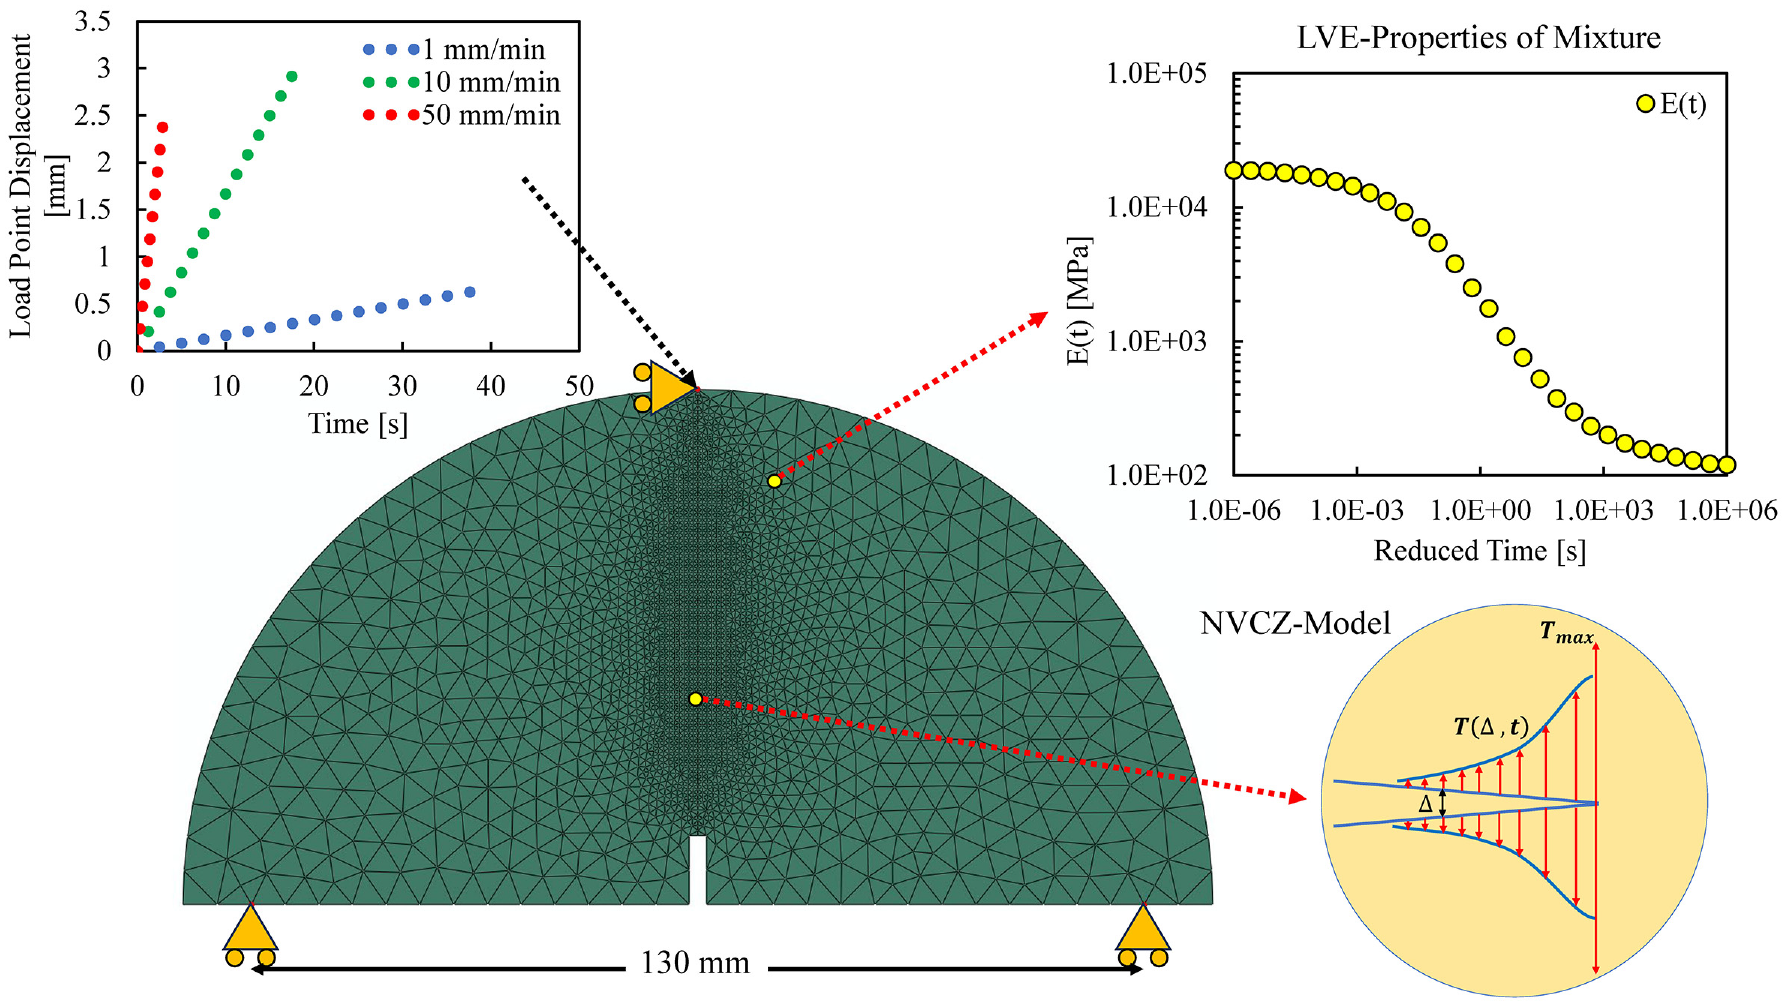
Semi-circular bending model depicting the mesh, boundary conditions, and material properties utilized for predicting the fracture response of the mixture at different loading rates.
The SCB simulation results are depicted in Figure 4, a–c, which shows the horizontal stress contour plot at the LPD of 0.1, 0.5, 1.0, 1.5, and 2.0 mm for loading rates of 1, 10, and 50 mm/min, respectively. From the figure, one can observe that the CZ elements are inserted adaptively during the simulation in regions where the critical stress state is reached. Moreover, the number of such elements being inserted in the region surrounding the notch is relatively different across different rates. This can be attributed to the development of a rate-dependent fracture process zone ahead of the notch within the SCB mixture. As shown in Figure 4a, lower loading rates of 1 mm/min result in a narrow region of the fracture process zone that is concentrated mostly above the notch, whereas in Figure 4, b and
c
, one can observe that the fracture process zone is larger in comparison and grows with the increasing rates. The figure also depicts the ability of the NVCZ model to capture the general process of fracture observed within AC mixtures, such as microcrack initiation, coalescence, and crack propagation, which is rate-dependent. The simulation results for the three loading rates are depicted in Figure 5, where the calibration process resulted in a single set of model parameters of
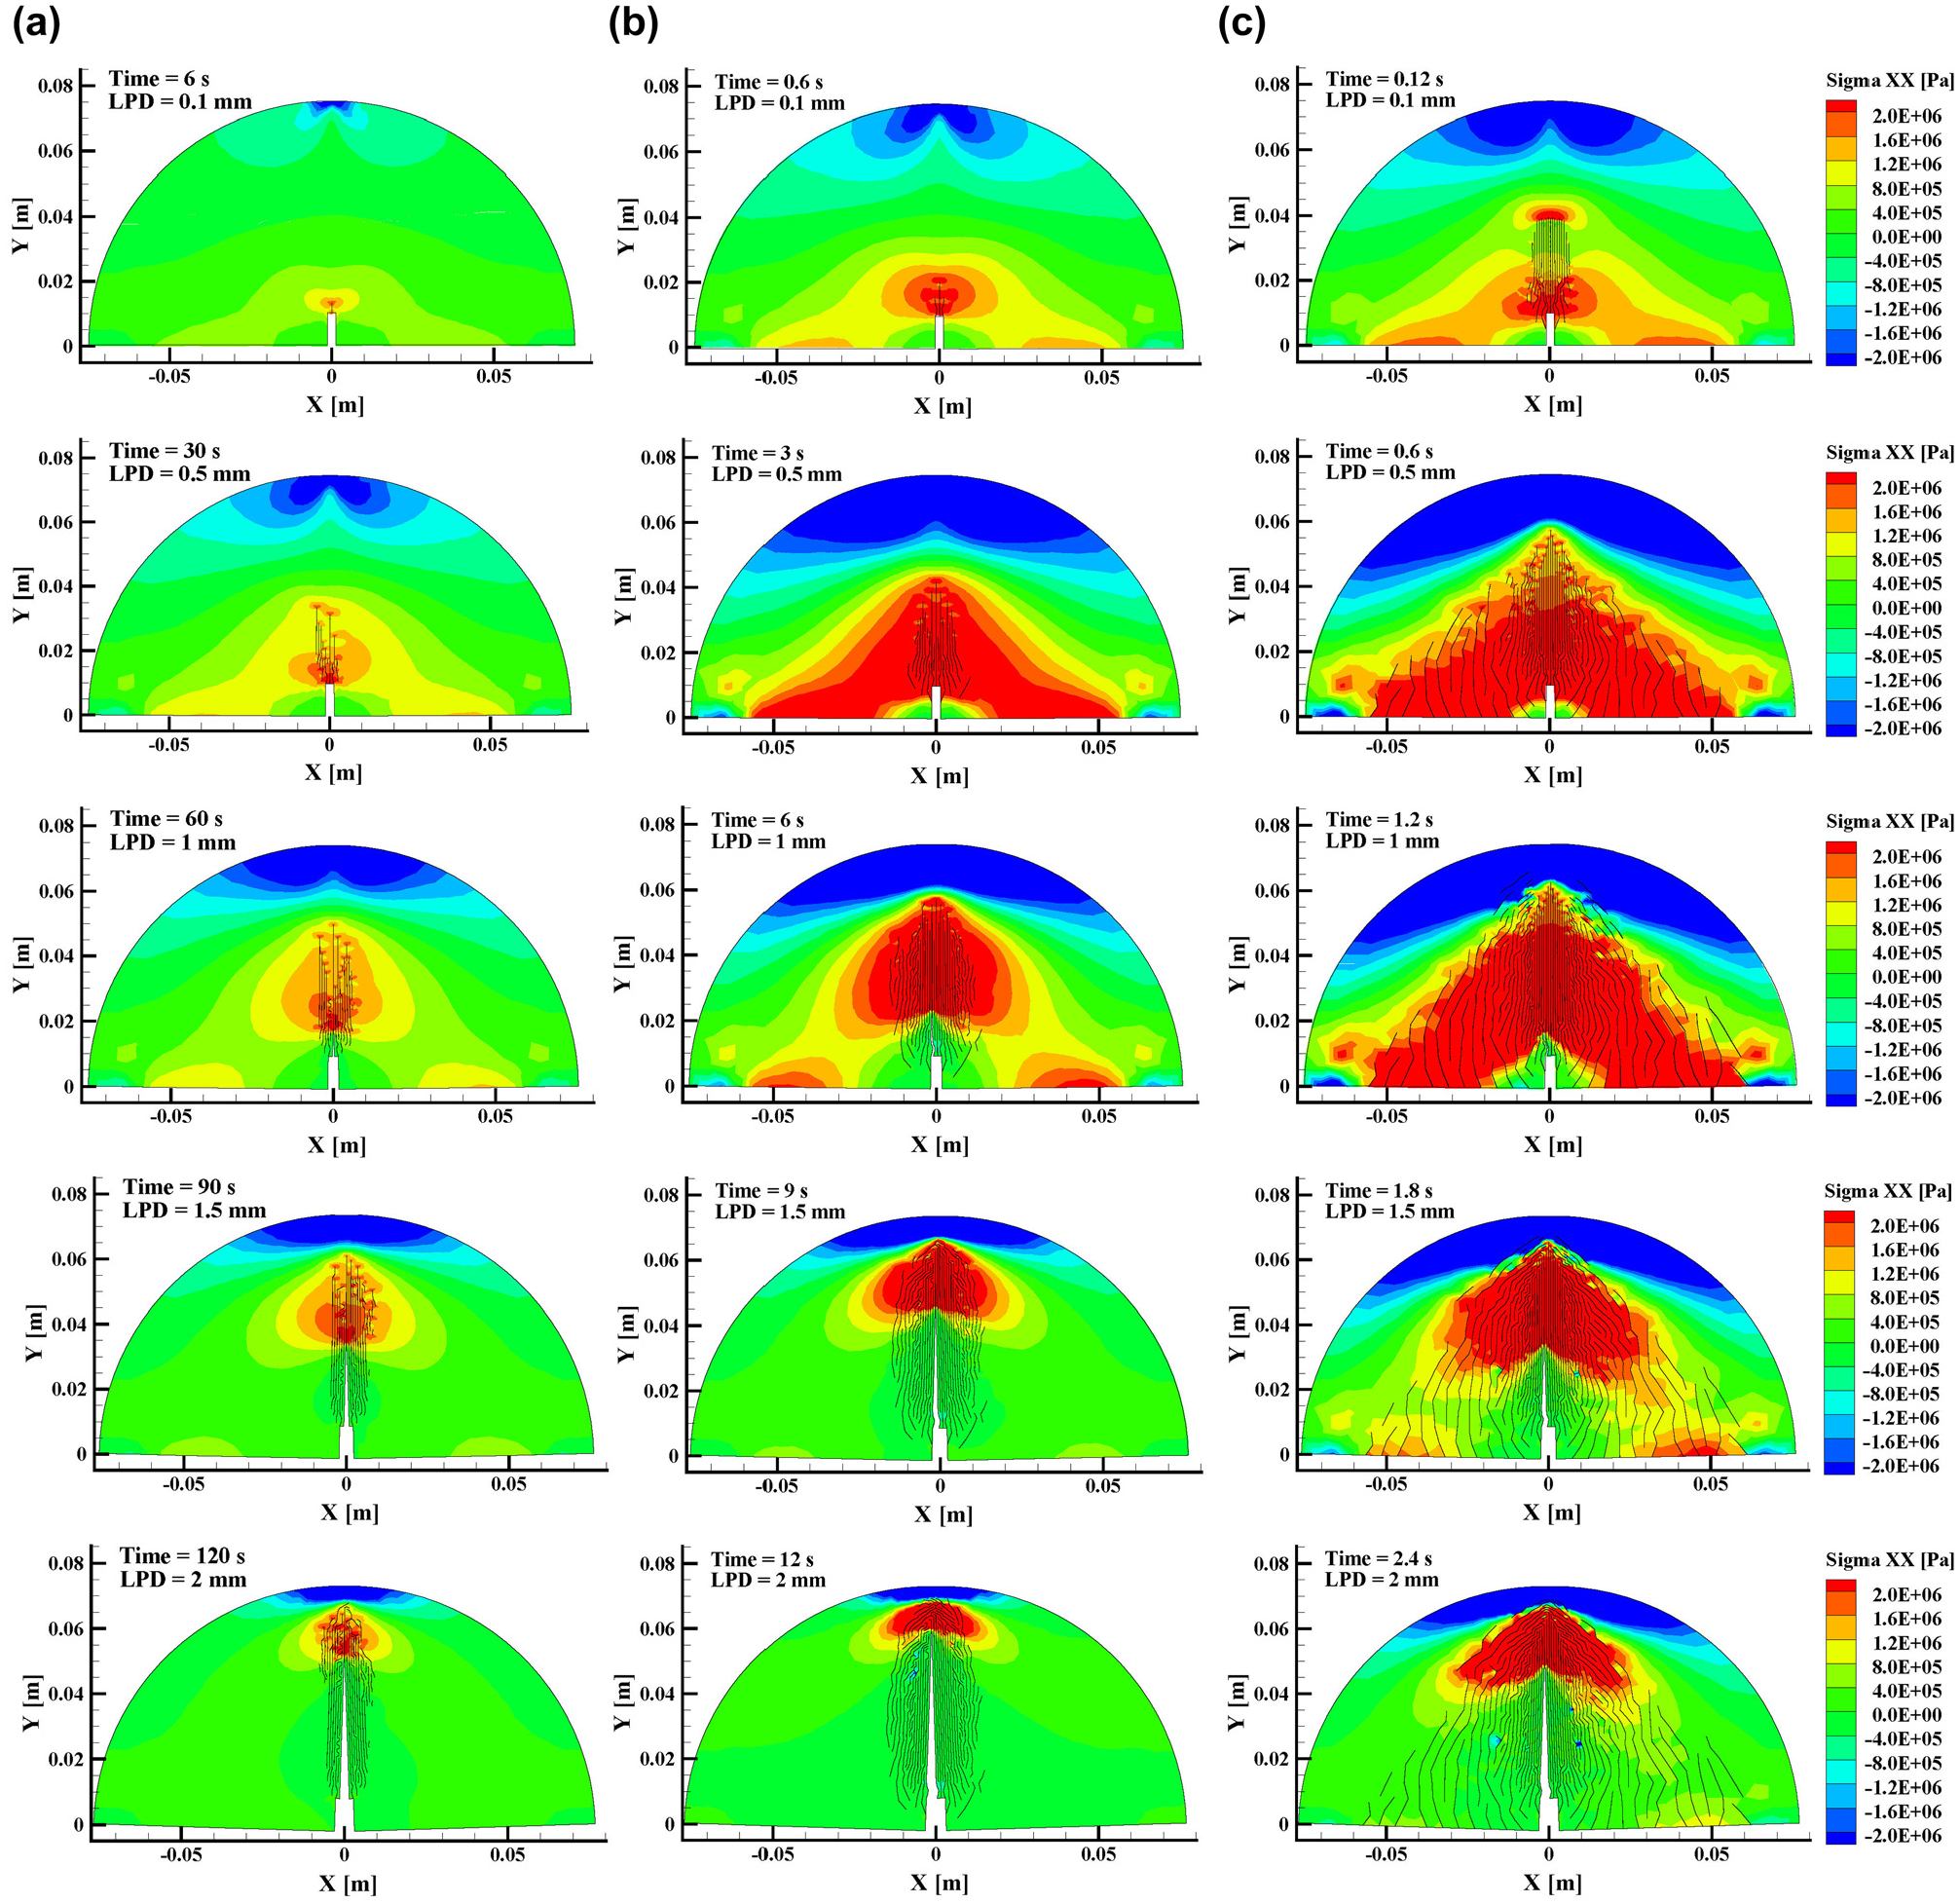
Horizontal stress contour plots within the semi-circular bending (SCB) model at different load point displacements (LPDs) of 0.1, 0.5, 1.0, 1.5, and 2.0 mm for different LPD rates: (a) 1 mm/min; (b) 10 mm/min; (c) 50 mm/min.
Figure 5 presents load–LPD results between the finite-element model using a single set of CZ model parameters and the SCB experimental data. It should be emphasized that a single set of NVCZ model parameters is sufficient to capture the damage response of the AC mixture over a wide range of loading rates (1–50 mm/min), unlike some other CZ models that require different sets of parameters for different loading rates ( 21 – 23 ). As shown in the figure, the model calibration process resulted in a reasonably good estimate of SCB cracking response at different rates. The observed deviations between model prediction and testing are to be expected considering several assumptions and limitations at this stage. The finite-element modeling is limited as it assumes a homogenous AC mixture in comparison to the highly heterogeneous nature. It can be noted that SCB simulation of AC mixtures can be conducted considering the mixture heterogeneity, as demonstrated in prior work ( 23 , 32 ). However, the methodology outlined in the previous works necessitates the consideration of the AC heterogeneity in the pavement model too, unless adopting a method such as the multiscale approach ( 33 – 36 ). This was not pursued in this study as both the direct numerical modeling and the multiscale modeling will significantly increase computational costs. The simplification offers an advantage as it enables treating the mixture’s fracture properties the same as the fracture properties of the AC pavement layer, which provides great modeling efficiency, while it will lose modeling accuracy to some extent. The results in Figure 5 indicate that the complex rate-dependent fracture process zone can be captured effectively, which clearly shows the efficacy and capability of the NVCZ model incorporating the Gaussian damage evolution function.
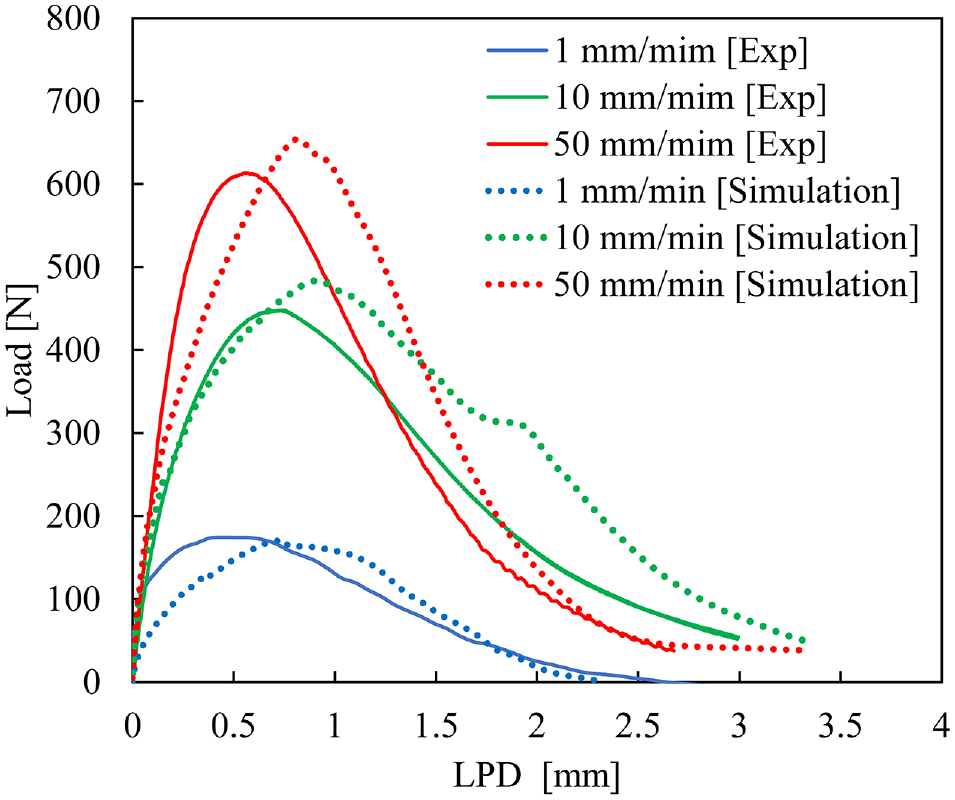
Comparison between the semi-circular bending test results and the finite-element model simulation results.
Cyclic Fatigue Test
For fatigue characterization of the mixture, uniaxial CF tests were performed following the procedure described by AASHTO TP 107 ( 37 ). For preparing the sample, the AC mixture was first molded in the dimension of 170 mm in height by 100 mm in diameter and later cut to the dimension of 130 mm in height with a target air void of 5.5 ± 0.5%. The CF tests were conducted at 10 Hz frequency and six different strain amplitudes of 175, 200, 220, 250, 270, and 350 µ-strains and at temperatures within the range of 20–25°C. The strain amplitudes were selected to create a range of the number of cycles to failure (Nf) within 5000–200,000 cycles. The sample failure was calculated on the cycle in which the phase angle drop occurs.
The S-VECD model was then used to build the damage characteristic curves (C versus S) for the mixture; Figure 6a presents the C versus S curve for the six strains and the fit using the model depicted in Equation 9, where C11 = 0.0017 and C12 = 0.5449 are the fit parameters. The damage characteristic curves represent the relationship between the material’s integrity (C) and damage (S) and allow the fatigue damage evolution under any loading and temperature history of interest. Figure 6b shows the G
R
versus Nf failure criterion obtained where the parameters (
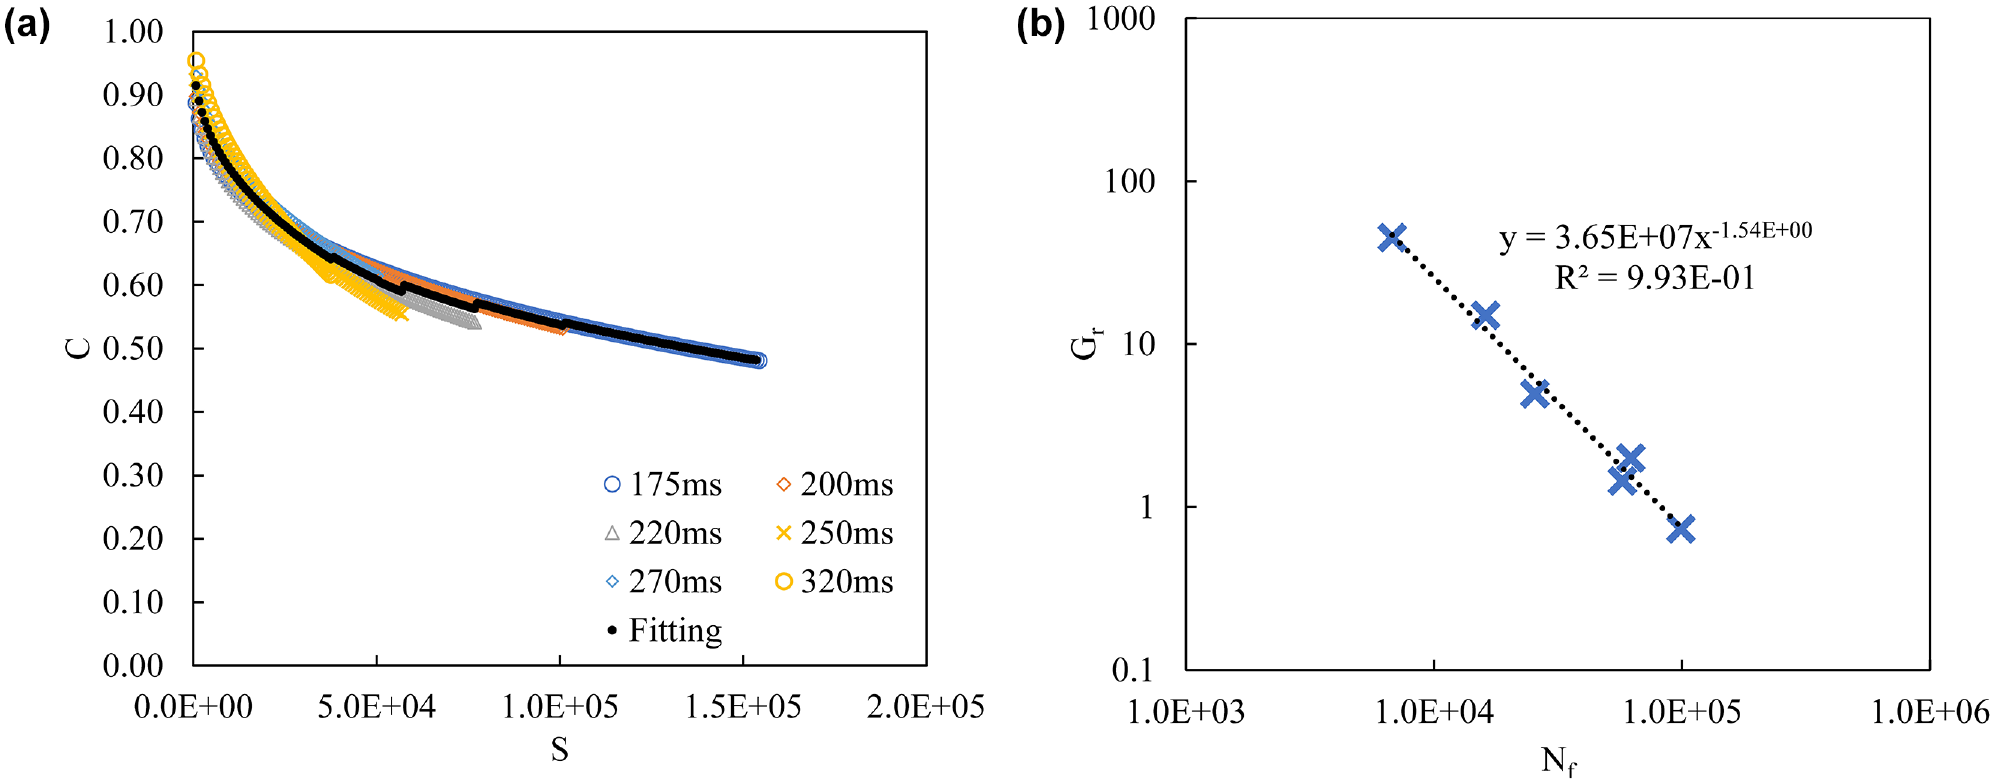
Fatigue damage characteristics of the asphalt concrete mixture obtained from the cyclic fatigue tests at different strain amplitudes: (a) damage characteristic curves; (b) GR versus Nf.
Damage Modeling of Pavement
The previous section detailed the experimental study performed over the single mixture that was selected for this study where the LVE constitutive behavior was captured through the dynamic modulus testing and its damage characteristics were identified by using the SCB and CF tests. The test results serve as essential inputs for the AC mixture within a single-scale pavement model that can be evaluated for its performance.
From a design perspective, a parametric analysis was conducted to evaluate the effects of several key design variables on the overall response and fatigue cracking of the pavement structure. The design variables include the pavement geometry (layer thicknesses with a lane width of 3.65 m) and underlying material properties, which are assumed to be linear elastic (
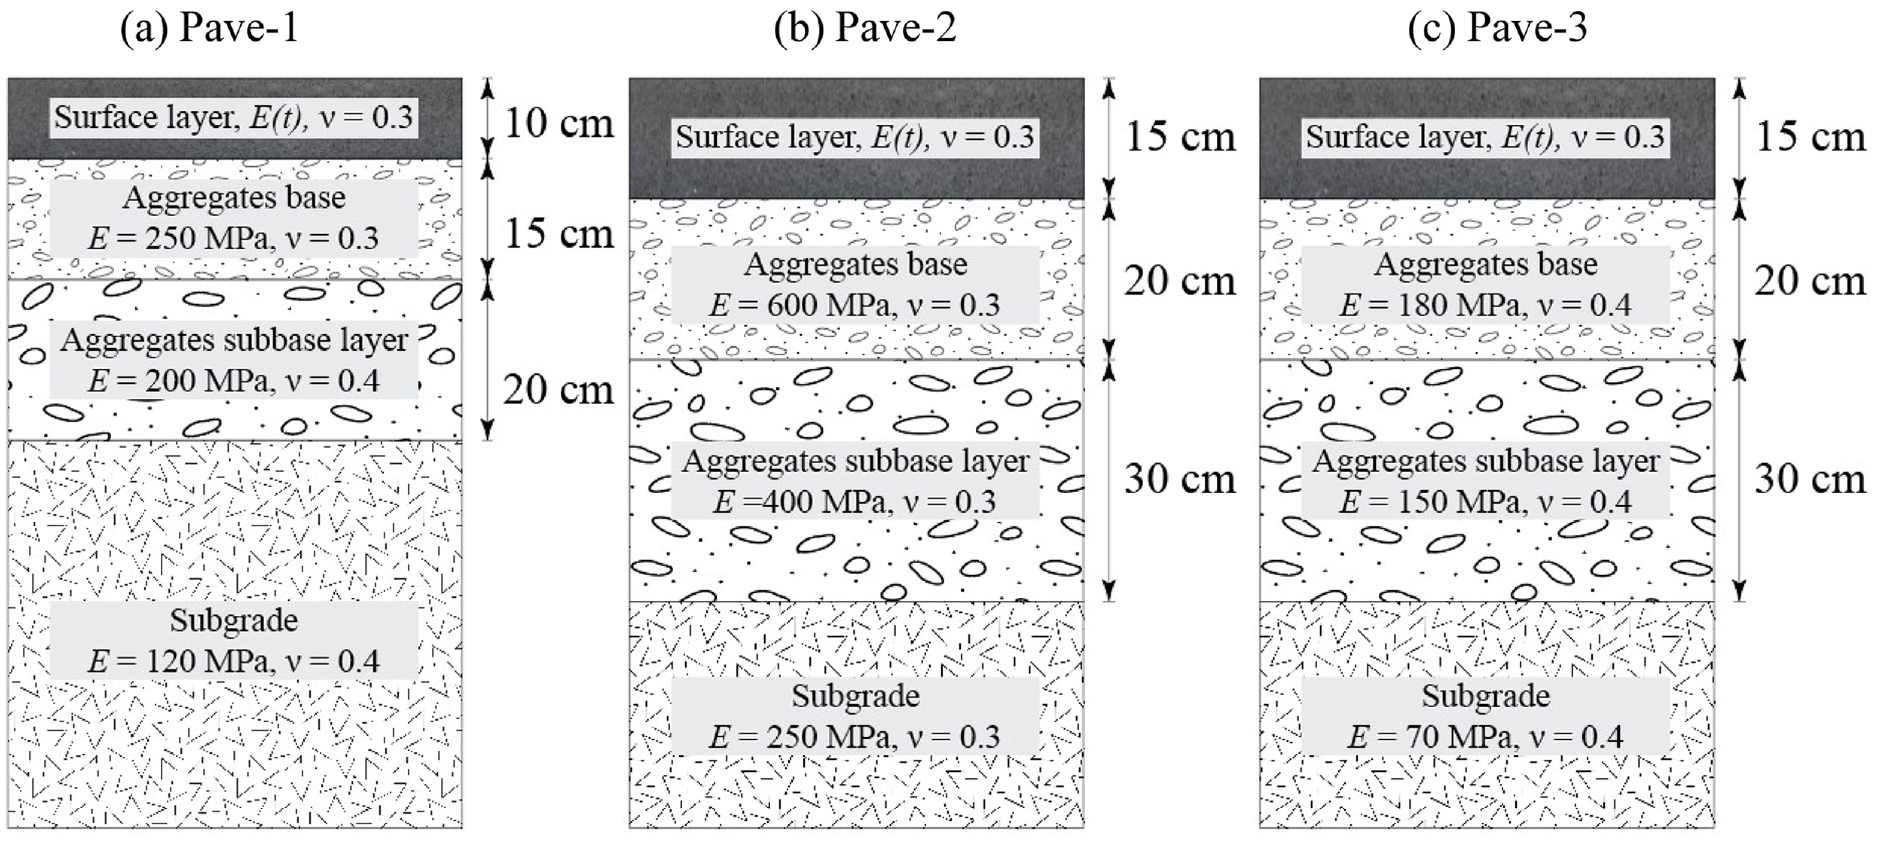
Pavement structure cases used for evaluating the fatigue cracking distresses within the asphalt concrete layer incorporating the cohesive zone modeling and continuum damage modeling approaches.
Pavement Damage Modeling Based on Cohesive Zone Fracture of the AC Layer
Figure 8 demonstrates the methodology adopted in this study to evaluate the mixture performance within the pavement structures (Figure 7) while incorporating damage within the AC layer through the NVCZ modeling approach. As shown in the figure, two key laboratory experiments (DM and SCB) are used to characterize the AC mixture properties that serve as inputs to the AC layer. As described in an earlier section, the fracture characteristics of the mixture were established through the experimental-numerical calibration process of the SCB, which incorporated the NVCZ model to describe the fracture process. The resulting NVCZ model parameters represent the AC fracture properties.
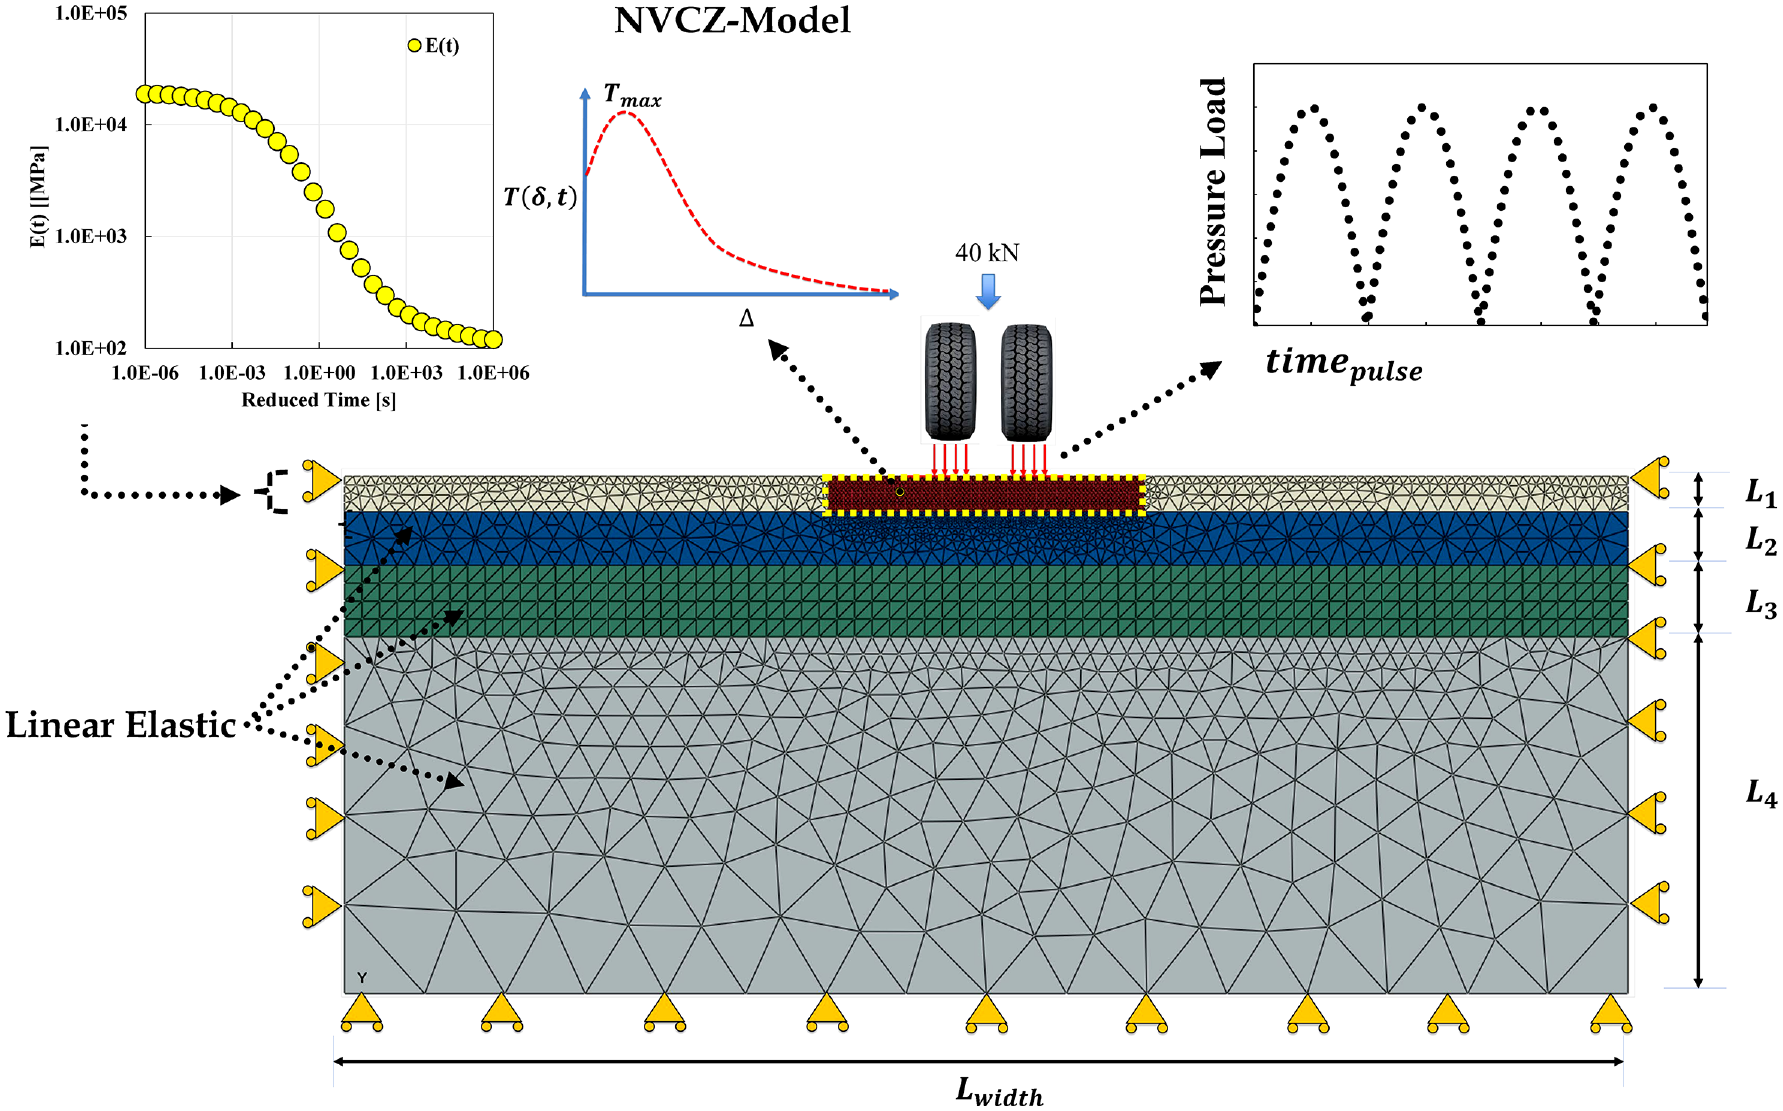
Overview of the finite-element pavement structure modeling with nonlinear viscoelastic cohesive zone (NVCZ) elements.
Figure 8 also depicts the 2D finite-element model of the pavement structure, which is analyzed under plane strain conditions and comprises four layers representing a typical highway pavement. Similar to the SCB simulations, the AC layer was treated as homogeneous within the pavement model. The mesh depicted in Figure 8 uses linear triangular elements with a fine mesh density within the critical region (i.e., brown section) where high stresses and consequential damage are expected because of tire loading. The brown section includes the NVCZ elements, and the model parameters obtained from the SCB calibration process simulate fatigue crack initiation and propagation within the AC layer. A structured meshing strategy was used within the critical region with an element size of 10 mm, whereas the remaining parts were unstructured and adaptive with the largest element size restricted to 225 mm within the subgrade layer. Appropriate boundary conditions were applied to the 2D pavement model where the vertical edges were not allowed to move in the horizontal direction, and the bottom edge was not allowed to move in the vertical direction. To simulate fatigue damage response more appropriately, repeated loading conditions were applied through a single dual tire load of 40 kN. Generally, the tire contact stresses would be nonuniform with respect to their spatial distribution depending on the type of tire and inflation pressure. This study adopted a simplified loading scenario by considering a uniform spatial distribution, but the temporal effects were retained by employing the haversine loading condition to reflect the velocity of a passing wheel: peak amplitude of 800 kPa and the time period (
As an example, Figure 9 shows the pavement simulation results of the control case (Pave-1) when the structure was subjected to 10,000 loading cycles. Figure 9a depicts the horizontal stress contour within the critical region during the four different stages of loading cycles. The figure shows that the propensity for crack development increases with loading cycles, as observed with the increased number of NVCZ elements inserted within the critical region. The growth of the NVCZ elements inserted is a direct indication of progressive damage within the critical region. Also, the figure shows that the AC layer is susceptible to both top-down and bottom-up cracking and the modeling approach presented here can accurately capture this effect. In an attempt to have a more quantitative representation of crack growth within the AC layer, every NVCZ element that was inserted within the critical region was analyzed for its internal damage parameter
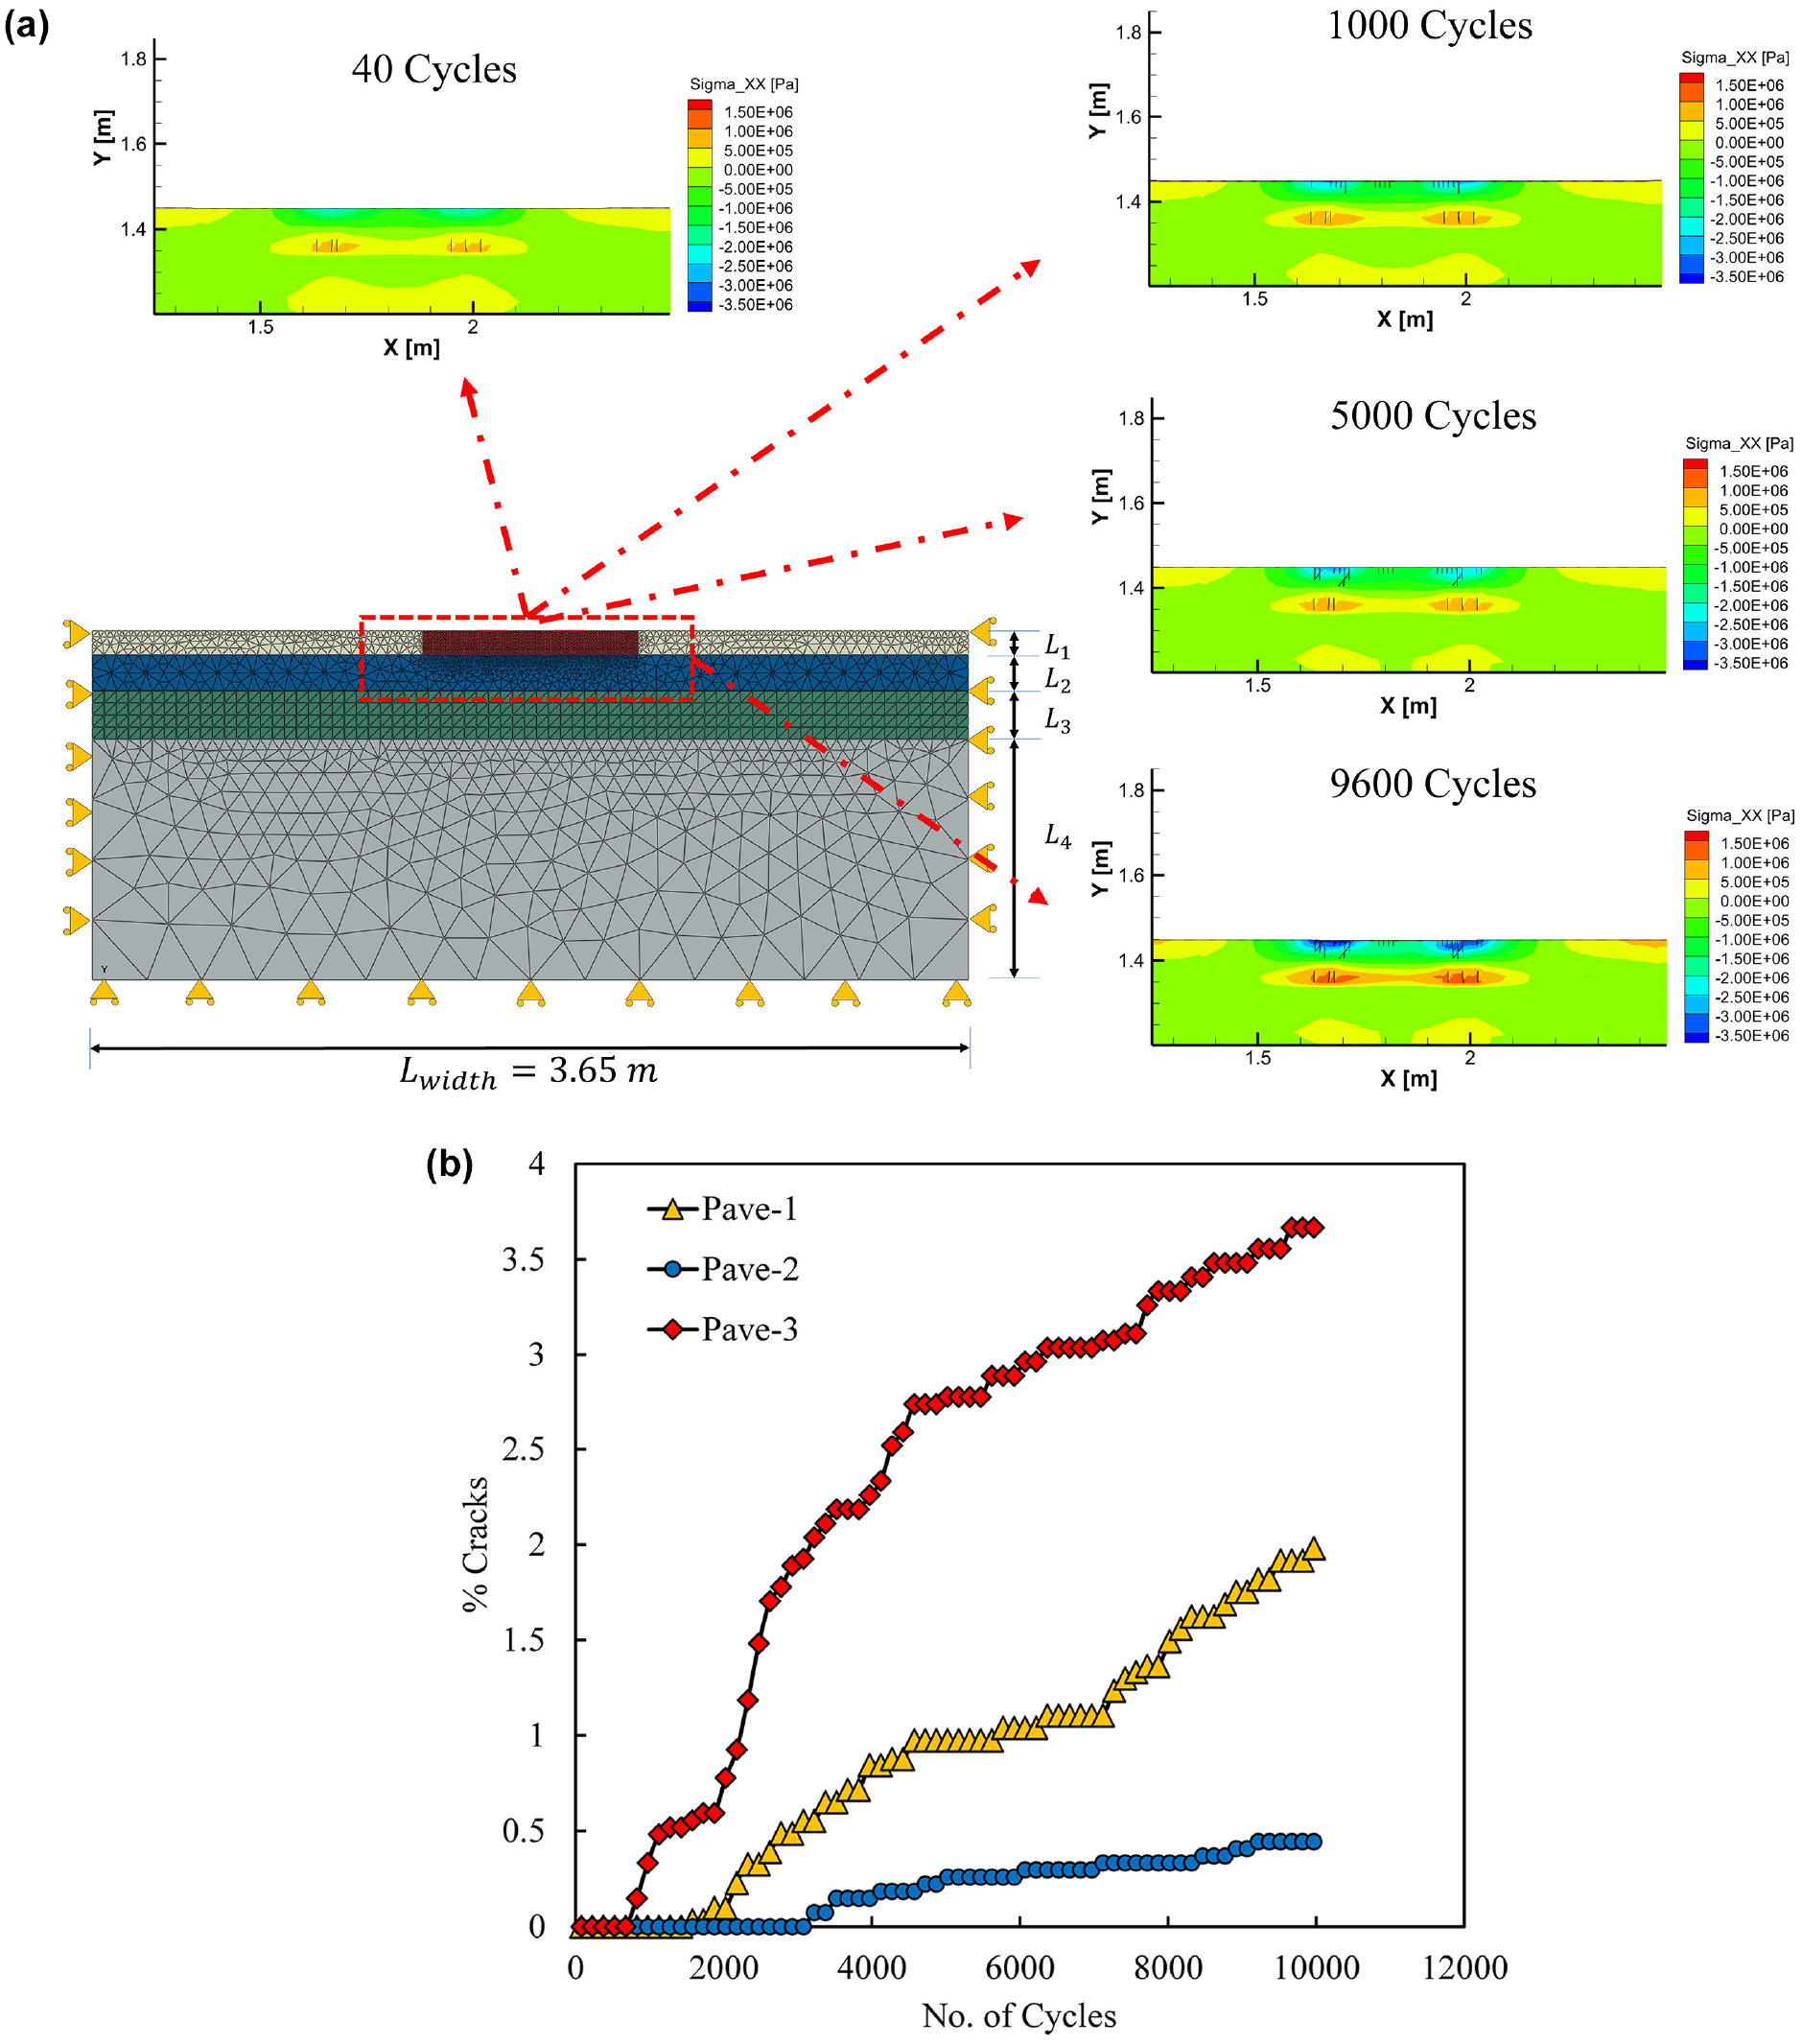
Model simulation results: (a) horizontal stress contour plot within the critical region of Pave-1; (b) percentage of cracks accumulated over 10,000 loading cycles for each of the pavement cases.
Figure 9b shows distinct characteristics with respect to crack onset, the relative extent of crack development, and the progression of fatigue damage among the different pavement design cases. Despite sharing identical AC mixture properties (i.e., LVE and NVCZ model parameters), the three pavement cases display different damage evolution, represented by varying degrees of crack initiation, propagation, and growth rates. These variations in pavement performance, particularly for fatigue cracking, are primarily because of the different structural configurations, such as thickness and the properties of underlying layers. Notably, Pave-3 has the highest susceptibility to early crack development and, once initiated, these cracks are prone to increase and grow at a faster rate compared to others. This response is attributed to weak underlying layers, leading to significant stresses within the AC layer. Pave-2 was the best case with respect to resisting fatigue damage owing to its thicker AC layer and better underlying materials. NVCZ modeling can predict pavement performance considering the interrelated factors of mixture properties, pavement structural configurations, and traffic conditions. The model simulation results clearly indicate that the effects of AC mixture properties on structural damage performance and design of pavements can be very different when other design variables are incorporated.
Pavement Damage Modeling Based on Continuum Damage of the AC Layer
For the CD-based pavement performance simulation of the cases presented in Figure 7, the LVECD program was used. The LVECD program, now known as FlexPAVETM, is a pavement performance analysis tool that is based on an efficient framework developed by combining time-scale separation and layered viscoelastic analysis. The program uses the time-scale differences among temperature variations, traffic frequency variations, and fatigue evolution, thereby reducing the number of pavement response analyses to be performed from millions of cycles to only a few numbers of analyses to be run. The stress–strain analysis is then performed using Fourier transform-based layered structural analysis. As such, the analysis tool efficiently evaluates the effects of the viscoelasticity, temperature (thermal stress and changes in the viscoelastic properties), and the traffic load on the performance of the pavement structure where the fatigue cracking response of the pavement is predicted using the S-VECD damage model.
The program includes various assumptions and observations with respect to the pavement structure, material properties of the layers, thermal variations, and traffic variations, which are highlighted here and are pertinent to this study ( 12 ).
The pavement length and width are both large compared to the size of the tire and pavement thickness. Thus, the pavement can be approximated as an infinite layered system where the material properties vary only with respect to depth.
The temperature variation is captured only with respect to pavement depth and is assumed to be constant over the entire plane, which corresponds to a given depth. Moreover, the pavement temperature profile (across the pavement depth) is assumed to be cyclic within a period of one year and the temperature variations are captured using hourly data.
The traffic load is idealized as a cyclic load with a constant shape (tire footprint) and speed. The traffic loading varies by second(s), whereas the temperature varies by hour(s).
Although the base and subgrade are known to exhibit nonlinear behavior they are idealized as linear elastic materials.
In this study, the LVE properties of the AC mixture obtained from the dynamic modulus experiment were given in the form of Prony coefficients, depicted in Table 1, and also the shift factors used for determining the master curves. For modeling the fatigue damage within the surface layer, the S-VECD model parameters depicted in Equations 6–14 were used for predicting fatigue performance, and the parameters are shown in the section where the characteristic damage curve was depicted (Figure 6). The unbound materials were regarded as linear elastic with elastic properties (i.e., E and
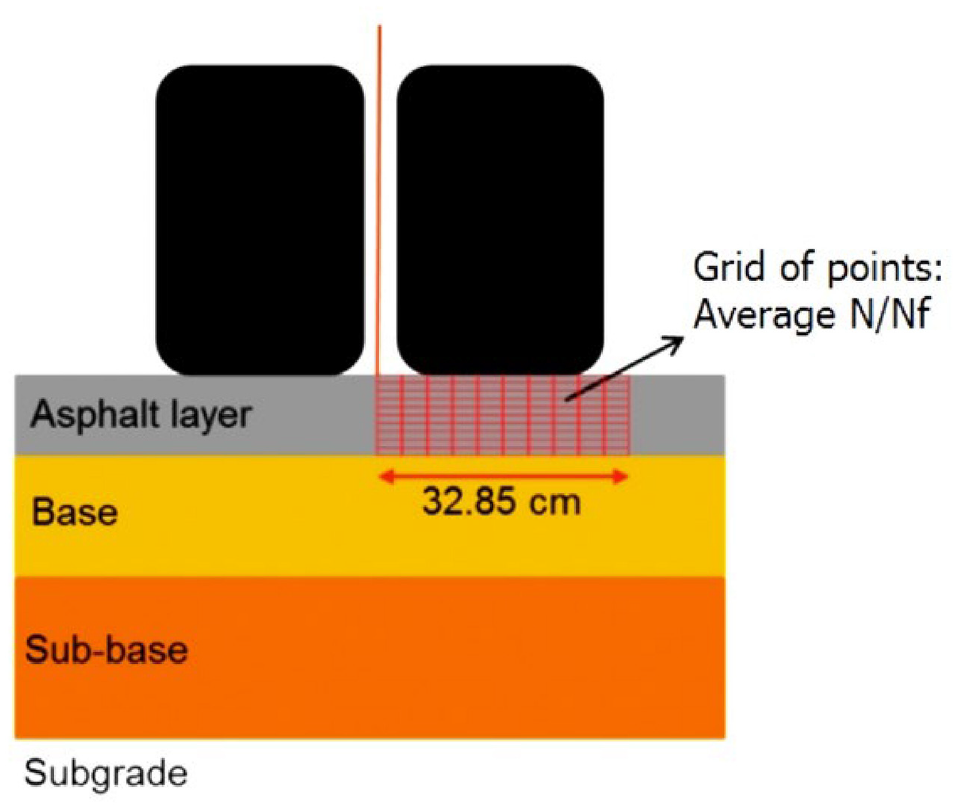
Grid considered within the asphalt concrete layer for obtaining the average damage ( 18 ).
For damage calculation, average damage was computed for a grid of 110 points below the right-hand tire of the dual wheel (since the damage was observed to be symmetric along the central axis), which follows the methodology used by de Nascimento ( 18 ). In the mesh, 10 points are equally distributed in the horizontal direction, from the center of the loading to 32.85 cm from that point horizontally, and 11 points are equally distributed in the vertical direction, from the bottom of the AC layer to the surface, as shown in Figure 10.
Simulations were then conducted for each of the pavement cases, as depicted in Figure 11, using FlexPAVETM while subjecting the pavements to traffic levels equivalent to a period of 10 years (120 months), and the fatigue damage accumulation was obtained through the S-VECD model. Figure 11 illustrates the damage contour plot within the AC layer of each pavement case. Although not shown, it should be noted that the horizontal length scale (width of the pavement) remains the same for all the pavement cases ranging from −1.5 to +1.5 m from the center. Also, it is important to note that the damage calculation by the S-VECD model utilized in the FlexPAVETM program only takes tension into account as a factor contributing to the damage. From the figure, one can observe that Pave-3 presented the worst performance, while Pave-2 showed the least level of damage after 10 years of service. In addition, it can be observed that the critical region within the AC layer is right below the wheel path and damage is not limited to the bottom portion alone.
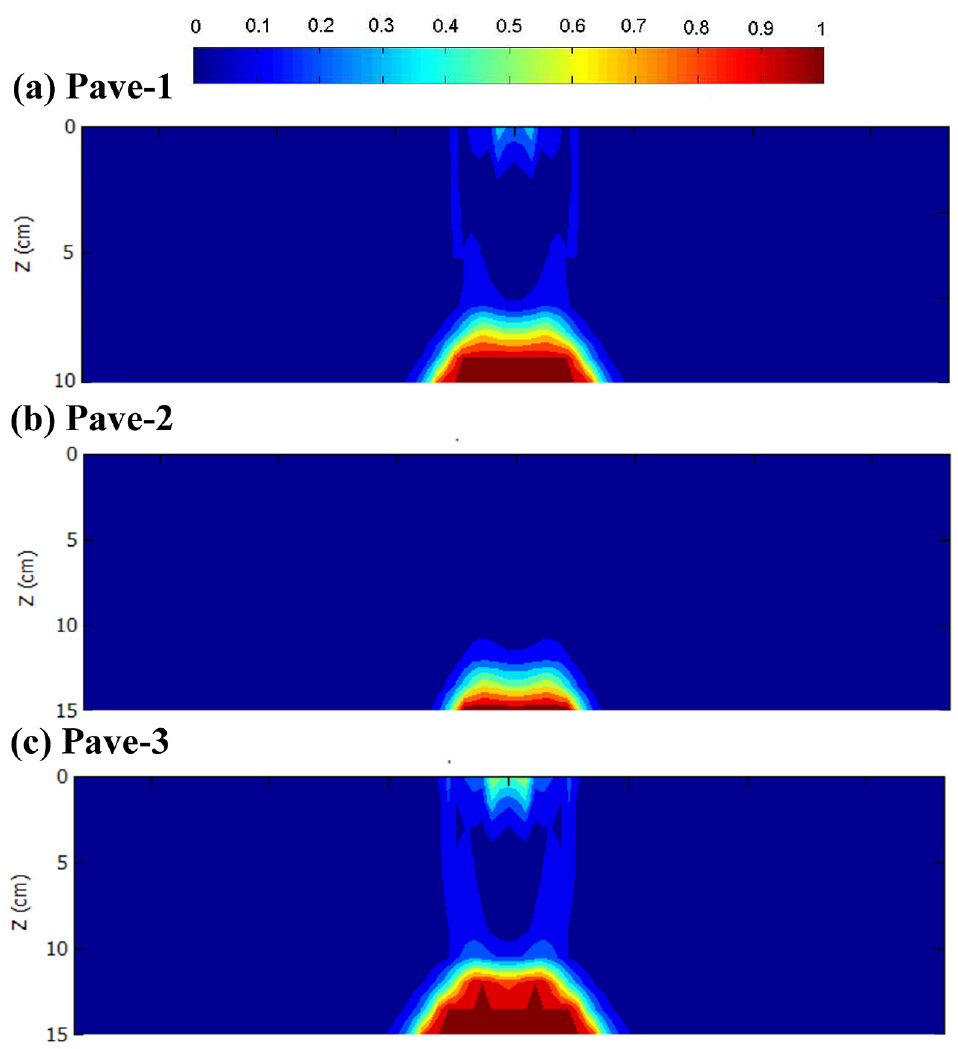
Simulation results from the continuum damage modeling approach: asphalt concrete layer damage contours of the three pavement cases.
The average damage accumulated during the traffic loading cycles was calculated within the grid of the selected 110 points (shown in Figure 10) across the AC layer, and the results from the three pavement cases are plotted in Figure 12a. As shown, Pave-3 exhibited the highest level of damage, while Pave-2 showed the least amount of damage. Similar to the results observed from NVCZ modeling, increasing the thickness of the AC layer helps resistance to fatigue damage, and weak underlying layers lead to significant stresses within the AC layer and pavement fatigue cracking damage.
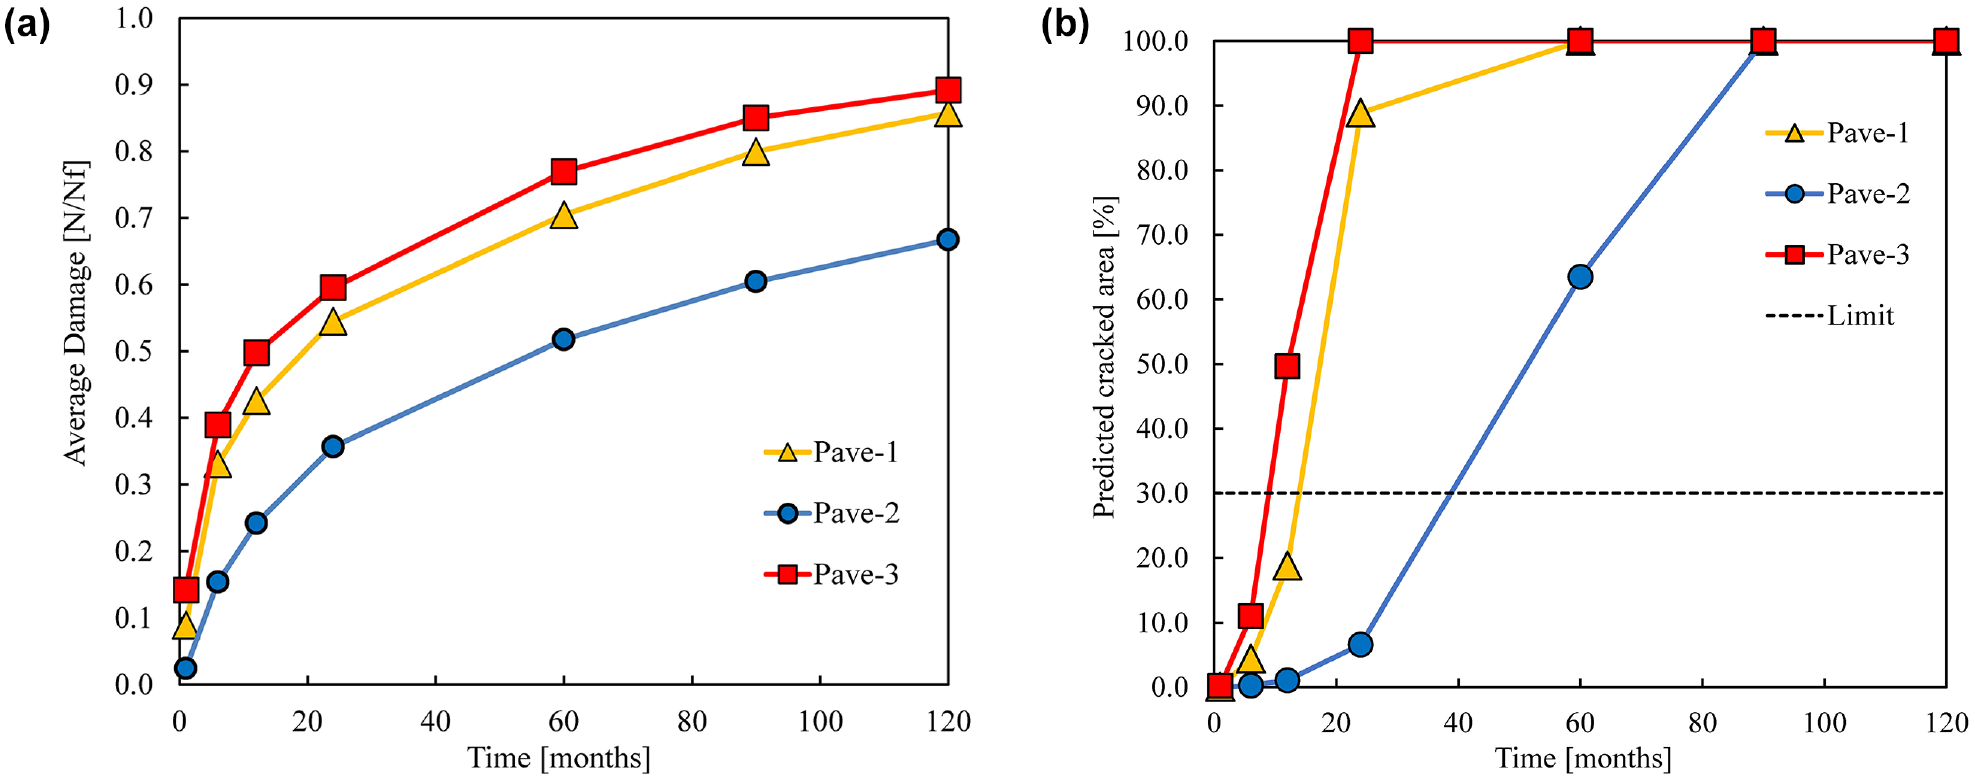
Continuum damage modeling results: (a) average damage accumulated below the wheel path for each pavement case; (b) predicted cracked area of each pavement case.
The prediction of fatigue cracked area evolution of the three pavement structures was estimated based on the methodology by de Nascimento ( 18 ), and the results are shown in Figure 12b. The result in the figure supports the observations from the damage contours and average damage calculated. From the predicted cracked area plots, one can determine the pavement service life by taking a certain failure criterion. For example, if 30% crack development is taken as the failure point (which is a typical value considered in the design of Brazilian highways), the expected life of each pavement is approximately 14, 39, and 8 months for Pave-1, Pave-2, and Pave-3, respectively.
Summary and Conclusions
This study utilized two mechanistic methods developed by researchers to model the fatigue damage behavior of AC mixtures and pavements: CZ fracture modeling and CD modeling. Model simulations were conducted for a typical AC mixture and pavement structures common in Brazil, and model simulation results were compared for predicting fatigue cracking damage of pavements. The following conclusions can be drawn.
For both methods, the pavement fatigue damage analysis can be performed using two types of AC mixture testing. The dynamic modulus experiment essentially provides the LVE properties of the AC mixture. CZ modeling utilizes monotonic SCB tests at different loading rates (if rate-dependent fracture properties are desired), while CD modeling requires CF tests at different strain amplitudes.
For CZ modeling, fracture parameters were obtained through the experimental-numerical calibration process, where a single set of model parameters was sufficient to capture the rate-dependent damage characteristics of the AC mixture. Pavement model simulations indicate that the methodology can directly address the influence of key pavement design variables on the fatigue damage response by capturing the progression of damage evolution and the explicit (realistic) cracking within the critical region.
For CD modeling, CF tests can be used to obtain the mixture’s fatigue resistance characteristics, which can then be used as inputs to the FlexPAVETM program to conduct the pavement performance analysis. Computational efficiency for predicting the damage response was noted. Transfer functions convert the damage response to percentage cracks within the AC layer.
The performance rank order of the pavement structures evaluated using the two methods was identical. However, damage evolution characteristics and relative differences among the pavement cases differed because of the different mechanics in modeling cracks.
The modeling presented in this study made several assumptions, such as a homogeneous AC mixture and stress-independent elastic base/subgrade layers, to avoid complexities at this stage because of the limited scope of work. They remain as future studies.
Footnotes
Author Contributions
The authors confirm contribution to the paper as follows: study conception and design: Y.-R. Kim; data collection: M.L. Rocha, S.R. Kommidi; analysis and interpretation of results: M.L. Rocha, S.R. Kommidi, Y.-R. Kim, F.T.S. Aragão, L.A.H. do Nascimento; draft manuscript preparation: S.R. Kommidi, M.L. Rocha, Y.-R. Kim. All authors reviewed the results and approved the final version of the manuscript.
Declaration of Conflicting Interests
The author(s) declared no potential conflict of interest with respect to the research, authorship, and/or publication of this article.
Funding
The author(s) disclosed receipt of the following financial support for the research, authorship, and/or publication of this article: The authors would like to acknowledge the financial support from CENPES/PETROBRAS (Project Number 2017/00117-6).
Data Accessibility Statement
Some or all data used during the study are available from the corresponding author by request.