
Abstract
To address the adverse effects of urban freight, downshifting to smaller vehicles, such as cargo bikes, has been indicated as a viable solution. Existing literature on freight mode choice rarely considers vehicles smaller than truck size. We aimed to fill this research gap by quantifying how vehicular, operational, trip-based, contextual, and individual determinants influenced the decision between cargo bikes and cars in urban logistics. To that end, a stated preference survey was conducted among 537 German organizations after they had been familiarized with cargo bikes through a 3-month vehicle trial period. Participants then took part in a survey in which they had to choose between the modes cargo bike, car, or neither of these two alternatives. The survey data were analyzed using a mixed logit model with 4,833 observations. The model estimations demonstrated that the values and signs of parameters were in accordance with both our expectations and the literature. The results indicated that cargo bikes were an attractive alternative to cars for delivery and service trips of short duration in fair weather. The probability of choosing a cargo bike over a car could be further increased by improving bike infrastructure or imposing parking limitations. The preference for cargo bike could be observed for respondents in dense urban centers and low-density parts of the country alike. Around 3 out of 10 respondents decided to buy their own cargo bike after the study, demonstrating the effectiveness of low-threshold testing programs in changing habits toward more sustainable mobility solutions.
Keywords
Urban freight transport still relies heavily on conventional combustion vehicles of small and medium sizes. Of the 3.55 million trucks registered in Germany, the vast majority (85%) are light commercial vehicles up to 3.5 metric tons (3.86 short tons) ( 1 ). Moreover, 10.8% of the 433.3 million registered passenger cars in Germany are used commercially ( 2 ). Increasingly, conventional delivery is under pressure, not least because of the steady growth in e-commerce, which necessitates new requirements for delivery concepts ( 3 ). Authorities have also implemented measures and regulations, including parking and travel limits for trucks both in U.S. and European cities ( 4 , 5 ). The reduction of truck lanes in favor of cycling also leads to more difficult conditions for classic delivery vehicles, which creates increasing competition for space, as shown in cities such as New York, San Francisco, and Berlin ( 6 – 8 ).
Companies are therefore forced to think about alternative vehicle concepts for last-mile delivery. Small electric vehicles, such as electric cargo bikes, have been discussed within the last decade, especially to enable micro- or nanohub concepts ( 3 , 9 ). Test programs also show the applicability for craftsmen, service trips, and logistics activities of municipalities ( 10 ). In Germany, there has been a clear market upturn in the spread of cargo bikes. More and more businesses in Germany are acquiring cargo bikes as a replacement for or supplement to a conventional car or light commercial vehicle, thereby taking advantage of its legal equality with the bicycle or for other ecological or economic motivations. Following EU law, no license or insurance is required for cargo bikes with an electric support up to 250W and a maximum electrically assisted speed of 25 km/h (15.5 mph), as the vehicles are considered “bicycles” within these limits ( 11 ). Sales grew from 76,000 cargo bikes sold in 2019 to 213,000 in 2022 ( 12 , 13 ). This is also related to subsidies from the German government (funding of 25% of the purchase price up to €2,500) and other bodies.
Although the potential of cargo bikes is widely recognized, the actual shift from conventional vehicles with internal combustion engines (ICEs) in commercial traffic has so far remained marginal ( 14 ). One reason for the still very low sales figures compared with conventional vehicles might be that there is a lack of knowledge about the operational capabilities of cargo bikes and where their advantages over conventional delivery vehicles can best be utilized, for example, independence from parking spaces, direct accessibility to the destination, or less vulnerability in relation to congestion. In addition to a lack of information, preexisting habits in mode choice decisions also influence people to select the familiar vehicle when in doubt.
This paper aims to address the research gap on which determinants have substantial influence on the (short-term) choice between conventional vehicles and cargo bikes for commercial freight or service trips. The term “conventional vehicles” refers to passenger cars and light commercial vehicles up to 3.5 metric tons total mass with an ICE. Overall, the knowledge on commercial mode choice will be expanded with a light vehicle type that has not been considered so far.
The paper outline is as follows. The state of the artprovides an overview of the currently available research on various aspects of cargo bike usage and decision making. In the methods section, the background, data, and analytic methods of the study are outlined. Following a description of the sample, the final estimation results are presented and discussed. This contribution ends with a conclusion.
State of the Art
This paper deals with the choice of a vehicle type for commercial trips, either for goods transport or the provision of services. However, the traditional literature on freight mode choice can hardly be used for this purpose, as it typically assumes a distribution between road, rail, and inland water transport ( 15 , 16 ), as well as occasionally coastal shipping or pipelines ( 17 ). The existing body of literature shows a gap in the consideration of decision parameters that determine the use of small vehicles in freight transport.
Although small vehicles such as cargo bikes are not classically considered within mode choice, different criteria have been investigated concerning their influence on the general willingness to use or willingness to buy cargo bikes, such as vehicular, operational, infrastructural, contextual, or individual factors.
Relevant vehicular factors such as weather protection, electric range, and purchase price affect the willingness to use cargo bikes in commercial transportation ( 18 ). Provision of weather protection on cargo bikes encourages use and makes it more competitive against cargo bikes without protection ( 19 ). In earlier studies, electric range was also a limiting factor for choosing cargo bikes over cars for last-mile logistics ( 20 ).
The operational benefits of cargo bikes also influence the willingness to use them. Being especially suitable for areas with high population density and -commercial activity, cargo bikes are preferred in central business districts or city centers with narrow streets ( 21 , 22 ). Choubassi underlines the operational advantages of cargo bikes in these areas ( 23 ). A small spatial business area has also proven to be a favorable aspect by decision makers, as well as the perception of operational benefits, such as easier accessibility or more flexible parking ( 24 ).
Furthermore, willingness to use might be connected with the corporate philosophy, as using nonmotorized vehicles could be the outcome of conviction and awareness ( 25 ). Moreover, soft benefits such as employee health or the achievement of corporate environmental goals have been shown to affect the choice of cargo bikes positively ( 26 ).
The condition of the bicycle infrastructure also plays a role: companies are less inclined to use cargo bikes when poor infrastructure is prevalent; furthermore, research indicates that a lack of overnight storage as well as parking spaces also limits utilization ( 19 ). It is critical to consider different users, such as cargo bike users, walkers, or car users with multiple purposes while planning infrastructure to ensure the safety of bicycle riders ( 27 ). While cargo cyclists often use the road as well as cycle paths when they are moving, parking events for cargo cyclists primarily occur on the sidewalk ( 28 ). The direct accessibility of the destination is a significant difference to the use of infrastructure by conventional vehicles.
A study by Malik et al. looked at contextual aspects, such as how weather events, temperature, route length, and rainfall affect the use of electric cargo bikes for last-mile delivery and service trips. Based on a small sample of 12 businesses in Ireland, it became evident that high maximum temperature has a negative influence on trip length, followed by rain. As trip length grows, environmental factors such as weather and traffic conditions make cargo bike use increasingly less appealing. The study also reveals a joint effect of precipitation conditions and temperature on the choice of electric cargo bikes ( 29 ).
Individual characteristics also influence the adoption of cargo bikes. Factors such as younger age, male gender, lower income, and higher education play a significant role in the willingness to use cargo bikes among last-mile couriers ( 20 , 30 ). Automobile ownership reduces willingness to use cargo bikes as well ( 30 ). The question of the choice of a transport mode can be determined by one’s experiences: Bem’s self-perception theory explains how self-knowledge is gained, and describes that people change their perception toward a subject through observation of their personal actions ( 31 – 33 ). In relation to transportation, a positive experience with cycling can have a positive effect on the perception of cycling, even though the perception was poor beforehand. This may lead to behavioral changes, for example, in the preferred choice of bicycle ( 33 ). At the same time, people develop a stronger habit in their mobility behavior if they use a mode more frequently, increasing their willingness to use this mode as a result ( 34 ).
In conclusion, this literature review highlights a significant gap in understanding the factors influencing the choice of small vehicles, particularly cargo bikes, for commercial transportation. Although existing studies have touched on various vehicular, operational, infrastructural, contextual, and individual factors, there remains a lack of comprehensive integration of these elements. The unique operational benefits, infrastructural needs, and individual preferences associated with cargo bikes, when contrasted with traditional transport modes, point toward a complex decision-making process that is not yet fully understood. This underscores the necessity of our study, which aims to provide a more holistic understanding of the decision-making parameters surrounding the “car or cargo bike” choice in commercial transport. By bridging this gap, our research seeks to contribute significantly to both academic literature and practical applications in urban logistics and sustainable transportation planning.
Methods
Experimental Setting
The research project “Ich entlaste Städte” (I relieve cities) was conducted by the Institute of Transport Research at the German Aerospace Center from 2017 to 2020. It aimed to provide a Germany-wide opportunity for companies to test cargo bikes as an alternative to conventional vehicles. This initiative allowed organizations, that is, companies from various business sectors as well as municipal institutions or nongovernmental organizations (NGOs) across Germany to test cargo bikes for a period of 3 months, minimizing the monetary risks involved. The project was aimed at organizations engaged in urban freight transport or service trips, which that are interested in utilizing cargo bikes. The opportunity to participate in the project was advertised nationwide through various channels, multipliers, and industry networks to attract a diverse group of participants.
During the period from spring 2017 to fall 2019, 1,935 applications were received. Approximately 70% of these applications met the specified selection criteria, which included commercial (not personal) vehicle use, agreement to provide research data, and willingness to pay a monthly usage fee of €30. Companies with prior cargo bike experience were given lower priority. Finally, a total of 755 organizations across Germany were given the opportunity to test cargo bikes in operational use, with a mean testing period of 96 days, a mean total mileage of 437 km (272 mi), an average of 2.8 usage days per week and 10.6 km (6.6 mi) mileage per usage day (refer to Table 1 for more details). Practical training, maintenance, insurance, and repairs were provided. For participant characteristics, refer to the section “Sample Characteristics.”
Sample Descriptive Statistics
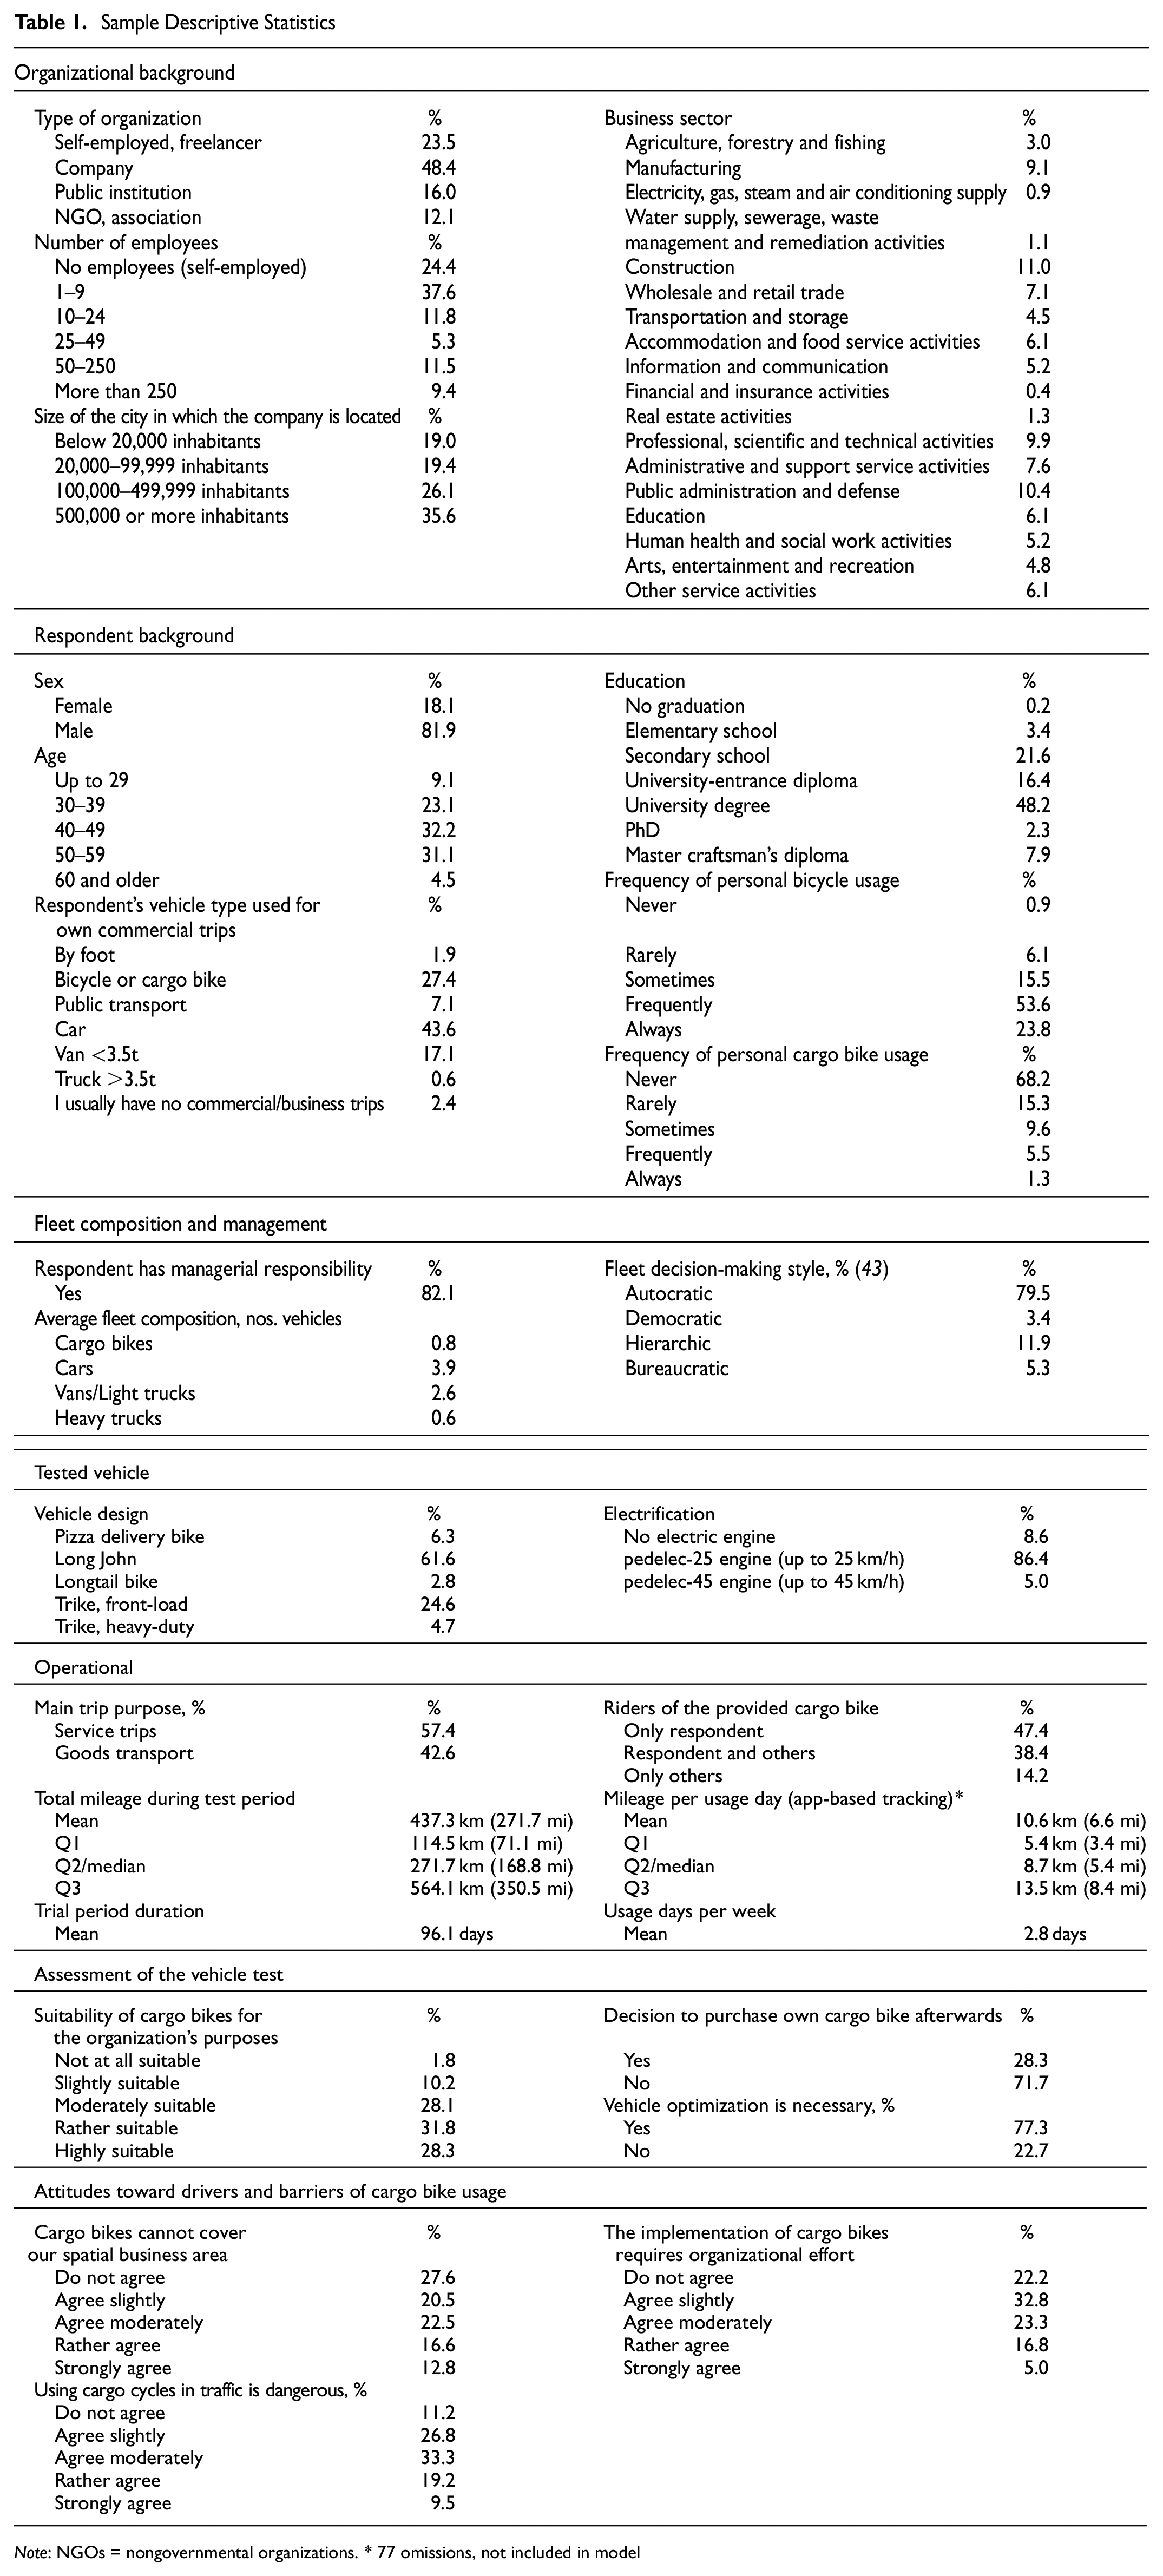
Note: NGOs = nongovernmental organizations. * 77 omissions, not included in model
To facilitate the testing process, 152 cargo bikes were made available, with usually one vehicle assigned to each involved company. To cater for different transport requirements and preferences, a total of 23 different cargo bike models across five main design types were provided. These models represented a wide range of the vehicle market available at the time, including small and easily maneuverable cargo bikes such as two-wheeled Long John bikes, which have a low-lying loading area between the head tube and the front wheel, as well as large tricycles capable of transporting heavy loads. Most vehicles were equipped with electric pedal assistance up to 25 km/h (“pedelec-25”), and thus legally equivalent to bicycles ( 11 ). A visualization and further explanation of the design types can be found in research by Gruber ( 10 ) and Mowe et al. ( 35 ).
The empirical data were collected over a period of approximately 3 years using several online questionnaires. The stated preference (SP) survey relevant to this paper was completed by the participating companies (predominantly by respondents with managerial responsibility) at the end of the 3-month test period, as explained in the following section.
Survey Design
In the preliminary survey, selected participants were asked about the following points of a journey: vehicle with which the transport is carried out, single or multiple destinations during the transport, costs for this transport, distance, and journey time of the transport. From the results, it was determined that no distinction between light commercial vehicles and passenger cars was necessary. The first questionnaire was administered before the start of the described cargo bike test and queried information about organization, fleet, and individual attitudes. At the end of the 3-month test period, the SP survey was conducted to measure the willingness of companies to use cargo bikes and later to place a monetary value on it. The fundamental concept underpinning SP modeling is to gain insight into how individuals make choices when presented with various hypothetical alternatives. Our approach aligns closely with the principles outlined in Train ( 36 ). Furthermore, the six points identified by Ben-Akiva et al. for a sound and meaningful SP survey were considered in the design of the SP survey used: familiarity, outside option, incentive compatibility, preference orders, matching with real market data, and testing for response bias ( 37 ).
Considering the findings from a preliminary survey conducted, the SP survey was set to two alternatives: cargo bike and car. Respondents also had the option of stating that they would not conduct the trip in general under the given conditions. The focus of this study was the downshift to the cargo bike, which was most likely from small vehicle classes such as the car or light commercial vehicles—from which vehicle class exactly was not of great importance. Thus, choices between several conventionally motorized alternatives were not offered.
Twenty-seven different decision situations were generated. Each respondent was presented with nine SP choice games, in which they had to decide between cargo bikes, cars, or the nonchoice option. Attributes that influence the choice of transport mode were identified in advance. Attributes of the alternatives (such as cost or travel time), which differed depending on the alternative, as well as attributes that were the same for all alternatives and related to the trip (such as weather conditions) were included as follows:
Trip distance: Cargo bikes tend to be most suitable for distances up to 3 km (1.9 mi) ( 38 ). Frequently, direct trips are made with cargo bikes that return to the starting point. Two distances were chosen, where the trip to the destination point was once below the 3-km and once above the 3-km threshold (5-km/3.1-mi roundtrip and 12-km/7.5-mi roundtrip).
Weather conditions: Two potentially influencing dimensions of weather were asked categorically: air temperature and the presence of precipitation (rain or snow).
Parking situation: Whereas cargo bikes can always park at the destination, this differs for cars.
Type of infrastructure: Riding in moving traffic or on a separate cycle path was queried as alternatives for cargo bike traffic situations, whereas there was no variation for cars.
Travel time: The average speeds of motorized vehicles and cargo bikes were varied asymmetrically, as travel time is an important aspect in the decision for a mode of transport.
Costs: The costs of transport were considered by setting the coefficient to be estimated for the costs to 1. Average values from the literature were used and adjusted in the pretest.
Risk of damaging goods: The risk of damage was quantified by specifying the shares of damaged loads. Variations of 0%, 5%, and 15% were used.
Delayed delivery: The risk of delay was quantified by specifying the shares of delayed delivery. Variations of 0%, 5%, and 15% were used.
For the queried values in the SP choice game, please refer to Figure 1. The experimental design was generated with the help of the software Ngene 1.1.2 ( 39 ) and the survey was administered via online questionnaire. Respondents chose between one set of options on the “cargo bike card” and the values in the corresponding position on the “car card,” or chose the “nonchoice” option.
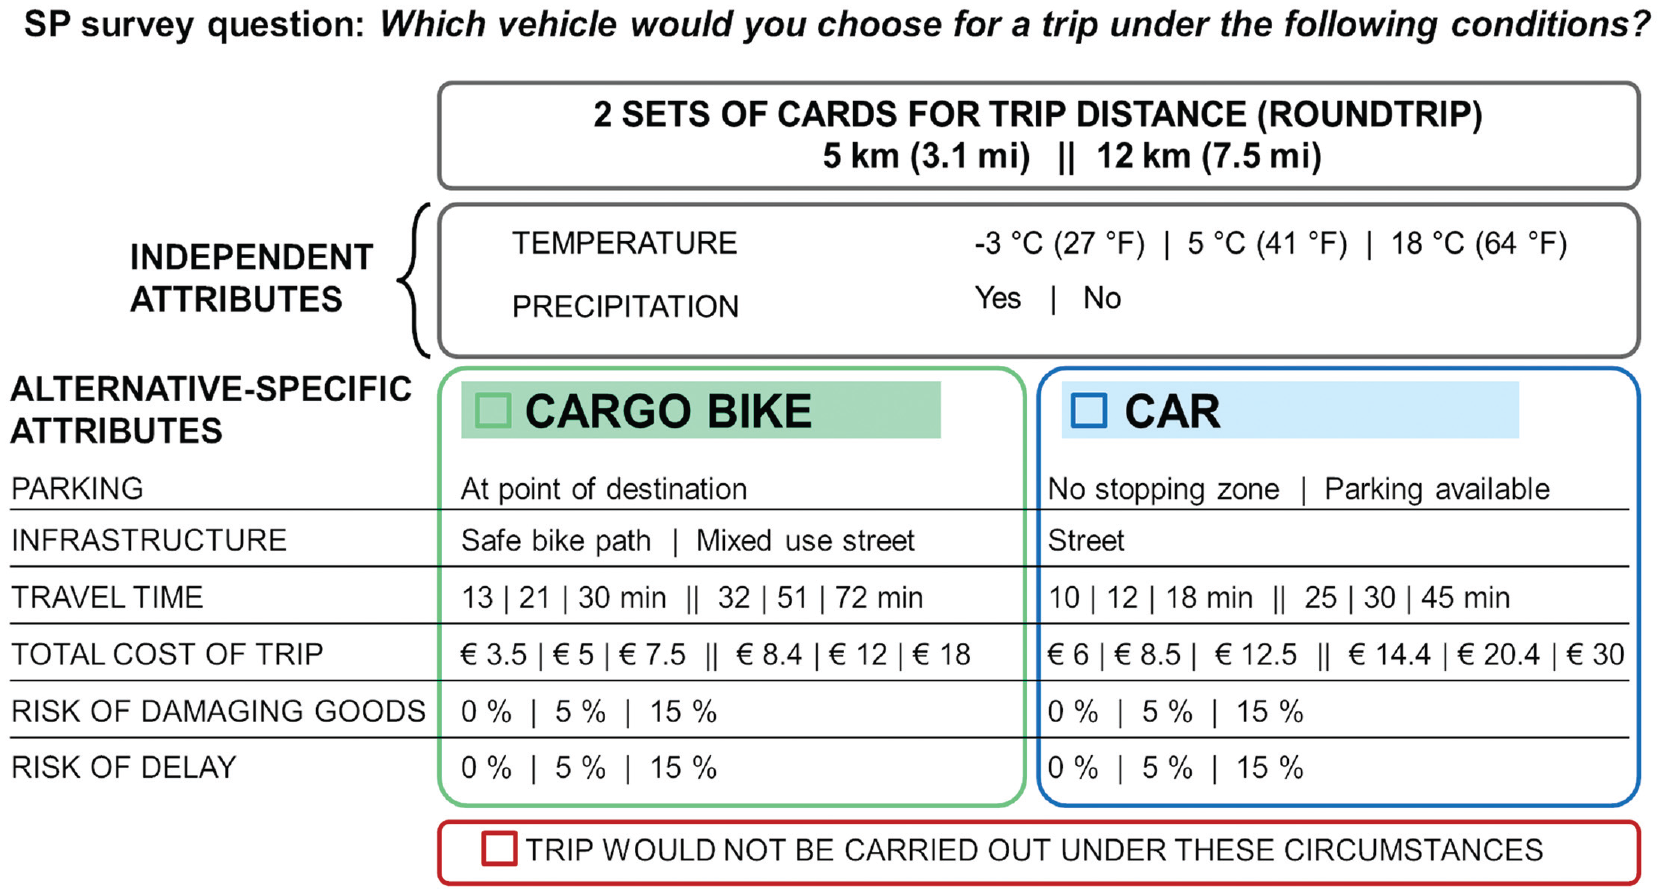
Attributes and attribute levels of the choice experiment.
In addition, it was asked which attributes were perceived as very important or irrelevant. A query about “cut-off” values was conducted through qualitative interviews to determine exclusion criteria that may influence the parameter estimates. These cut-offs were expressed in the appropriate basic units (e.g., €/km, km/h).
Statistical Analysis
The choice between a cargo bike or a car for a given trip was modeled using an error component model. This allowed the consideration of intra-individual correlation and heteroscedasticity (
36
). The error components were added in a “pseudo panel” setting: for each alternative, a different random variable, normally distributed with variance
Estimation of the model parameters was performed using the Apollo package ( 40 ).
Selection of the variables to be included in the model was supported employing the methodology described by Hillel et al. ( 41 ). Applying this method to our data showed that weather conditions and the daily mileage were strong predictors of vehicle choice.
The utility functions for the alternatives can be written as follows:


where
A detailed description of the attributes can be found in Table 2.
Estimation Results
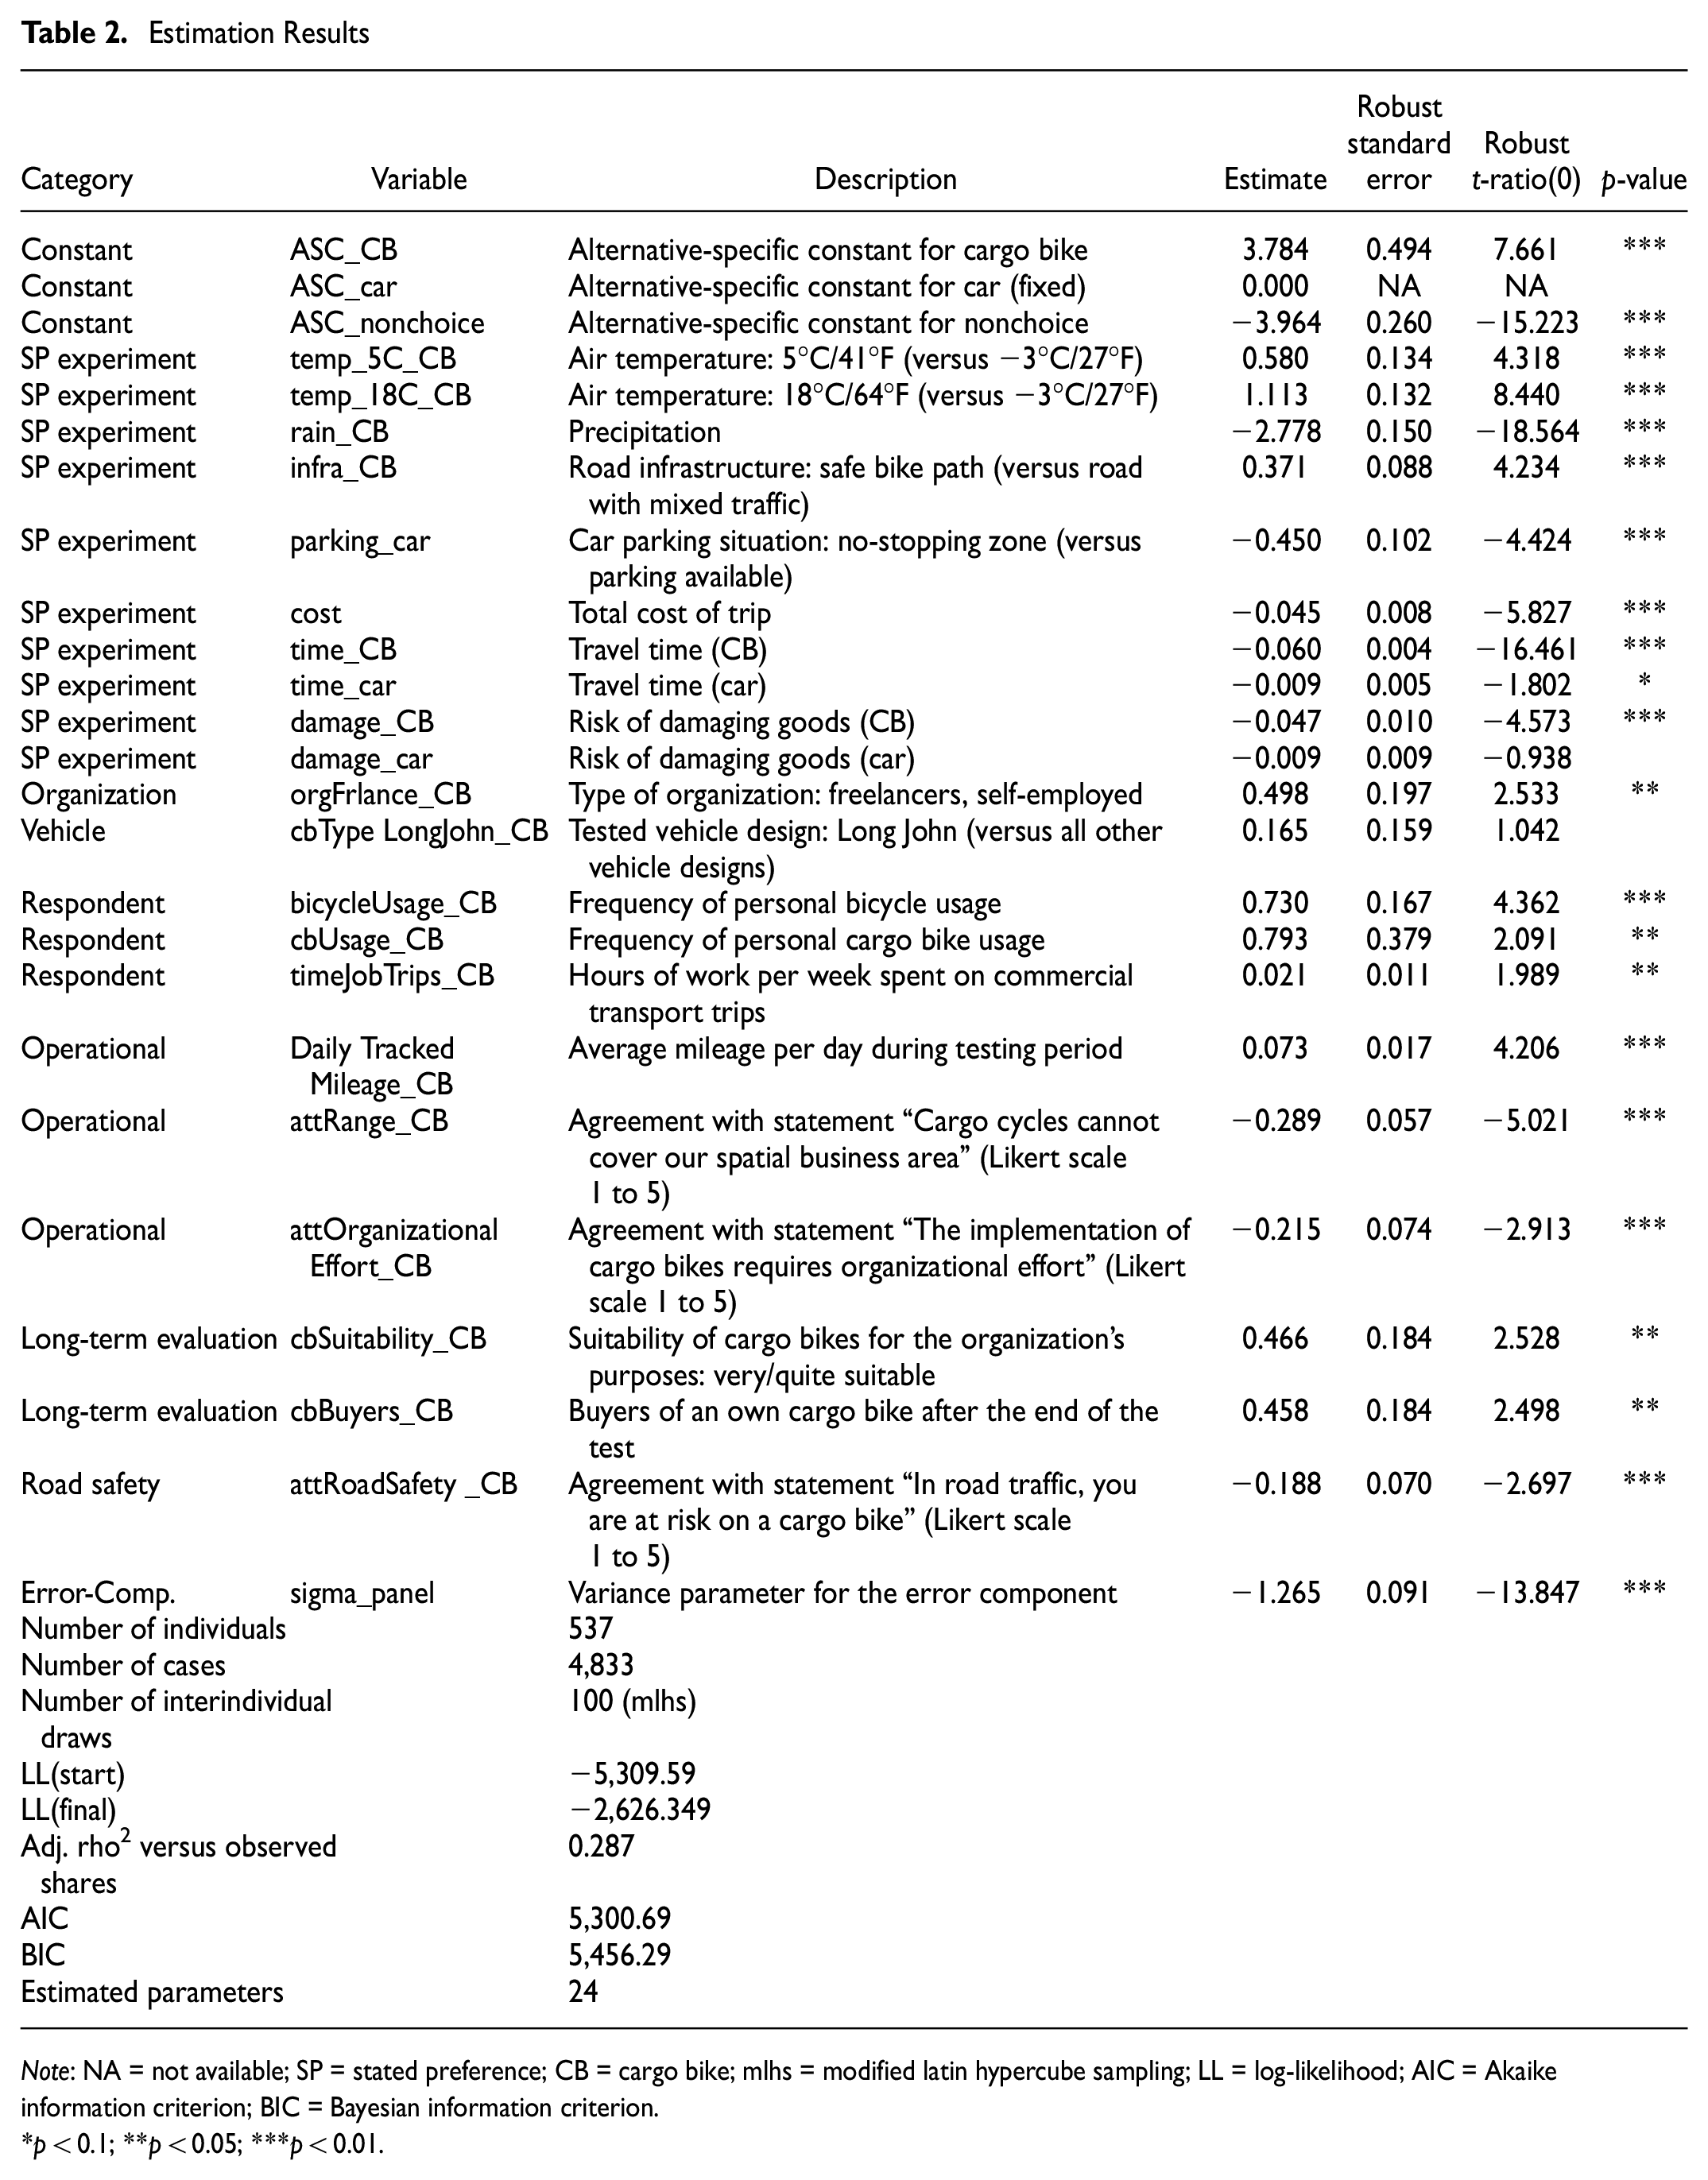
Note: NA = not available; SP = stated preference; CB = cargo bike; mlhs = modified latin hypercube sampling; LL = log-likelihood; AIC = Akaike information criterion; BIC = Bayesian information criterion.
p < 0.1; **p < 0.05; ***p < 0.01.
We additionally calculated willingness-to-pay (WTP) values using the Delta method provided within the Apollo package ( 40 , 42 ).
Results and Discussion
Sample Characteristics
In the following, we present the composition of the sample of 537 organizations that participated in the long-term test and the underlying SP survey (Table 1). The study included a diverse heterogeneous cross-section of the German economy and the public sector, including companies, self-employed persons, public institutions, and NGOs/associations, fairly evenly distributed across all sectors of the economy. The companies were also distributed quite representatively across all sizes of city in Germany, not just metropolitan areas. A substantial proportion of respondents (83%) held managerial positions within their organizations, indicating their key role in influencing vehicle purchase and usage decisions. In addition, almost half of the respondents had a university degree and 4 out of 5 respondents were male.
The vast majority operate small fleets, with an average of 7.9 vehicles, a first quartile of two vehicles per fleet, and a third quartile of six. The average number of vehicles in each vehicle category is stated in Table 1. Around 98% of the total mileage is currently conducted by ICE vehicles. Concerning the design of the tested cargo bikes, “Long John” bikes accounted for the largest proportion, followed by front-loaded trikes.
The cargo bikes tended to be used more often for the provision of services than for freight transport. In around half the cases, the test vehicle was used solely by the respondent; in the other cases, the vehicles were used by both the respondents and other employees or (significantly less frequently) exclusively by others.
At the end of the testing period, the respondents evaluated their experience predominantly positively: 6 out of 10 rated the cargo bike as rather or highly suitable. When evaluating cost-effectiveness, respondents were somewhat more reserved, but overwhelmingly viewed the cargo bike as cost-effective. The respondents agreed that the cargo bike was fun for the employees, but that the introduction entailed organizational effort. The respondents were divided, however, when assessing road safety and range. Just under 3 out of 10 respondents subsequently decided to buy their own cargo bike.
Model Estimation Results
Adjusted rho-squared is a heuristic statistic that is useful for comparing models estimated on the same dataset. The Akaike- and Bayesian information criterion values provided insights into model selection, with lower values indicating better model performance. The model consisted of 24 estimated parameters, indicating a moderately complex model. The results can be found in Table 2.
In total, out of 4,833 choice situations, the cargo bike alternative was chosen 3,168 times (66%). Taking the car was the preferred choice of the respondents in 1,471 situations (30%). In only 194 cases (4%) did respondents select not to make the trip.
Variable ASC_CB represents the utility or attractiveness of choosing the cargo bike alternative, regardless of other attributes or characteristics of the choice situation. It served as a fixed constant that added to or subtracted from the overall utility of choosing the cargo bike option. In our model, the cargo bike alternative had a higher inherent attractiveness compared with other options.
ASC_nonchoice represents the utility of choosing not to make any trip, which was included in the experiments to account for situations in which individuals might decide not to choose any of the available alternatives. ASC_nonchoice in our models indicated that not choosing any option (meaning no trip) was generally less preferable or less attractive than choosing one of the alternatives.
The variance parameters in the error component model provided insights into the level of heterogeneity or variability in individual-specific preferences for each alternative. Larger variance values indicated more diverse preferences, whereas smaller values implied more homogeneity in the preferences for a particular alternative. These variance parameters were crucial in capturing unobserved factors that influenced individual choices and helped in understanding the relative importance of the different factors considered in the model.
SP Attribute Discussion
For the three temperature levels tested in the survey (−3°C/27°F, 5°C/41°F, and 18°C/64°F), the warmer the weather, the higher the probability of choosing a cargo bike over a car (Table 2).
As with the temperature, the occurrence of precipitation (i.e., rain or snow) strongly discouraged respondents from choosing the cargo bike. It is among the strongest factors for avoiding cycling in the conducted study. These results were consistent with those obtained by Malik et al., who found that the daily maximum temperature and the amount of rainfall or snow were the two main factors affecting trip length negatively ( 29 ).
Looking at an important pull factor (i.e., a strategy or effect increasing the utility of a certain mode) for bicycle mobility in general, this study also revealed the relevance of adequate bicycle infrastructure. The presence of good bike lanes had a clearly measurable effect in relation to a usage decision toward cargo bikes. Investing in good cycle paths could therefore lead to a significant advantage in the use of cargo bikes. The literature supports our findings: organizations are unlikely to use cargo bikes for commercial transportation on routes with poor physical infrastructure ( 14 ).
If there was a dedicated car parking space at the destination, the car was more likely to be chosen than the cargo bike for the trip. Conversely, a shortage of car parking made the cargo bike more attractive—also supported by the findings of Yu Faxèr ( 19 ) and consistent with Dalla Chiara et al.’s results ( 28 ). This shows the potentials for policy measures targeted at limiting car parking.
The estimated coefficient for the total cost of the trip indicated that higher costs decreased the likelihood of choosing any mode of transport. For detailed results on WTP, please refer to the section covering willingness-to-pay values.
In line with the expected negative correlations, a longer travel time reduced the willingness to use any vehicle. However, willingness to use was reduced to a much greater extent for the cargo bike (almost sevenfold) than for the car. Based on this result, cargo bikes appear to have a particularly positive benefit over short distances, whereas at higher trip distances (i.e., longer travel times), this push factor (i.e., the reduction of the utility of this mode) becomes more effective than the identified pull factors of cargo bikes. This is in line with Gruber and Narayanan’s findings ( 38 ).
The parameter relating to the risk of damaging goods was only significant for cargo bikes. This means that, for a similar frequency of load damage, this risk had a higher impact on the choice of cargo bike compared with car. This might be because of the expectation that damage to loads in a cargo bike will be more severe than in a car. It might also suggest that individuals associate a higher risk of damaging goods with cargo bikes, making them more cautious about using them for transporting valuable or fragile items. In contrast, the perceived risk of damaging goods while using a car seemed to have less influence on mode choice, implying that people might view cars as more reliable for transporting goods without incurring any damage.
The final variable from the choice set was risk of delay, which does not seem to have had a significant influence. It can be assumed that the chosen levels for the risk of delay (0%, 5%, or 15%) were too low to be perceived as relevant by the decision makers.
Additional Variables Discussion
The study also tested the effects of organizational and individual factors on the choice of vehicle. Concerning type of organization, it was shown that one-person businesses, that is, freelancers and self-employed persons, strongly preferred a cargo bike over a car in comparison to other types of businesses. Self-employed people who participated in the cargo bike test were seemingly even more eager than larger companies or public institutions to transfer the general will to test cargo bikes towards a more likely decision to use from journey to jorney. This is also facilitated by the autocratic fleet decision-making style ( 43 ).
Logistics practitioners often mention the different handling and fields of application of small and flexible- versus large and heavy-duty cargo bikes. However, in our model we did not find the design type distinction had a significant influence (i.e., having tested a two-wheeler “Long John” bicycle) on mode choice.
The respondents’ personal background also appeared to influence their choices. Individuals who frequently used personal bicycles and cargo bikes showed a strong tendency to choose the cargo bike option. Consistent with self-perception theory, respondents got used to a cargo bike as a mode of transportation through more frequent use and the resulting development of a stronger habit ( 33 , 34 ).
On commercial trips, respondents continued to travel predominantly with ICE-powered vehicles (see section “Sample characteristics”). Nevertheless, the more hours per week the person spent on the road, the more likely they were to choose the cargo bike. This type of vehicle thus appears to be suitable for real road transport professionals.
During the 3-month test period, companies were able to assess whether the cargo bike met their operational requirements. Factors such as daily mileage with the tested cargo bike and its capacity to spatially cover the business area played a crucial role in this evaluation. More mileage during the testing period increased willingness to use, whereas concern about insufficient range for the existing business area reduced it. Additionally, the need for organizational effort, associated with costs and staffing requirements, affected firms’ willingness to integrate cargo bikes in their short-term decision making. Furthermore, the test enabled the companies to estimate how laborious or expensive the introduction of cargo bikes would be for the company. Companies that associated a large operational effort with the integration of cargo bikes were also less willing to dispatch them in the analyzed short-term decision.
At the end of the test period, decision makers provided a fundamental evaluation of past and potential future cargo bike use cases within their companies. The assessment of the suitability of the cargo bikes for the company’s business purposes was, as expected, related to the decision to use them. Companies that were able to convince themselves of the suitability during the practical test clearly and significantly preferred the cargo bike to the car in the choice experiments. The same applied to around 30% of the companies that acquired their own cargo bike after the test without support from the project.
A final variable addressed the issue of road safety. Respondents who associated safety concerns with cargo bikes tended to prefer cars.
Among the numerous variables that were tested for correlations with the willingness to use cargo bikes or cars, there were also some insignificant variables worth reporting, including the following. At the individual level, gender and age of respondents did not significantly affect their decision between a cargo bike and a car, contrary to previous studies ( 20 ). The same applied to company size. Looking at contextual variables, population density also turned out to be nonsignificant. This was contradictory to findings suggesting that cargo bikes would be mainly suitable for urban centers and populated areas ( 18 , 21 ). Furthermore, some operational aspects also showed no significant influence, for example, whether companies performed time-critical transports or whether the companies were conducting freight trips or service trips.
Willingness-to-Pay Values
The WTP values presented in Table 3 provide insights into the monetary value the respondents placed on various attributes and factors related to the choice between the cargo bike and car options. They can be used to assess the relative importance of different factors and guide decision-making processes related to transportation policies and infrastructure investments.
Willingness-to-Pay Values
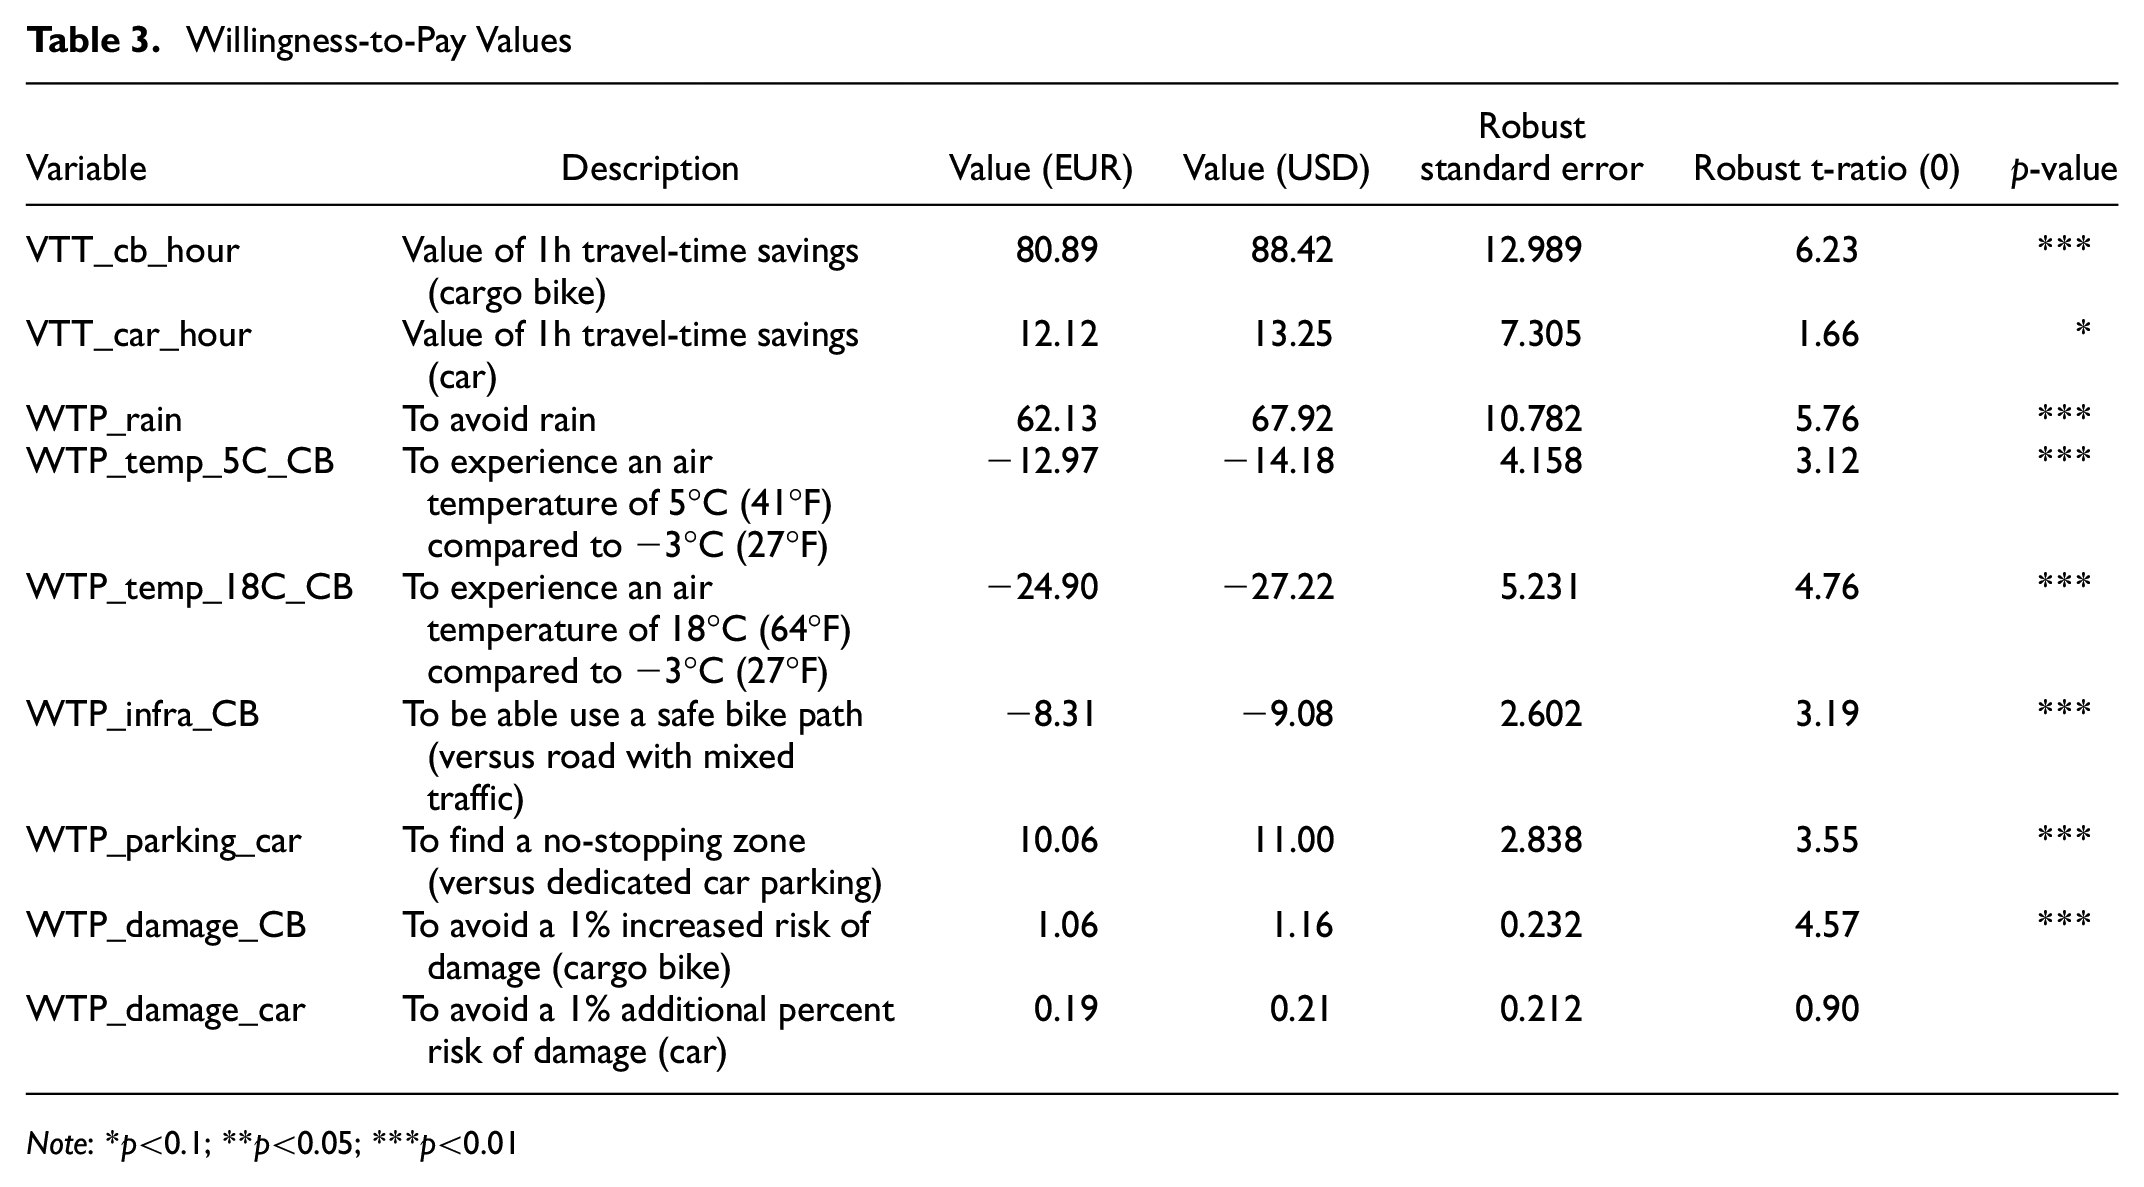
Note: *p<0.1; **p<0.05; ***p<0.01
The value of travel time for a cargo bike represents the monetary value that respondents placed on saving an additional hour of travel time when using a cargo bike. Respondents were willing to pay €80.37 for saving an additional hour of travel time with the cargo bike, compared with €11.67 when choosing the car.
When riding a cargo bike, respondents were willing to pay €61.99 to avoid rainy weather and €13.08 or €25.01 to experience warmer temperatures, that is, 5°C or 18°C, instead of −3°C (negative WTP values were because of the opposite sign of the estimators).
We can see that the WTP for avoiding a 1% increase in damage risk with the cargo bike (€1.08) was higher than the WTP for avoiding the same 1% increase in damage risk with the car (€0.15). The values indicated that respondents were more concerned about the risk of damage associated with using a cargo bike compared with the risks associated with using a car.
Respondents were willing to pay an additional €8.16 to have better or improved infrastructure that supports the use of cargo bikes. They valued the convenience of parking and were willing to pay an additional €9.94 to have access to a parking spot at their destination.
Strengths and Limitations
With a focus on nationwide representation, the study covered over 500 organizations from half of the 400 German administrative districts. This large-scale testing approach provided valuable insights into the transport practices of companies and municipalities in different urban environments. Furthermore, to our knowledge, there is no equivalent experimental design for researching the willingness to use small vehicles for urban logistics, including an extensive 3-month vehicle test that was conducted before the SP survey. This resulted in a less hypothetical SP experiment.
However, the survey also has its limitations. Methodically, the nonchoice choice option (chosen by 4%) was too large to exclude, but too small (194 cases) to include as a separate category. Therefore, it had to be merged with car as opposed to the cargo bike choice. In addition, the study tested many variables in relation to a small sample. There was also a certain selection bias: only project participants took the SP survey, all of whom were motivated to trial and use cargo bikes. At the same time, it should be noted that the sample included not only decision makers but also executing employees, some of whom were significantly less motivated and also appeared as car-non-traders (i.e., persistent choice of the car alternative) in the SP survey.
Conclusion
Against the background of increasingly complex urban transport with smaller goods and growing customer demands, the choice of possible vehicle types for fleet decision makers, independent drivers, or service providers is also increasing. This diversification is relevant for the further analysis of the mode choice decision, which should be extended with smaller-vehicle classes below cars or trucks. This contribution revealed the determinants that influenced cargo bike mode choice in an emerging area of urban logistics with a high share of smaller vehicles, short-distance trips, and one-person businesses.
Based on a large-scale test of 537 cargo bike long-term testers, it was found that trip-specific and contextual factors played a large role in (not) choosing a cargo bike. Generally, cargo bikes are particularly useful for short trips. The longer the distances, the greater the disbenefit compared with the car. Of relevance for transportation policy makers is that the existence of suitable bicycle infrastructure and the reduction of car parking spaces both have a significant positive effect on the decision to choose alternative modes, such as cargo bikes. Not surprisingly, unpleasant weather conditions discourage use. However, rain is a much stronger deterring factor than cold temperatures. Cargo bike manufacturers could meet this requirement and provide, for example, a flexible rain cover.
It was noticeable that the cargo bike was frequently chosen (in a motivated population). The findings of this study highlight the significant influence of experience when it comes to mode choice decisions. Positive vehicle testing experiences increased the willingness to choose the cargo bike, as did individual experience, such as being used to biking in their private life. This shows the benefits of low-threshold trials (i.e., entailing low effort and cost), as growing personal experience can remove reservations and obstacles toward cargo bike usage. We interpreted these results in the direction of a connection between own test experience, increased trip-specific cargo bike choice, and long-term purchase decision. Further investigations can be initiated here.
Footnotes
Acknowledgements
The authors thank Raphael Piendl, Felix Steck, Viktoriya Kolarova, Lars Thoma, and Andres Gavilan (all currently or formerly employed at the German Aerospace Center) who were involved at earlier stages of the survey design and modeling.
Author Contributions
The authors confirm contribution to the paper as follows: study conception and design: J. Gruber; data collection: J. Gruber, L. Damer; analysis and interpretation of results: J. Gruber, M. Plener, L. Damer, I. Dubernet; draft manuscript preparation: J. Gruber, M. Plener, L. Damer, I. Dubernet. All authors reviewed the results and approved the final version of the manuscript.
Declaration of Conflicting Interests
The authors declared no potential conflicts of interest with respect to the research, authorship, and/or publication of this article.
Funding
The authors disclosed receipt of the following financial support for the research, authorship, and/or publication of this article: Generation and publication of the results shown were made possible by the projects “Ich entlaste Städte” (grant no. 03KF0066) and “Ich entlaste Städte 2” (grant no. 67KF0154) of the German National Climate Initiative, funded by the Federal Ministry for the Environment and the Federal Ministry for Economic Affairs and Climate Action.