
Abstract
Large-scale transport infrastructure projects generate long-lasting changes in the built environment and alter the lives of nearby residents. It is crucial to understand public perceptions of public-transit projects and associated construction impacts, as they influence the social acceptance and eventual success of such projects. To characterize the construction-phase experiences of a new light rail in Montréal, Canada—the Réseau express métropolitain (REM)—we analyzed data from 1,236 respondents from the Greater Montréal region who self-reported ongoing construction activities near their homes. This study employs an exploratory factor and k-means cluster analysis to group residents by their different experiences and perceptions of the REM and its associated construction impacts. The analysis returned five clusters with distinct construction experiences: construction-concerned travelers, REM-critical respondents, neutral travelers, REM enthusiasts, and rerouted travelers. Subsequently, the acceptability of the impacts during the construction phase on each cluster is assessed by comparing perceptions of the impact of neighborhood change on their quality of life and their intention to use the REM. Finally, we derive targeted policy recommendations to help promote increased social acceptability of light-rail transit (LRT) projects, including mitigating disruptions in construction zones, public information campaigns, and inclusive decision-making processes. Findings from this study can benefit policymakers and transport planners as they aim to reduce the disruptions associated with the construction of LRT systems and promote increased social acceptability.
Large-scale public-transport projects have several positive long-term benefits, including reductions in air pollutants, increases in physical activity levels among users, and increases in property values (1–4). However, they can also generate long-term negative externalities such as residential displacement and unaffordability for incoming residents ( 5 , 6 ). In the short term, the construction work associated with these projects can lead to increased traffic congestion and rerouting, spikes in air and noise pollution, and exposing surrounding buildings to vibrations (1, 7–11). While long-term externalities of large-scale public-transit infrastructure are well studied, impacts of the construction phase remain mostly overlooked, especially with regard to social perceptions of disruptions during the construction period, which can extend to several years. Given the importance of social perceptions and acceptability in shaping political action in the transport field, it is crucial to understand the impacts of large-scale public transport projects during their construction phase ( 12 , 13 ). This will help derive mitigation policies that will improve the social acceptability of such projects.
To study the construction impacts of a large public transit project, we analyze survey data on the experience of construction of the Réseau express métropolitain (REM), a new 67 km light-rail transit (LRT) system in Montréal, Canada. We employ a factor and k-means cluster analysis approach to segment survey respondents who self-identified as being affected by the construction of the REM near their home location based on their perceived impacts of the construction and the project. Home locations were chosen over workplaces, schools, and other destinations to minimize overlap in respondents citing ongoing construction in multiple locations. We then analyze each cluster based on their sociodemographic characteristics, intention to use the system, and overall perceptions of the effect of changes in their neighborhood on their wellbeing. Lastly, we use our results to derive policy recommendations for different population segments to mitigate construction impacts and improve overall perceptions of LRT. The findings of this paper will be of value to policymakers across North America and beyond when aiming to minimize negative externalities associated with the construction of new public-transit infrastructure.
Literature Review
Limited scholarship has been dedicated to evaluating the impacts experienced during the construction phase of new transport infrastructure. Commonly identified negative externalities experienced during construction include increased air and noise pollution, increased congestion, and increased road accidents (1, 7–9, 10, 14–17). Concerning public-transport projects specifically, a few studies have highlighted how construction work for such projects leads to increased traffic as a result of road closure for cars and changes in transit bus services, and suggested mitigation for these issues ( 7 , 8 ). Air pollution and energy consumption have also been shown to increase during the construction phase of new rail transit before eventually decreasing below initial levels in the long term following the system’s opening ( 1 ). Similarly, increased noise from construction activities was found to be a nuisance to nearby residents and businesses ( 9 , 10 ). Xue et al. used structural equation modeling to identify crucial factors to consider during the construction of new subway lines in China, namely changes in residents’ travel, transportation, environment, and daily life ( 10 ). Wong-McSweeney et al. analyzed the level of annoyance and acceptability of residents living next to construction work for a new LRT ( 11 ). Overall, most studies have focused on objectively measured impacts of construction work, with a limited number of studies integrating perceived impacts and social perceptions in their analysis (1, 7, 8, 10, 11, 15). Scholarship on the effects of public-transit construction has also been mostly centered in China, meaning there is a gap for such analysis in other regions.
The general oversight of subjective impacts during construction is a significant limitation of the current literature on new public-transit infrastructure. Indeed, a growing literature studying social perceptions of public-transit projects has highlighted that fostering positive opinions can facilitate project implementation ( 12 , 13 , 18 ). Positive perceptions of public-transit projects before and during construction have been linked to increased intentions to use the service once operational (19–21). These positive perceptions can pertain to expected environmental and health benefits, the reach of those benefits both locally and regionally, as well as the quality of the service that a project will provide (20–23). While construction impacts have yet to be extensively studied with regard to their effect on the social acceptability of public-transport projects, the juxtaposition of the current literature on the objective impacts during the construction phase and the public perception scholarship underscores their potential importance. By focusing on social perceptions of construction work, this paper aims to contribute a new dimension to the literature on public perception of transport projects.
Study Context
The REM’s construction was announced in 2016, and the first segment opened in the summer of 2023 (Figure 1). It is the largest public-transit project in the province of Québec since the inauguration of the Montréal Metro system in 1966 ( 24 ). This new system will primarily serve suburban areas but is nonetheless expected to provide improved public-transit service to the more than four million residents of the Montréal region ( 25 ). Estimated initially at $5.5 billion and set to open gradually between 2020 and 2022, the project has since been reevaluated upwards of $8 billion. It is expected to continue opening in phases until the end of 2027 ( 26 ).
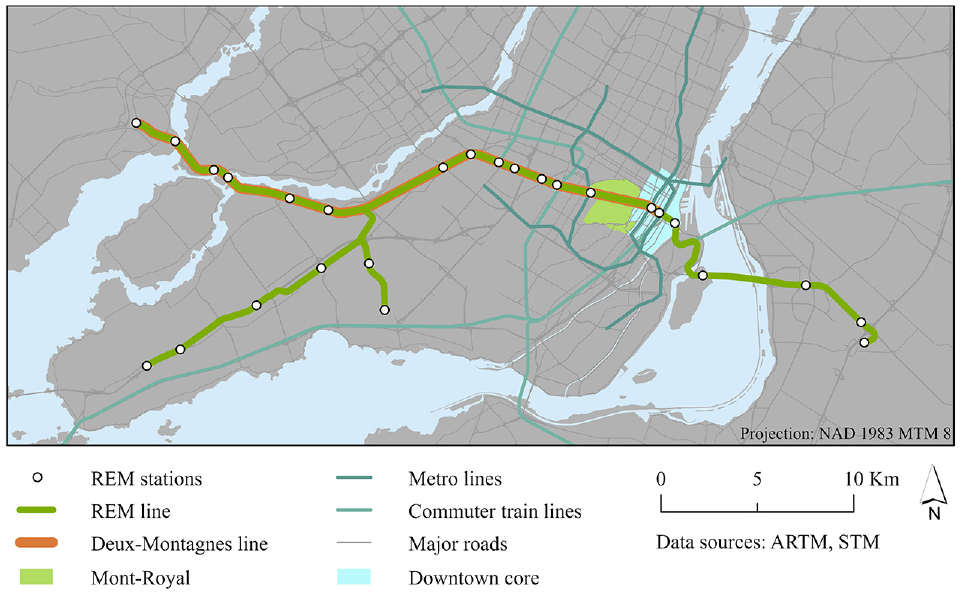
Map of the Réseau express métropolitain (REM) in Montréal, Canada.
The REM uses an automated and fully grade-separated LRT system running primarily on aerial structures, with limited underground sections in the urban core and toward the airport. Existing aerial transport structures in the Montréal region are exclusively roads and highways, meaning that the REM is the first aerial public-transit infrastructure in the region. As part of its route, the new LRT overtook the right-of-way of a previously existing commuter train line, the Deux-Montagnes line. At the time of the REM’s announcement in 2016, the Deux-Montagnes line was serving an average of 20,800 users per day, making it the most used commuter train line in the region with more than double the ridership of the second most used commuter line ( 27 ). The Deux-Montagnes line saw its service gradually reduced in 2018 before its complete suspension in December 2020 ( 28 ). Local transit agencies provided shuttle buses to offset the effects of the line’s closure during the construction phase of the REM. With the service for this network branch set to restart only at the end of 2024, travelers who used this line will still have had over 4 years without any rail service. Another critical transport infrastructure granted to the REM is the tunnel under Mount Royal, the only way to directly access downtown Montréal by rail from the north of the Island. In doing so, the arrival of the REM forced the rerouting of another new commuter train line that opened in 2014, adding over 30 min of travel time to get downtown.
Data and Methods
Data Collection and Data Cleaning
In Fall 2022, the Transportation Research at McGill group conducted the third wave of the bilingual Montréal Mobility Survey. Following Dillman et al.’s suggestion for online surveys, multiple recruitment methods (i.e., marketing company, social media ads, flyer distribution, and invitation emails) were applied to ensure a large and representative sample ( 29 ). A total of 6,422 responses were collected, which was reduced to 4,065 after the application of preliminary data-cleaning methods ( 30 ).
For the sub-selection of the sample group for this paper, all respondents were asked about the status of the construction of the REM near their home, workplace, or school (i.e., if construction is finished, underway, planned, or not present). For each location (home, work, or school) where a respondent indicated ongoing REM-related construction, respondents were prompted to report their agreement to seven statements about the impact of ongoing construction on their daily lives. These answers were paired with sociodemographic, travel behavior, and perception data to provide a basis to segment and characterize sample populations.
To minimize temporal bias in the responses, we decided to limit our sample to respondents who indicated that “construction is currently underway” (N = 1,801). Furthermore, because of the high overlap in respondents citing ongoing construction in multiple locations, only individuals who reported ongoing construction near their primary home location were selected for the sample (N = 1,487). This allowed us to avoid having to average potentially contradictory responses across several locations, minimizing the introduction of bias in the analysis. The retained 1,487 responses were then further filtered according to the following exclusion criteria:
Incomplete or unrealistic sociodemographic information (N = 78), such as not answering questions about gender or disability status.
Individuals who had moved into their current neighborhoods after 2020 (N = 171). These respondents were not prompted to answer questions about perceived neighborhood changes and thus could not offer a firsthand reference to pre-construction neighborhood conditions.
Lack of quantifiable accessibility data (N = 2), such as if the home location was outside Montréal’s Census Metropolitan Area (CMA).
As such, the final sample used in the analysis was composed of 1,236 responses. Figure 2 displays the home locations of retained respondents. It is important to note that, while several respondents are outside the areas affected by the REM’s construction, no objective threshold was imposed, given that we aim to analyze perceived impacts.
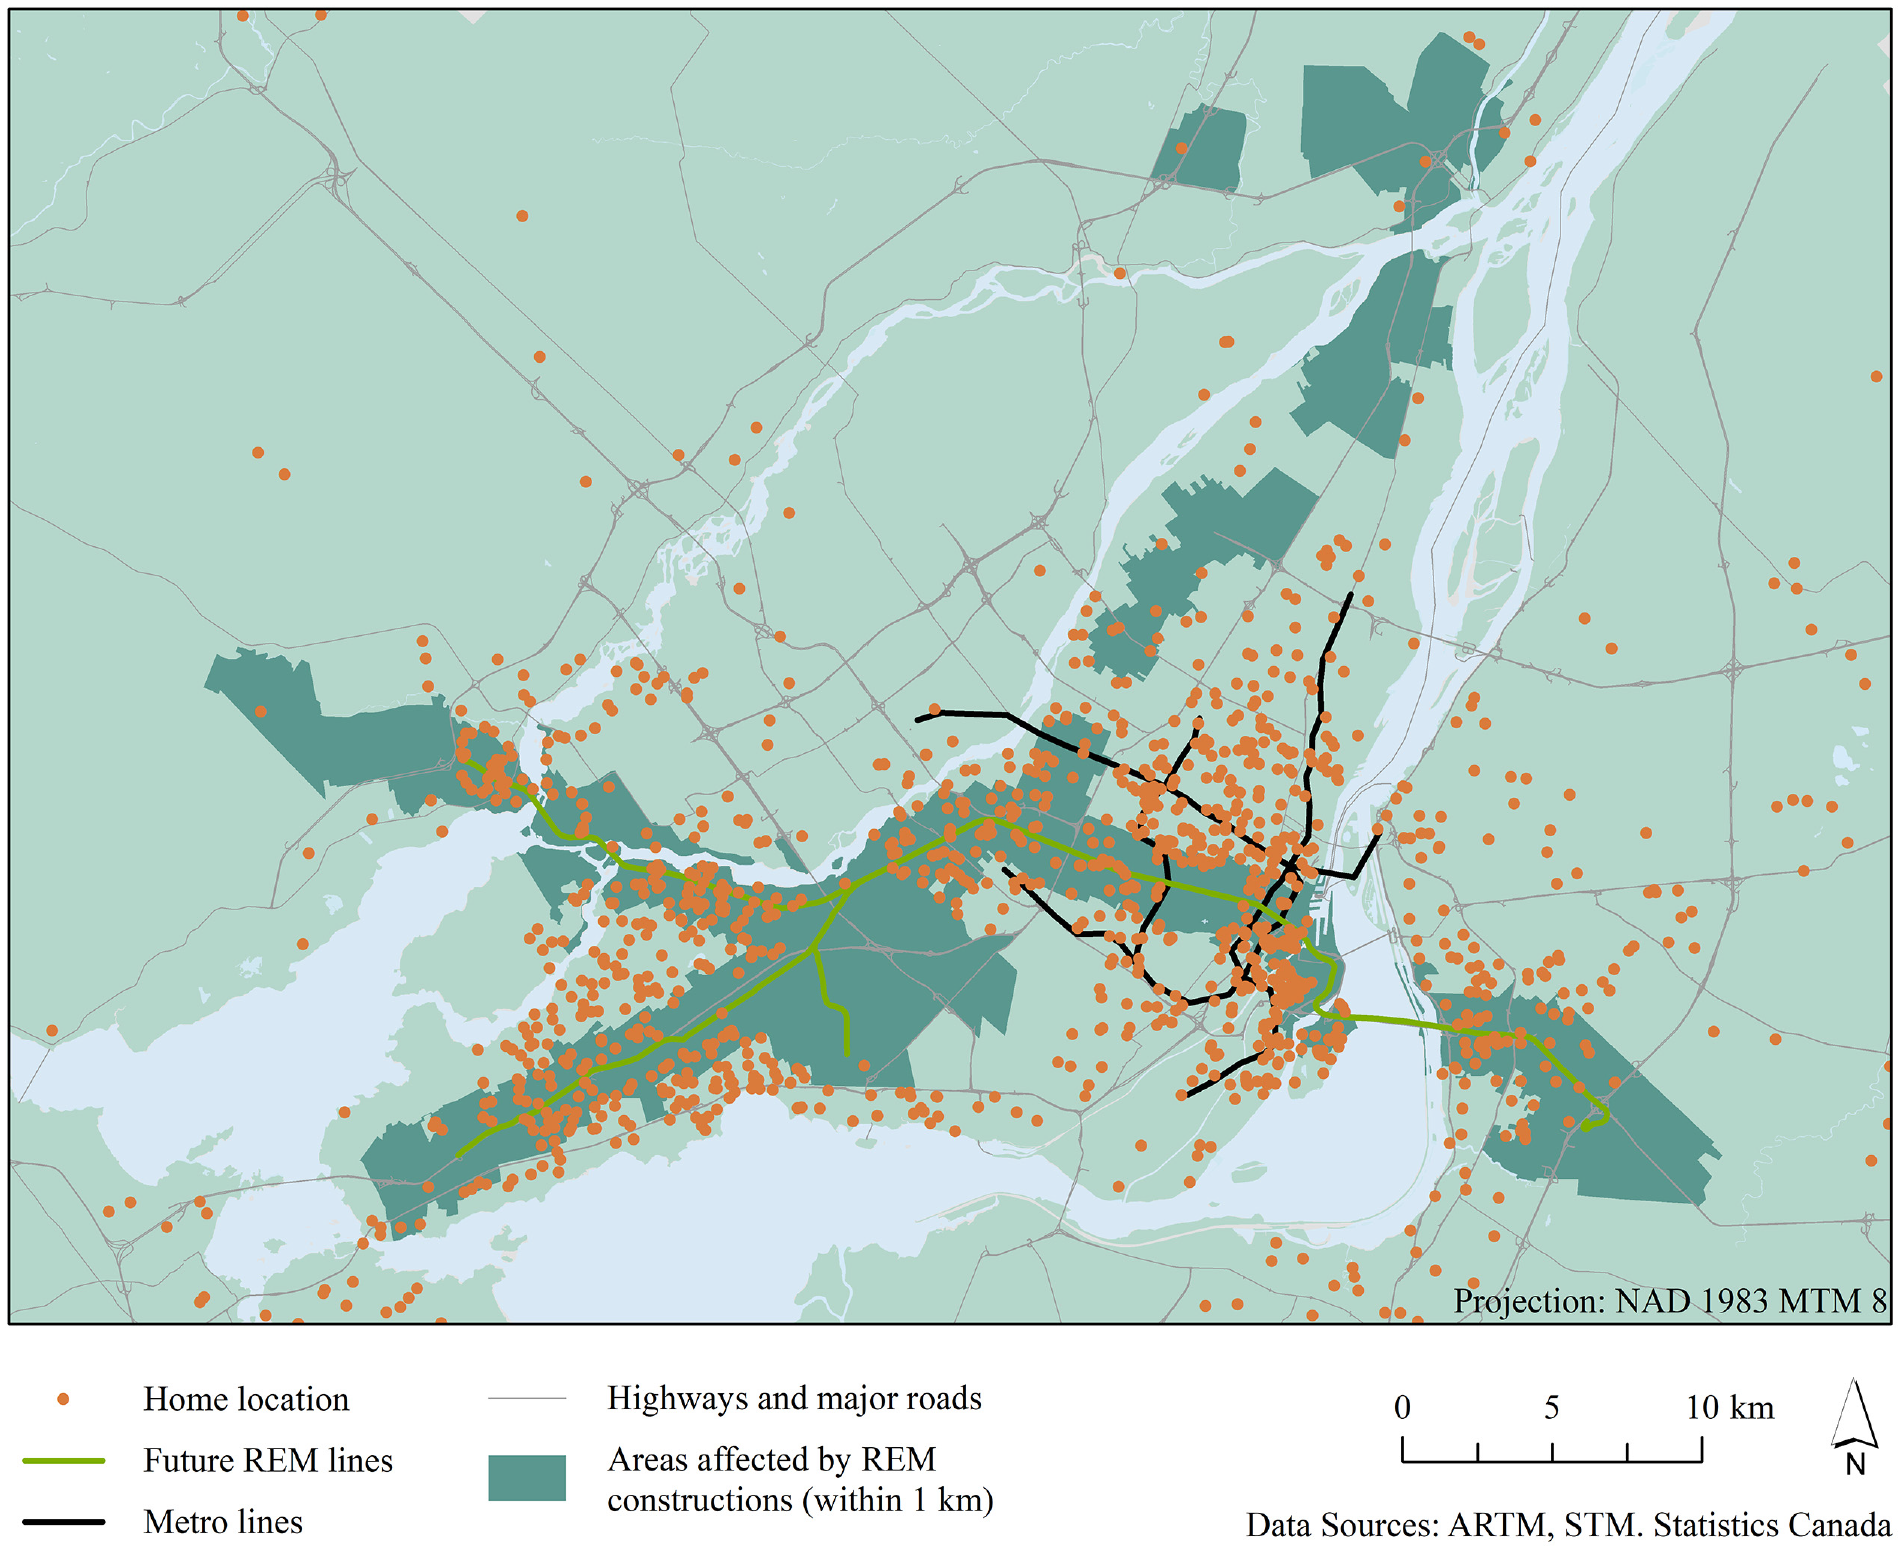
Home location of respondents who self-reported ongoing Réseau express métropolitain (REM)-related construction near their home.
Exploratory Factor Analysis (EFA) and Cluster Test
This study employs a principal component factor analysis followed by k-means cluster analysis to segment inhabitants of the Montréal CMA by their differential experiences and perceptions of the REM project and its associated construction. This method takes an exploratory approach to capture overarching concepts (factors) from related variables, offering potential interpretations of patterns within correlated question and response data. These overarching factors are then used to segment respondents by conceptual groupings (clusters) for ease of analysis. This proposed market segmentation is further explored by mapping home locations and calculating summary statistics of additional variables of interest.
Analysis was performed using R statistical package (Windows Version 4.3.0; R Core Team, 2023), and its psych (Version 2.3.3), stats (Version 4.3.0), factoextra (Version 1.0.7), and NbClust (Version 3.0.1) packages. The principal component factor model selected used iterated principal axis estimation—specifically a principal factors analysis, with a varimax factor rotation method—and was based on a Pearson correlation matrix. The k-means method is a prototype-based, partitional clustering technique that iteratively generates clusters based on the cluster object’s mean value ( 31 ).
Similar approaches have previously been used within the transport field to create market segmentations of traveler typologies according to travel modes, preferences, and behaviors (32–38). These approaches were applied to segment the travel market and the actual and potential public-transit market. Variables that have been included in previous market segmentation approaches captured attitudes toward travel, travel behavior and travel satisfaction, and sociodemographic characteristics. This paper aims to adopt similar market segmentation methodologies to create typologies of differential experiences with the REM project and related construction.
Factor Analysis
Based on the literature, 36 variables were initially identified as relevant to the analysis, covering topics such as intention to use the REM, perceptions of the the REM project, current travel preferences, perceptions of neighborhood changes, and sociodemographic identifiers (32–38). Throughout the exploratory factor analysis (EFA), variables were systematically removed from the selection to optimize the factor analysis’s quantitative strength and theoretical convergence. To assess the appropriateness of this data for EFA, Barlett’s test of sphericity was applied to ensure a non-random correlation matrix, and the Kaiser-Meyer-Olkin (KMO) measure of sampling adequacy (MSA) statistic was required to exceed 0.5 ( 39 , 40 ). Furthermore, the Pearson correlation matrix offered complimentary subjective verification, specifically the visual inspection of the number of correlations exceeding +0.30 ( 41 ).
Overall, criteria for determining the number and adequacy of factors were established a priori. Parallel analysis and natural breaks in generated scree plots helped to identify optimal numbers of extracted factors before the amount of specific variance would begin to dominate the common variance structure. This factor selection was further facilitated by the requirement that all factor loadings exceed the minimum requirements (0.50) for practical significance within the given sample size ( 41 ). Finally, affirmative perspectives within the literature and conceptualizations of the data were required to support the thematic coherence of the factor components.
Cluster Analysis
Following EFA, factor loadings were used for a k-means clustering of the data sample. Clustering was performed with an exploratory purpose to propose a simplified structure for respondent segmentation. An average silhouette width plot was generated using R to visualize a range of the optimal number of clusters. Following Ikotun et al.’s method for data k-means clustering, full-data clustering was attempted within the range of cluster numbers until a stable solution with high intra-class and low inter-class similarities was found ( 31 ). Once a stable cluster solution was identified, the data were re-clustered with a researcher-specified seed point for ease of replicability.
Descriptive Statistics
To provide a more holistic understanding of the cluster typologies, we computed descriptive statistics for several variables. For sociodemographics, we considered respondent’s gender, age, household income, and disability status, which were all reported as proportional values. We then considered intentions to use the REM, which were reported on a Likert-scale from “very likely” to “very unlikely” as well as agreement levels with three key statements (i.e., “The government is investing in my neighborhood,”“The changes in my neighborhood are improving my quality of life,” and “I am concerned about my ability to stay in my neighborhood due to rising housing costs”) which were reported on a Likert-scale from “strongly agree” to “strongly disagree.” All three of these statements were chosen because they relate to perceived impacts at the neighborhood level, which encompasses the REM since respondents self-reported experiencing its construction-related impacts near their homes. To facilitate the calculation of a unique value for each of these four items, we converted the 5-point Likert-scale into numerical values from −2 (“very unlikely” and “strongly disagree”) to 2 (“very likely” and “strongly agree”) with 0 representing “neutral” responses.
The last variables we considered were related to respondents’ travel behavior and the geographical characteristics of their home location. For travel behavior characteristics, respondents’ main travel mode was calculated as the mode they used to conduct at least 50% of their trips. In cases where no mode was used for more than 50% of the trips, a respondent was categorized as multimodal. The proportion of past Deux-Montagnes line users was also calculated for each cluster. For geographical data, the distance to the REM line, used as a proxy for distance to construction, was calculated as a Euclidean distance. The proportion of respondents living within a 1.2 km airline buffer of the REM stations was then calculated for each cluster. This threshold was chosen as it represents the maximal distance that 80% of transit users would walk to rail transit ( 42 ). Lastly, proportional improvements in accessibility from the REM (e.g., ease of reaching destinations) were calculated in r5r by comparing the number of jobs accessible by public transit with and without the REM within 45 min at the census dissemination area level. Job and geographical boundary files were obtained from the 2016 Canadian Census, while General Transit Feed Specification (GTFS) and street networks were obtained from open-source websites (i.e., Transit Land and Open Street Map) ( 43 ). The research team built the GTFS data for the after period to incorporate REM.
Results
Factor Analysis Results
The appropriate EFA model corresponding to the previously discussed criteria (Factor Analysis section) was composed of 10 variables subsequently used to generate three factor groups (Table 1). All 10 variables were reported on a 5-point Likert scale from “strongly agree” to “strongly disagree” and subsequently converted to a “−2” to “2” scale, with “2” reflecting the most positive perceptions and “−2” the most negative. The first component generated, Construction impact on wellbeing, groups variables related to the self-reported psychological impacts of construction on daily travel experiences. The second component, Perceptions of the REM, includes respondent perceptions of assorted potential benefits and drawbacks of the REM project. The third component, Construction impact on daily travel, encompasses perceived disruptions to everyday travel, namely construction-related changes in route and mode during commutes. Table 1 presents survey questions and loading scores extracted from the final pattern matrix, detailing their weights within their respective components. All variables had high loadings with their respective factors (0.697–0.835), and all factors had significant reliability (Cronbach alpha = 0.850–0.867), which has content validity ( 41 ). Given that the variables used to generate the factors were all coded with the same directionality (2 being the most positive and −2 the most negative), negative factor scores can be understood as negative perceptions, positive scores as positive perceptions, and scores closer to 0 as more neutral.
Factor Outputs from Exploratory Factor Analysis
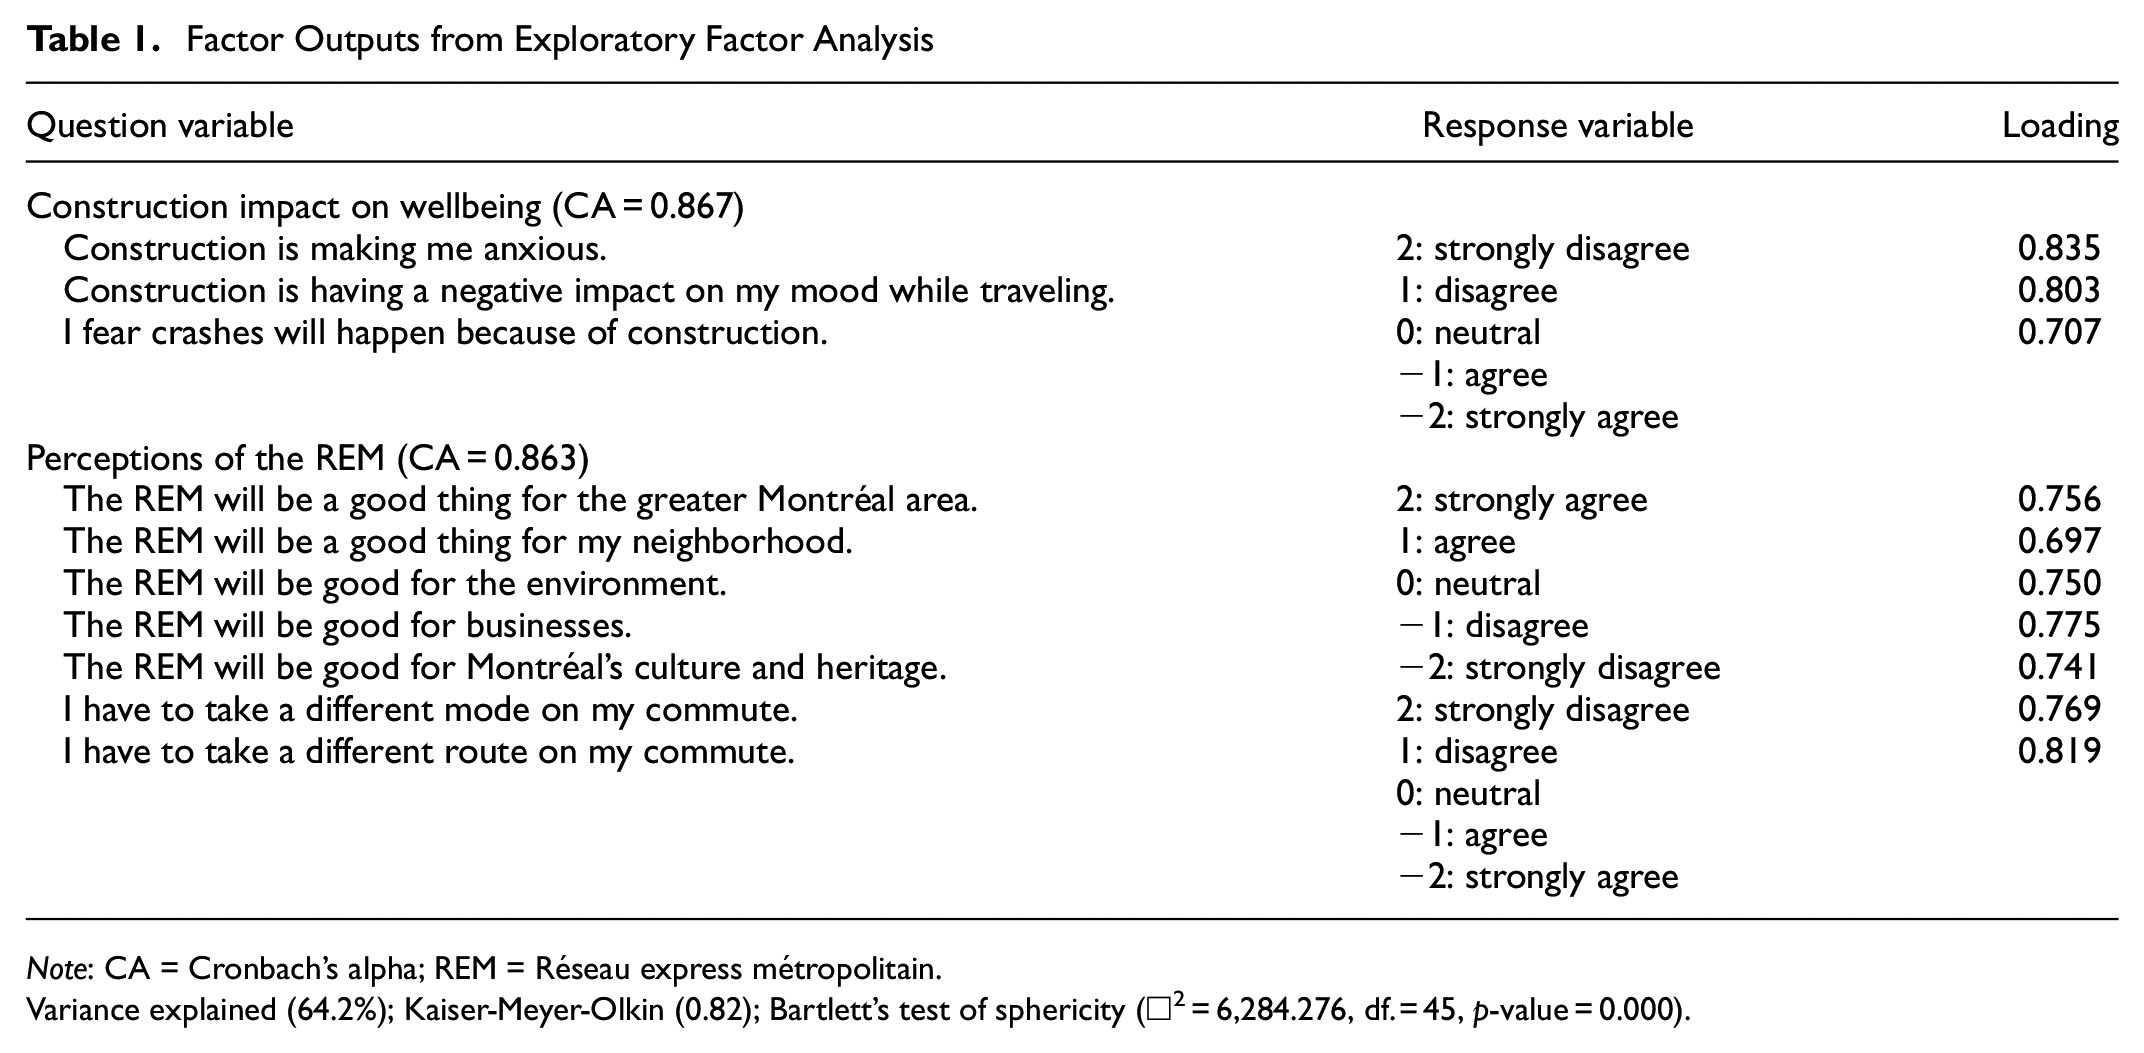
Note: CA = Cronbach’s alpha; REM = Réseau express métropolitain.
Variance explained (64.2%); Kaiser-Meyer-Olkin (0.82); Bartlett’s test of sphericity (□2 = 6,284.276, df. = 45, p-value = 0.000).
Cluster Analysis Results
Per the silhouette plots, k-means clustering was attempted using the factor loading for three to eight groups, with five returning the best fit of logical and thematically distinct clusters. The five final clusters are: construction-concerned travelers (24%, N = 295), REM-critical respondents (13%, N = 163), neutral travelers (27%, N = 336), REM enthusiasts (20%, N = 244), and rerouted travelers (16%, N = 198) (Figure 3).
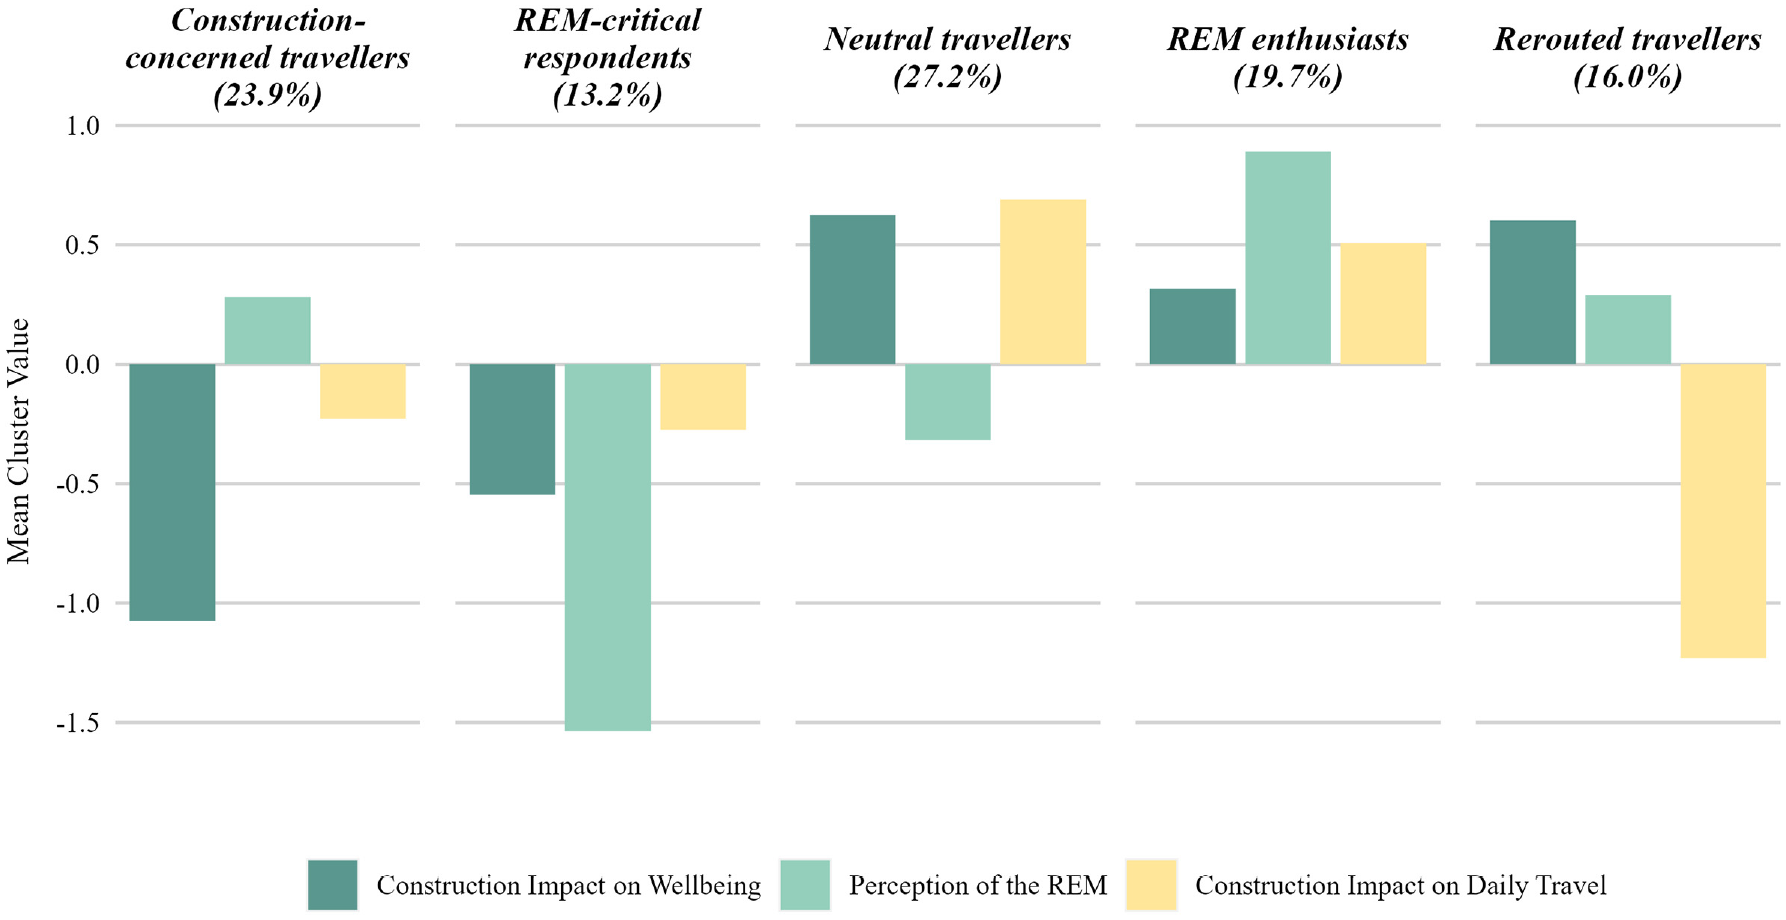
K-means cluster analysis for respondents self-reporting Réseau express métropolitain (REM)-related construction near their home.
Respondents’ home locations were mapped by cluster group to enhance findings by interpreting geographical patterns (Figure 4) to better understand who is affected by the REM’s construction and where. Overall, as observed by the wide spread of home locations throughout the CMA, proximity to REM-related construction was found to be highly subjective. In fact, among individuals who reported REM-related construction near their primary home locations, the median airline distance to the REM line is 2.0 km, with respondents scattered throughout the CMA.
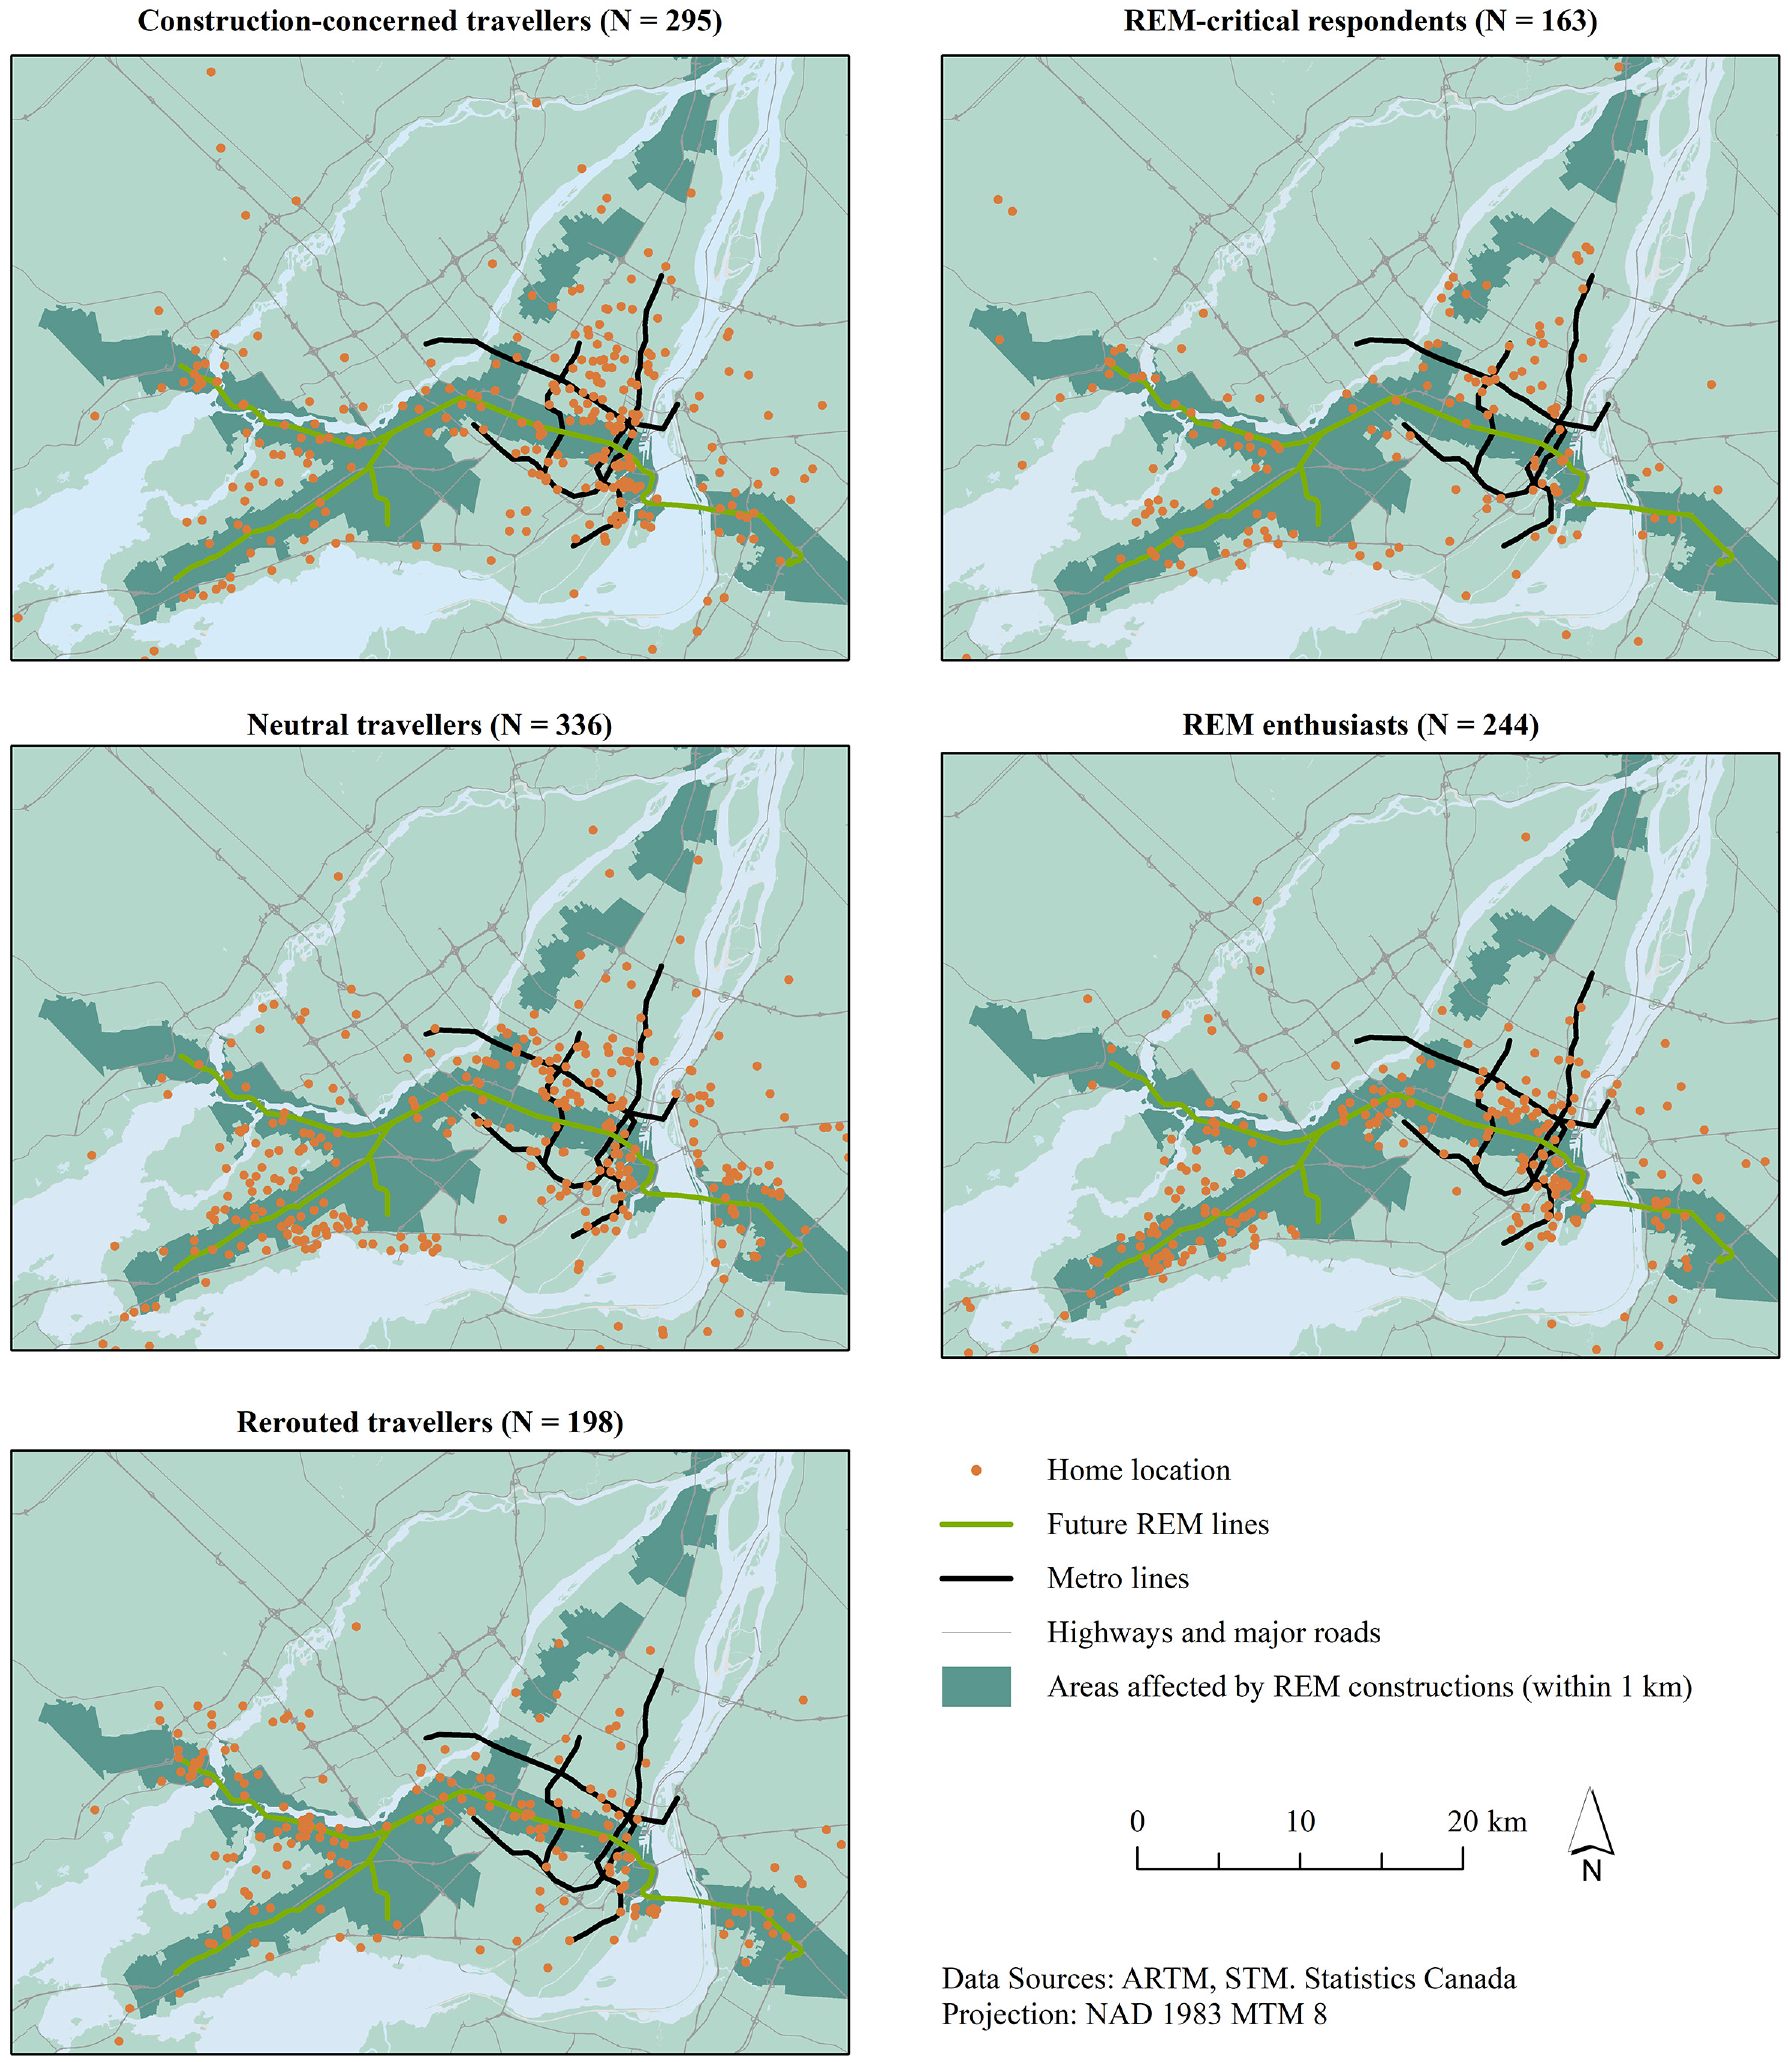
Home locations of respondents in each of the five clusters relative to areas affected by construction.
Descriptive statistics for respondents’ sociodemographic, behavioral, and geographical characteristics within the five cluster groups and for the overall sample (calculated as discussed in the Descriptive Statistics section) are presented in Table 2.
Sociodemographic, Behavioral, and Geographical Descriptive Statistics of the Five Clusters
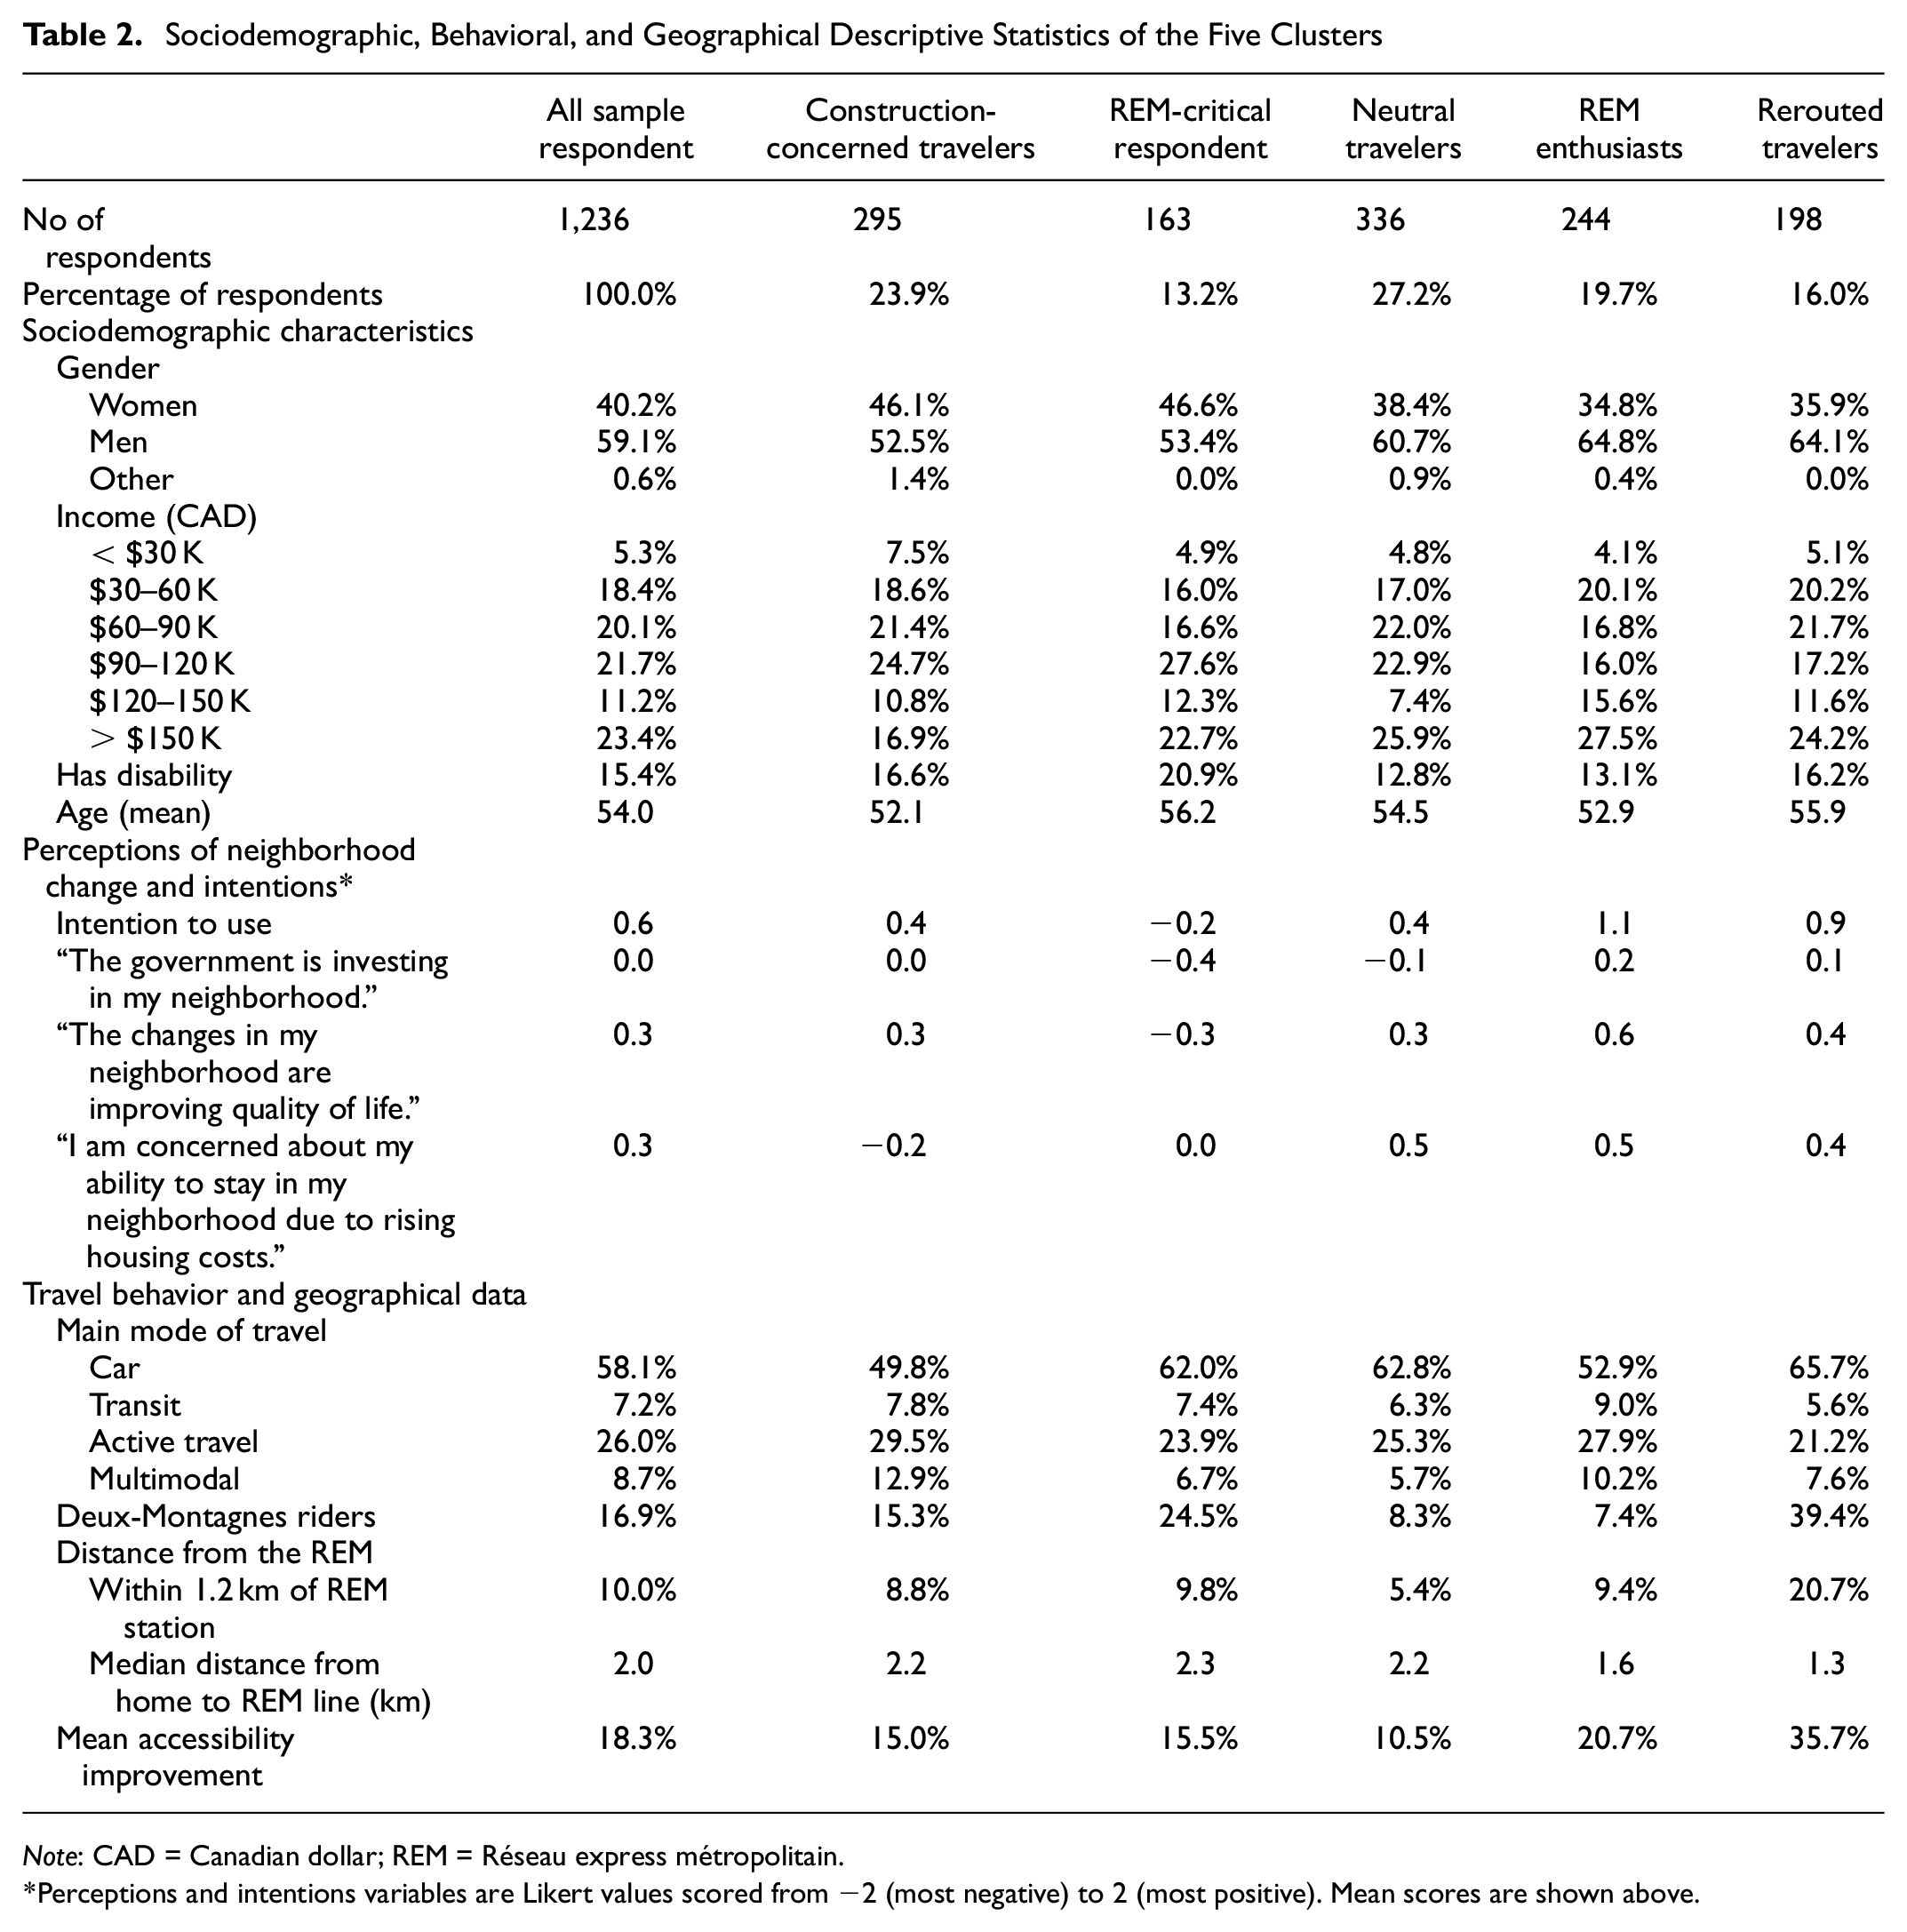
Note: CAD = Canadian dollar; REM = Réseau express métropolitain.
Perceptions and intentions variables are Likert values scored from −2 (most negative) to 2 (most positive). Mean scores are shown above.
Construction-Concerned Travelers
This group represents the second-largest cluster (23.9%). This cluster experienced more negative impact of construction on their wellbeing than any other cluster (factor score = −1.1). Respondents in this group reported slightly negative perceptions of the REM’s construction on their daily travel (factor score = −0.22). Despite stating that the construction is heavily affecting them, they retain a positive overall perception of the REM project (factor score = 0.28).
The construction-concerned cluster comprises 5.9% more women than the overall sample (46.1% versus 40.2%) while having the highest proportion of active and multimodal travelers (29.5% and 12.9%, respectively) and the lowest proportion of car drivers (49.8%) across all five clusters. Lastly, this group is the most concerned about rising housing costs (−0.2 versus 0.3 for the full sample) and has an overall intention to use the REM that is lower than the overall sample (0.4 versus 0.6 for the full sample).
REM-Critical Respondents
This group is the smallest cluster (13.2%) and is characterized by an overwhelmingly negative perception of the REM project (factor score = −1.54). REM-critical respondents were also the second most affected cluster by construction both on their wellbeing (factor score = −0.55) and on their daily travel (factor score = −0.27).
This cluster contains 6.4% more women than the overall sample (46.6% versus 40.2%). REM-critical respondents comprise the second-largest proportion of past Deux-Montagnes riders (24.5%) and are the farthest group from the REM line (median distance of 2.3 km). This cluster is the only one with a negative intention to use the REM (−0.2), meaning they are more likely not to use the REM than to use it. Finally, REM-critical respondents report the most vocal disagreement that the government is investing in their neighborhood (−0.4) and that these changes are improving their quality of life (−0.3).
Neutral Travelers
This group is the largest cluster (27.2%). Neutral travelers reported the lowest rates of construction impacts on wellbeing (factor score = 0.62) and daily travel (factor score = 0.69) out of any cluster. Still, this cluster group tends to have a slightly negative overall perception of the REM project (factor score = −0.32). This suggests an overall lower level of engagement with construction and the REM itself compared with individuals in other clusters.
Consistent with what is observed with factor characteristics, the neutral travelers also have middling intentions to use the REM (0.4) and relatively neutral perceptions of the effects changes in their neighborhoods have on their quality of life (−0.1). Neutral travelers are tied with REM enthusiasts for the lowest level of concern about rising housing costs (0.5). They also comprise the smallest number of respondents living within 1.2 km of a REM station (5.4%) and the second-farthest cluster from the REM line (median distance of 2.2 km). Furthermore, neutral travelers are predicted to experience the smallest proportional increase in accessibility because of the REM out of any cluster (10.5%).
REM Enthusiasts
This group represents the third largest cluster (19.7%). REM enthusiasts are characterized by their strong positive perceptions of the REM project (factor score = 0.89) combined with minimal disruptions to daily travel (factor score = 0.51) and wellbeing (factor score = 0.32).
REM enthusiasts are underrepresented by women (34.8% versus 40.2% overall) and have the smallest proportion of Deux-Montagnes riders (7.4% versus 16.9% overall). This cluster has the highest proportion of transit users (9.0% of the cluster) and below-average car user representation (5.2% lower than the whole sample). REM enthusiasts are the second-closest cluster to the REM line by median distance (1.6 km median). They are predicted to experience the second-largest mean improvement in accessibility (20.7%) and report the highest intention to use (1.1).
Rerouted Travelers
Rerouted travelers are the second smallest cluster, comprising 16.0% of the sample. This group is primarily characterized by having the highest self-reported negative impacts of construction on their daily travel (factor score = −1.23). Rerouted travelers have a slightly favourable perception of the REM (factor score = 0.29) in addition to reporting the second-lowest negative impacts of construction on their wellbeing (factor score = 0.60).
The rerouted travelers cluster has the most significant representation of former Deux-Montagnes line users at 39.4% (2.3 times more than the overall sample). As of Fall 2022, this group also had the largest share of car users (65.7% versus 58.1% overall) and the lowest proportion of transit users out of any cluster (5.6%). The rerouted travelers cluster also has the largest share of respondents living within 1.2 km of REM stations (20.7% versus 10.0% for the entire sample) and are set to experience the largest increase in accessibility by public transit once the REM is completed (mean proportional accessibility increase of 35.7% versus 18.3% overall). These last two elements point to this group being the one that will benefit the most from the REM, which is matched by high intentions to use the system once fully operational (0.9).
Discussion
General Trends
In this study, we applied a market segmentation approach to divide survey respondents based on their perceptions of the construction of a new LRT and the project as a whole, highlighting five distinct clusters of respondents. While sociodemographic, behavioral, and geographical characteristics were mostly similar between the clusters, some key differences were observed that could serve as a basis for future analysis. To start, women were more likely to be part of the construction-concerned travelers or the REM-critical respondents clusters, which both reported negative physical and psychological impacts of the REM’s construction on their daily travel. These findings are particularly relevant when considering that women have been consistently found to be less likely to use the REM than men, meaning they will seemingly benefit less from the new service while being more burdened by the construction ( 30 , 44 ). It is important to point out that the potential inequitable effects of construction work on women could be compounded by differences in intentions to use, with users who are less likely to use the REM—in this case, women—more likely to report higher levels of disruption from construction.
As far as travel behavior differences between the clusters are concerned, the lower share of construction-concerned respondents primarily driving for their daily travel might indicate that construction unequally affects individuals’ travel and wellbeing based on the main modes of transport they are using. More specifically, it would indicate that individuals that do not primarily take a car for their daily travel are more likely to experience adverse effects of construction on their wellbeing. Based on the items included in the construction impact on wellbeing factor, this phenomenon could be related to increased fear of construction-induced crashes which is coherent with past research that showed higher frequencies of car crashes in construction zones ( 16 , 17 ). Other potential pathways could be increased air and noise pollution exposure, which has been discussed as a common externality of construction work ( 14 ). Furthermore, mode-related differences may be compounded by differences in income and economic opportunity.
Lastly, our findings point toward distance from the infrastructure being built not being indicative of perceived construction impacts. Objectively speaking, it could have been assumed that clusters reporting more negative impacts from the project’s construction would have been the closest to the construction itself. However, even though the group living closest to the REM line (i.e., the rerouted travelers) experienced the highest disruption to their daily travel, these changes did not negatively affect their wellbeing nor their perceptions of the project. Additionally, the REM enthusiasts, who reported positive impacts on all fronts, live closer to the REM line than the REM-critical and construction-concerned respondents who reported negative perceived impacts on their wellbeing and travel. This suggests that perceptions of impact from construction are subjective. This hypothesis is supported by the high spatial distribution of respondents who stated that construction was taking place near their homes (Figures 2 and 3). Perceptions of what is near one’s home and what could be included in their neighborhood are highly subjective ( 45 ). It is clear that the distribution of the negative externalities during the construction phase of new LRTs is not solely a matter of objective measures, but is dependent on subjective perceptions which need to be considered if relevant policy recommendations are to be derived.
Promoting Increased Social Acceptability
Based on findings from our exploratory analysis, we propose social acceptability as a way to monitor the negotiation innate to transport systems’ transitional periods with regard to equity and overall returns. Given that public acceptance of sustainable-transport infrastructure is critical to promote ongoing implementation, integrating the local population’s heterogeneous needs, wants, and values in planning processes can provide more holistic evaluations of a project’s impacts locally and regionally ( 12 , 13 ). By subsequently recognizing differences in construction experiences, as mediated by perceptual judgements and anticipated benefits, there is an opportunity for policymakers and transport planners to identify key market segments and relevant intervention areas. To visualize the distribution of potential benefits from the REM, we situated the clusters in relation to their average intentions to use it and perceptions of the impact neighborhood change has on respondents’ quality of life (Figure 5). As explained earlier, given that respondents self-reported being affected by the REM’s construction near their home, they therefore integrated the REM in their definition of their neighborhood. As such, their perceptions of the effect neighborhood changes have on their quality of life can be understood to integrate in large part the impacts of the arrival of the REM. This question can, therefore, be understood as reflecting their perception of benefits from the REM and related changes happening in their self-defined neighborhood. Intention to use, on the other end, directly measures how much they intend to benefit from the new service. Overall, we can hypothesize that attitudes toward public transit and intended usage can affect individuals’ inclinations to tolerate construction work.
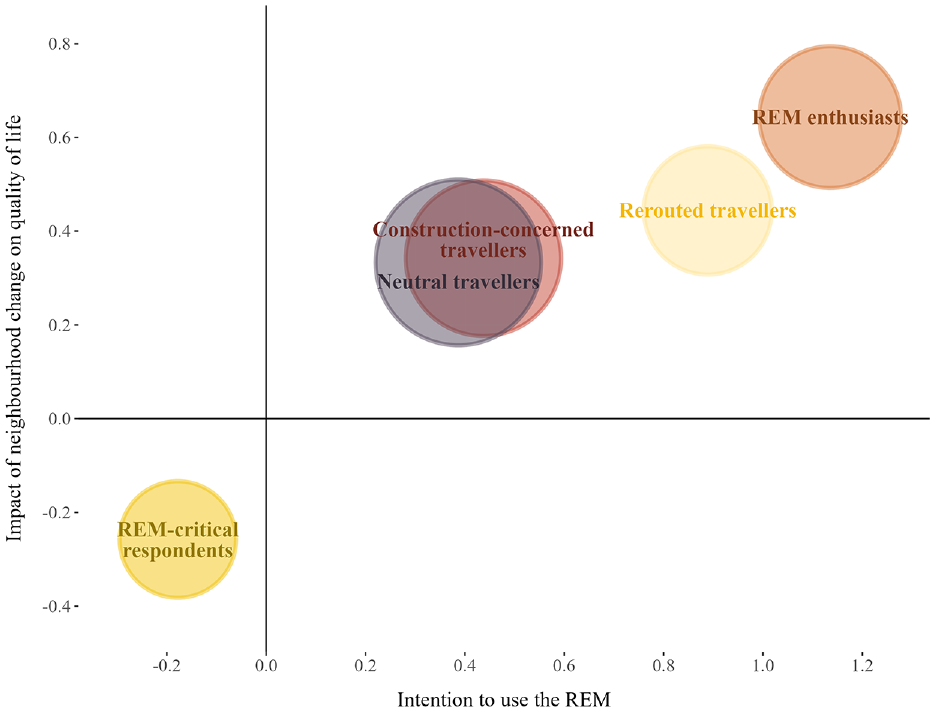
Intention to use and impacts of neighborhood change on quality of life for clusters.
REM enthusiasts’ positive perceptions of the REM and limited impacts from construction are reflected by their high intentions to use the REM and higher perception of benefits. As such, this population segment can be classified as having a high level of acceptability of the project. These individuals, therefore, represent an already acquired segment of the population who see the benefits from the project. To promote increased social acceptability, policymakers should aim to maximize the proportion of the population that is enthusiastic about the project and minimize the size of the gaps between the other clusters by implementing targeted interventions.
REM critical respondents’ negative perceptions of construction and the REM in general are expressed in their lower perceptions of benefits. As the only cluster in the negative quadrant, there is an apparent mismatch between this group’s wants, needs, and values compared with the benefits the REM offers, which leads them to view the project as unacceptable. Since this cluster is a small but vocal oppositional minority, it should not be the primary focus of interventions aimed at improving the overall acceptability of REM. Nonetheless, incorporating more open and inclusive decision-making processes into transport infrastructure planning might decrease the size of this cluster or, at the very least, reduce the strength of its negative perceptions.
Rerouted travelers have high intentions to use the REM, which are matched by strong positive perceptions about neighborhood change. As such, even though they are the cluster that experienced the most disruption to their daily travel, they still value the project’s benefits more than the inconvenience they are experiencing from construction, making the REM an acceptable project to them. Construction-concerned travelers and neutral travelers, which together represent more than 50% of the sample, have more middling perceptions of acceptability. Both report a slightly positive perception of the impact neighborhood change has on their quality of life and a moderate likelihood of using the REM. However, when considering the high negative impacts of construction on the wellbeing of the former and the general lack of engagement with the project for the latter, these groups appear as critical targets for future interventions.
For construction-concerned travelers, targeted mitigation of construction-phase impacts is likely to have the most impact on their perceived acceptability of the project. A reduction in negative construction-phase externalities may enhance opinions of neighborhood changes. Specific strategies to strengthen safety measures in construction zones may be particularly beneficial, considering the overrepresentation of active travelers within this cluster. This might involve ensuring adequate lighting, clear signage, and protective barriers, while seeking ongoing feedback from residents in affected areas. Additionally, traffic calming measures, such as reduced speed zones, speed bumps, and traffic control personnel, may help improve pedestrians’ and cyclists’ safety. These interventions would benefit REM-critical respondents, even though their negative views of the project might diminish gains from this measure.
For neutral travelers, since they have a general lack of engagement with REM, public information campaigns to highlight complementary benefits of the REM might prove most useful. This is especially true for neighborhoods further away from the REM stations. As this group experiences few disruptions from construction, a focus on improving opinions of the REM project may contribute to higher rates of usage for the REM ( 38 ). Increasing their awareness of potential environmental, economic, and social benefits may aid in enhancing their general opinion of the REM.
Future Research
There are numerous opportunities to refine and expand on the analysis done in this paper. This includes further analysis of the spatial distribution of highly affected individuals, particularly those at a large distance from construction activities. While perceptions of what constitutes one’s neighborhood have been shown to vary widely from one person to another, the high number of respondents outside of the “objective” zone of impact highlights the need for additional research on factors shaping the perceived impacts of new public-transit construction ( 45 ). Considering typical commuting distances, work locations, and modal change could provide a more holistic understanding of the impacts of public-transit construction on self-reported highly affected individuals. Comparing construction impacts based on telecommuting habits and travel frequency could also provide relevant insight. Additionally, future research should aim to dissociate the potential effects of construction work from that of policy decisions (e.g., closing the service on an existing commuter train line to give it for a new LRT) when evaluating perceived impacts during the construction period of new public-transit infrastructure. Such dissociation is difficult to make in a cross-sectional analysis because of the subjective nature of the data collected. However, such subjective data collected over time could allow us to isolate the effects of policy announcements and changes in construction works on perceived impacts.
When extending the findings of this paper to new construction activities in different geographies with similarly mature transit systems, we recommend applying the process of identifying heterogeneity within foreseen construction experiences rather than seeking to categorize population segments into the cluster groups found above. Depending on local context, clusters may vary in number, distinguishing features, and sociodemographic and geographical compositions. As such, applying a breadth of interventions before construction is more appropriate to assess who will be affected and in what ways. From there, context-specific decision-making can enable proactive, rather than reactive, mitigation of negative externalities associated with the construction of new public-transit infrastructure. This might include ongoing consultations at the local level, social media outreach, and timely communication of travel disruptions and alternatives. Future research might consider quantifying potential time- and cost-savings of such targeted intervention strategies.
Conclusion
In this study, we applied a market segmentation approach to categorize segments of the population based on self-reported construction and overall impacts of a new LRT in Montréal, Canada. Our analysis generated five clusters with distinct patterns with regard to the project’s construction impacts and how they are perceived. From those, we highlighted three with an acceptability deficit and derived targeted policy recommendations to enhance the equitable implementation and adoption of the new LRT. Comparison of the clusters’ composition underscored potential inequities in the distribution of construction impacts with regard to gender and travel behavior. Through these findings, we aim to highlight the need for added research on the construction impacts of public transit because of their relevance in shaping social acceptability, since limited scholarship has been dedicated to this research question. We stress the need for more focus on the subjective impacts of public-transit projects in combination with the already more commonly considered objective impacts. Large-scale public-transit projects are bound to become more frequent as governments aim to decarbonize the transport sector, and, as such, it is crucial to understand their impacts throughout their life cycle—not just during operation—to ensure a maximization of social benefits throughout the population.
Footnotes
Acknowledgements
The authors would like to thank James DeWeese, Rania Wasfi, Boer Cui, and Rodrigo Victoriano-Habit for their help in designing, building, and cleaning the survey data. The authors would like to thank Thiago Carvalho for his help during the analysis, as well as Daniel Schwartz from the McGill IT service for providing support during the data collection process.
Author Contributions
The authors confirm contribution to the paper as follows: study conception and design: M. James, L. Rodrigue, A. El-Geneidy; data collection: L. Rodrigue, A. El-Geneidy; analysis and interpretation of results: M. James, L. Rodrigue, A. El-Geneidy; draft manuscript preparation: M. James, L. Rodrigue, A. El-Geneidy. All authors reviewed the results and approved the final version of the manuscript.
Declaration of Conflicting Interests
The author(s) declared no potential conflicts of interest with respect to the research, authorship, and/or publication of this article.
Funding
The author(s) disclosed receipt of the following financial support for the research, authorship, and/or publication of this article: This research was funded by The Canadian Institutes of Health Research (CIHR) and The Natural Sciences and Engineering Research Council of Canada (NSERC) Collaborative Health Research Projects (CHRP) Program (CIHR CPG-170602 and CPG-170602 X-253156, NSERC CHRPJ 549576-20).
Data Accessibility Statement
The data used in this study come from the 2022 Montréal Mobility Survey. The data are not publicly available, in accordance with data protection requirements specified in the project’s ethics certificate.