
Abstract
In this paper, we investigated the impact on dwell time of station design, train load, and passenger flow, considering boarding fraction. We employed system-wide automated data sources including automatic passenger counting and automatic vehicle location data in the rail transit system in Calgary, Canada. Regression analyses were conducted to achieve accurate dwell time estimation by calculating passenger load per car, boarding, and alighting passengers per door, and also identifying the critical door with the highest demand. Observations for each critical door were divided based on the fraction of boarding passengers with respect to the sum of boarding and alighting. Six stations with distinct geometric designs were selected for comparison to assess their impact on dwell time. The results indicate that, for dominant boarding or alighting, a longer time is needed per passenger to alight or board, respectively. Our findings indicate that a station with a middle platform and two entrances positioned in the middle performed better in terms of dwell time in the case of alighting-dominant and mixed passenger flow. For stations experiencing boarding-dominant passenger flows, side platforms with multiple entrances at the ends and middle outperformed. Narrower platforms experienced significantly longer dwell times than other selected stations under similar demand. While the conclusion about the station design may not be generic, the proposed model provides a consistent and adaptable approach to study the impact of station design and passenger flows on urban rail dwell times, facilitating better-informed decision-making for station design or modification and enhancement of the overall rail system performance.
Keywords
The importance of accurate dwell time estimation for rail lines cannot be understated, as small variations in dwell time can significantly affect the on-time performance of the entire rail system and limit its capacity. Dwell time models are crucial for various aspects of rail transit research and practice, such as operational planning, system simulation, and calculating the minimum achievable headway. While there is existing literature on dwell time, many studies rely on manual data collection, video camera recordings, or automatic fare collection (AFC) data. These methods have limitations when it comes to collecting large datasets, accurately estimating passenger load, or counting passengers for each door. However, automatic passenger counting (APC) systems have the ability to count the number of alighting and boarding passengers at each door. The “critical door” refers to the door with the highest demand for both boarding and alighting and is also associated with the car which has the highest passenger load. Since the distribution of boarding and alighting passengers on the platform is not uniform, identifying the critical door becomes crucial for accurately estimating the dwell time ( 1 , 2 ).
In this paper, we used light rail vehicle (LRV) data collected by Calgary Transit of the City of Calgary, Canada, using the APC and automatic vehicle location (AVL) systems for the month of July 2022 and several months of 2023. The goal of this study is to demonstrate the usage of automated data sources such as LRV for detailed dwell time estimation by accurately estimating the passenger load per train car and boarding and alighting passenger counts per door using the APC system, and incorporating differences with respect to the critical door and dominance of boarding and alighting passengers. We have compared dwell time models based on station-specific geometric characteristics and examined changes in average boarding and alighting times with the fraction of boarding passengers for each direction. Additionally, understanding how the fraction of boarding passengers affects boarding and alighting time can help transit authorities implement better crowd management strategies and allocate resources more effectively. Using real-world and accurate data from urban rail offers a more comprehensive and accurate representation of passenger behavior and system performance compared with traditional data collection methods. This approach allows for a more detailed and data-driven analysis, leading to better-informed decision-making and improvements in rail transit systems.
Literature Review
“Dwell time”—defined as the time a train spends at a station—is a critical factor influencing the overall journey time and passenger experience ( 2 – 6 ). It comprises two components: a fixed time and a passenger service time. Lin identified key variables affecting dwell time, including platform congestion, the number of alighting and boarding passengers, and passenger load ( 7 ). An increase in dwell time not only extends the total journey time, but also leads to crowding at subsequent stations ( 8 , 9 ). Various methods for estimating dwell time have been explored in the literature. Statistical models, such as linear regression and nonlinear regression models, have been employed by researchers to predict dwell time ( 10 – 13 ). Additionally, simulation models, extreme learning machine models, fuzzy-logic-based models, the dynamic updating method, and the hunter prey optimizer algorithm have been proposed as alternative estimation approaches ( 4 , 14–18).
Szplett and Wirasinghe investigated the spatial characteristics for passengers on an urban rail, specifically examining how station design influenced characteristics related to passenger waiting, boarding, and alighting ( 1 ). Their research revealed that a station featuring a middle platform with a single entrance at one end displayed a waiting passenger distribution following a log-normal pattern. However, stations with a side platform and multiple entrances exhibited a waiting passenger distribution conforming to the normal distribution. Also, they found that a few passengers who were denied boarding could have successfully boarded if they had chosen to move or wait near a door experiencing lower demand. The significant finding of their research is that the distribution of passengers on the platform is not uniform. Utilizing uniform demand for all doors or average demand at each door in dwell time modeling leads to an underestimation of dwell time. This highlights the significance of identifying the critical door for accurate dwell time estimation. Another study conducted in Calgary aimed to estimate dwell time by accounting for both boarding and alighting passengers ( 2 ). However, the study overlooked the consideration of passenger load for train cars with the critical door. “Passenger load” refers to the number of passengers on a transit vehicle at a particular station or location ( 19 ). The interaction between boarding and alighting passengers is characterized as friction between boarding and alighting passengers ( 2 ). To capture this effect, researchers have calculated the ratio of boarding passengers to the total of boarding and alighting passengers at the critical door. This ratio is referred to as the “fraction of boarding passengers.”“Passenger flow” refers to the fraction of boarding passengers. For instance, a passenger group with a higher fraction of boarding passengers, is referred as “boarding-dominant passenger flow.” Average boarding and alighting time per passenger changes with the fraction of boarding passengers ( 2 , 19 ). This underlines the importance of considering passenger flow for the accurate estimation of dwell time.
Collecting sufficient and accurate data is crucial to support the accuracy of the dwell time prediction using the developed model. In the literature, various data collection methods have been explored for passenger demand and dwell time estimation. Some studies used a manual data collection method, but this method has limitations, such as small sample sizes and the need for multiple surveyors when recording demand for each door ( 4 , 15 , 20 , 21 ). Video cameras have also been used ( 8 , 22 , 23 ). However, extracting passenger counts from the recorded videos converting the collected data from cameras to passenger counts requires additional effort and may pose privacy issues for detailed investigations external to the transit agency. Additionally, both methods mentioned above have limitations in selecting multiple stations for comparing boarding and alighting time per passenger. Moreover, they often overlook platform characteristics, such as entrance locations, presence of obstacles, and train stopping positions. Another approach involves using automatic data collection, such as AFC data, but they mostly assume that all boarding passengers will board the first arriving train ( 24 ). In addition, a major drawback with this approach is that it does not distinguish the door with the highest passenger demand, but instead uses the total demand for the entire train to estimate the dwell time. This may lead to an inaccurate estimation of the actual dwell time at the busiest door, which can affect the overall accuracy of the dwell time model. Another use of AFC data is to calculate the percentage of denied boarding passengers by combining it with the train schedule or AVL data in real-time or offline ( 25 ). In a recent study, AVL and APC data were used for dwell time modeling, but the study also considered the total number of boarding and alighting passengers per train instead of per door ( 26 ). Yoo et al. used train weight to estimate approximate passenger load using the weighing system installed on track ( 8 ). Their study found that passenger load significantly affects the average boarding time but does not have a similar impact on the alighting time.
In summary, it has been found that identifying the critical door and considering passenger flow is significant for the accurate estimation of dwell time in urban rail operation. Literature is lacking in supporting automated large data collection methods with identifying critical door for dwell-time-related studies. Moreover, to our best knowledge, literature is not available for comparison of the fraction of boarding passengers with consideration of the exact passenger load for the car with the critical door, or for comparison of the impact of station-specific geometric characteristics on dwell time. This paper addresses these limitations by using AVL and APC data to identify critical doors for dwell time modeling. Additionally, the study considers the friction between boarding and alighting passengers and divides the data into multiple groups based on the fraction of boarding passengers, allowing for a comparison of changes in average boarding and alighting time per passenger. Overall, this paper demonstrates an improved approach to dwell time modeling, considering critical factors and enhancing the accuracy of predictions.
Methodology
This study’s methodology is divided into three parts: data collection, data filtering, and dwell time model development. In the data collection step, essential information is gathered using APC sensors installed in the train cars and GPS data for vehicles location and their stopping times. The data-processing step follows to ensure accuracy by removing anomalies, handling missing values, and estimating passenger load. Lastly, the dwell time model is developed to analyze the impact of station-specific geometric design, passenger flow, and passenger load on dwell time.
Data Collection
Data collection for LRV trains involves using APC sensors for recording passenger counts and a GPS system for determining vehicle location. These sensors are installed on train cars and play a crucial role in capturing valuable information about both train operations and passenger movements. The vehicle location is continuously recorded every 5 seconds by AVL, and the collected data also include whether the doors are closed or open at each interval. APC sensors trace passenger movements (i.e., boarding and alighting) for each door. Typically, an APC system uses two sensors (infrared and ultrasonic) to detect passenger movement ( 27 ). An infrared sensor counts numbers when passengers pass through a beam of infrared light, while an ultrasonic sensor detects the direction of motion from high-frequency sound waves. The data collected by these sensors are stored in CSV format and consist of three types of records: cyclic records, stop records, and passenger records. Cyclic records are reported at regular 5 seconds intervals and provide essential data points that help analyze various aspects of train operations. Stop records, as the name suggests, capture arrival and departure data when the trains halt at stations to facilitate passenger movements. Finally, passenger records contain information about passenger movements for each door, enabling a comprehensive understanding of passenger flow.
Data Processing
The data processing steps presented in Figure 1 involve several important procedures in organizing and extracting meaningful insights from the collected dataset. Firstly, the data were separated into two distinct categories: stop records and passenger records. Passenger records capture data related to boarding and alighting passengers at each stop, including door numbers and passenger counts. Stop records report the arrival and departure times, along with the coordinates for the location of each stop. To facilitate the analysis, the door data for each car were consolidated into a single row. This allows for a more comprehensive understanding of passenger movements within each train car and facilitates subsequent calculations of passenger load separated for each car. Next, the stop and passenger datasets were combined by comparing the date, time, and vehicle number fields. By matching these key variables, the two datasets were merged, providing a holistic view of passenger activity at specific stops. To enhance the analysis with meaningful station names, coordinates from the dataset were matched with station location data. A least-distance matrix approach was utilized to determine the closest station to each recorded location, and the corresponding station name was added to the dataset ( 28 ).
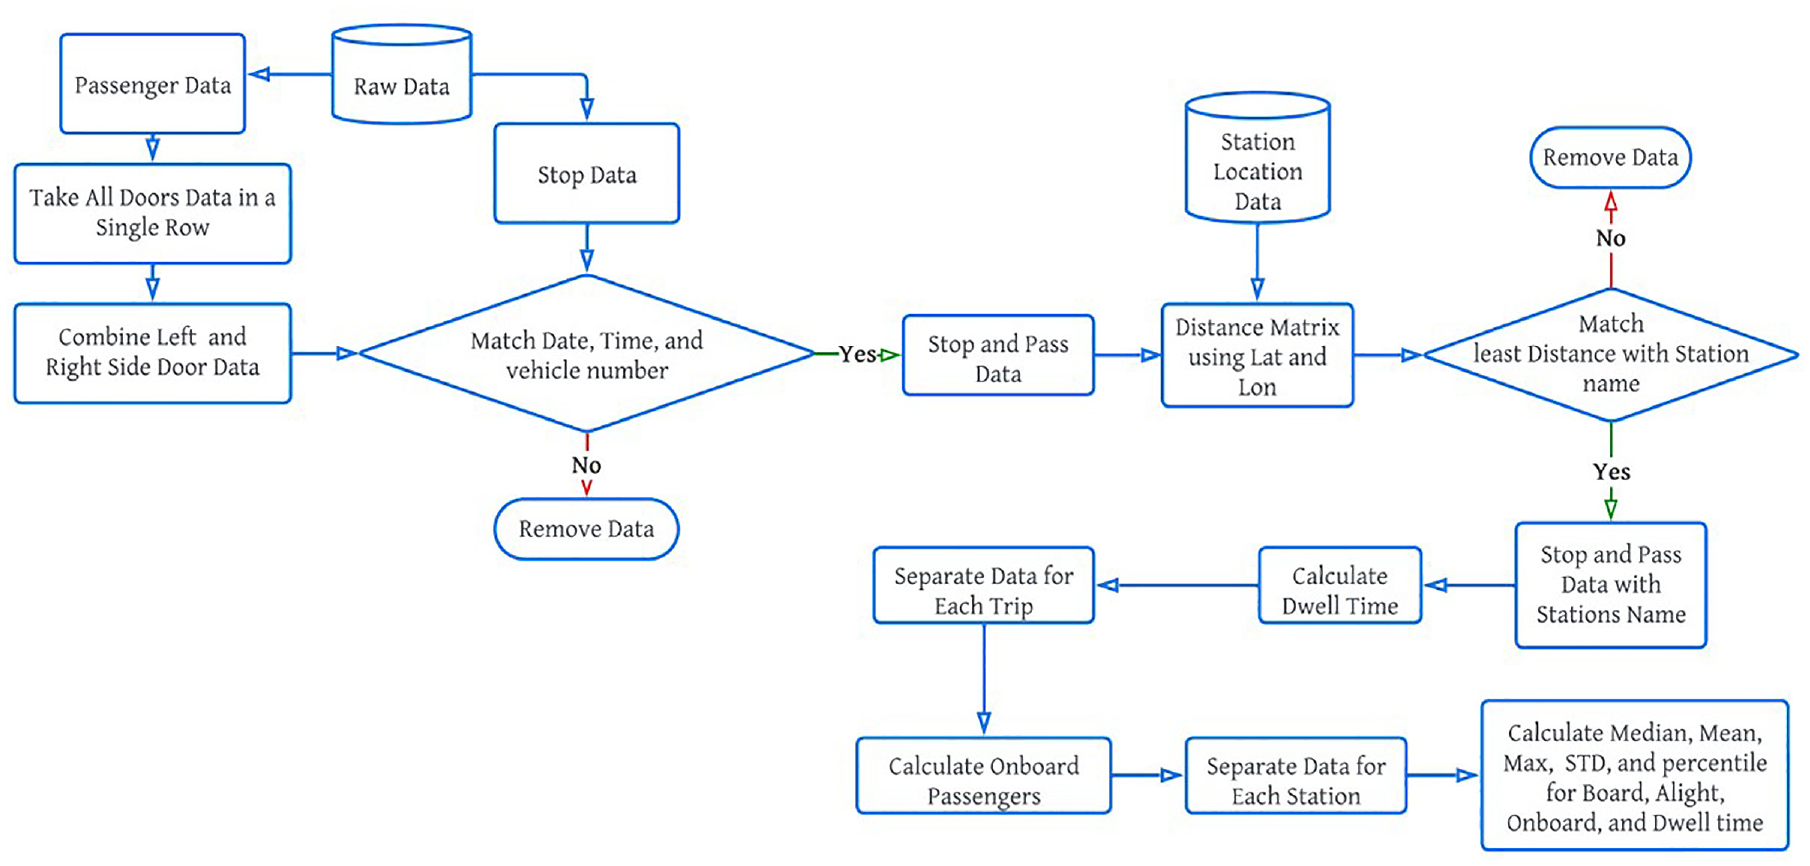
Data processing steps.
The data were then further processed by separating individual trips, identifying consecutive stations, and removing incomplete trips from the dataset. To analyze passenger occupancy, the passenger load was calculated by subtracting cumulative alighting passengers from cumulative boarding passengers at each stop for each train trip and each train car. Dwell time, which represents the time the train is fully stopped at a station, was calculated by comparing the departure and arrival times for each station. The dataset was further segregated for each station, allowing for statistical analysis of key metrics such as minimum, maximum, standard deviation, and percentile values for boarding, alighting, passenger load, and dwell time. These statistical measures provide a comprehensive understanding of passenger behavior, station activity, and variations in performance indicators across different locations.
Dwell Time Model
Before developing the dwell time model, the first step involved identifying stations with various geometric designs, including side platforms, middle platforms, and single and multiple entrances. This allowed for a comparison of the impact of station design on dwell time. In this study, three independent variables were considered for the dwell time model: the number of boarding passengers at each door

where
The critical door number (Mn) for train n is the sum of alighting passengers, boarding passengers, and the product of boarding passengers and passenger load, as presented in Equation 2.

It should be noted that, since each car has four doors,

As mentioned by Wirasinghe and Szplett, and Parkinson and Fisher, the average boarding and alighting time per passenger can vary based on the fraction of boarding passengers and the overall demand (
2
,
19
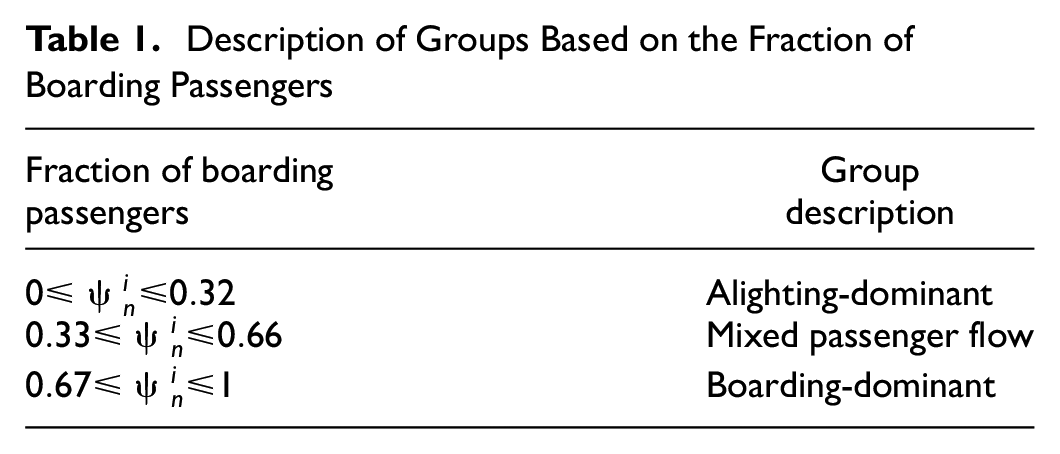
). To capture this relationship, the fraction of boarding passenger
Description of Groups Based on the Fraction of Boarding Passengers
Finally, the coefficients for each group were estimated using the ordinary least square (OLS) method. The estimated coefficients were then compared with selected stations for both peak and off-peak periods. This comparison allowed for the evaluation of the dwell time model’s performance and its ability to accurately capture the variations in dwell time at different stations during different times of the day.
Case Study
In this paper, we have obtained LRV data recorded by Calgary Transit. The data covers the entire months of July 2022 and July 2023, as well as 15 days each from January, April, and September 2023. Calgary Transit has data available for all days of operation since the APC and AVL sensors were installed on vehicles. However, not all vehicles are equipped with these sensors. The vehicles equipped with these sensors belong to the same model and have identical interior designs. This model features a longitudinal seating configuration, which provides more space for standing passengers. This train model has a capacity of 200 passengers per car ( 29 ). It is a high-floor vehicle and platforms in Calgary are also raised, which allows for level boarding. Usually, Calgary Transit runs three-car trains, and sometimes four-car trains during the peak hours ( 29 ). The month of July was intentionally chosen as the annual outdoor festival of Stampede, lasting for 10 days, is held during this month. During this festival, many tourists and local visitors are attracted to major locations in the downtown core and the light rail transit (LRT) system operates 24 hours. In 2022, a total of 1.2 million people visited the Stampede ( 30 ). On the first day, there were 130,000 attendees. In 2023, 1.3 million people visited during the 10 days of the Stampede event ( 31 ). During this period, the demand often exceeded the system’s capacity, leading to challenges in managing passenger flow. It is important to note that the obtained data includes 85 regular days and 20 Stampede days. The Blue Line and the Red Line of Calgary Transit share the same track in part of the central business district (CBD) which has road grade crossings. The remainder of this section explains more details of the case study and is divided into two parts: station selection and dwell time model, and descriptive analysis.
Station Selection
Calgary’s LRT system comprises two lines: Blue Line and Red Line, as shown in Figure 2 ( 32 ). The orange dots in Figure 2 represent the stations selected for this study. The Blue Line operates at a headway of 5 min during peak hours, while the Red Line operates at a headway of 3 min during peak hours ( 33 ).
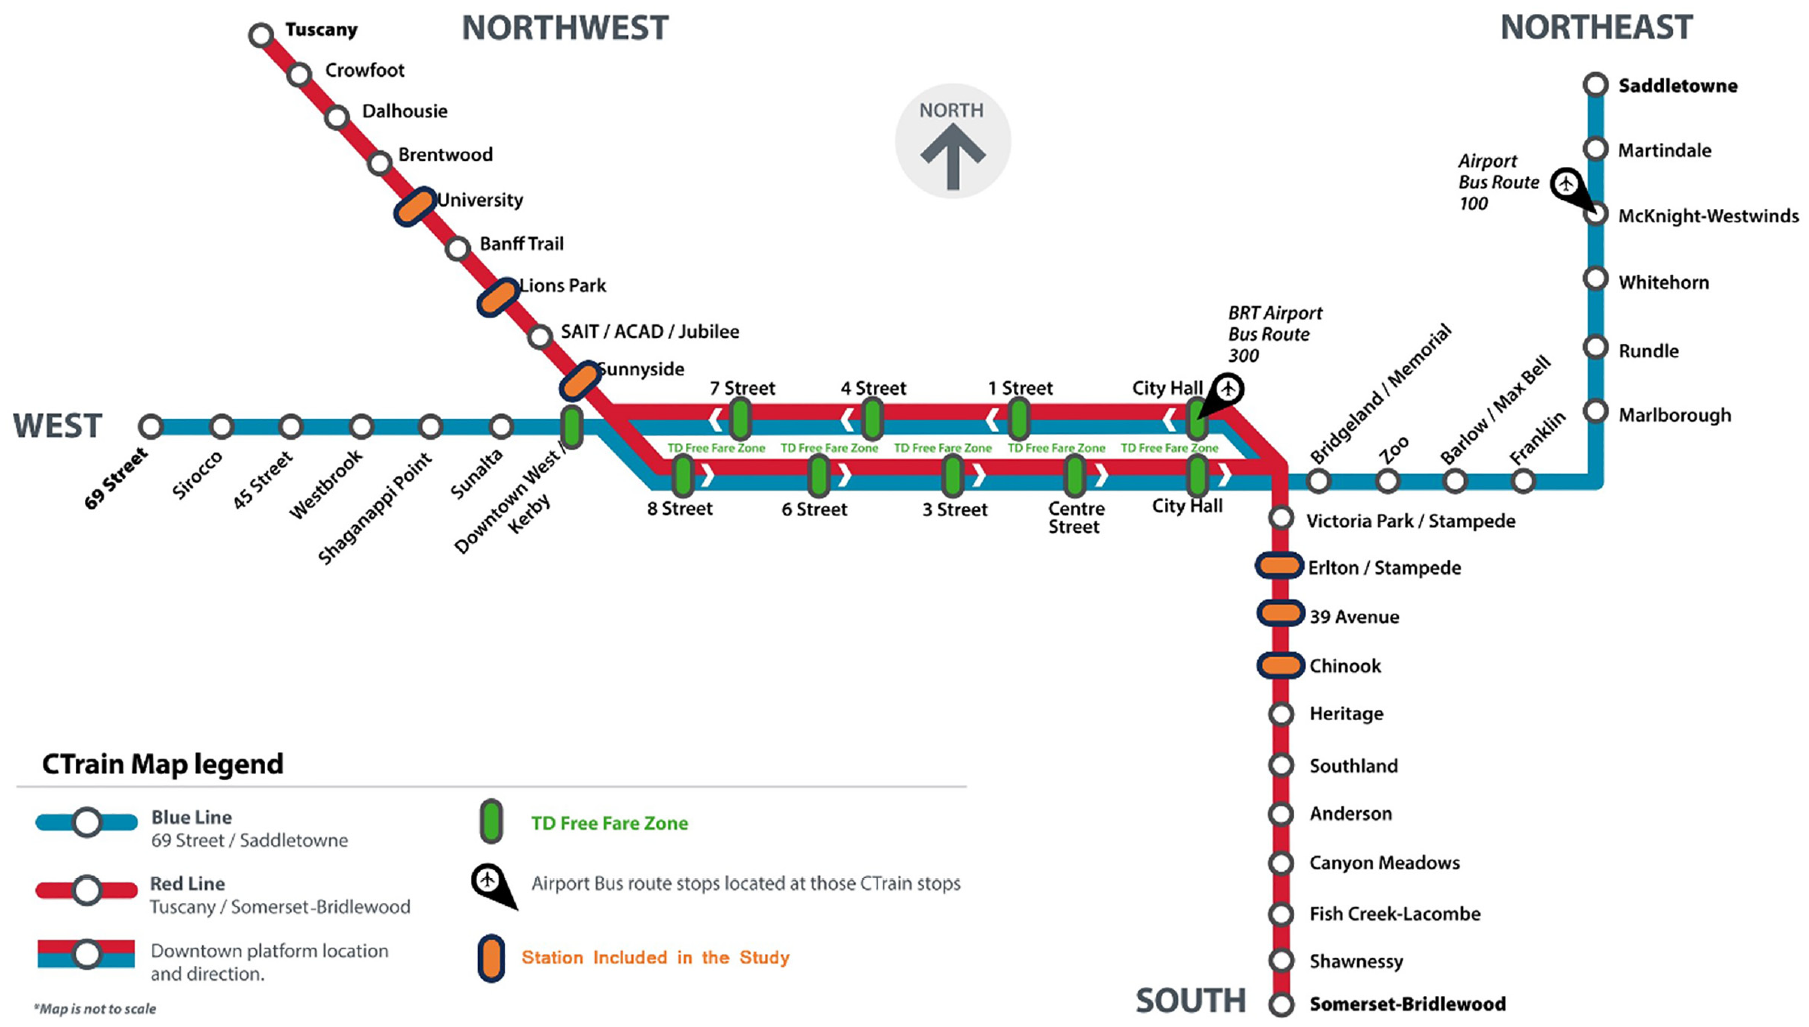
Calgary’s light rail transit map.
For the purpose of this study, we chose stations with unique platform designs, such as those featuring side and middle platforms, as well as single and multiple entrances. Consequently, six stations were carefully selected for analysis, each showcasing unique platform layouts. Stations within the CBD are intentionally avoided because of road grade crossings. These crossings complicate the differentiation between train stopping by passenger boarding or alighting and those stopping by traffic signal at junctions. Often, trains at these stations need to wait for traffic signals, influencing dwell time more significantly through the traffic signal rather than passenger movements. Among the chosen stations (Figure 3, a to c ), three featured a middle platform design, while the remaining three stations (Figure 3, d to f ) featured side platforms. Stations on the Blue Line were not selected because of their lower frequency in comparison with the Red Line, which greatly affects the sample size collected within the same duration of data collection.
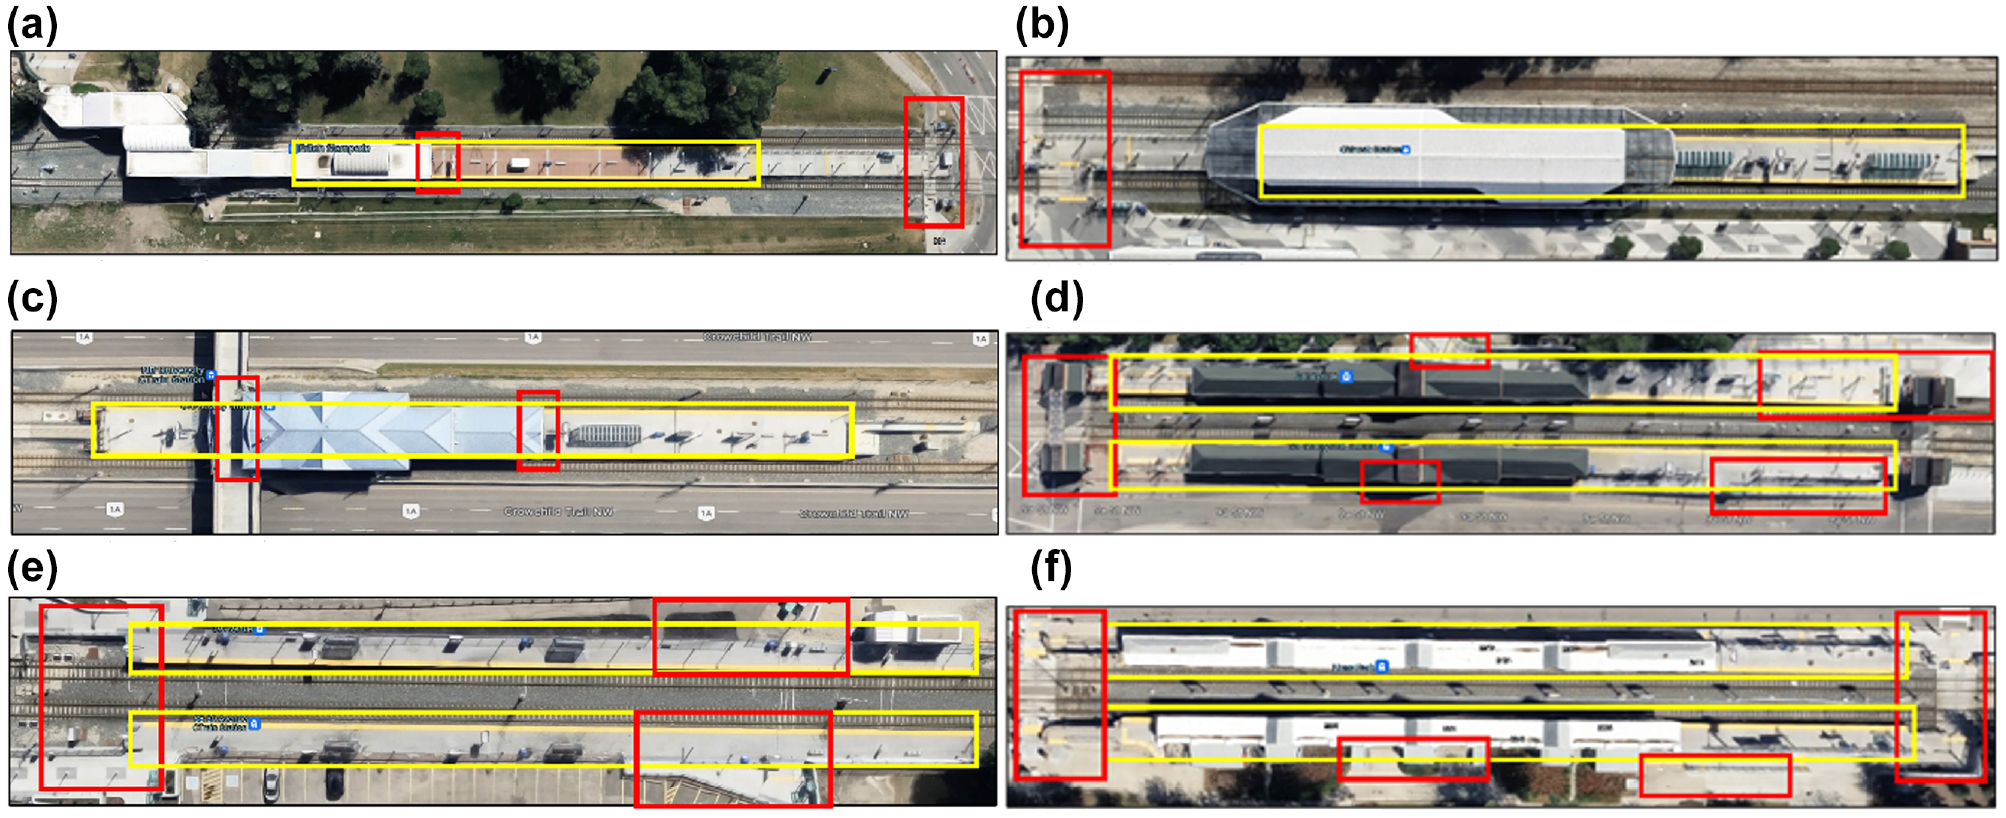
Station layout: (a) Erlton, (b) Chinook, (c) University, (d) Sunnyside, (e) 39th Avenue, and (f) Lions Park.
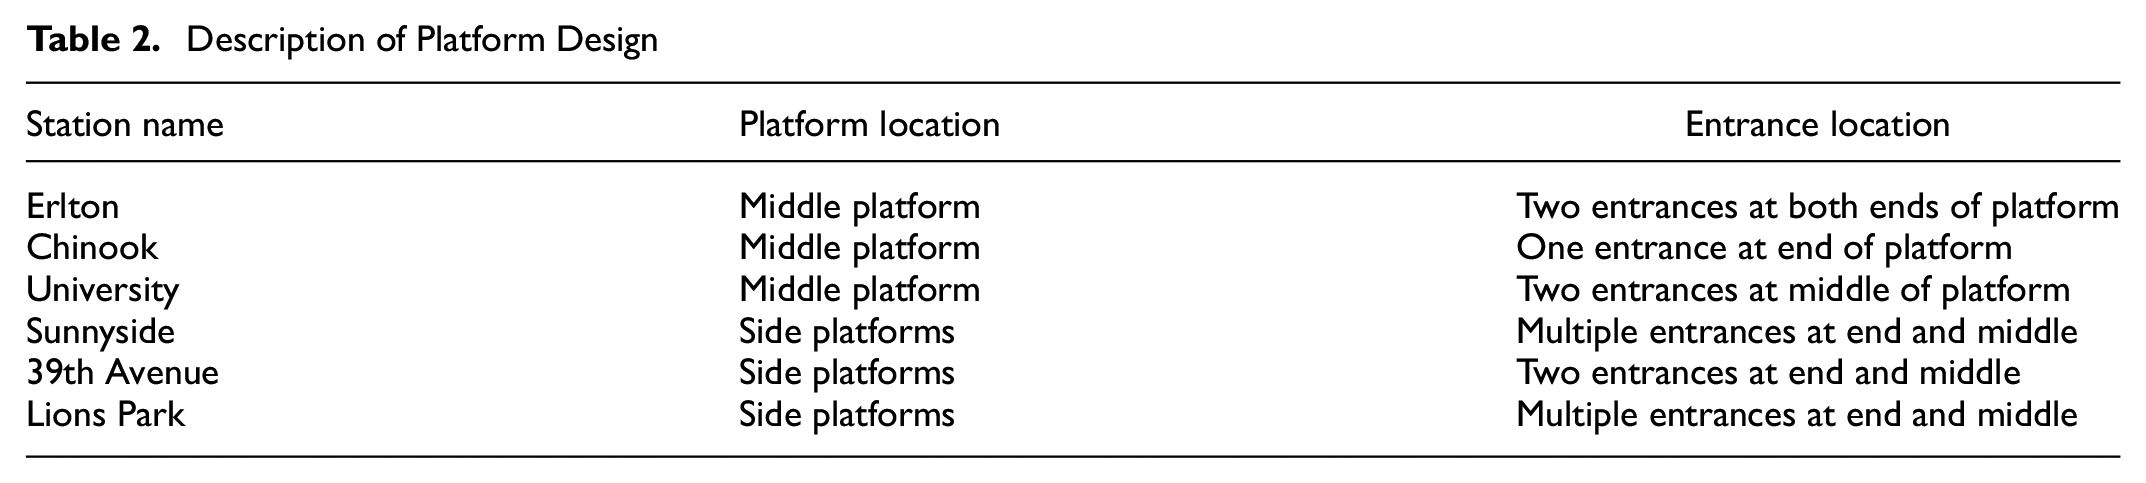
Specifically, the stations in question are as follows: Erlton Station (Figure 3a), featuring a middle platform and two entrances located at both ends, with a narrower platform width (approximately 7.5 m) compared with other selected stations; Chinook Station (Figure 3b), also a middle platform, but with only one entrance situated at end of the platform; University Station (Figure 3c), featuring a middle platform and two entrances positioned in the middle of the platform; Sunnyside Station (Figure 3d), which has side platforms with multiple entrances at the end of a platform and in the middle; 39th Avenue Station (Figure 3e), offering side platforms and two entrances positioned at end and middle of the platform; and, finally, Lions Park Station (Figure 3f), which has side platforms and multiple entrances at end of a platform and in the middle. All selected stations with middle platforms are at least 8 m wide except Erlton Station, while stations with side platforms are at least 4.5 m wide. To supplement the description of these stations, Table 2 is provided, furnishing a concise summary of the platform and entrance configurations for each station. Lions Park Station features two entrances at both ends of the platform and an additional two entrances in the middle of the platform dedicated to the inbound direction. For the outbound direction, there are only two entrances situated at both ends of the platform. However, on this side of the platform, a sidewalk at a lower grade is connected, enabling passengers to enter or exit the platform at the midpoint. This sidewalk shares the same entrances as illustrated in Figure 3e, while on the opposite side of the sidewalk, a highway is located, preventing pedestrians from engaging in jaywalking. This sidewalk is crucial for alighting passengers to exit the platform, especially when a higher number of boarding passengers are waiting on the platform.
Description of Platform Design
Descriptive Analysis
The first crucial task was to identify the independent variables from the dataset. In the methodology section, a step-by-step process for data processing was explained and followed to extract the relevant independent variables required for the analysis. The raw dataset was processed to extract key variables, including the number of alighting and boarding passengers for each door, the passenger load per train car, and the dwell time per train. Subsequently, statistical calculations were performed on the extracted variables. This involved analyzing the data to obtain various measures such as averages, medians, standard deviations, and so forth, to gain insights into the patterns and trends related to alighting, boarding, passenger load, and dwell time. The plot in Figure 4 represents the fluctuation in passenger demand for the sum of all doors at different stations throughout the day, categorized by the two directions: northbound and southbound. The y-axis represents passenger demand, while the x-axis consists of hourly data, starting at midnight. Calgary Transit provides LRT services 24 h a day during the Stampede event, but there is no service between 1:00 and 4:00 a.m. on regular days. The dataset reported information from 20 Stampede days and 84 regular dates. The study identified a morning peak period, which spans from as early as 7:30 to 9:30 a.m., and an evening peak period from 4:00 to 8:00 p.m. The analysis did not segregate the data between peak and off-peak periods. It is important to note that there were instances with exactly zero alighting or boarding demand, contributing to a lower average demand per train car.
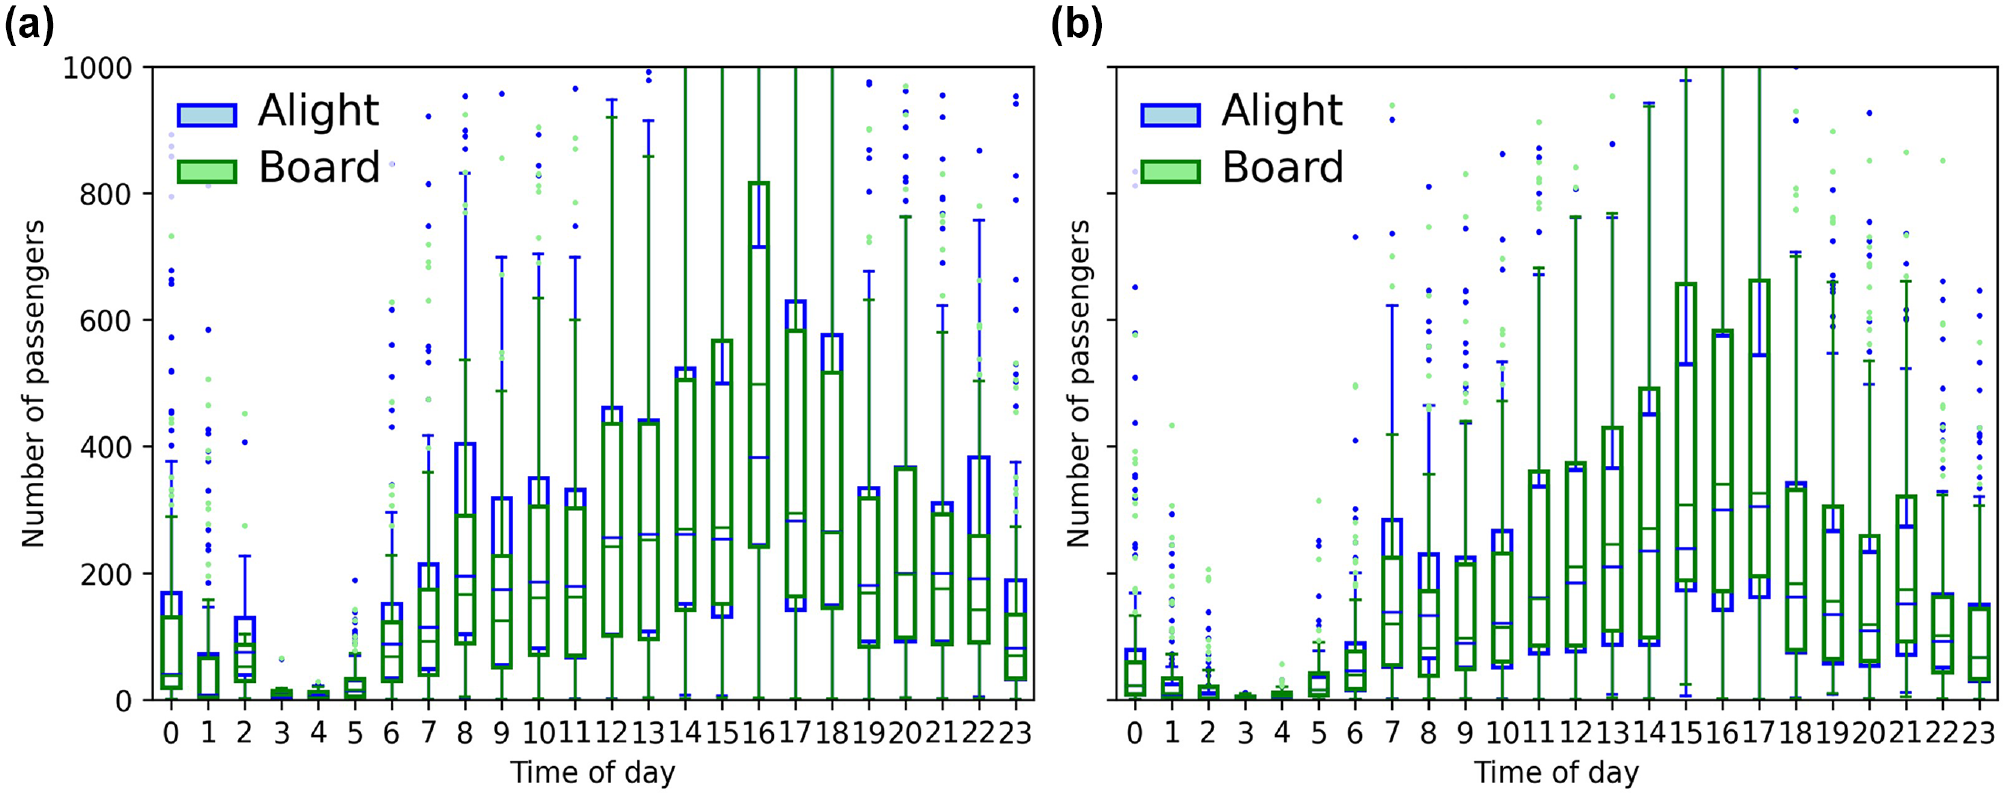
Passenger demand distribution for: (a) northbound and (b) southbound.
Figure 5 depicts box plots for alighting passengers, boarding passengers, passenger load, and dwell time to gain more insights for the selected stations on passenger demand, along with the passenger load and dwell time for each direction. In this figure, the y-axis represents the passenger demand, measured as the sum of all doors for each train car or dwell time in seconds, with station names plotted along the x-axis. It was not feasible to analyze the passenger demand for each individual train, as Calgary Transit operates both 3-car and 4-car trains. The comparison of passenger demand and dwell time between inbound and outbound revealed interesting patterns. In general, the median alighting passengers was higher for the outbound direction, while the median boarding passengers was higher for the inbound direction. This symmetry is a result of the nature of passenger travel to the CBD, where during morning peak hours, there is a high demand for boarding in the inbound direction and, during the evening peak hours, there is a high demand for alighting in the outbound direction. Chinook Station exhibited a higher median value for boarding passengers in the inbound direction and alighting passengers in the outbound direction. Furthermore, Erlton Station, located near Stampede Park, exhibited higher demand on Stampede days. Conversely, the station experienced a lower demand on regular days. As a result, this lower demand contributes to the observed decrease in medians for both boarding and alighting passengers in the presented data plot.
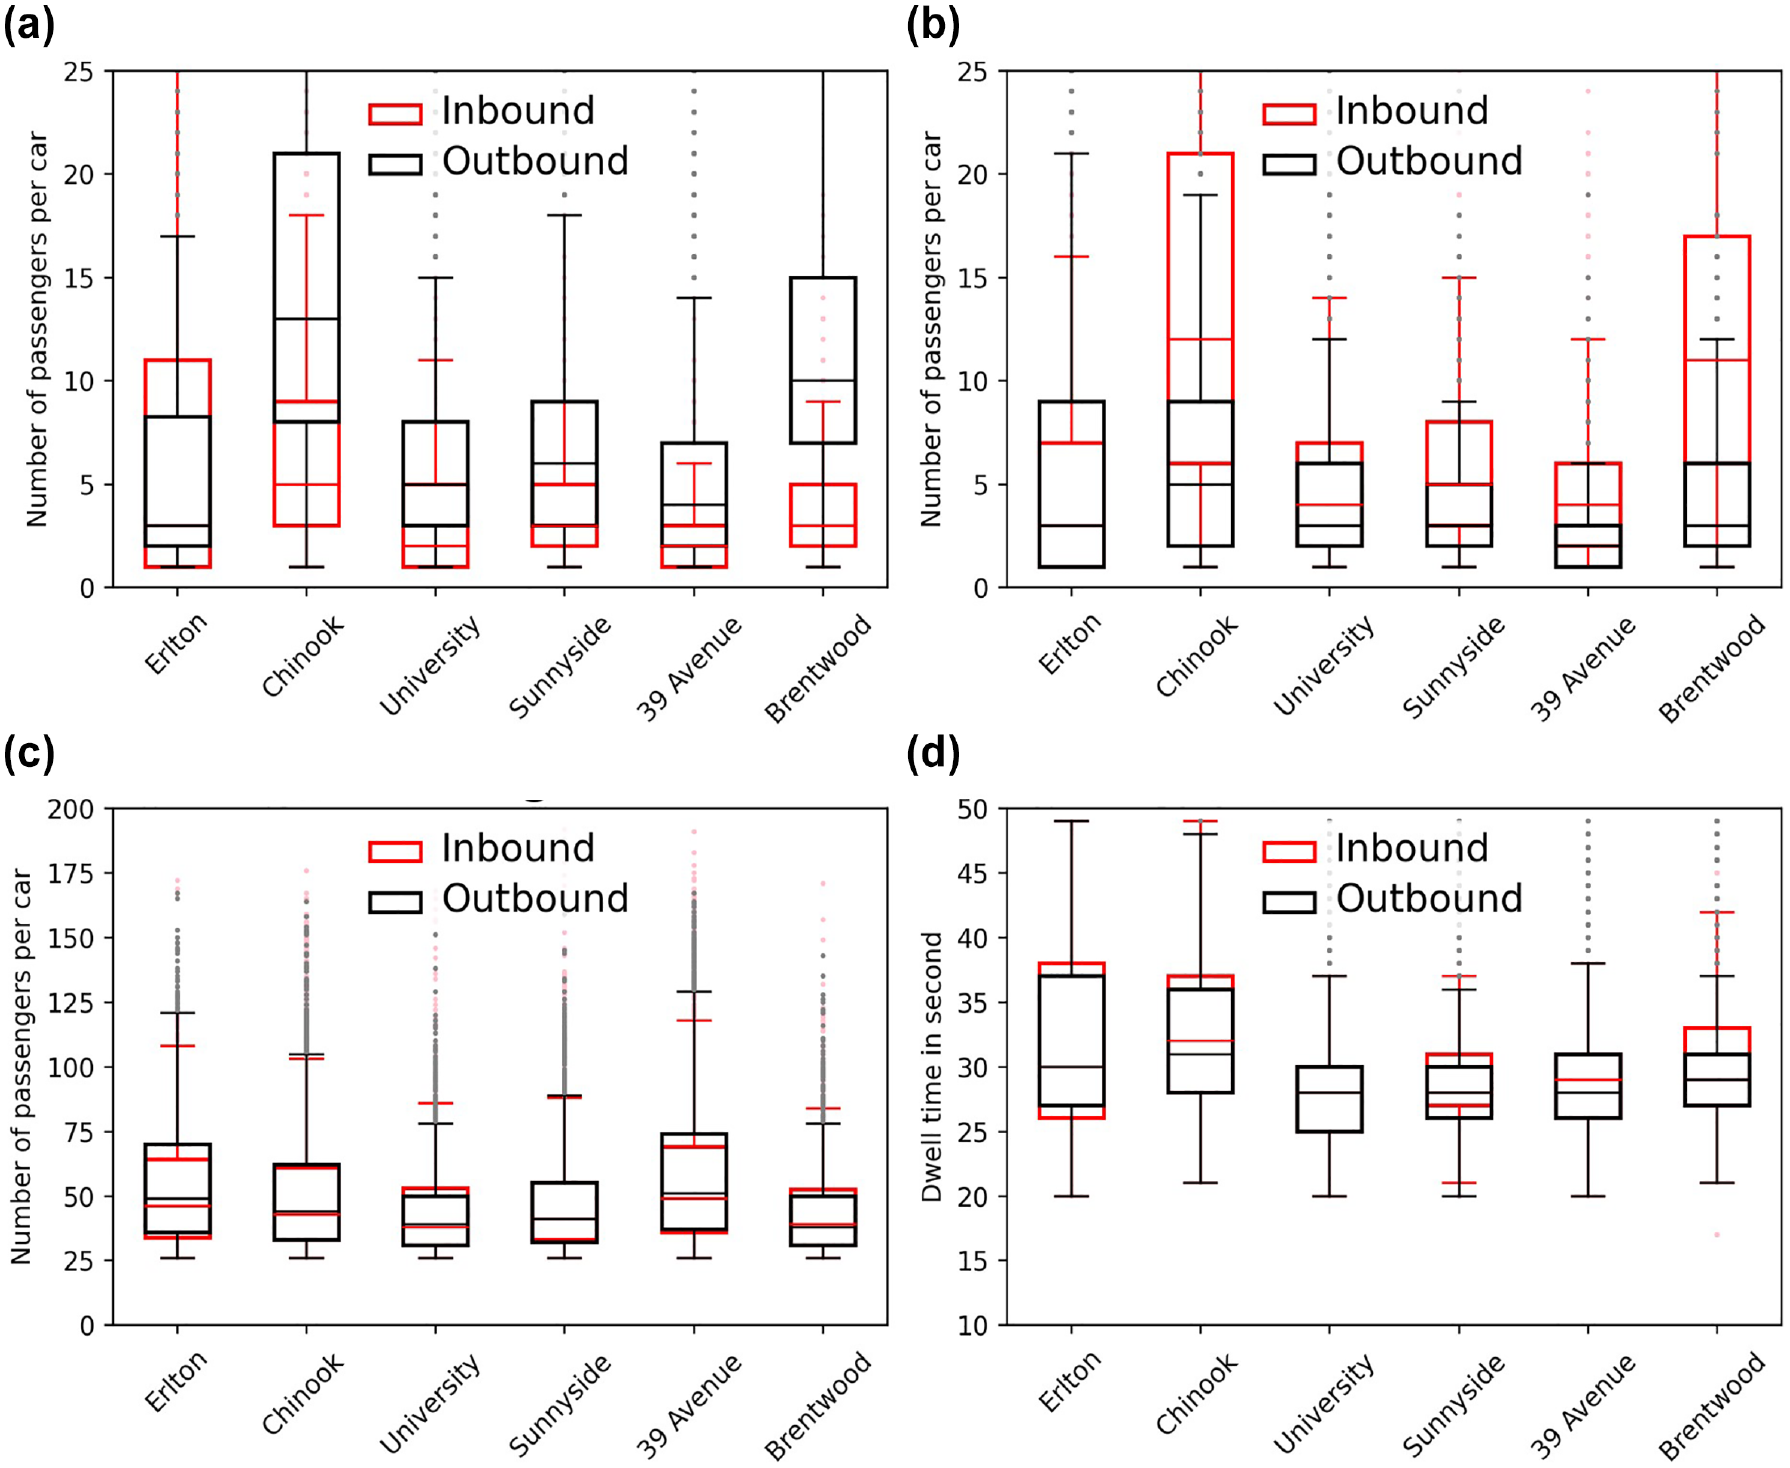
Box plots for: (a) alighting, (b) boarding, (c) passenger load, and (d) dwell time.
The median passenger load ranged from 45 to 65 passengers per car. For both inbound and outbound directions, the median dwell time ranged from 28 to 32 sconds. A consistent observation in dwell time distribution was that the median dwell time was higher for the inbound direction compared with the outbound direction.
Results
The data for each station and direction were categorized into three groups based on the fraction of boarding passengers
To enhance the comparability of our findings, we segregated the results for each passenger flow and presented them in separate tables. Table 3 presents the regression results for alighting-dominant passenger flow
Results for Alighting-Dominant Passenger Flow
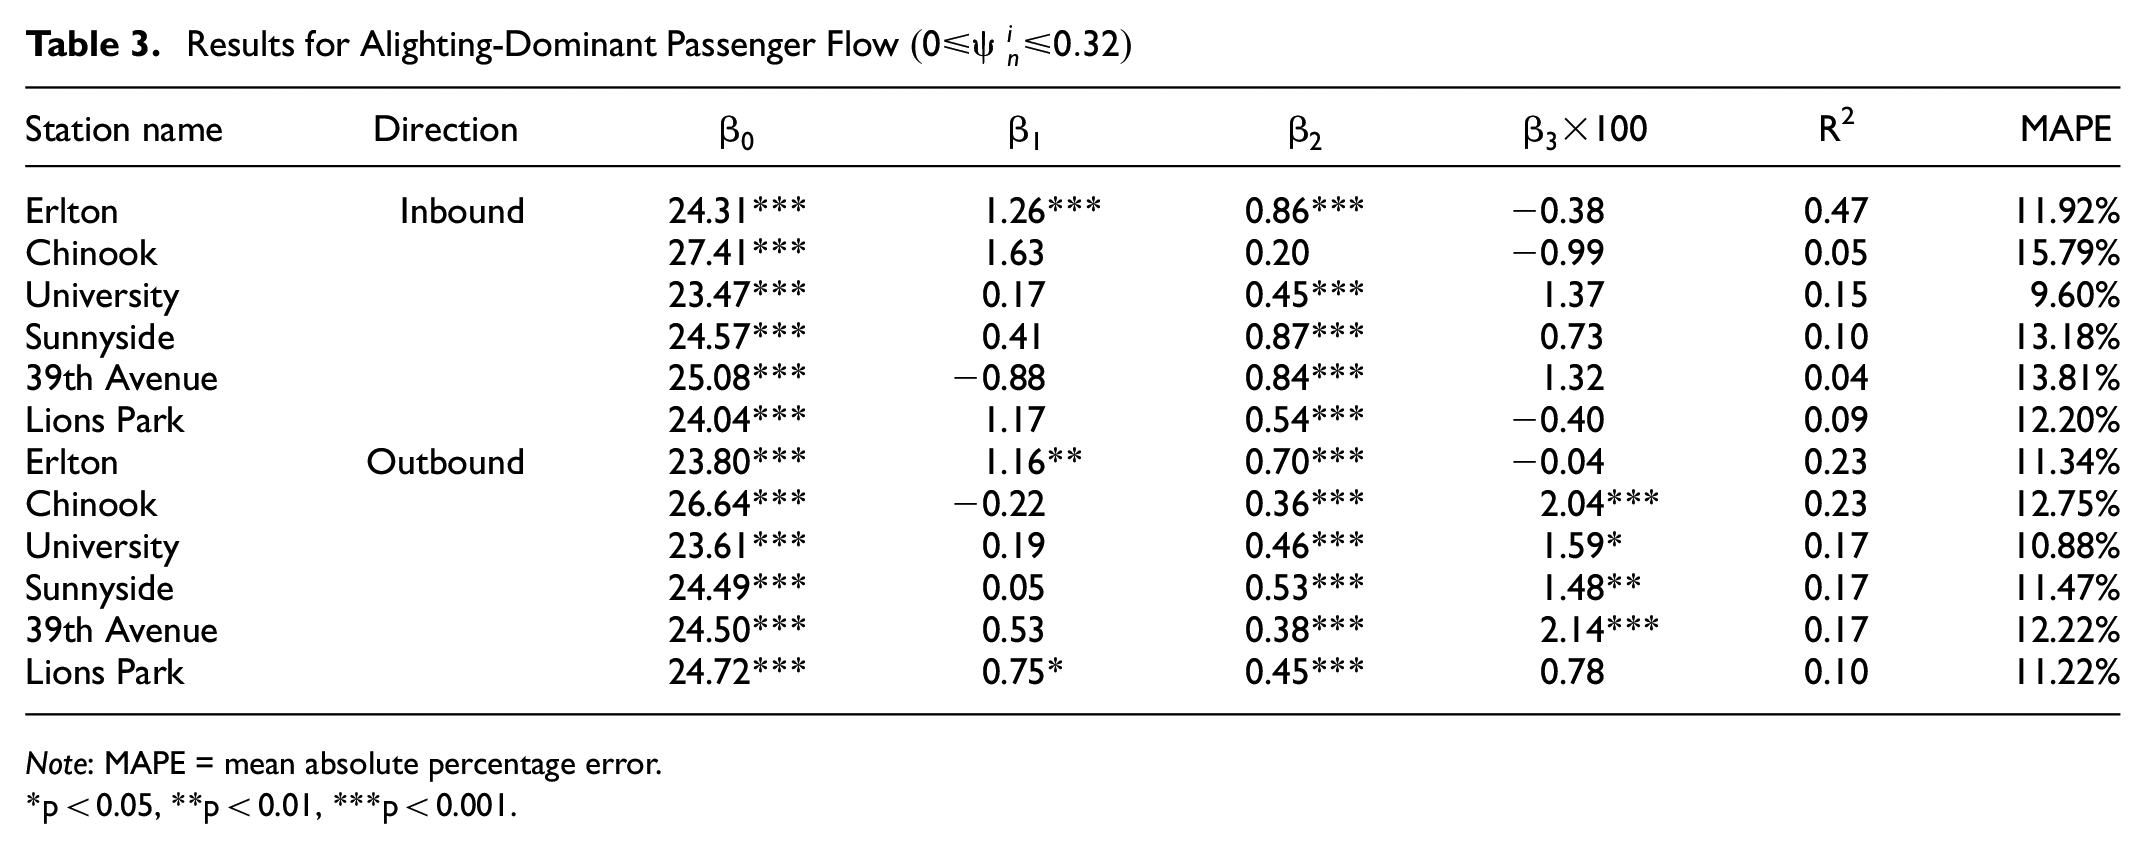
Note: MAPE = mean absolute percentage error.
*p < 0.05, **p < 0.01, ***p < 0.001.
Table 4 shows the results for the mixed passenger flow
Results for Mixed Passenger Flow
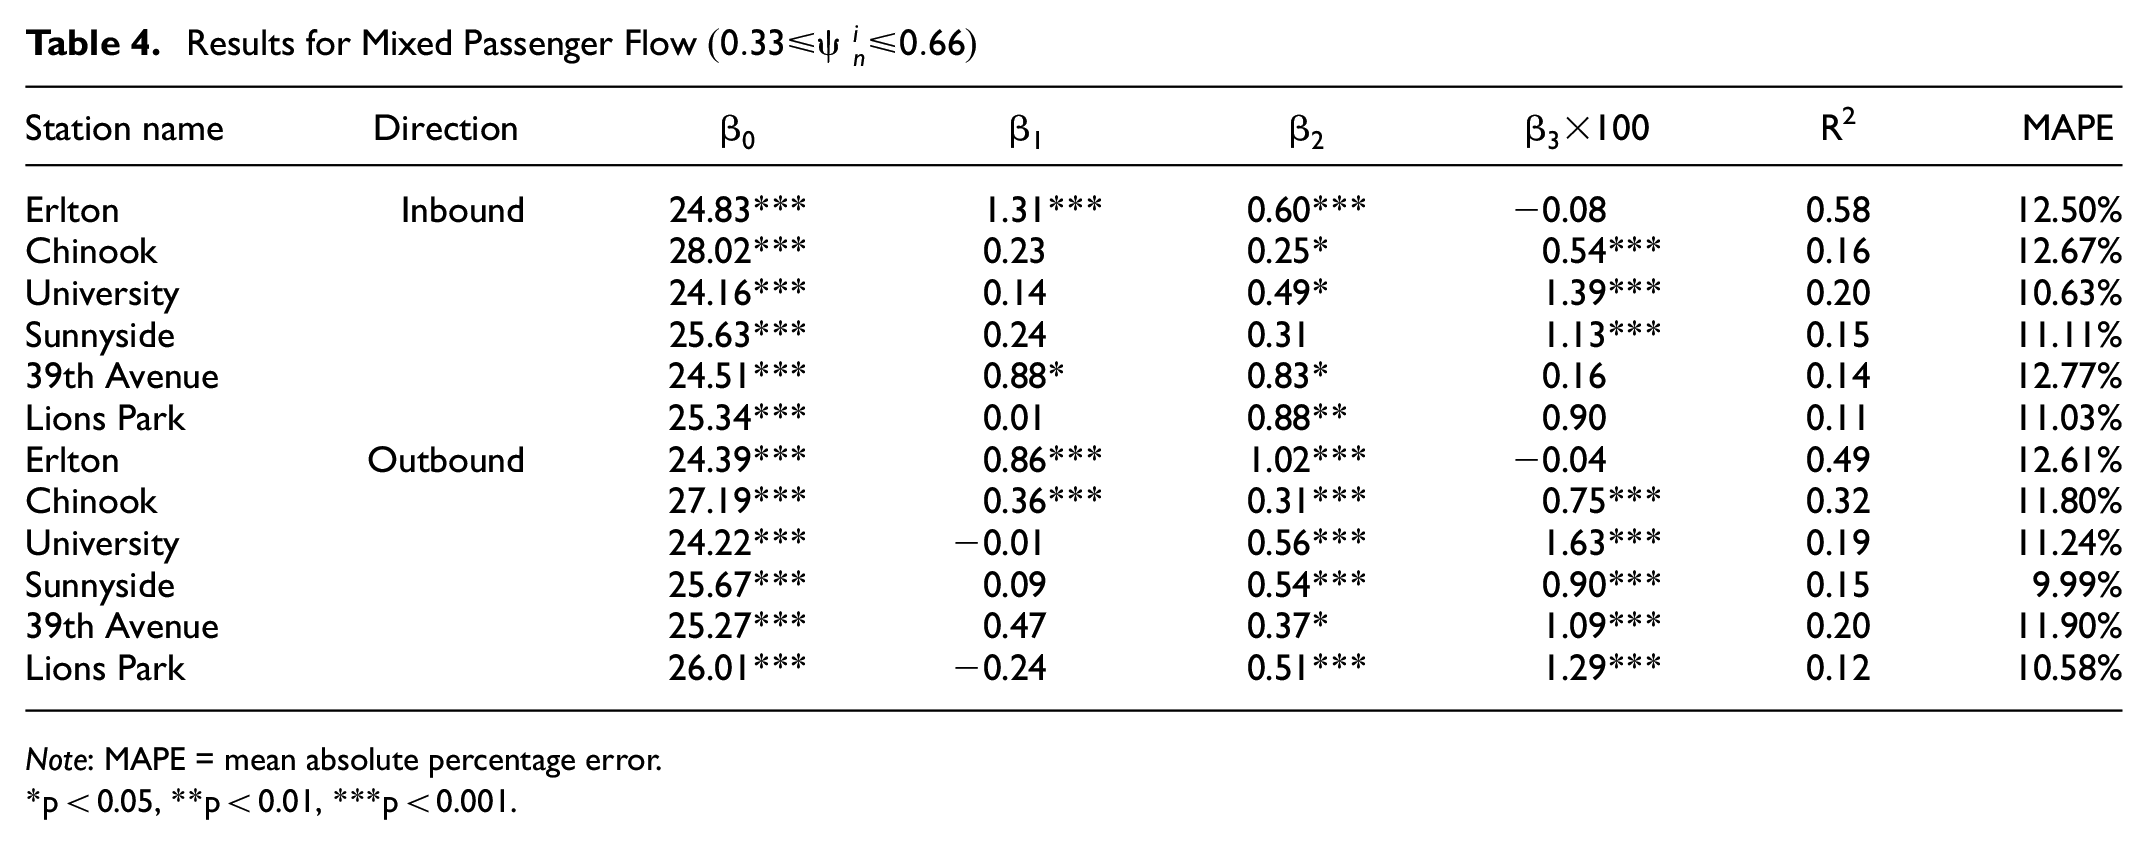
Note: MAPE = mean absolute percentage error.
*p < 0.05, **p < 0.01, ***p < 0.001.
Table 5 presents the regression results for the case of boarding-dominant passenger flow
Results for Boarding-Dominant Passenger Flow
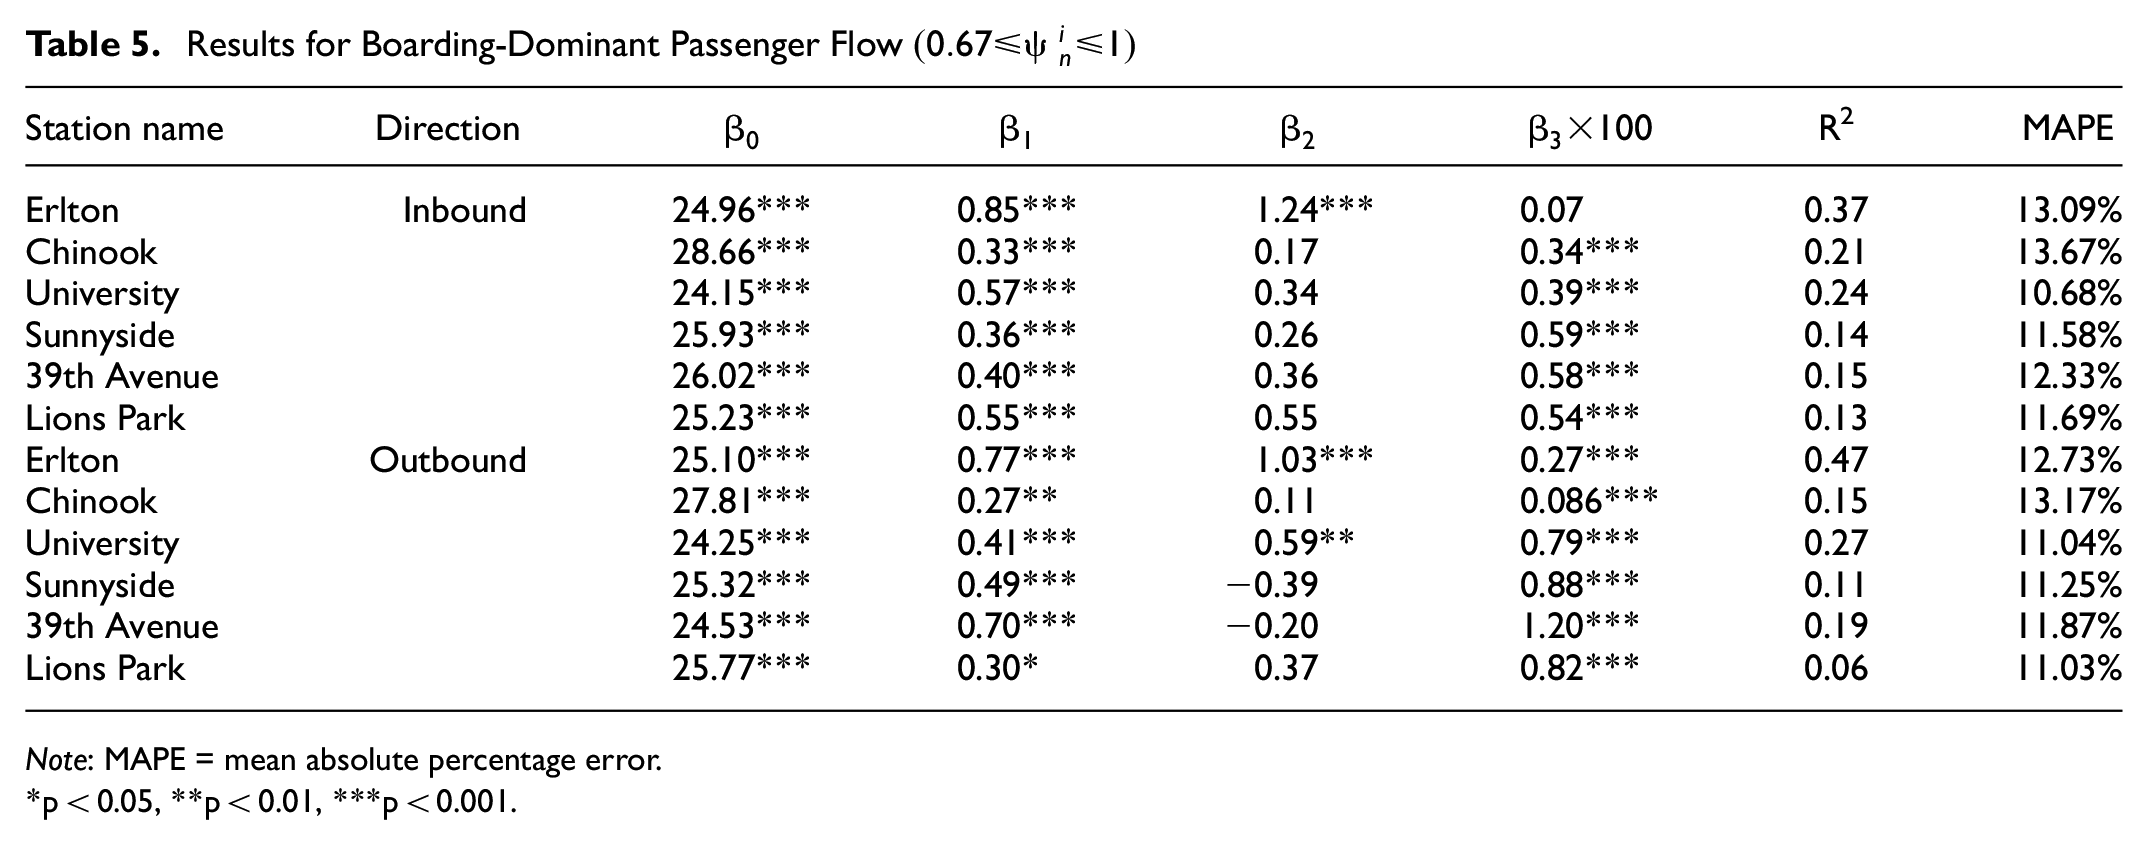
Note: MAPE = mean absolute percentage error.
p < 0.05, **p < 0.01, ***p < 0.001.
The presented analysis reveals that boarding takes more time in alighting-dominant passenger flow, whereas alighting takes a longer time per passenger in boarding-dominant passenger flow. The additional time because of passenger load is significant in most mixed passenger flow cases and consistently significant in boarding-dominant passenger flow, with the exception of Erlton Station in the inbound direction. However, in the case of alighting-dominant passenger flow, the term representing extra time due to passenger load lacks statistical significance. This is no surprise, as we expect alighting passengers to get closer to the train doors before door opening times. As such, when alighting is more dominant, higher train load does not affect dwell time as much as the case when boarding is dominant or with mixed flow. The term for extra time added due to passenger load can be omitted from the model for stations with a low significance level. Nevertheless, we have included it to facilitate uniform comparisons across all stations using the same model. We divided the data into multiple groups, such as passenger flows and directions, leading to instances where certain terms were statistically insignificant. It is crucial to acknowledge that our study’s primary objective was not to construct a concise dwell time model but rather to compare various scenarios, extracting insights from each unique case. A subsequent study, conducted without considering passenger flow distinctions, revealed that all independent variables were statistically significant using the same data and dwell time model ( 34 ). This implies that the decision to segregate data into multiple groups hinges on the specific objectives of study. In our case, we aimed to explore variations in the average passenger boarding and alighting times per passenger, particularly in the context of dominant boarding and alighting passenger flows.
The goodness of fit value varies by station, direction, and fraction of boarding passengers. It should be noted that we included both peak and off-peak periods for the model estimation. The goodness of fit could be improved by separating flows by peak/off-peak periods. However, this may result in insufficient data size for the comparisons of different passenger flows and station designs. It was observed that this data had many outliers, which resulted in lower R2 values for some models. We conducted a comprehensive study to identify the specific reason for outliers in the data ( 34 ). We found that outliers in dwell time data are not associated with specific time-related or passenger load factors; therefore, there is no solid reason to exclude outliers from the analysis. Also, literature on dwell time has reported lower R2 values for regression models ( 2 , 35–38).
Discussion
To ensure an unbiased and meaningful comparison of station-specific geometric characteristics, we have compared the estimated dwell time with the same level of demand for all stations, and findings are presented in Figure 6, a and
b
, for inbound and outbound direction, respectively. In both the figures, we assumed a passenger load of 10 passengers for the car with the critical door. We then increased the level of alighting demand along the x-axis and the level of boarding demand along the y-axis, ranging from 5 passengers to 15 for the critical door. The dwell time in seconds is represented on the z-axis, with different colors (blue, green, red, cyan, magenta, and yellow) corresponding to Erlton, Chinook, University, Sunnyside, 39th Avenue, and Lions Park, respectively. For each station, we have developed three distinct dwell time models (Equation 3) based on the passenger groups outlined in Table 1. In the displayed plot, we have employed one of these models to estimate the dwell time based on the fraction of boarding passengers
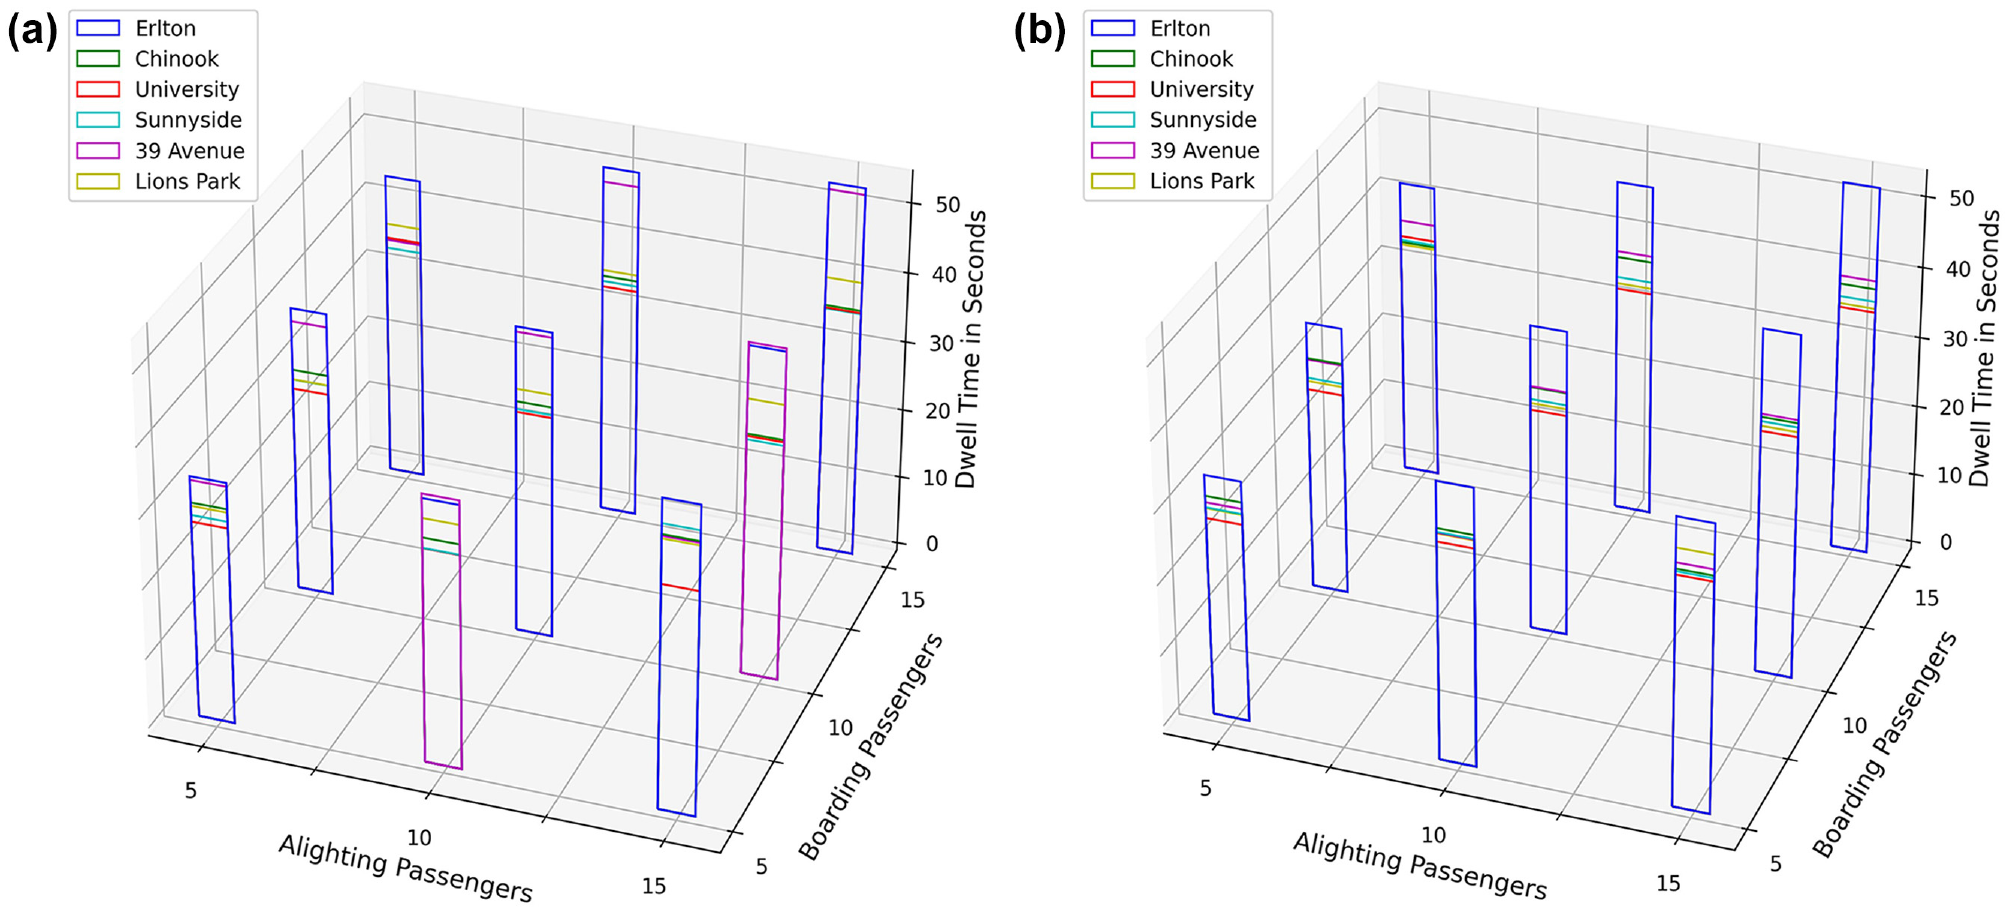
Dwell time comparison for boarding and alighting passengers for: (a) inbound and (b) outbound direction.
On careful observation, we have noted some interesting findings regarding the dwell times at different stations. University Station (Figure 3c) stands out, with the lowest dwell times in various scenarios. This station has a middle platform with two entrances located at the middle of the platform, as well as a heated waiting room positioned at the middle. These observations suggest that a station design with a middle platform and multiple entrances positioned at the middle of the platform outperformed other stations in term of dwell time in our case study for cases of alighting-dominant and mixed passenger flows. Another notable observation of the boarding-dominant group is that Sunnyside Station exhibits shorter dwell times for both directions, particularly under 30 seconds for the outbound direction. However, in most cases, Sunnyside Station stands out with the second-lowest dwell time of the other considered stations. Sunnyside Station, presented in Figure 3d, has side platforms with multiple entrances at the end and middle of the platform.
Erlton Station, presented in Figure 3a, has a middle platform but with a narrower width compared with other selected stations (around 7.5 m versus around 9–10 m). This station has maximum dwell time in all cases except the case of mixed passenger flow with a lower level of passenger demand in the inbound direction. Our case study revealed that a station with a middle narrow platform and two entrances positioned at the end underperformed compared with other station layouts. The 39th Avenue Station, depicted in Figure 3e, is designed with side platforms and features entrances at the end and middle. This station consistently exhibits the second-highest dwell time in most cases. Both 39th Avenue Station and Lions Park Station have identical platform widths, which are narrower by 0.5 m compared with Sunnyside Station. It is important to acknowledge that the difference in dwell time for the same level of passenger demand at 39th Avenue Station and Lions Park Station is influenced by the location of entrances and the platform area covered. Lions Park Station has multiple entrances at both ends and in the middle of the platform for the inbound direction and two entrances at both ends, along with a sidewalk at the lower grade for the outbound direction.
In summary, our study revealed significant insights into dwell times at different stations. University Station consistently stood out with the lowest dwell times, attributed to its middle platform and strategically placed entrances. Conversely, Sunnyside Station exhibited notably short dwell times for the case of boarding-dominant passenger flow, particularly under 30 s for the outbound direction, yet consistently ranked second-lowest overall. Erlton Station, characterized by a narrower middle platform, recorded maximum dwell times in most scenarios. Lastly, 39th Avenue Station consistently maintained the second-highest dwell times, highlighting the impact of platform layout on passenger flow dynamics.
Conclusions
Dwell time plays a vital role in the overall performance and capacity of rail systems, and making accurate estimations of dwell time is essential for operational planning, system simulation, and optimizing headway. Traditional data collection methods have limitations as far as data volume and accuracy are concerned, prompting the need for automated data sources such as APC and ALV. The primary objective of this study was to demonstrate the use of APC and AVL data for detailed dwell time estimation, accurately estimating passenger load per train car, and comparing dwell time models based on station-specific characteristics. By incorporating data from critical doors and considering the fraction of boarding passengers, this study aimed to provide valuable insights into passenger behavior and optimize rail operations. The literature on the distribution of waiting passengers highlighted that passenger distribution on the platform is influenced by the location and number of entrances. Assuming a uniform passenger distribution for dwell time estimation can lead to an underestimation of dwell time. Another literature gap in dwell time studies involves accurately estimating the passenger load for each car. This study aims to fill this gap by using APC data to identify the critical door for dwell time and to estimate the precise passenger load for each door.
The case study analyzed APC and AVL data from Calgary Transit for the entire months of July 2022 and July 2023, as well as 15 days each from January, April, and September 2023, with a focus on six selected stations with different platform designs. Regression analysis revealed variations in dwell time across stations, directions, and passenger flows. In regression analysis, a notable finding was that the average alighting time per passenger was higher in the boarding-dominant group, while the average boarding time per passenger was higher in the alighting-dominant group. This means, when the majority of passengers are boarding, the average alighting time per passenger was higher. On the other hand, when the majority of passengers are alighting, the average boarding time per passenger was higher. This result indicates that boarding time and alighting time per passenger heavily depends on passenger flow dominance. It is important to note that, when the passenger flow is alighting-dominant, boarding passengers cannot share time with the alighting passengers and need their own time for boarding. Based on our observations, we found that, for some stations, the coefficients for boarding passengers are not statistically significant in the case of alighting-dominant passenger flow and, similarly, the coefficients for alighting passengers are not statistically significant in the case of boarding-dominant passenger flow. Moreover, the significance level for the extra time added because of passenger load is low for alighting-dominant passenger flow for the case of Calgary’s LRT system. For the sake of comparison, we have selected the same regression model for all stations, but variables with low insignificance level should be removed from the model. Our subsequent study, without passenger flow distinctions, found all independent variables statistically significant, indicating the importance of data segregation based on study objectives, such as exploring variations in average passenger boarding and alighting times in the context of dominant flows.
The observations in our study indicated that a station with a middle platform and two entrances located at the middle (like University Station) was more efficient in minimizing dwell times for many instances except the case of boarding-dominant passenger flow. Moreover, stations with side platforms and multiple entrances at the ends and middle (e.g., Sunnyside Station) outperformed others for handling boarding-dominant passenger flow in our case study. Stations with a narrower middle platform and entrances at both ends of the platform (e.g., Erlton Station) underperformed other designs. This station exhibited the highest intercept and coefficients among the stations considered in this study. In our analysis, we discovered that a wider platform with multiple entrances was more effective in minimizing dwell time. Specifically, a side platform with three entrances performed better for boarding-dominant passenger flow, while a middle platform with two entrances in the middle excelled in alighting-dominant passenger flow. Stations tend to experience boarding-dominant passenger flow during morning peak hours and alighting-dominant flow during evening peak hours, and vice versa. In such scenarios, a side platform with more than two entrances and a wider platform is recommended for boarding-dominant direction, while more than one entrance with a wider platform is advised for alighting-dominant direction. For stations experiencing mixed passenger flow, it is recommended to have a middle platform with more than single entrances and a width of more than 9.0 m, as both morning and evening peak hours will involve mixed passenger flow.
While some of the observations and conclusions may not be generic for all systems and different stations, the proposed method and station categorization can help to address the efficiency of station design in terms of dwell time minimization. This method provides valuable insights into the dynamics of pedestrian movement by utilizing existing data, without the need for additional simulation. Different mixes of passenger flows have different impacts on dwell time, and a particular station design may be more appropriate given certain passenger flows, as such similar studies can be performed in different systems to design new or modify existing stations. The insights derived from this study hold a significant value for transit authorities, as they can aid in implementing improved crowd management strategies and optimizing resource allocation. While we utilized data from the LRV system, this approach can be extended and applied to any rail transit system equipped with APC and AVL systems for collecting similar data. For future research, it is recommended to study the role of station design on passenger distribution along the platform and the magnitude of boarding and alighting at the critical door. Moreover, extending this approach to other urban rail systems could lead to enhanced dwell time modeling and contribute to more efficient rail operations.
Footnotes
Acknowledgements
The authors of this paper would like to thank the Department of Civil Engineering and Schulich School of Engineering at the University of Calgary. We also extend our gratitude to Calgary Transit, City of Calgary, for providing invaluable data that were essential for conducting this research. Their cooperation and support played a pivotal role in the successful completion of this study. Particularly, we would like to thank Asim Mohammad, Nicholas Band, and Janice Lau for their support and insightful comments.
Author Contributions
The authors confirm contribution to the paper as follows: study conception and design: S. Saidi, S. Buchunde, S. Ataeian; analysis and interpretation of results: S. Buchunde, S. Ataeian, S. Saidi; draft manuscript preparation: S. Buchunde, S. Saidi, S. Ataeian. All authors reviewed the results and approved the final version of the manuscript.
Declaration of Conflicting Interests
The author(s) declared no potential conflicts of interest with respect to the research, authorship, and/or publication of this article.
Funding
The author(s) disclosed receipt of the following financial support for the research, authorship, and/or publication of this article: This work was financially supported partly by the Ministry of Social Justice and Empowerment, Government of India, Alberta Innovates, and the Natural Sciences and Engineering Research Council of Canada (NSERC) on Urban Transit System Diagnosis, Monitoring, and Management Using Mobility Sensing Data.