
Abstract
As a result of the lack of access to efficient public transit in suburban areas, residents often have to use their own vehicles to commute either within the area, to neighboring regions, or to a public transit hub (PTH). Thanks to information and communication technologies, on-demand transit (ODT) is a potential solution being proposed and considered by transit agencies. Although ODT has shown the potential to enhance transit level of service, its efficiency depends on different parameters such as demand spatial and temporal distribution or the configuration of the service. In this study, we propose a novel configuration for an ODT service and apply it to the first part of a commuter’s trip, or the commuter’s “first mile.” The proposed configuration depends on the availability of smart devices installed at bus stops. Passengers request their rides via smart devices and receive real-time and personalized information about their ride requests to travel to a PTH. The proposed ODT service is modeled with the Simulation of Urban Mobility or SUMO simulation framework. To evaluate the performance of the ODT service, it is applied to the city of Terrebonne in Quebec, Canada. The proposed service is compared with existing bus transit operating in the area as well as a door-to-PTH service. The results of the comparison analysis reveal that the proposed ODT service may result in a significant 36% reduction in total travel time as well as a 41% reduction in detour time compared with the existing bus transit service. A detailed sensitivity analysis is also conducted to capture the impacts of different parameters, variables, and dispatching algorithms on the service performance.
As a result of low population density in suburban areas, operating extensive fixed-route bus transit (FRT) can be expensive ( 1 , 2 ). FRT systems running in such areas typically provide low level of service characterized by low frequencies and long waiting times ( 3 ). As a result, these areas typically have high automobile mode share for trips within the area, the “first mile” and “last mile” of their trips to public transit stations, or for the whole trip to commute to other neighboring areas ( 1 , 3 ). This not only keeps transit ridership low but also increases the proportion of single-occupancy vehicle trips, worsens traffic congestion, and limits access to park-and-ride lots.
Over the last decade, rapid advancements in communication and information technology has enabled transit agencies to introduce innovative transportation services for both urban and suburban areas ( 4 , 5 ). On-demand transit (ODT) as an example has shown a remarkable potential for replacing FRT systems in suburban areas to serve local trips as well as act as feeders for public transportation for the first or last mile of commuters. Different simulation-based studies have demonstrated that ODT services show the potential to reduce the total passenger travel time, vehicle distance traveled, operating costs, and greenhouse gas emissions ( 4 – 7 ).
However, despite the promising outcomes reported in these studies, there are still some limitations. For instance, from the simulation perspective, some studies have built a grid network rather than considering real-world instances ( 2 , 4 , 8 ). Grid networks consist of nodes and edges without capturing the complexities and nuances existing in a real-world network. For example, they do not take traffic signals, roadway capacity, or speed limits into account. Considering a low level of supply or demand, as observed in some studies ( 1 , 5 ), may not precisely reflect the dynamics of passenger activities in the area, especially during peak hours. It is, therefore, essential to model different levels of supply and demand to assess the scalability and adaptability of ODT services in suburban areas. Additionally, it is important to note that not all studies have shown the implementation of ODT to be effective ( 8 – 10 ). For example, a case study in Brooklyn, New York City (NYC), revealed that ODT services may not always be the best alternative, and FRT systems under certain objectives, conditions, and constraints can perform more efficiently ( 8 ). From the system design perspective, most of the studies that have proposed ODT services have considered door-to-station services, in which passengers are picked up from their homes or from designated stops that they need to get to before being delivered to a destination station. At the same time, none of these studies depicted the structure of their proposed ODT service with regard to communication and interactions between different elements of the system. For instance, they do not elaborate on how passengers request their rides or how they receive the essential information of their journeys. It is implied that a mobile application is required. Additionally, there are some existing services in which passengers can book their rides via phone calls ( 11 ). However, access to a personal device is still required for reservation. Privacy concerns may lead passengers to be reluctant to use mobile applications for booking a ride. Furthermore, individuals without access to phones are hindered in this respect.
Based on this, in this study, we present a novel system for an ODT service leveraging smart devices installed at bus stops for local communication with passengers and for providing them with real-time information. Prototypes of these smart devices, developed by the smart bus stop manufacturer, BusPas, Inc., have been installed at bus stops in Montreal and Laval, Canada ( 12 ). They offer transit agencies as well as passengers valuable information such as bus estimated arrival time, potential delays, or the number of passengers on buses. Providing such real-time information can enhance passenger satisfaction while also enabling transit agencies to make data-driven decisions to optimize their operations. To the best of our knowledge, our proposed system is the only one that offers passengers the flexibility of using it with or without a mobile application or any other device such as a phone. Furthermore, the proposed system is used to simulate the ODT service for first-mile trips to pick up passengers from bus stops and drop them off at a public transit hub (PTH). The proposed service is applied to the city of Terrebonne, located in the suburbs of Montreal, Canada. The performance of the service is evaluated by comparing it with the existing bus transit operating in the area as well as a door-to-PTH service.
The contributions of this paper include:
Proposing an innovative system for ODT service that takes advantage of the capabilities of smart devices installed at bus stops.
Conducting a simulation of the proposed ODT service for the first-mile trip and implementing it in a real-world suburban area.
Evaluating the performance of the proposed service by comparing it with the existing bus transit system operating in the area as well as a door-to-PTH service.
Conducting an extensive sensitivity analysis on different service parameters and variables.
It is important to note that we assume the proposed ODT service has the same fare as that of the current bus transit service operating in the region. By adopting this assumption, the proposed ODT service with the same level of affordability offers more accessibility than the current bus transit service.
The rest of the paper is as follows. In the literature review section, we survey the literature on ODT and shared mobility services. In the section on methodology, we explain the different components of the proposed system and the simulation environment. We then present the results of the proposed service and compare them with the existing public transportation services in the section on implementation and results. In the last section, we conclude the paper and propose some directions for future research.
Literature Review
In this section, we briefly review the literature related to ODT and shared mobility services to assess their performance and then provide a discussion to highlight the contributions of this study.
Inturri et al. ( 5 ) conducted a simulation-based study to compare different demand-responsive shared transit (DRST) service configurations with a taxi service for economic attractiveness and sustainability. They applied their model to the city of Ragusa in Italy. Different scenarios were created by varying the number of vehicles, seat capacity, passenger demand, and route choice strategies of the vehicles. Their analysis and results indicate that the DRST system offers more advantages over taxis, particularly when handling higher demand levels. On the other hand, when demand was low or when the DRST was simulated to operate with a small fleet of vehicles, it was found not to perform as efficiently as taxis.
Calabro et al. ( 2 ) presented an agent-based simulation framework to compare the performance of a demand-responsive feeder (DRF) service of a mass rapid transit (MRT) system with conventional fixed-route fixed-schedule feeders (FRFs). To do so, they first identified the “critical demand density” that represents a switching point between the two services. Then, various scenarios were tested in a rectangular grid network by changing the demand spatial distribution and patterns, service area, and service configurations. They synthesized the demand through analytical models. To simulate the FRFs, they considered a back-and-forth service on a straight line from the MRT station to the farthest bus stop. Their results reveal that the DRF performs better when the distance between stations is high whereas the FRF is more efficient when the demand originates from MRT stations.
Yoon et al. ( 8 ) proposed a simulation sandbox to evaluate the performance of different transit services, including fixed-route, semi-flexible transit, and on-demand micro-transit under different design parameters and variables. A data set derived from the B63 bus route in Brooklyn, NYC, was used. MATLAB software was used to build a network and to implement the simulation environment. Different indicators, including total ridership, average weighted travel time, and total vehicle miles traveled (VMT) were measured. The results indicated that the fixed-route system had the highest ridership compared with other services, operating under the same demand pattern. On the other hand, on-demand micro-transit services offered the shortest average weighted travel time. However, as demand increased, travel time started to become longer. Finally, the on-demand micro-transit system was found to have the longest total VMT because of the exclusion of the access/egress walks of users.
Alsaleh and Farooq ( 1 ) evaluated the sustainability of an ODT system from the perspective of overall efficiency, environmental footprint, and social equity and inclusion. The Town of Innisfil, Ontario, was selected as the study area where an ODT system has been implemented since 2017. They compared three types of services, including a crowdsourced ODT service, a dedicated fleet ODT service, and a hybrid transit system. Their results revealed that when supply was sufficient, the crowdsourced ODT system represented the most cost-effective transit system when demand was below 3.37 riders per square kilometer per day. However, in the presence of surge pricing for crowdsourced ODTs, hybrid systems proved to be the most cost-effective when the demand level was within the range of 1.18 and 3.37 riders per square kilometer per day. When dealing with a demand level below 3.37 riders per square kilometer per day, the use of private vehicles was shown to be more environmentally sustainable compared with the other services.
Burstlein and Farooq ( 3 ) simulated an ODT service that acts as a feeder of MRT for the first mile of trips. The ODT was modeled with the PTV MaaS Modeller and Visum software and was applied to the city of Markham, Canada. Two types of vehicles were used, including cars and vans, and there were 1,865 trip requests between 7:00 and 10:00 a.m. as part of the morning peak. According to their results, in the best-case scenario, 75% of the fleet size was used and lower values of detour factor were reported. Passengers would wait 3 min for the service to arrive and spend 10 min in the vehicle.
In the context of shared mobility, there is extensive literature that has addressed the problem from different aspects such as trip time window, objective function, system structure, and so forth. For system structure, the majority of studies have used a centralized approach for designing a shared mobility system ( 13 , 14 ), whereas others have opted for a decentralized/distributed approach to tackle the issue ( 15 – 17 ). For example, a centralized multi-step graph-based procedure was proposed by Alonso-Mora et al. ( 13 ) to assign drivers to riders efficiently by providing a point-to-point service. Their results suggested that 98% of the taxi rides in NYC could be served with just 3,000 taxis with a capacity of four, instead of the existing 13,000 taxis. Meshkani and Farooq ( 18 ) presented a ride-matching algorithm for the ride-matching problem and applied it to a point-to-point on-demand shared ride-hailing service. Their study reported 10.38 and 3.57 min for the detour time and wait time, respectively, when a passenger shared their ride with three or more passengers. However, the results of some studies ( 19 , 20 ) reported the long travel times and high detour factors as the main barriers to the adoption of on-demand shared mobility systems. Meshkani and Farooq ( 17 ) presented a distributed ride-matching system that takes advantage of infrastructure-to-infrastructure and vehicle-to-infrastructure connectivity. A network of intelligent intersections was used in the transportation network which was able to execute the ride-matching algorithm. Moreover, the infrastructure-to-infrastructure capability enabled them to exchange information in case of need.
Research Contribution
One of the main problems with the existing bus transit service is poor accessibility to the bus because of the low frequency of buses in suburban areas. Bus transit agency revenue depends on ridership levels, and, thus, in areas where population density is low, it is not cost-effective to operate a service or increase the frequency of buses. When bus transit is highly accessible in suburban areas, passengers are willing to use it even if they have to walk a short distance to reach the bus stop. However, in a door-to-PTH service, passengers will experience a long waiting time and detour time, which decreases its attractiveness and service level. Another major issue is that during off-peak hours, there are very few passengers inside the buses. ODT or micro-mobility services can be used and operated instead of buses to reduce capital and operating costs.
Some previous studies have suggested designated locations to pick up passengers, whereas others have suggested passengers are picked up where requested ( 3 ). Most of these studies, nevertheless, do not provide further details on how passengers are expected to communicate with the system. Similar to the current on-demand ride-hailing services (e.g., Uber, Lyft), it seems that a mobile application needs to be developed and used to provide the required connectivity and provide passengers with real-time information. However, all passengers may not be interested in using a mobile application for various reasons such as privacy. The ODT framework we propose in this study uses smart devices that are installed at the existing bus stops. To use our proposed ODT service, passengers need to go to a bus stop and place their requests through smart devices. However, there is potential to develop a mobile application that establishes the connection between passengers and smart devices. It is worth mentioning that the idea of local communication with smart devices, as described above, has already been mentioned in the literature ( 17 ). However, this study introduces a practical implementation that has been prototyped and installed in several bus stops in Montreal and Laval, Canada ( 12 ).
Some studies have used grid networks to simulate the ODT ( 2 , 8 ). Although using such a network can give invaluable insights into the performance of the ODT services, it cannot truly capture the complexities and nuances that exist in real-world instances. Nevertheless, the framework we propose is applied to the real network of Terrebonne, a suburb of Montreal, which takes into account traffic signals, speed limits of roadways, and vehicle limits on the roadways. Moreover, the current bus transit service running in the network was considered for the comparison analysis. Unlike certain prior studies ( 1 , 5 ) that considered a low passenger demand for the ODT, this study examines different demand levels to account for the fluctuations of the demand in the area and also to evaluate the scalability and adaptability of the proposed ODT service.
Methodology
In this section, we begin by describing the different components of our proposed ODT service. Next, we present the framework of the ODT service. Following that, in the simulation setup section, we introduce the study area and discuss the simulation settings.
Service Components
Our proposed ODT service consists of the following components:
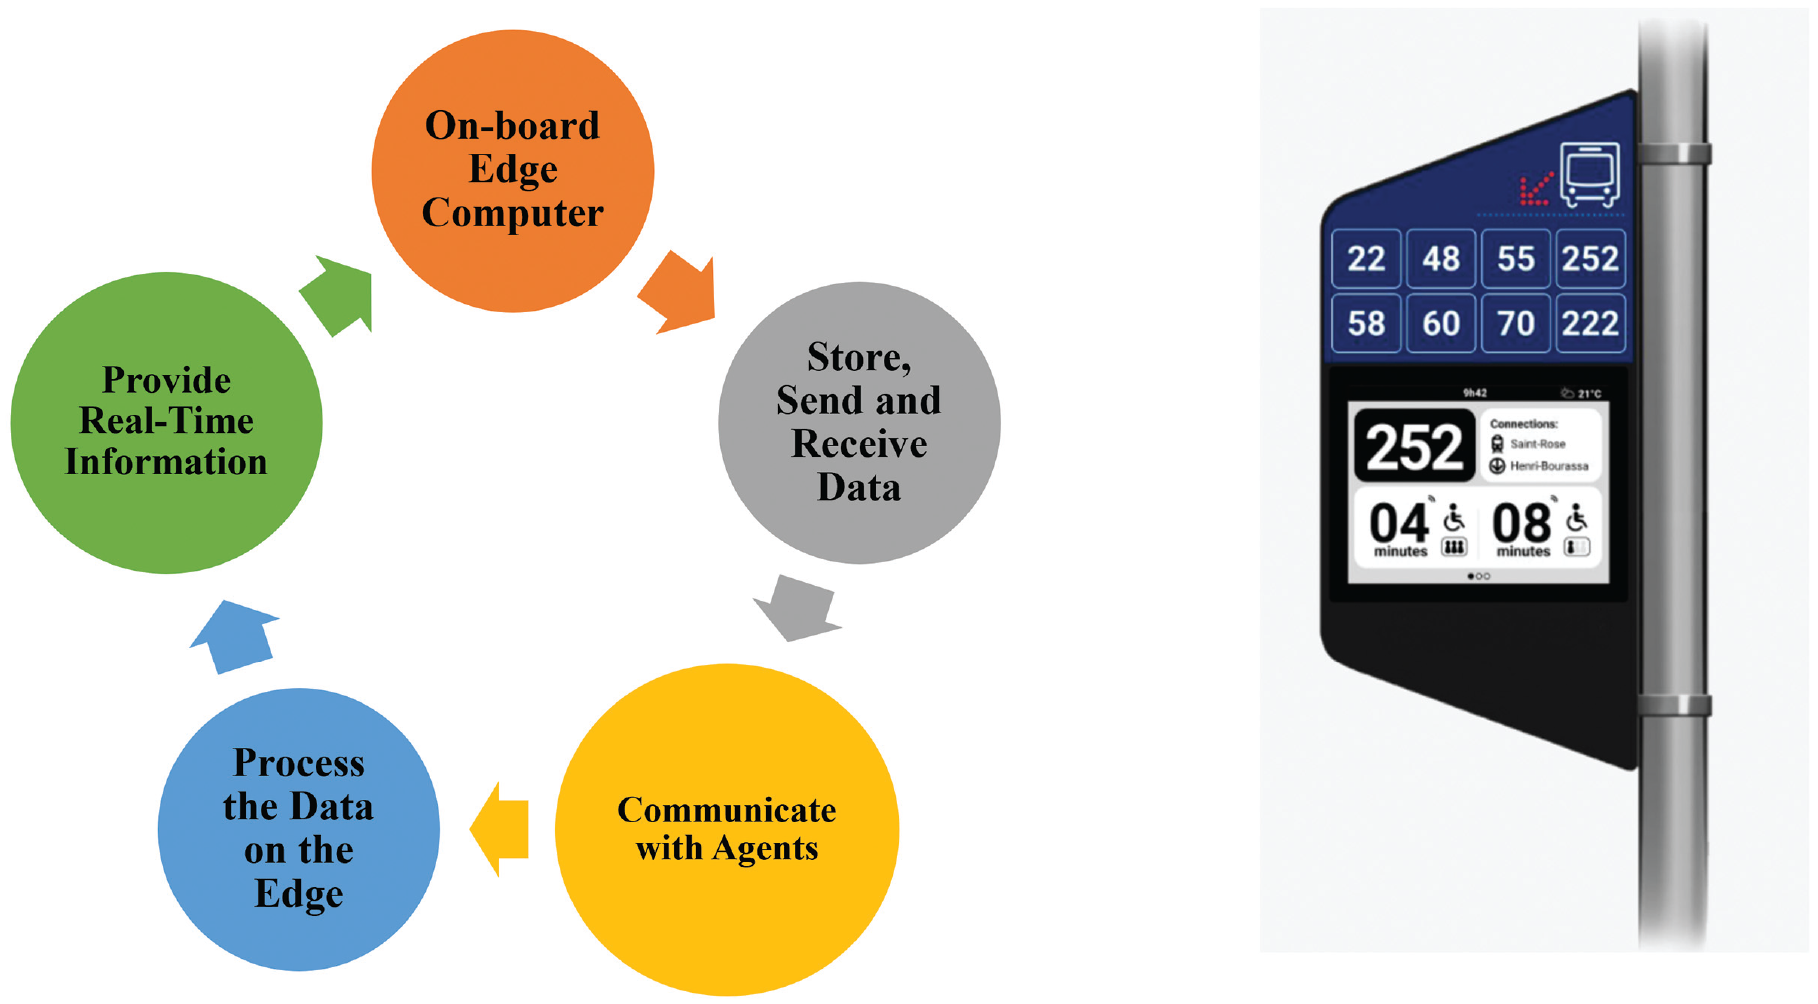
Smart City Network (SCiNe) and some key features.
Service Framework
Figure 2 illustrates the framework of our proposed ODT service, different elements, and their interactions with each other. In this service, passengers are required to make it to a bus stop equipped with a SCiNe
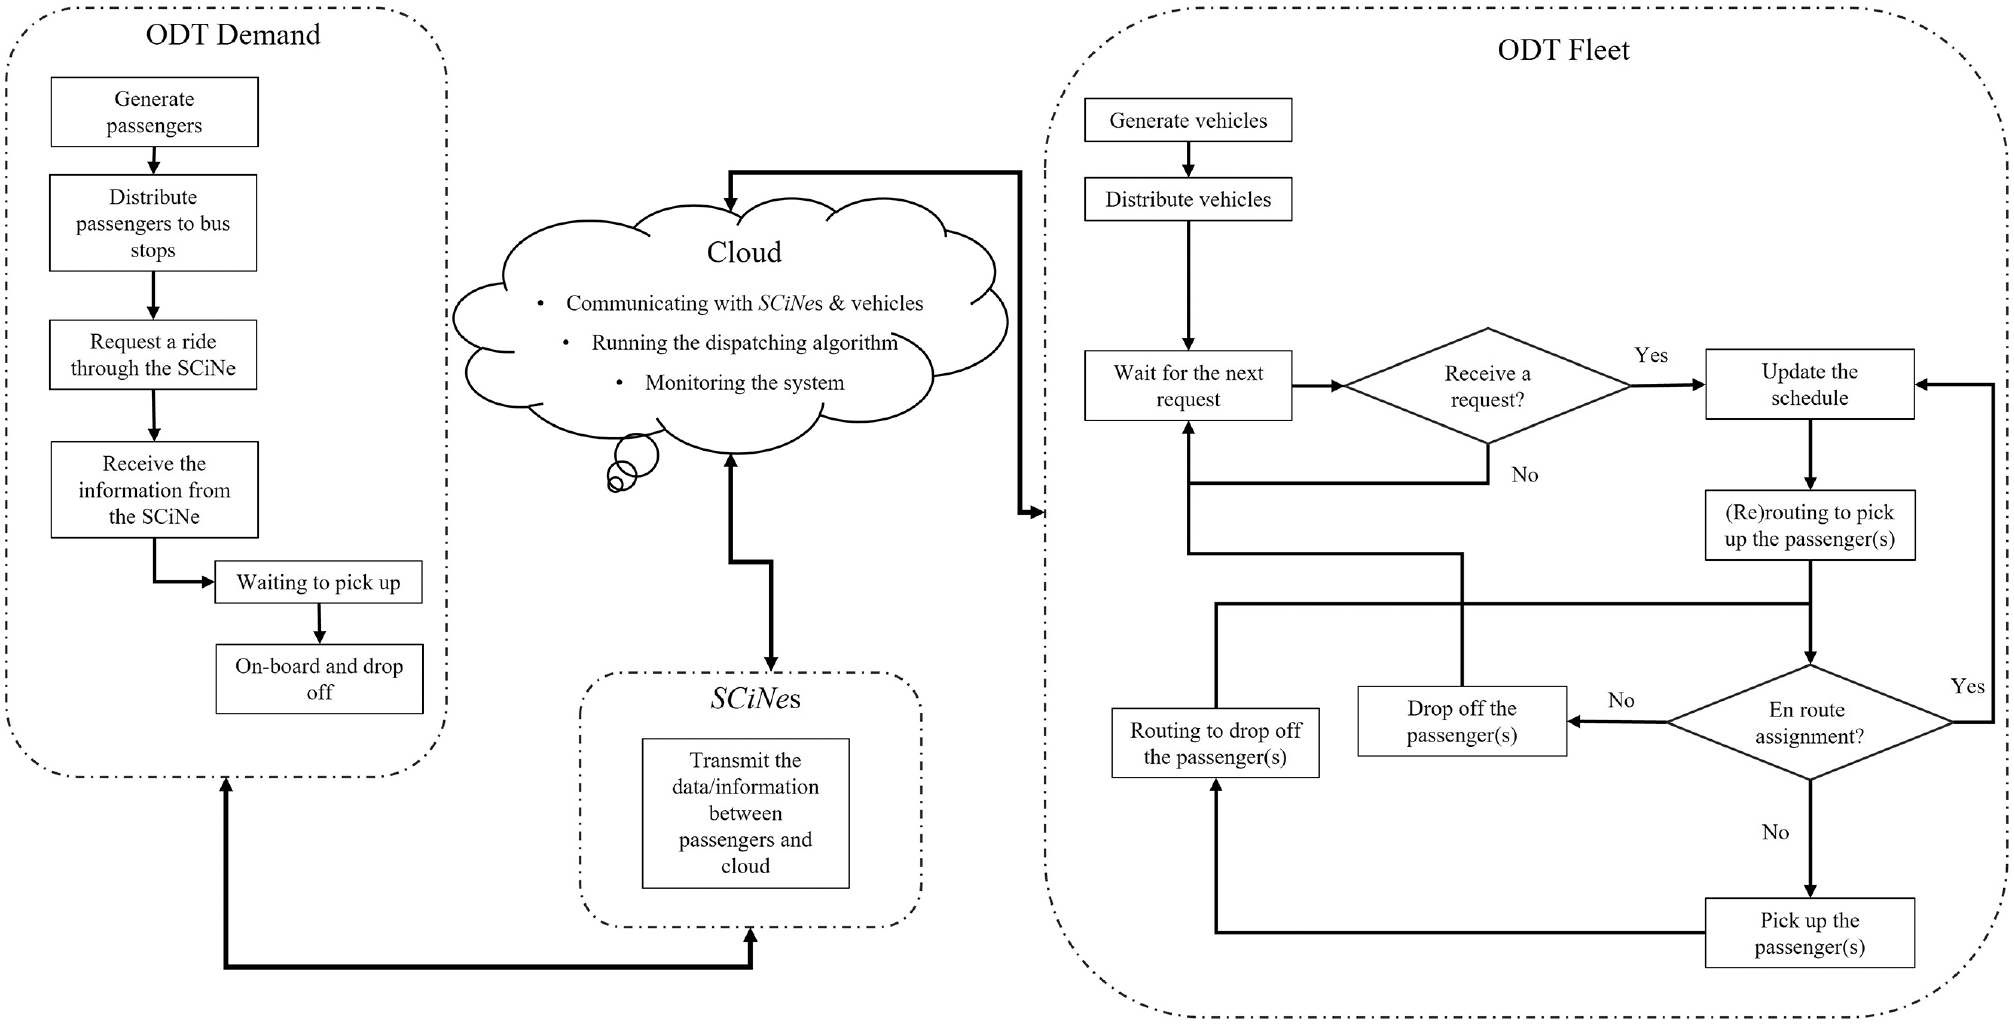
On-demand transit (ODT) service conceptual model.
The real-time data received from the vehicles and SCiNes are transmitted to the dispatching algorithm. The dispatching algorithm plays a crucial role as the main decision maker in the ODT services. First, it is responsible for dynamically matching passengers to available vehicles by taking different parameters into account such as passenger wait time and detour time.
Moreover, it examines the spatial/temporal proximity of passengers to serving two or more passengers simultaneously whenever possible. In the allocation of vehicles to passengers, it considers vehicle availability, the proximity of passenger location, and the expected duration of the trip. Once a vehicle is assigned to a passenger, the algorithm determines the optimal route for a vehicle to reach a bus stop and pick up the passenger. To select the best route, it takes real-time traffic conditions, distance, and estimated travel time into account.
The output of the dispatching algorithm includes the assignment of vehicles to passengers, the schedule of vehicles to serve passengers, and the routing of the vehicles to reach different locations. Passengers receive personalized information through the SCiNes, which includes the identity (ID) of the vehicles they have been assigned along with the estimated waiting time. Vehicles also receive information on the passengers who need to be served and the bus stop locations.
Simulation Setup
To model and evaluate our proposed ODT service, we use the Simulation of Urban Mobility (SUMO) environment, which is an open-source, microscopic, and continuous traffic simulation package. In the following, we will explain the study area and various simulation settings.
Study Area
Terrebonne is a suburb of Montreal, located in southwestern Quebec, Canada (Figure 3a). According to the 2021 Canadian Census, Terrebonne has a population of 119,944 with a land area of 153.76 km2 and a population density of 780.1 people per square kilometer, making it Montreal’s third-largest suburb. Terrebonne is served by a bus transit service that connects its residents to several metro stations in Laval as well as Montreal. This service is operated by the Réseau de transport métropolitain. The Terrebonne terminus, as seen in Figure 3b, is located in the western part of the city and acts as a vital PTH, serving local residents traveling from/to Terrebonne. To simulate the ODT service, it is assumed that all passengers travel to the terminus as the first-mile trip.
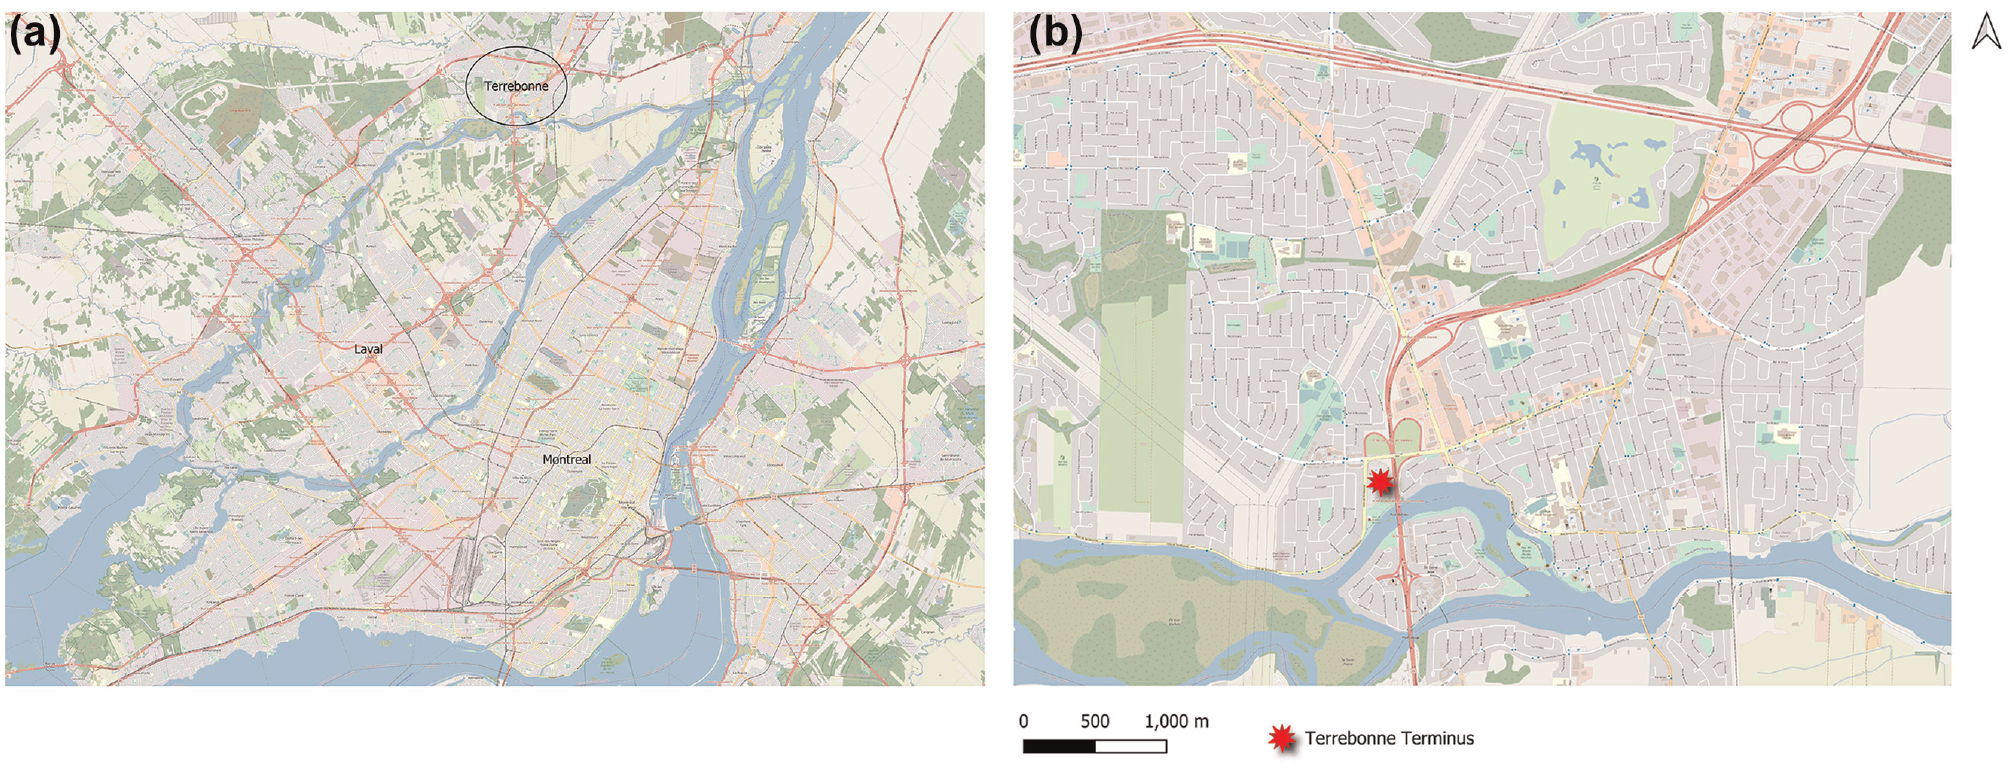
The geographic location of Terrebonne and Terminus. (a) City of Terrebonne. (b) Terrebonne Terminus (PTH).
Simulation Inputs
Various inputs are required to model the ODT, including the transportation network, ODT demand data, and the ODT fleet of vehicles. As passengers place their ride requests at bus stops, bus stop network data are also essential, which includes bus stop ID, location, and precise position in the street. These data are necessary for coordinating pickups, assigning vehicles accurately, and planning routes in the ODT service. The study period in this study is 2 h from 7:00 to 9:00 a.m.
Transportation Network
The transportation network data for the network of Terrebonne is created using Open Street Map that includes essential geographical and network elements such as road segments, intersections, traffic signals, lane configurations, and speed limits. As passengers request rides at bus stops within Terrebonne, detailed information about the bus stop network is needed. To provide this necessary information, we use the General Transit Feed Specification data format.
ODT Demand
As a result of the lack of access to real data of bus transit users in Terrebonne, the required demand for the ODT service is simulated in a manner that mimics the behavior of actual users. The Poisson distribution is used to model the stochasticity of passengers arriving at bus stops. To accurately consider variations in demand within a time period, different temporal distribution patterns are created and tested. For the spatial distribution of the demand, since the study area is mainly residential, the demand is evenly distributed across the network.
ODT Fleet
The fleet of vehicles for the proposed ODT system is generated and distributed randomly across the network. Once each vehicle drops off its assigned passengers at the terminus, it remains idle there, waiting for the next request(s). There is only a single type of vehicle in each simulation scenario. The initial capacity of the vehicles is assumed to be four. However, to address the impact of vehicle capacity on the performance of the ODT, it will change in different scenarios. All of the vehicles exist in the network from the beginning until the end of the simulation.
Dispatching Algorithm
There are different dispatching algorithms available in SUMO, each tailored to different spatial and temporal scenarios. As the type of the dispatching algorithm can affect the performance of the ODT, different SUMO dispatching algorithms, including “greedy,”“greedyShared,” and “routeExtension” will be tested in this study. The “greedy” algorithm runs on a first come, first served basis, which assigns passengers to the closest vehicle (with regard to travel time). In “greedyShared” algorithm, a vehicle is allowed to pick up another passenger while en route to deliver the first passenger, whereas in the “routeExtension” algorithm a vehicle can pick up any passenger along its route ( 21 ). It is worth mentioning that the default value for the detour factor is two. This implies that the ODT service’s maximum travel time must not exceed the direct travel time multiplied by this factor.
Vehicle Routing
The default algorithm in SUMO for the routing of vehicles in the network is the Dijkstra algorithm, based on the shortest path or the minimum cost path between two nodes in a weighted graph.
Implementation and Results
To evaluate the performance of the proposed ODT service, it was compared with the existing bus transit service operating in Terrebonne as well as with a door-to-PTH service that picks up passengers from the location of their requests. Moreover, a detailed sensitivity analysis was conducted to assess the impact of different parameters and variables on the service. To do so, various scenarios were created by varying demand levels, fleet size, study period, and dispatching algorithms. For the ODT and door-to-PTH, average total travel time, average waiting time, and average detour time were measured, whereas for the existing bus transit, the two indicators of average total travel time and average detour time were measured. Average total travel time includes both waiting time and in-vehicle time. It is worth mentioning that to measure indicators associated with the existing bus transit, we made requests to the Google Maps API.
Tables 1 and 2 present the results of the simulation that compares the ODT service with the existing bus transit. This simulation was conducted for two different study periods of 7:00 to 8:00 a.m. and 7:00 to 9:00 a.m. on July 21, 2023. The initial values for fleet size and demand level are 50 and 200, respectively.
Results for 60-Min Simulations
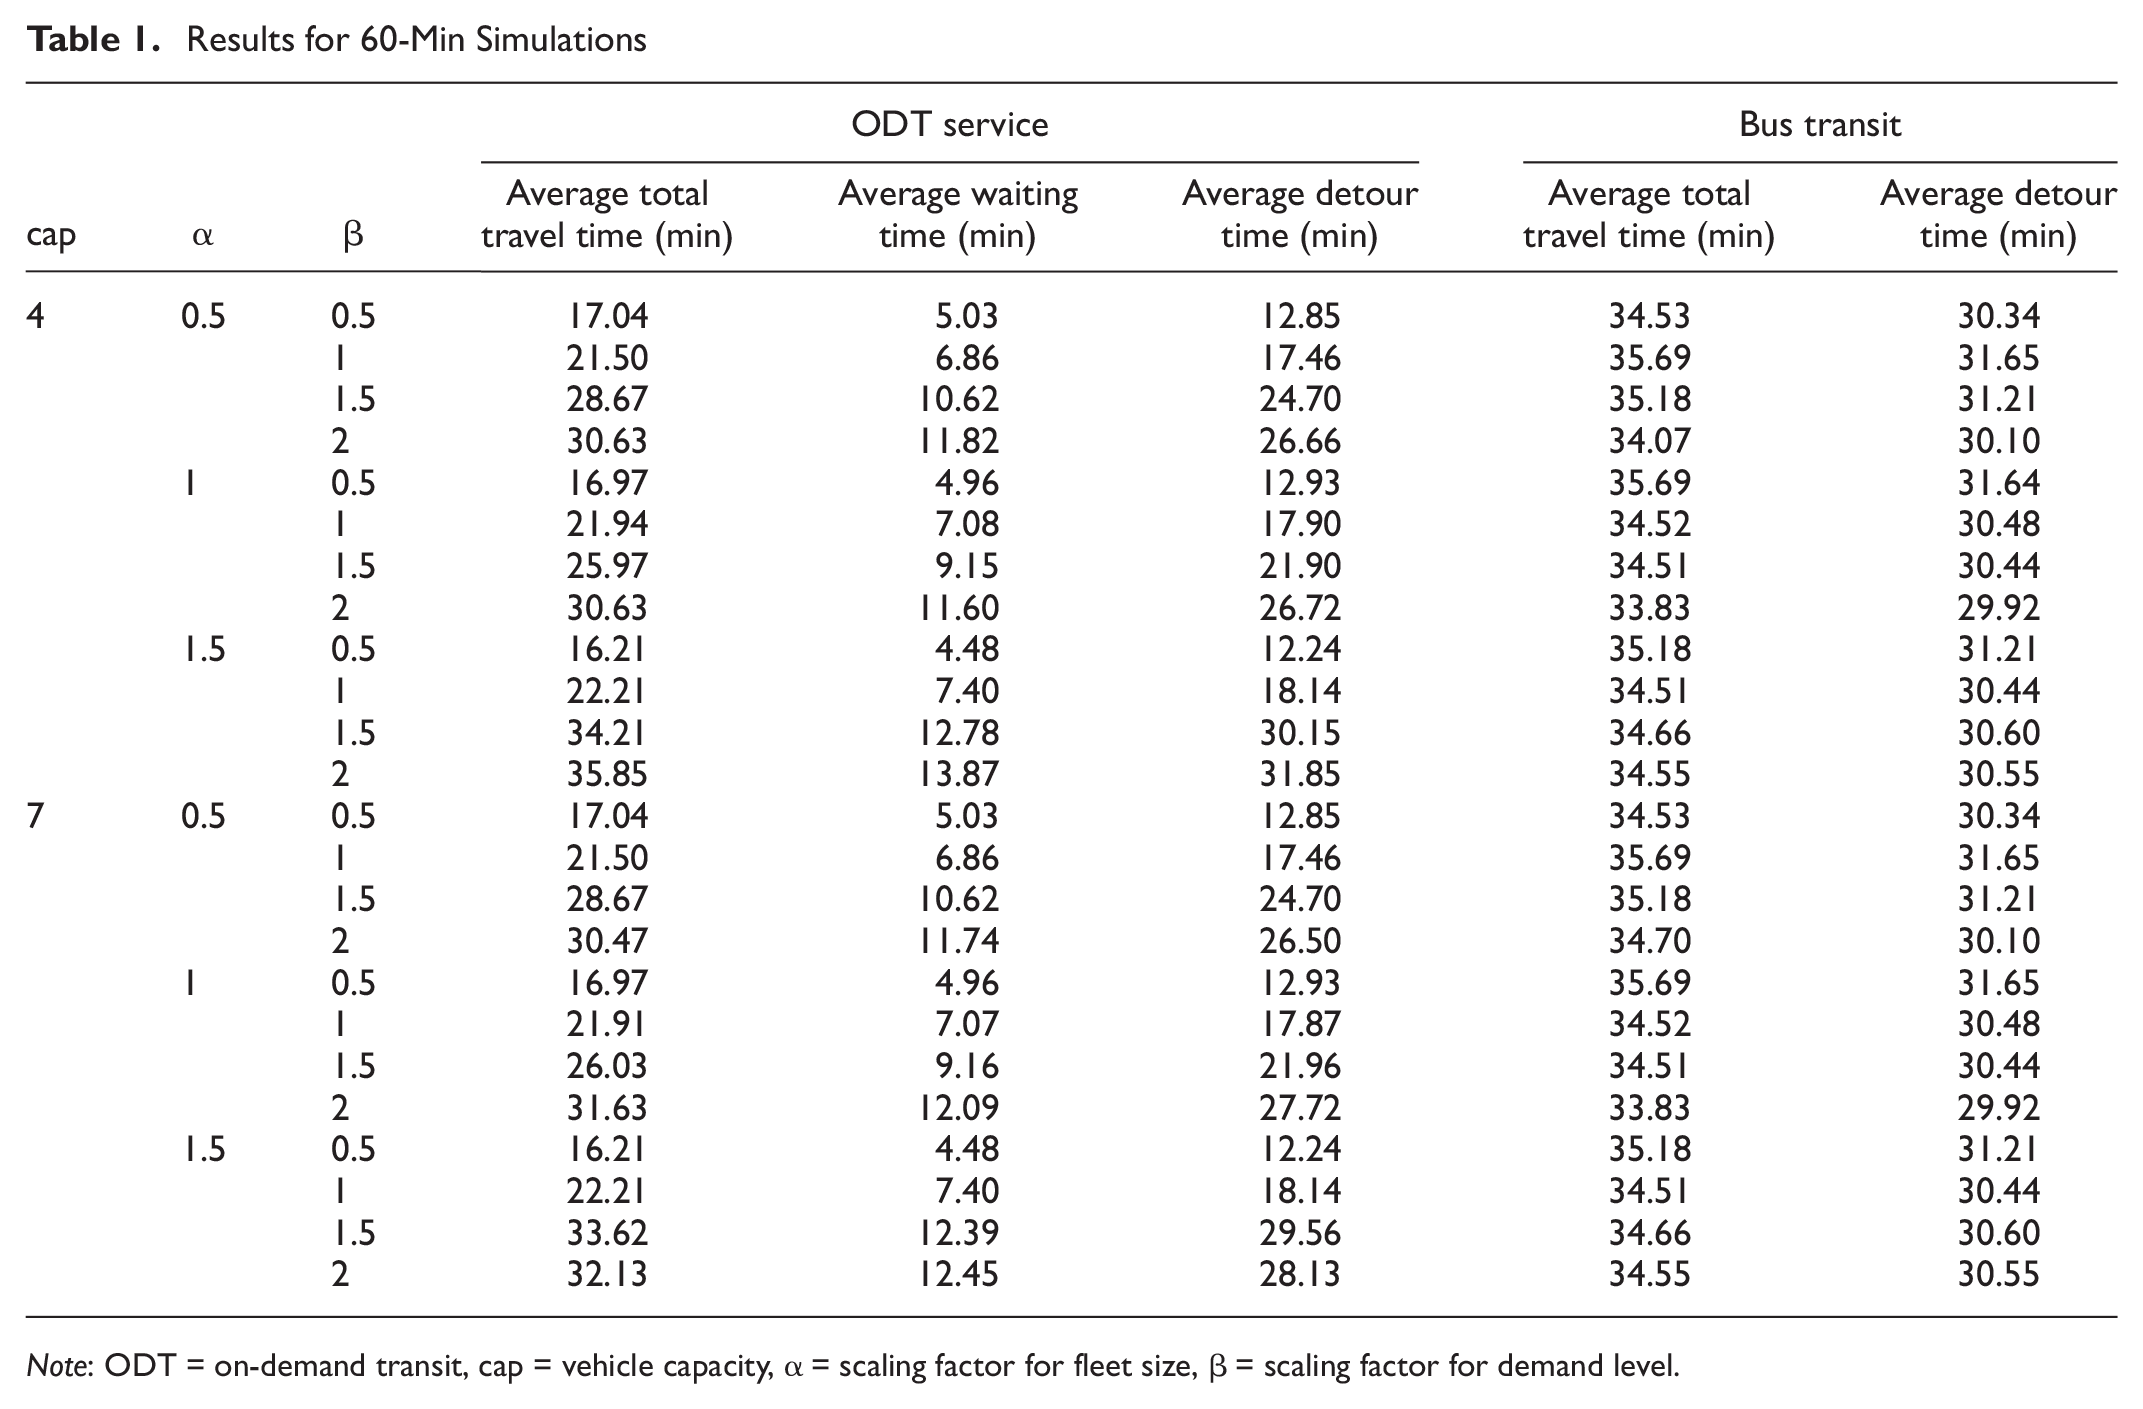
Note: ODT = on-demand transit, cap = vehicle capacity, α = scaling factor for fleet size, β = scaling factor for demand level.
Results for 120 -Min Simulations
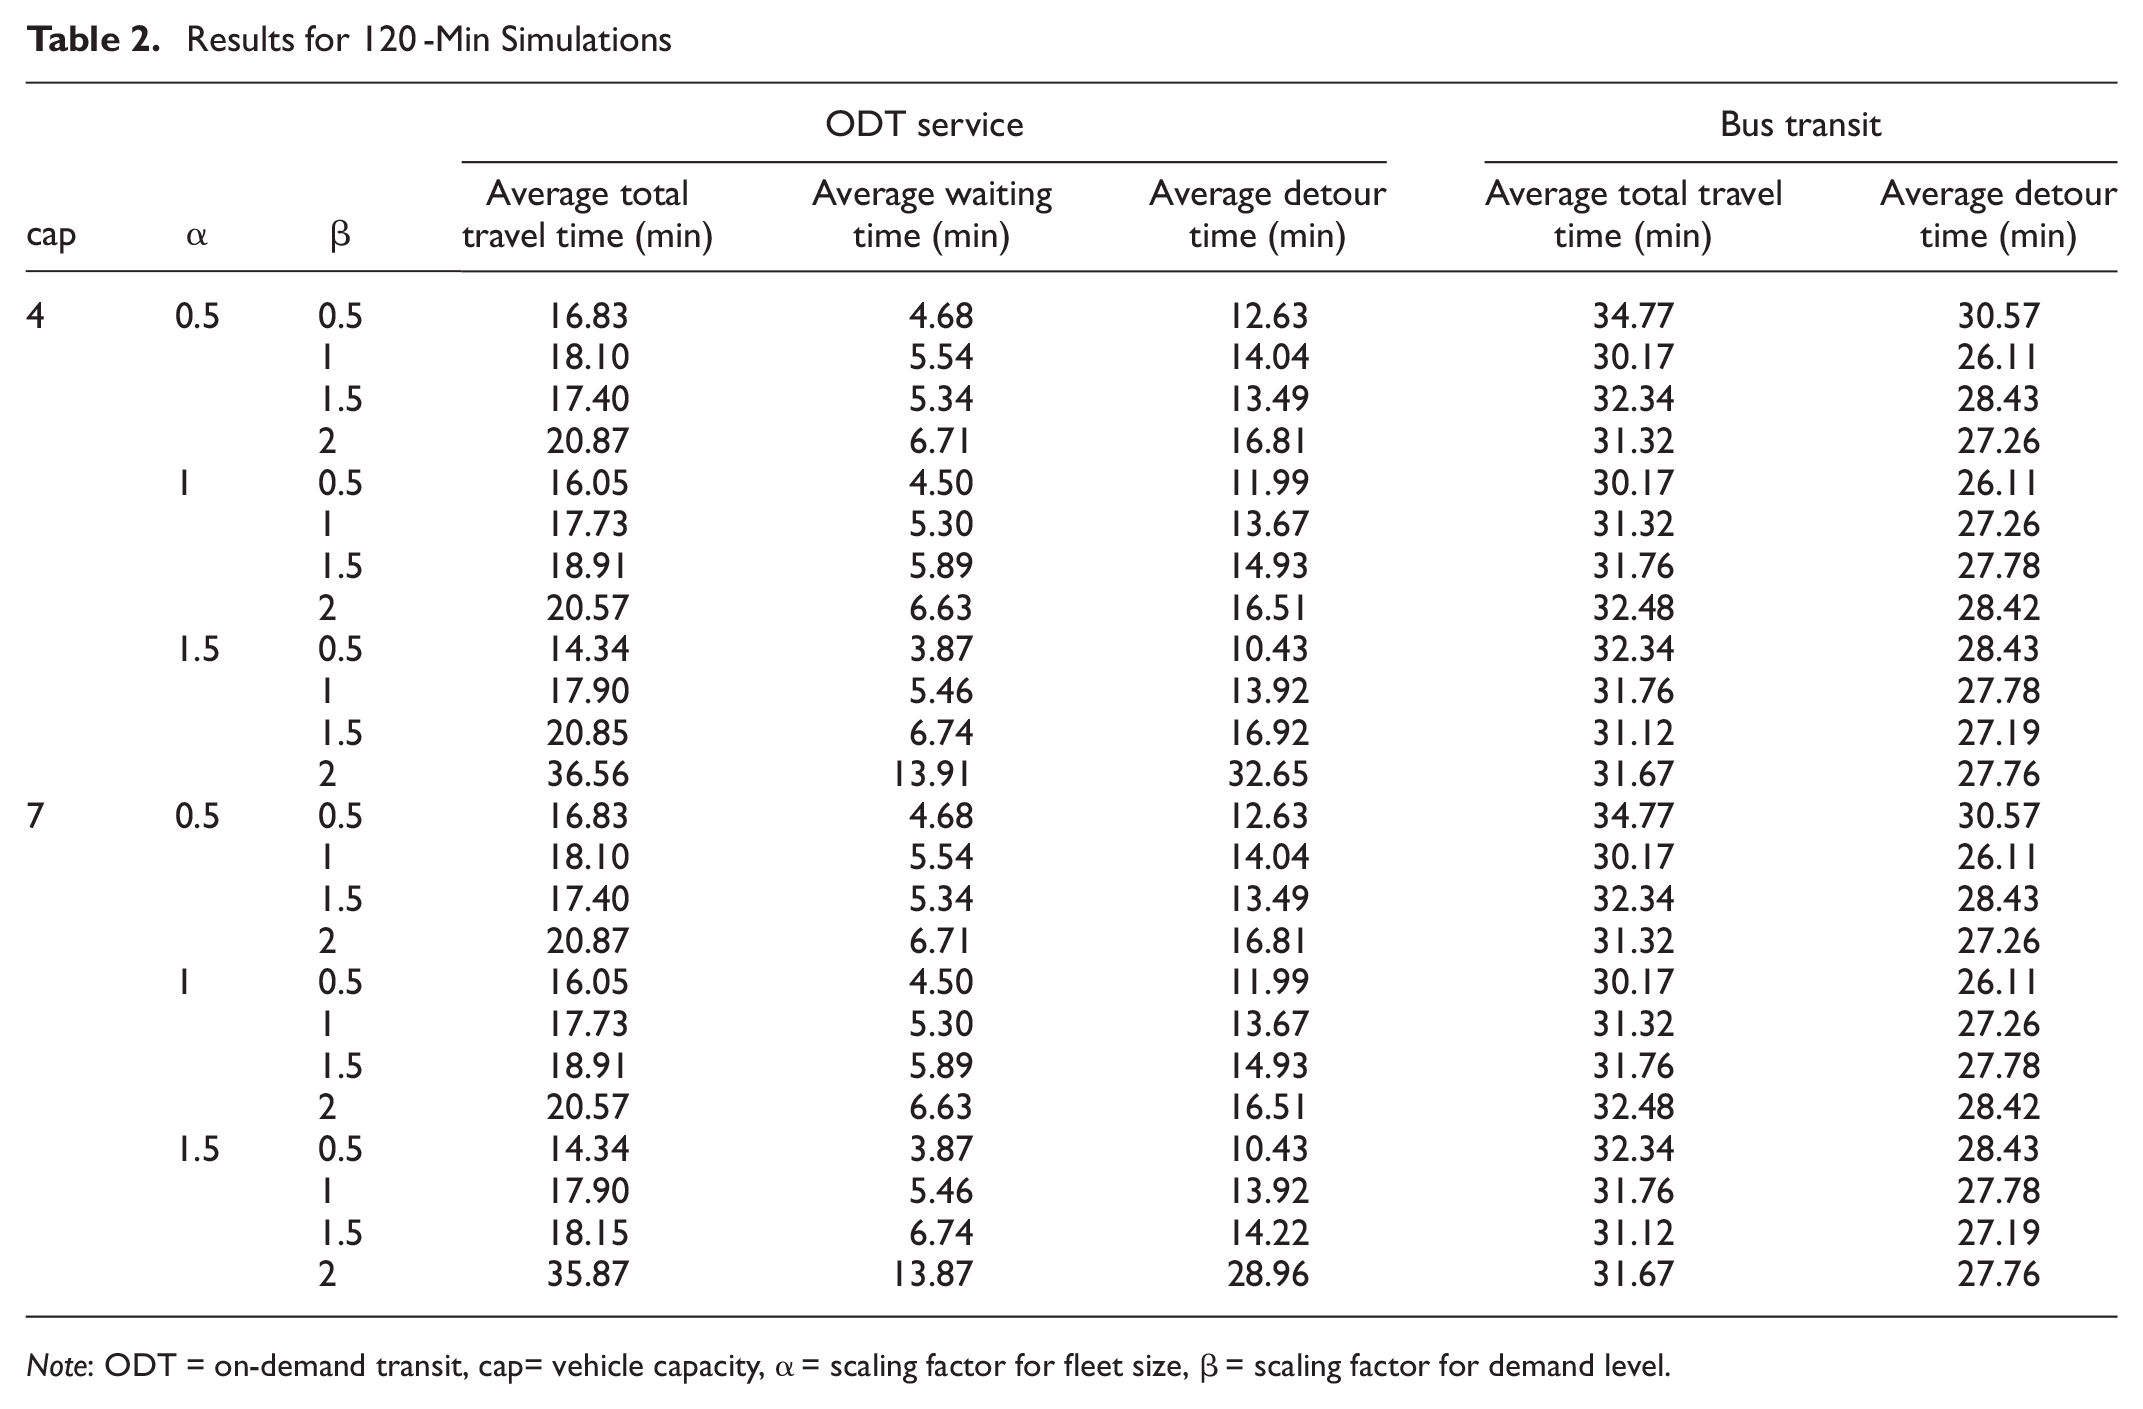
Note: ODT = on-demand transit, cap= vehicle capacity, α = scaling factor for fleet size, β = scaling factor for demand level.
According to Tables 1 and 2, the average total travel time in the ODT service is significantly shorter than that of the bus transit service. This significant difference was expected because, in bus transit, passengers may be required to change the bus lines, walk portions of the route to reach another bus stop, and wait for the bus. We assumed that passengers using bus transit in suburban areas check bus arrival time before going to the bus stop. Given this assumption, we considered an average waiting time of 3 min for bus transit users. In the ODT service, passengers benefit from significantly reduced total travel time compared with bus transit. Additionally, there is no need for transit changes, making it more convenient. Based on data provided by Google Maps for bus transit, our analysis revealed a noteworthy observation: the bus frequency between 8:00 and 9:00 a.m. is lower than that for the preceding hour, from 7:00 to 8:00 a.m. The reason for this discrepancy is the typical early morning departure pattern of suburban commuters. The majority of commuters start their journey early to ensure they arrive at their destination on time. According to the results, the availability of bus transit services varies significantly according to the time of day at which passengers commence their journeys.
As can be seen in Tables 1 and 2, with a fixed
In the simulation of the ODT service, two sets of scenarios with different vehicle capacities were considered: four and seven. According to the results, both sets of simulations showed a very slight difference in waiting times and total travel times in most scenarios. This shows that when the spatial and temporal distribution of passengers remain the same, utilizing vehicles with higher capacity necessarily cannot improve the level of service. Therefore, for planning purposes to run a new service, realizing the spatial and temporal distribution of the residents is crucially important. It can enhance the level of service for passengers while reducing the operating costs for transit agencies and urban planning organizations.
Additionally, we simulated a door-to-PTH service, in which passengers were assumed to be picked up from their homes, and compared it with ODT as well as with existing bus transit. The results for a fleet size of 50 with a capacity of four are presented in Table 3. According to the table, it is evident that waiting time and overall total travel time of the door-to-PTH scenarios are, as expected, higher than those for ODT services but lower than for bus transit.
Results for Door-to-PTH Simulation
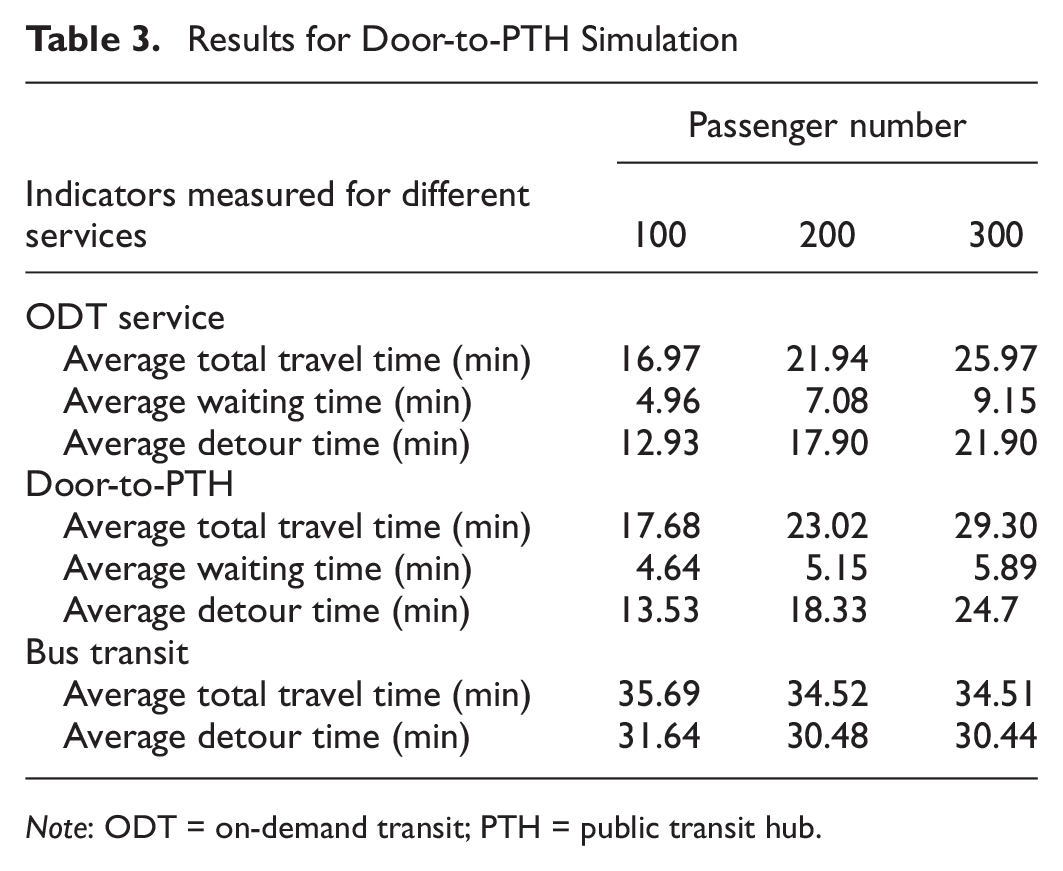
Note: ODT = on-demand transit; PTH = public transit hub.
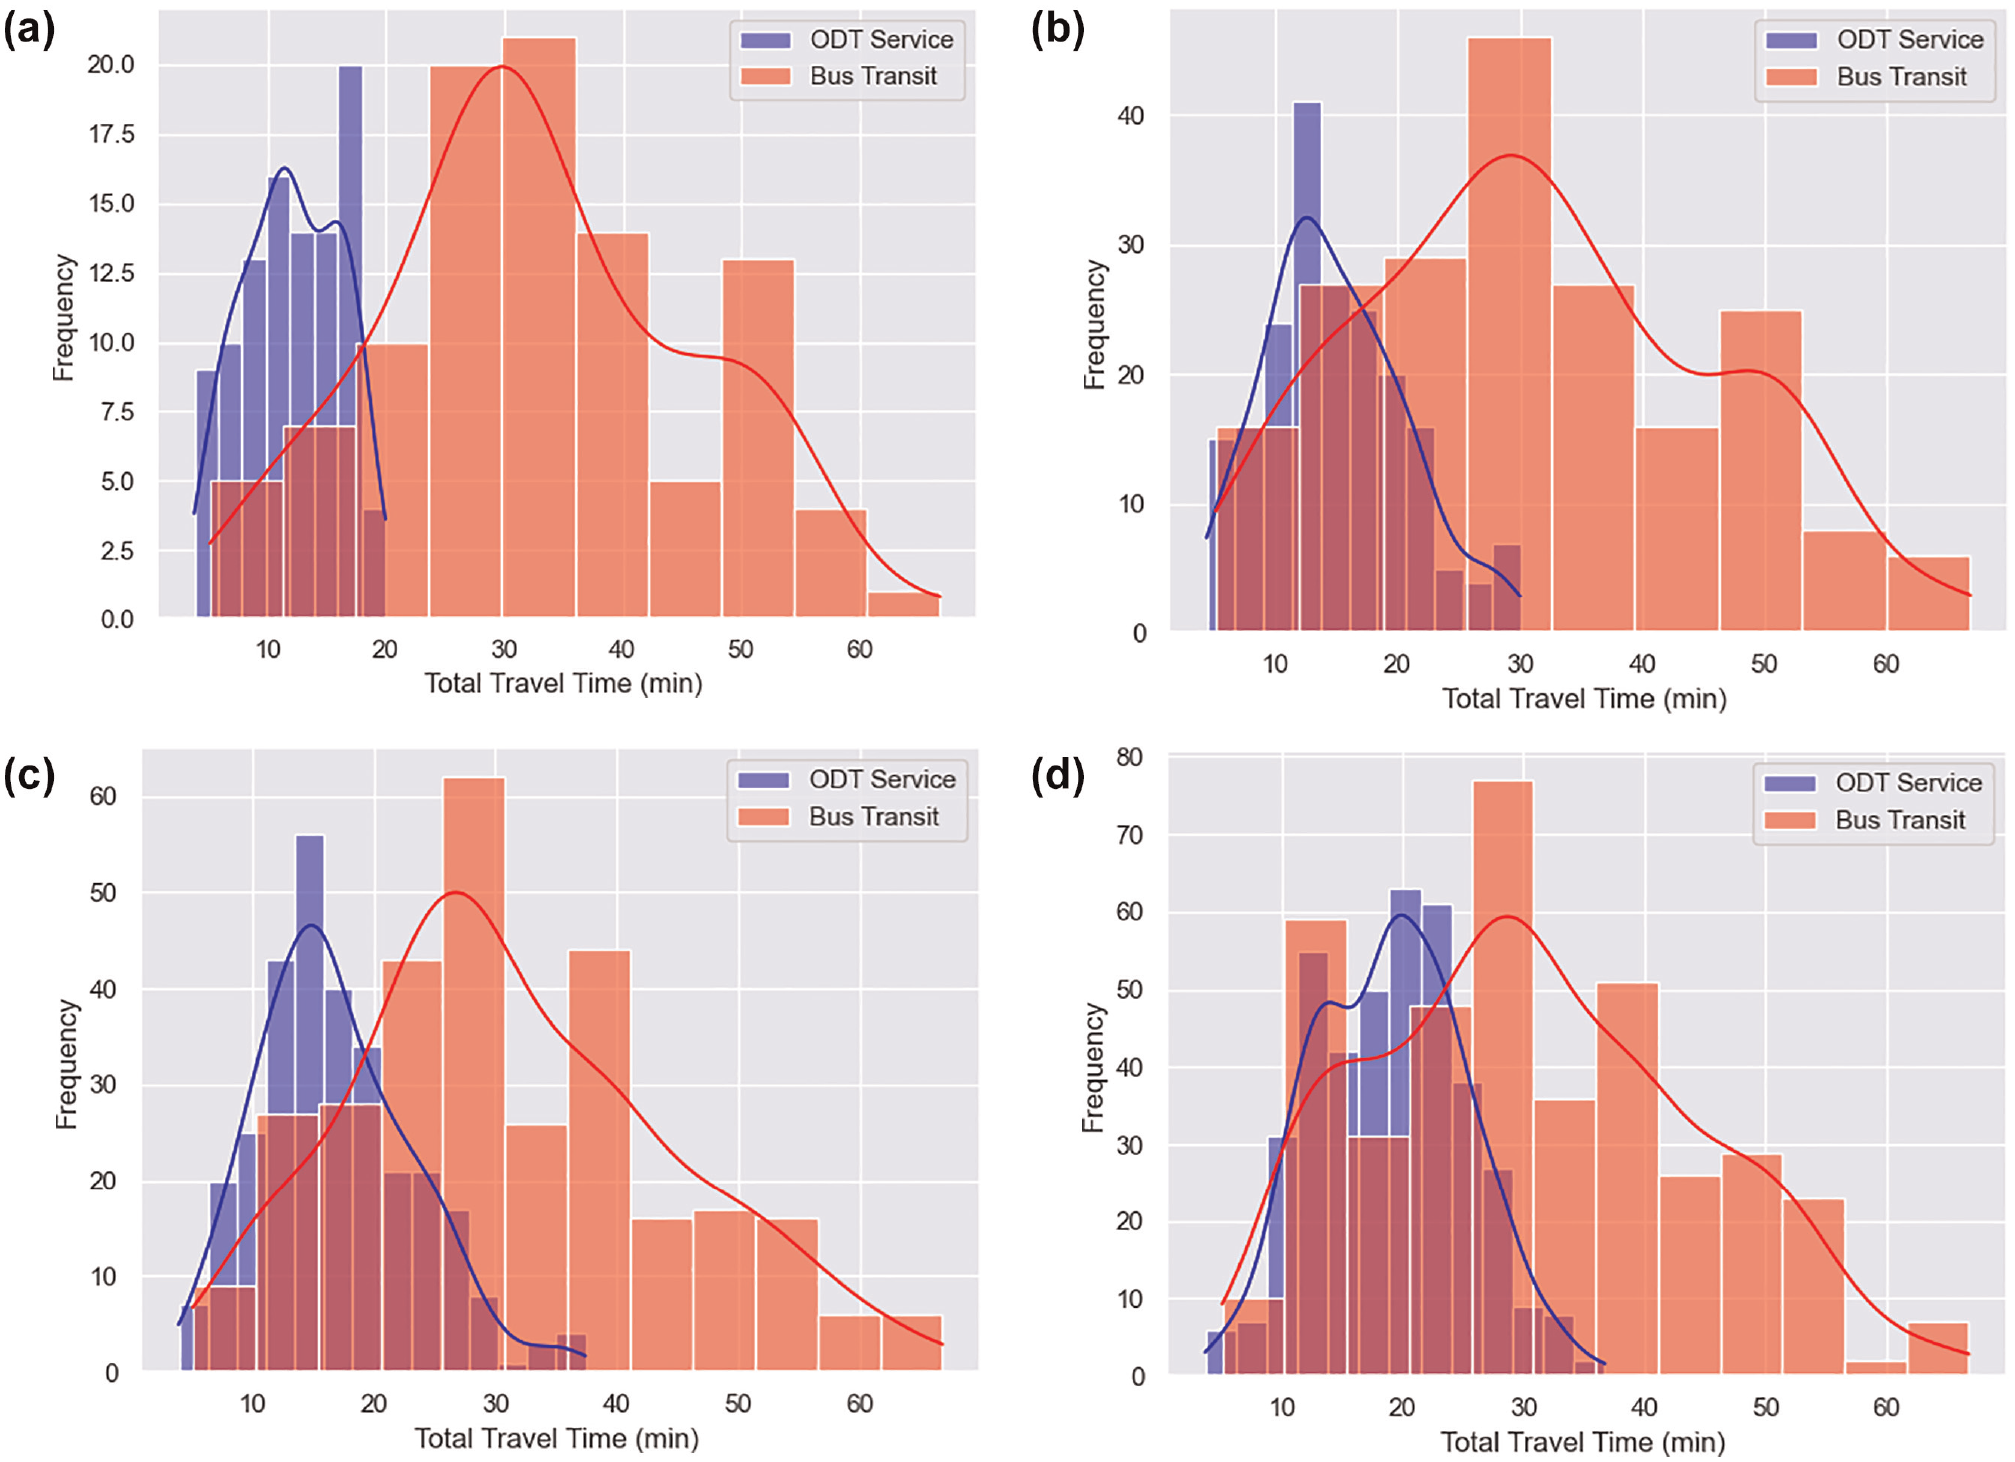
Based on a 60-Min simulation, Figures 4, 5, and 6 illustrate the distribution of total travel time for ODT services for fleet sizes of 25, 50, and 75 as well as for bus transit service. The plots demonstrate that as passenger numbers increase, the distribution for ODT services becomes skewed to the right, indicating longer travel times. Moreover, for a fixed demand level in the ODT service, increasing fleet size leads to a skewing of the distribution to the left. Comparisons between Figures 4b and 5a as well as Figures 5c and 7b illustrate this. In each case, the passenger number is the same with different fleet sizes. In contrast, the total travel time for the bus transit is relatively consistent. Considering that bus transit plans are not subject to daily fluctuations in passenger numbers, this stability should be expected.
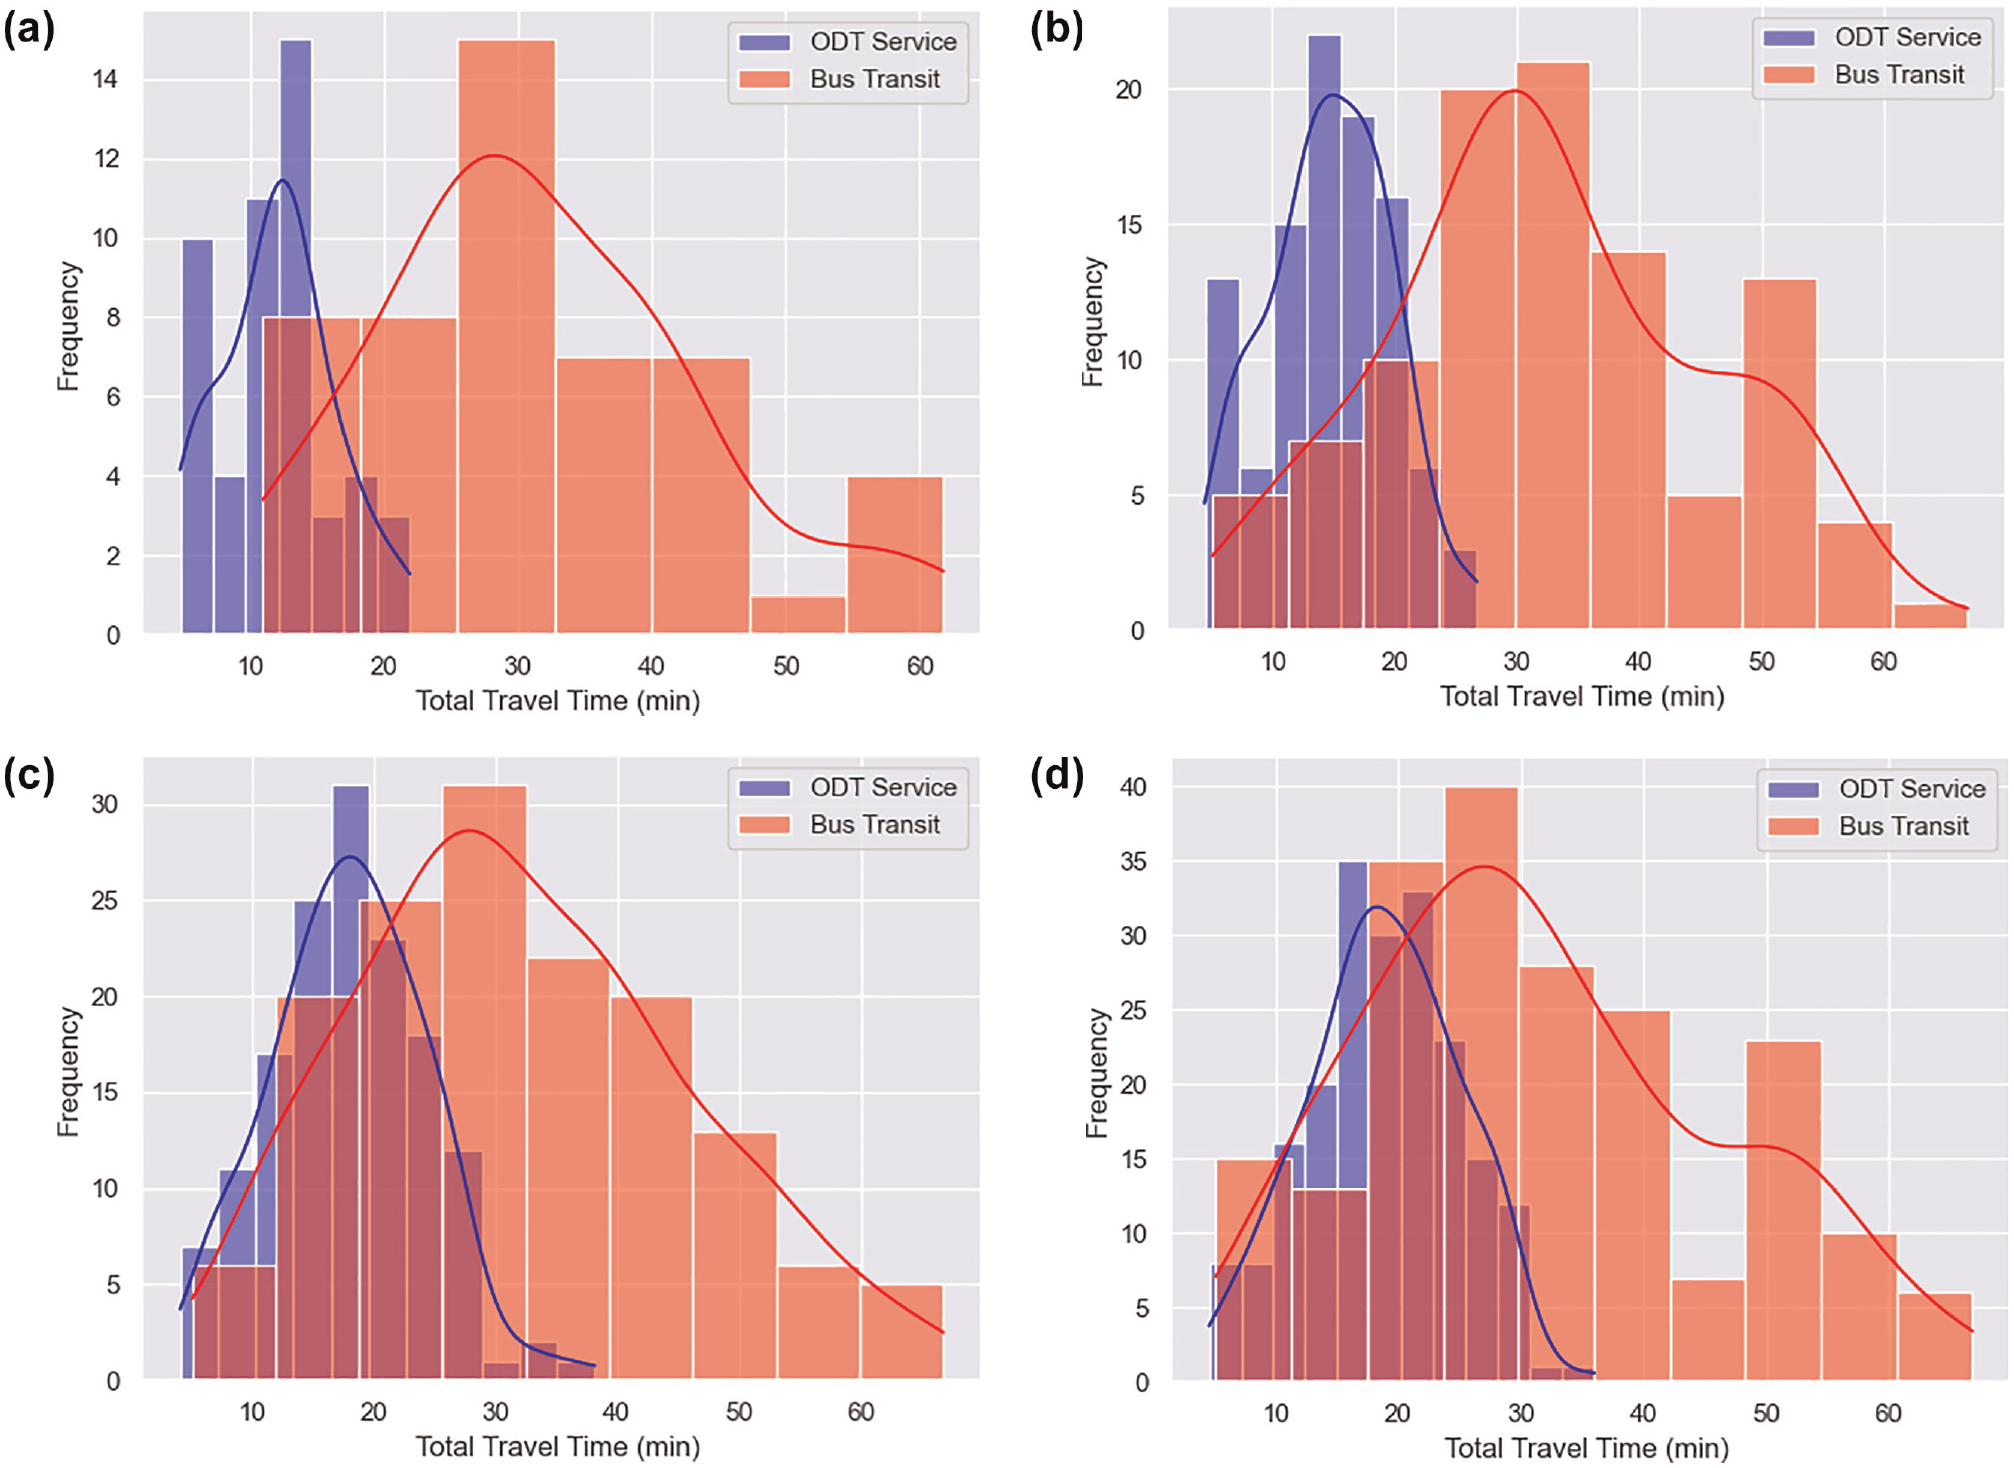
Comparison of total travel time distribution for on-demand transit (ODT) service versus bus transit with a fleet size of 25 in a 60-min scenario: (a) Number of passengers = 50. (b) Number of passengers = 100. (c) Number of passengers = 150. (d) Number of passengers = 200.
Comparison of total travel time distribution for on-demand transit (ODT) service versus bus transit with a fleet size of 50 in a 60-min scenario: (a) Number of passengers = 100. (b) Number of passengers = 200. (c) Number of passengers = 300. (d) Number of passengers = 400.
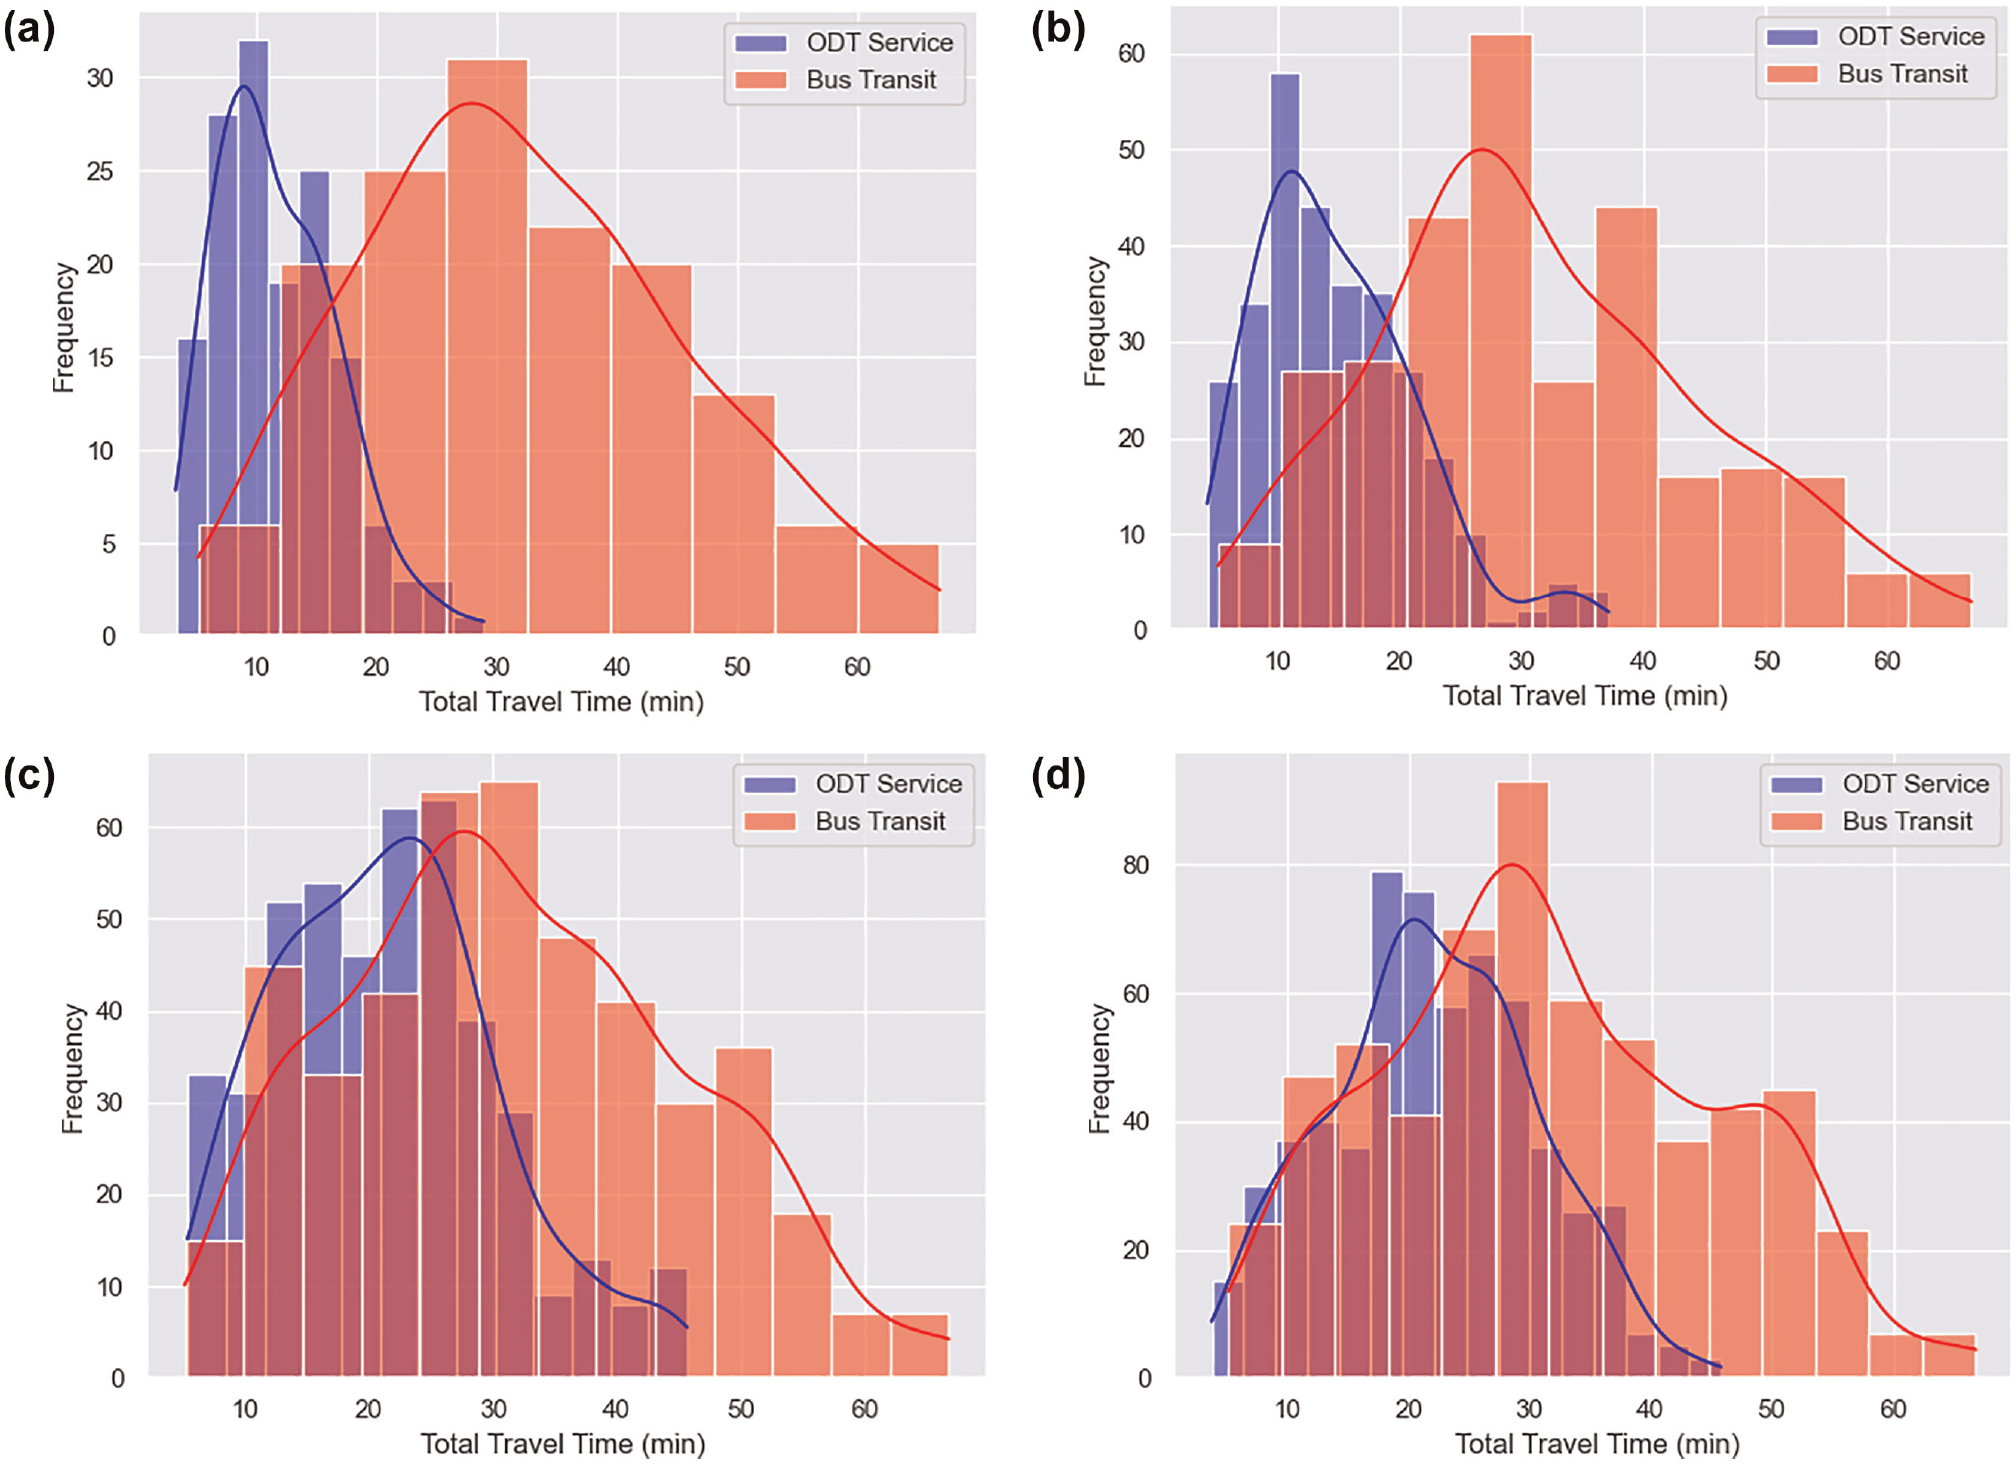
Comparison of total travel time distribution for on-demand transit (ODT) service versus bus transit with a fleet size of 75 in a 60-min scenario: (a) Number of passengers = 150. (b) Number of passengers = 300. (c) Number of passengers = 450. (d) Number of passengers = 600.
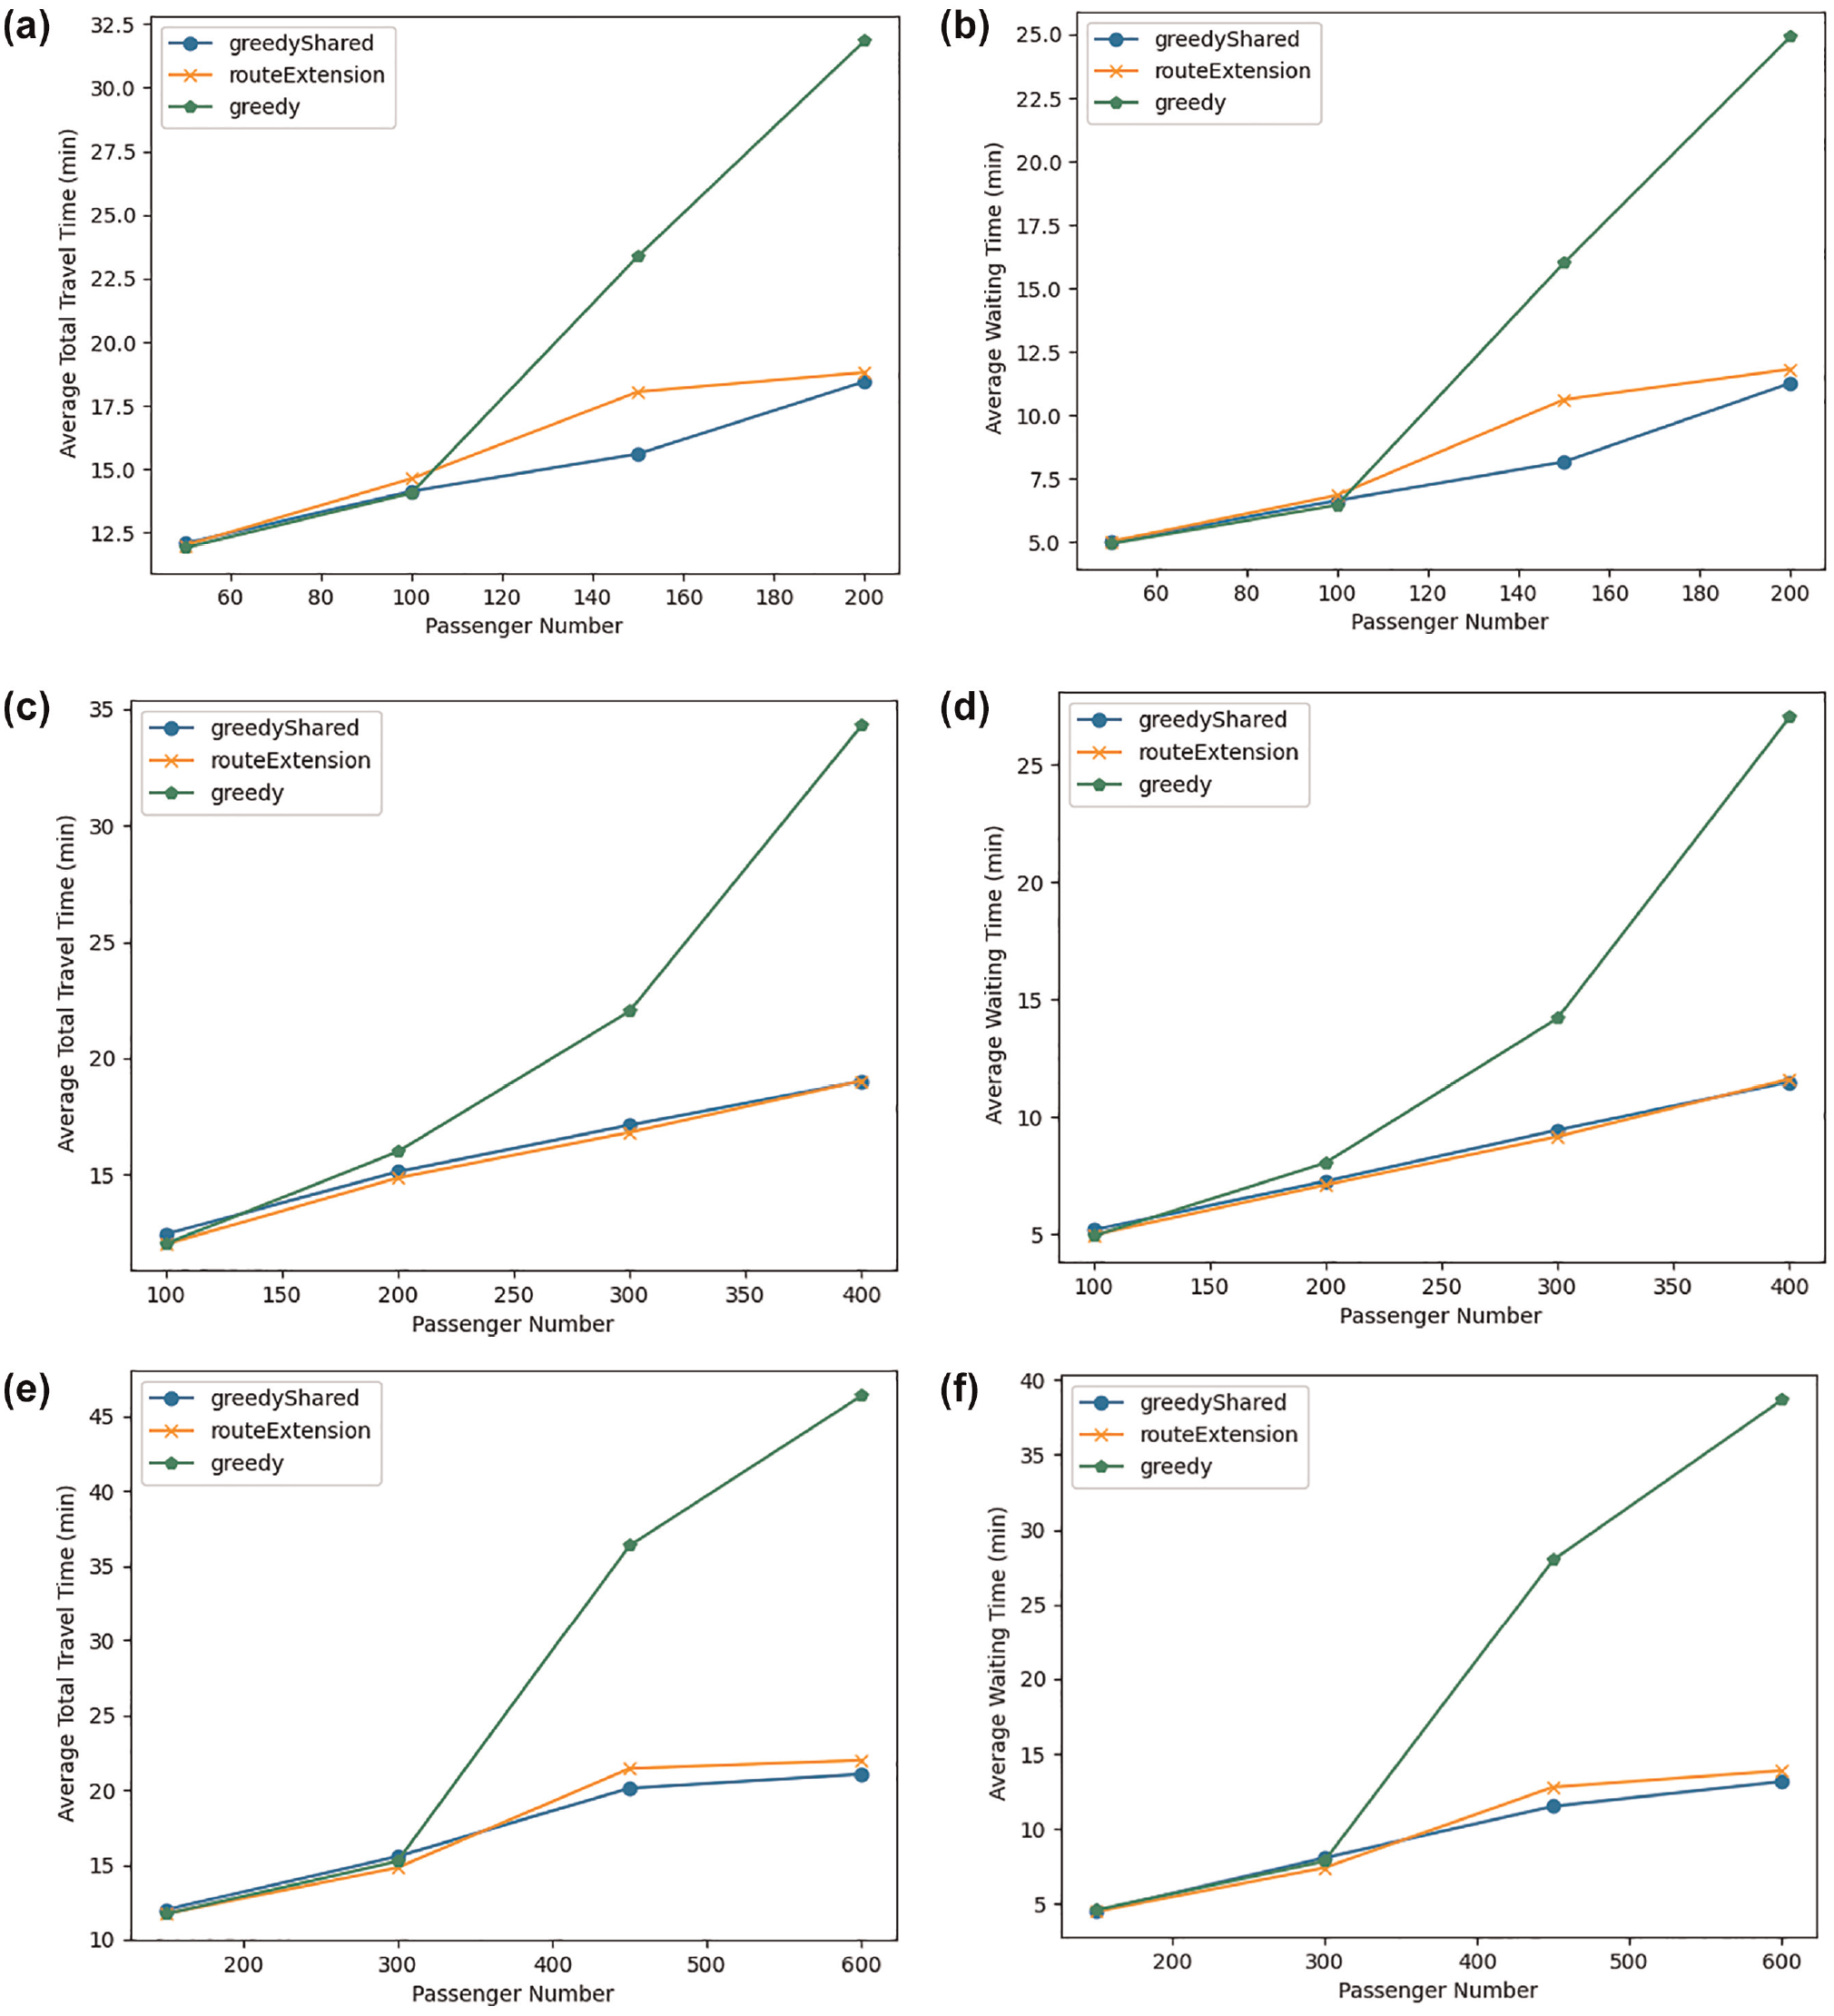
Comparison of average total travel time (a) and average waiting time (b) for “greedy,”“greedyShared,” and “routeExtension” algorithms in a 60-min scenario: (a) Fleet size = 25. (b) Fleet size = 25. (c) Fleet size = 50. (d) Fleet size = 50. (e) Fleet size = 75.(f) Fleet size = 75.
Figure 7 showcases the average total travel time and waiting time for different SUMO ride-matching algorithms, including “greedy,”“greedyShared,” and “routeExtension” for a 60-min scenario. When the number of passengers is small, all three algorithms behave similarly, but as the number of passengers increases, the “greedy” algorithm becomes less efficient. The rationale behind this lies in the design of “greedyShared” and “routeExtension,” which are specifically tailored to manage shared services. As a result, they are more advantageous when the demand level is high because they can serve more than one passenger simultaneously. In contrast, the “greedy” algorithm allocates each passenger to a single vehicle based on the closest travel time, serving only one passenger at a time. In comparing “greedyShared” and “routeExtension,” there is no obvious difference in performance, as they both behave similarly even when the number of passengers increases.
In Figure 8, it can be seen that, for a fixed number of passengers, the distribution of route length traveled by vehicles becomes more skewed to the left as the fleet size increases. The reason for this is that with a larger fleet size, more vehicles are available to serve the same number of passengers, causing the vehicles to have a preference for shorter routes, contributing to skewing the distribution of route lengths to the left. As a result, determining an optimal fleet size becomes critical in various scenarios, as it can result in increased efficiency, improved service quality, reduced congestion, and a reduction in environmental impact.
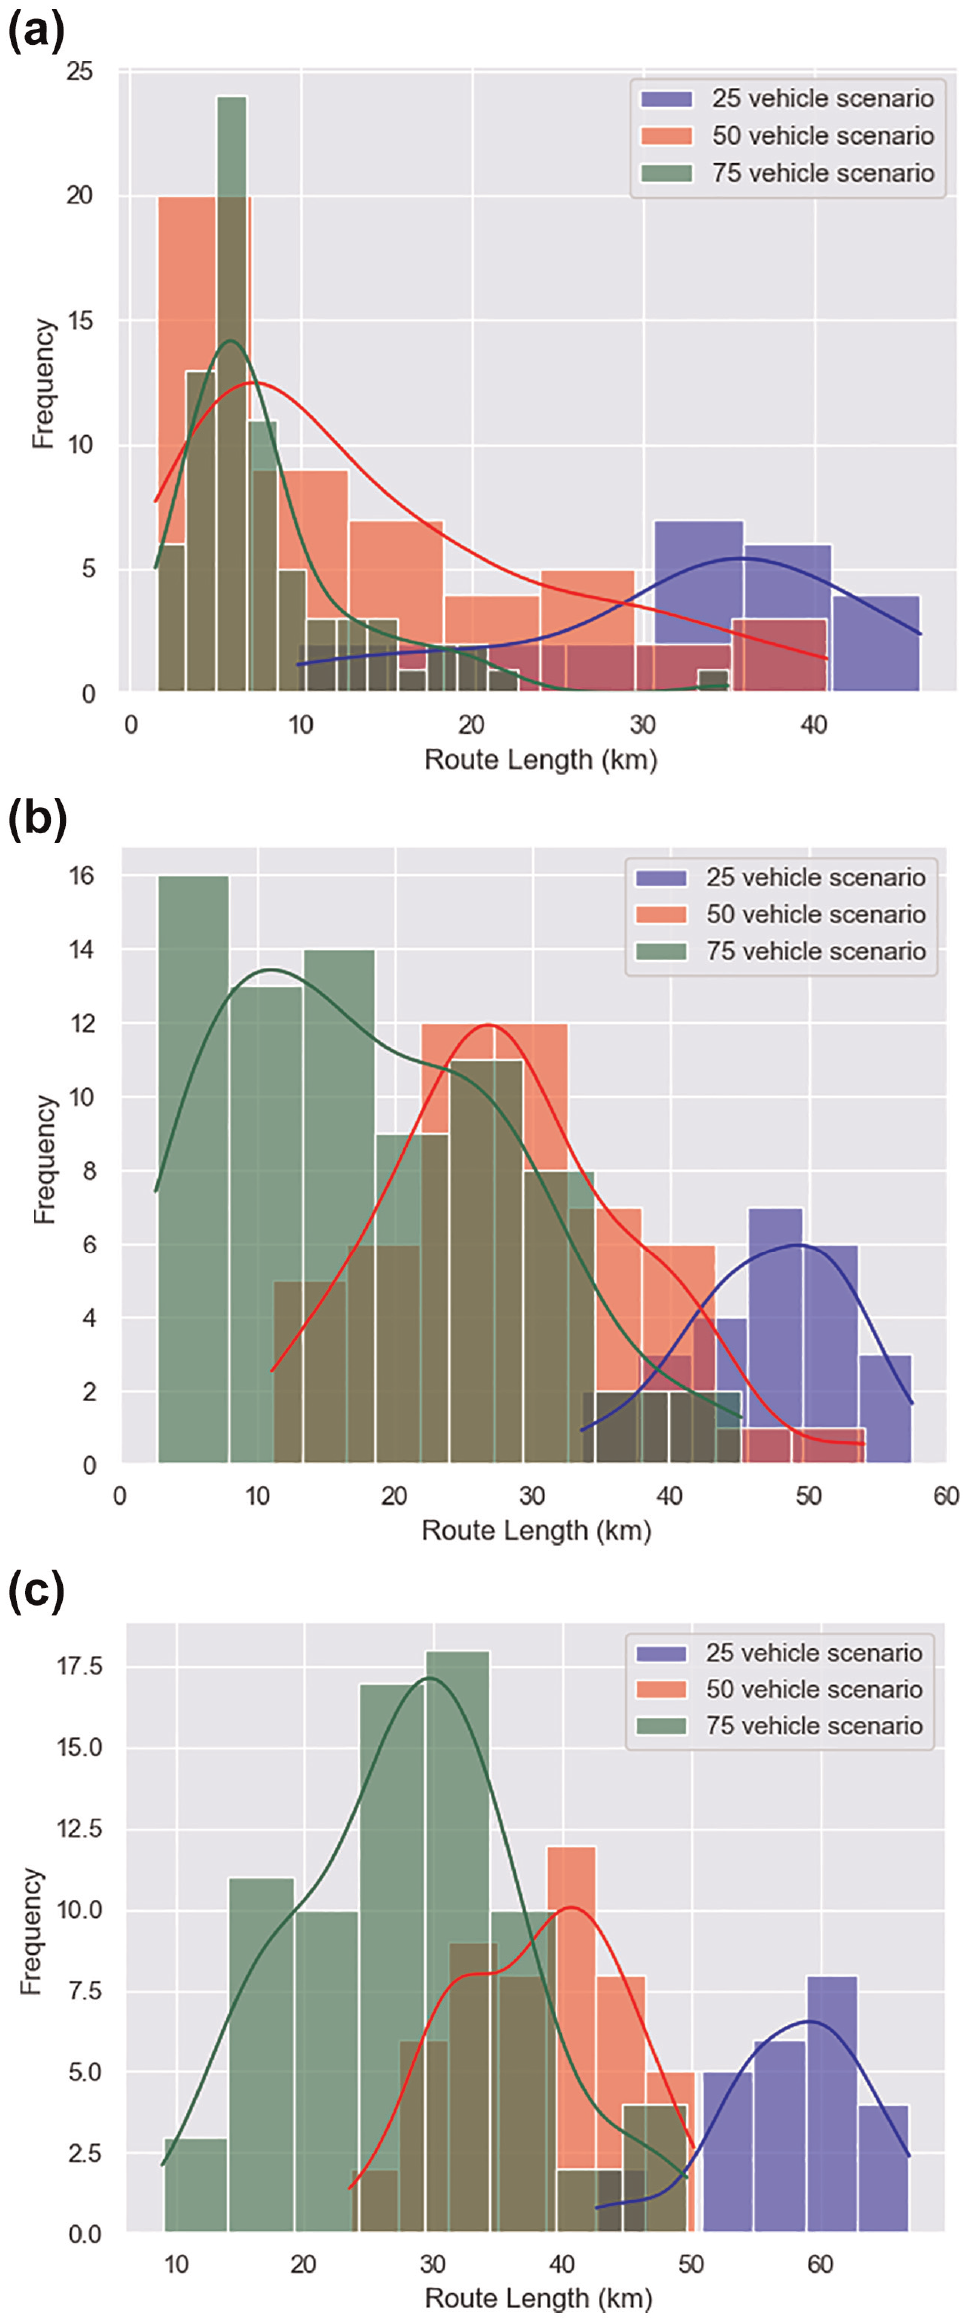
Route length distribution for different fleet size and demand level: (a) Passenger number = 100. (b) Passenger number = 200. (c) Passenger number = 300.
Conclusion
This study introduced a novel framework for ODT services, for which simulations were then applied to address the first-mile problem in suburban areas, where there is only a single PTH. The proposed framework uses smart devices (SCiNes) installed at bus stops that are equipped with an edge-computing functionality. Moreover, they are capable of transmitting data and providing passengers with real-time information. Passengers are required to request their rides through SCiNes at bus stops. This local communication between passengers and SCiNes eliminates the need for mobile phones or applications.
To simulate the proposed ODT service, we implemented it in the SUMO simulation environment. Terrebonne, a suburb of Montreal, Canada, was chosen as the study area. To assess the performance of the ODT service, it was compared with the existing bus transit service in Terrebonne as well as a door-to-PTH service. Google API was used to obtain travel times associated with the current bus transit service. Moreover, to capture the impact of different parameters and variables on service performance, different scenarios were created by varying demand levels, fleet sizes, fleet capacity, study periods, and dispatching algorithms. Different indicators were measured, including passenger wait time, total travel time, and detour time.
The simulation results suggest that the ODT service showed a significant reduction in total travel time compared with the bus transit service. For instance, at the normal demand level
We expect that this study will be useful for the design and operations of ODT services in areas with low population density. Moreover, the proposed service could be useful for the first-mile problem in both urban and suburban areas, where the number of destinations is limited.
One of the limitations of this study is the lack of access to actual transit use data for Terrebonne. Having access to such data would help to better parametrize the simulations and lead to more realistic scenarios.
There are several potential directions for future research. The data we used in this study were based on simulated data. Utilizing real-world data on the spatial and temporal distribution of passengers across the network enables the testing of more informative scenarios, yielding results that are easily usable for policymakers and transit planners. Moreover, the smart devices at the core of this system have many capabilities and potential, not all of which are discussed here, that could be used to develop additional scenarios or ODT system functionalities. Exploring these capabilities would offer very interesting research opportunities that can be evaluated within the simulation environment. For example, a fully distributed system could be developed based on these smart devices that could participate in dispatching passengers and assigning vehicles. Such services have the potential to be highly scalable and efficient, especially in congested networks in which thousands of passengers need to be dispatched during a very short period of time.
Footnotes
Acknowledgements
The authors express sincere gratitude to BusPas, Inc., for their unwavering support and commitment to this research endeavor. The invaluable assistance they provided played a pivotal role in the success and advancement of this project.
Author Contributions
The authors confirm contribution to the paper as follows: study conception and design: Seyed Mehdi Meshkani, Siavash Farazmand, Nizar Bouguila, and Zachary Patterson; data collection: Seyed Mehdi Meshkani, Siavash Farazmand; analysis and interpretation of results: Seyed Mehdi Meshkani, Siavash Farazmand, Nizar Bouguila, and Zachary Patterson; draft manuscript preparation: Seyed Mehdi Meshkani, Siavash Farazmand, Nizar Bouguila, and Zachary Patterson. All authors reviewed the results and approved the final version of the manuscript.
Declaration of Conflicting Interests
The author(s) declared no potential conflicts of interest with respect to the research, authorship, and/or publication of this article.
Funding
The author(s) disclosed receipt of the following financial support for the research, authorship, and/or publication of this article: This research was supported by Mitacs Accelerate Program project IT18048 with BusPas, Inc., of Montreal.