
Abstract
The objective of this research was to develop guidance for improving safety at mobile operations on two-lane roadways. One of the most significant hazards to workers performing mobile operations is unpredictable driver behavior around the operation (including poor passing decisions). Researchers observed 1,209 passing maneuvers at 17 different mobile operations in Texas and Minnesota, U.S., to better understand driver behavior around mobile operations. An analysis of the passing maneuver data showed that 449 passing maneuvers were made by drivers who were not first in the queue of vehicles behind the mobile operation. These passing maneuvers were considered undesirable because they indicate some degree of driver impatience. Researchers analyzed the amount of time each driver spent in the queue and found that nearly 50% of drivers who waited in the queue for 4 min or longer attempted an undesirable passing maneuver. This increased to nearly 85% when wait times exceed 6 min. As a result of the field studies, the researchers recommended that transportation agencies strive to avoid creating situations where drivers in queue must follow a mobile operation for several minutes without opportunities to pass. When these delays cannot be avoided, the work crew may need to pull over and allow vehicles to pass. If there are no suitable pullover locations, a stationary work zone with positive traffic control methods (e.g., flaggers, portable signals) should be considered.
Keywords
Mobile operations on two-lane roadways present unique challenges to transportation agencies, not the least of which is the highly variable conditions encountered in the field. Transportation agencies are therefore challenged with developing temporary traffic control (TTC) procedures that ensure safe and effective operations under a variety of conditions.
Researchers performed a literature search and reviewed mobile operation guidance from state transportation agencies in the U.S. to identify practices for performing mobile operations on two-lane roadways. As a result, researchers found 71 typical applications for various mobile operations that provided more specific guidance than what is provided in the Manual on Uniform Traffic Control Devices ( 1 ). The enhanced guidance for mobile operations included criteria for duration of work, speed of the convoy (or work advancement), type of work being performed, duration of intermittent stops, number and spacing of work vehicles, use of arrow boards, use of changeable message signs, use of supplemental warning signs, use of traffic cones, presence of sight obstructions, traffic volume, and control of passing maneuvers.
In addition, researchers conducted ten focus groups in four states (Montana, Ohio, Texas, and Virginia, U.S.) which consisted of over 128 transportation practitioners (including transportation agency design, construction, and maintenance personnel, county and local transportation personnel, work zone safety professionals, and TTC product vendors). The goal of the focus groups was to identify specific mobile operation challenges. Participants consistently cited unpredictable driver behaviors (including poor passing decisions) as a major concern to workers. Details for the literature search, state guidance, and focus groups can be found in the research project report ( 2 ).
Based on the problem identification outcomes, researchers conducted field studies of passing maneuvers around mobile operations. This paper presents the methodology and results of those field studies, along with recommendations to improve TTC procedures for mobile operations on two-lane roadways.
Methodology
Researchers worked with various state transportation agencies to identify mobile operations on two-lane roadways where field data could be collected. Texas Department of Transportation (TxDOT) and Minnesota Department of Transportation (MnDOT) provided opportunities for researchers to collect field data at 17 mobile operation sites. At each data collection site, researchers used a standardized data collection form to document the roadway number, direction, beginning and ending points for the planned work, the posted speed limit, and other relevant information about the data collection process. At three sites, the work activity was installation of preformed tape centerline rumble strips, eight sites involved herbicide spraying, and six sites involved striping of centerlines and edgelines.
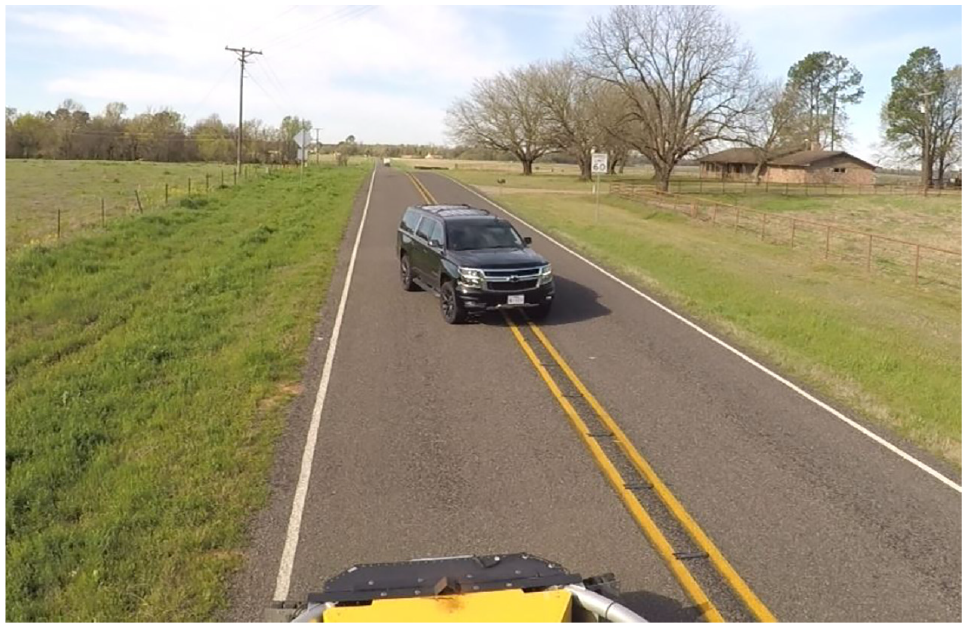
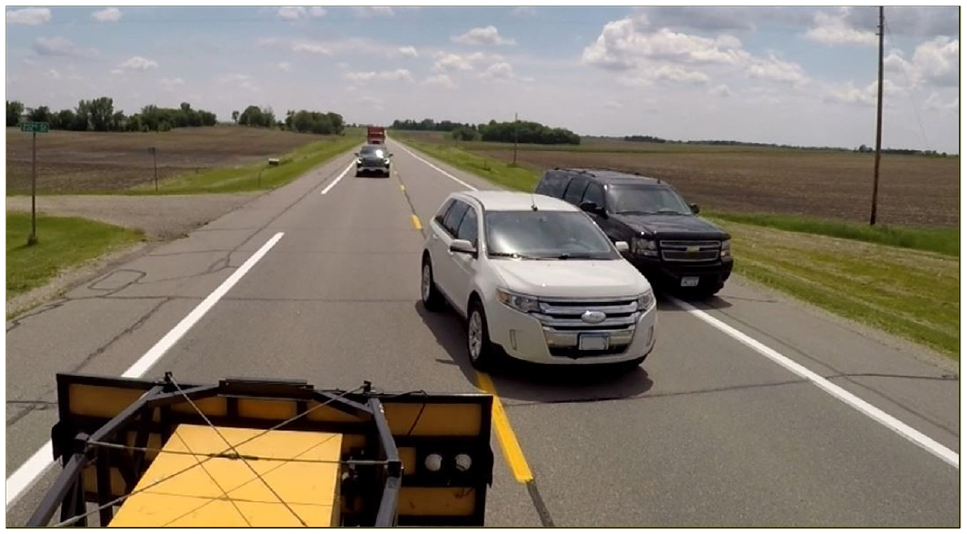
At each study site, researchers used two truck-mounted cameras to record traffic movements around the mobile operations. One camera was mounted in a forward-facing position on the leading vehicle in the convoy. The mounting location varied depending on the type of vehicle in use. Figure 1 shows the leading vehicle camera view at one of the sites. A second camera was mounted in a rear-facing position on the trailing vehicle, which was always an attenuator truck. Figure 2 shows the trailing vehicle camera view at one of the sites.
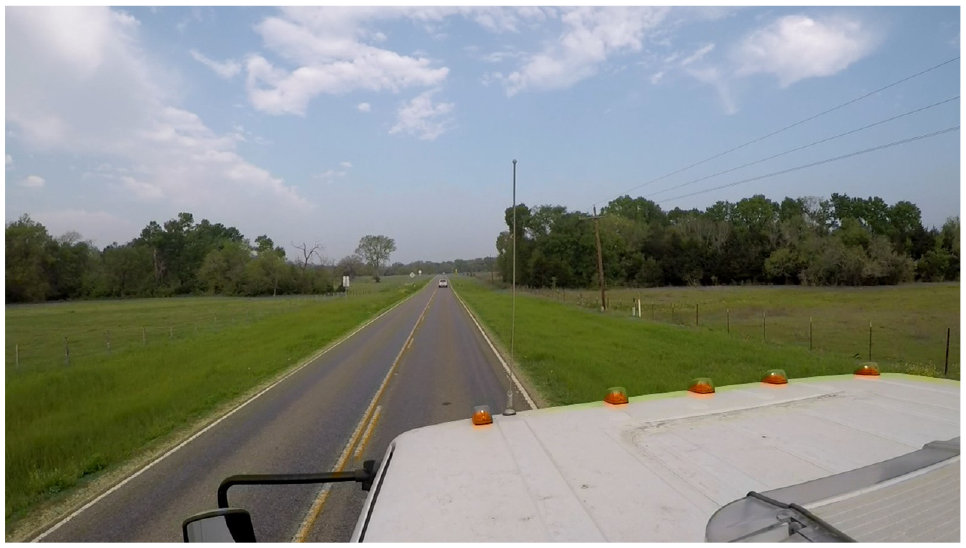
Leading vehicle camera view.
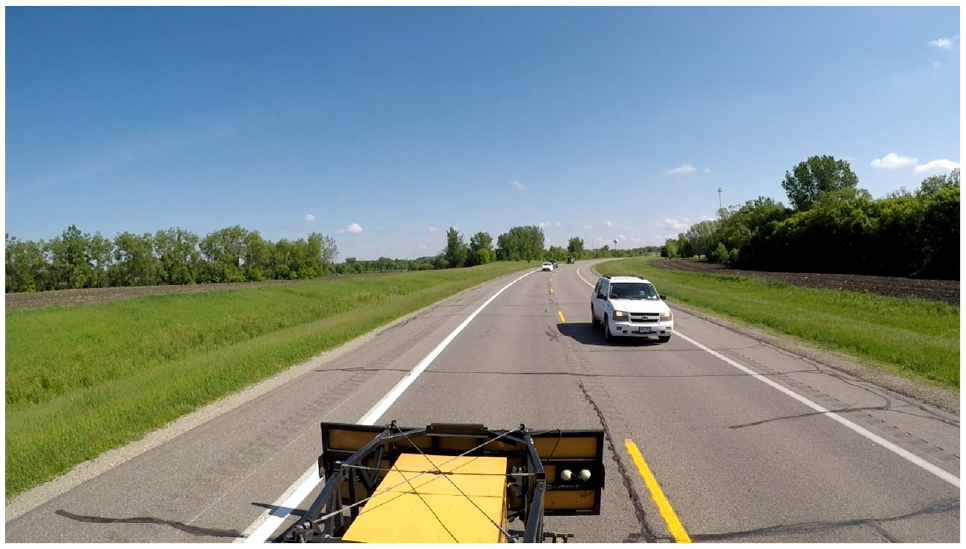
Trailing vehicle camera view.
Both cameras were global positioning system (GPS)-enabled and continuously recorded location data with the coordinated universal time (or Zulu time) for each video. Researchers used an online telemetry extractor to download the timestamp, location, and speed data for each camera at each site. Timestamps were converted to local time, and speeds were converted to miles per hour (mph). Table 1 shows an example of the extracted data.
Example of Telemetry Data Extracted From Video Files
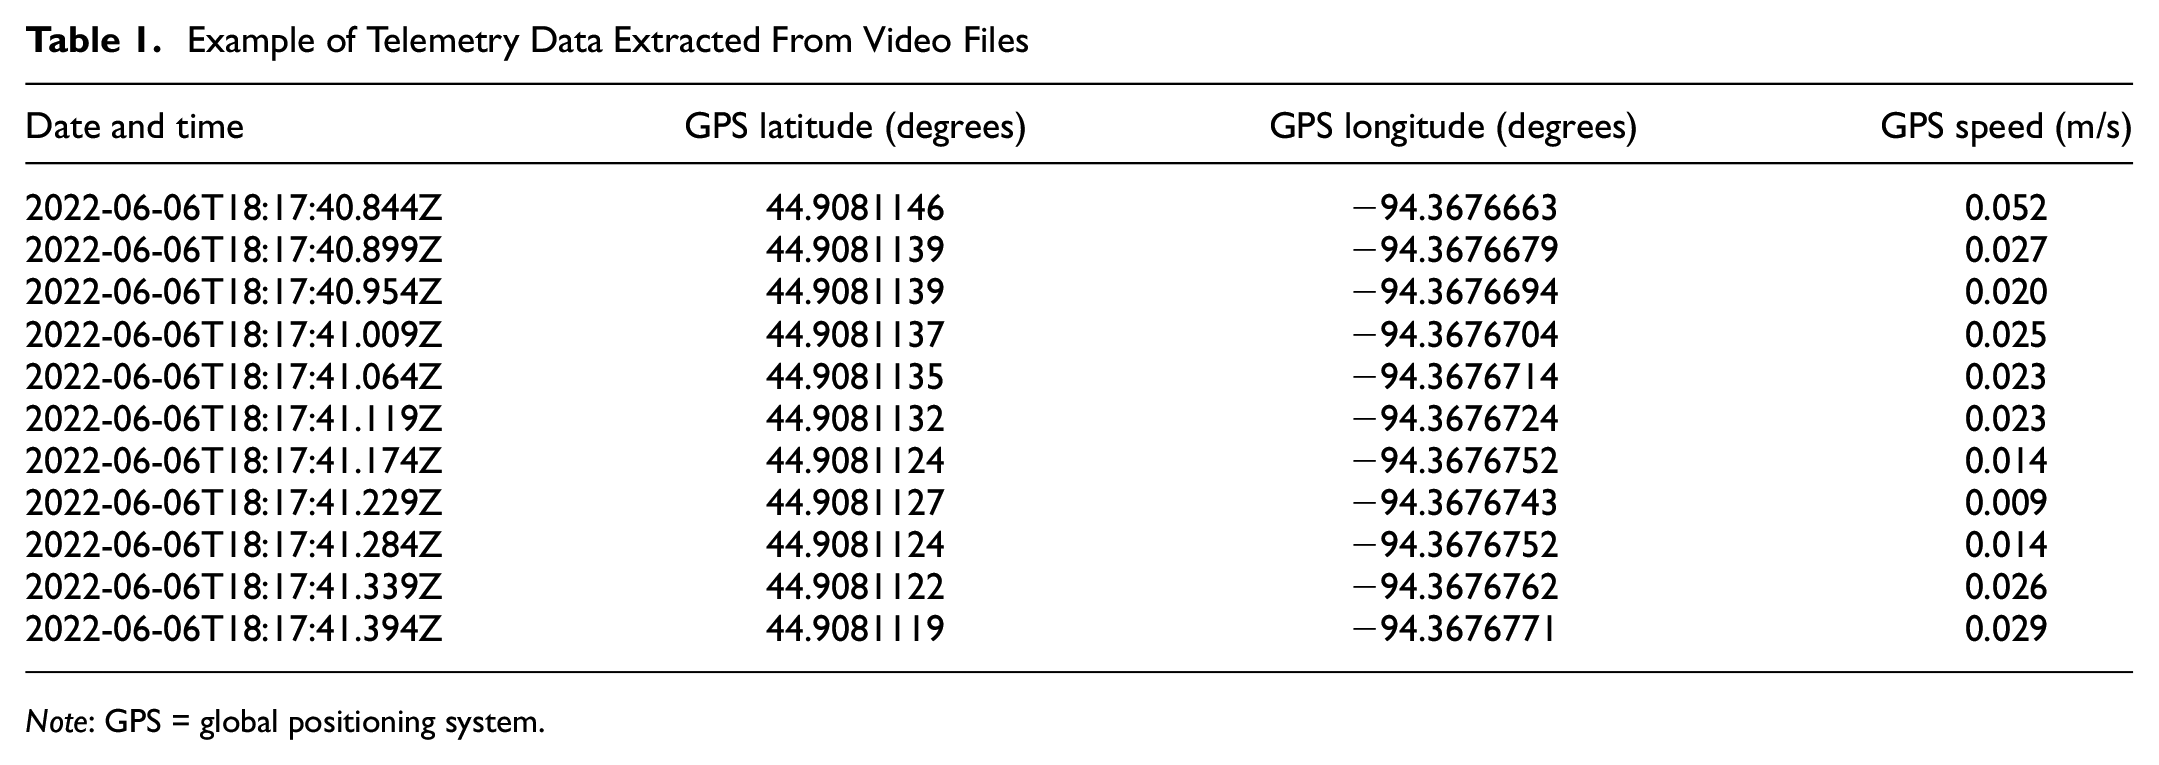
Note: GPS = global positioning system.
Rumble Strip Installation Operations
The work activity performed at three sites was the installation of preformed tape rumble strips on the centerline of rural two-lane roadways. The work convoy consisted of four work vehicles and two workers on foot, as shown in Figure 3. The lead vehicle was a red service truck, followed by a material-dispensing vehicle (from which workers applied the adhesive and tape strips onto the centerline). A pair of workers on foot then used tamping devices to push the tape strips down into the adhesive. One attenuator truck followed the workers on foot closely to provide protection from errant vehicles. A second attenuator truck followed behind as the trailing vehicle, periodically lagging behind to provide advance warning to drivers in areas of limited sight distance. The maximum speed of the material dispensing vehicle was approximately 8 mph, but the workers on foot ultimately controlled the speed of the convoy. The adhesive reservoir had to be refilled after approximately 2 mi of application, so the convoy made periodic stops for this planned replenishment. Because the sites did not have improved shoulders, the convoy always remained in the travel lane while stopped.
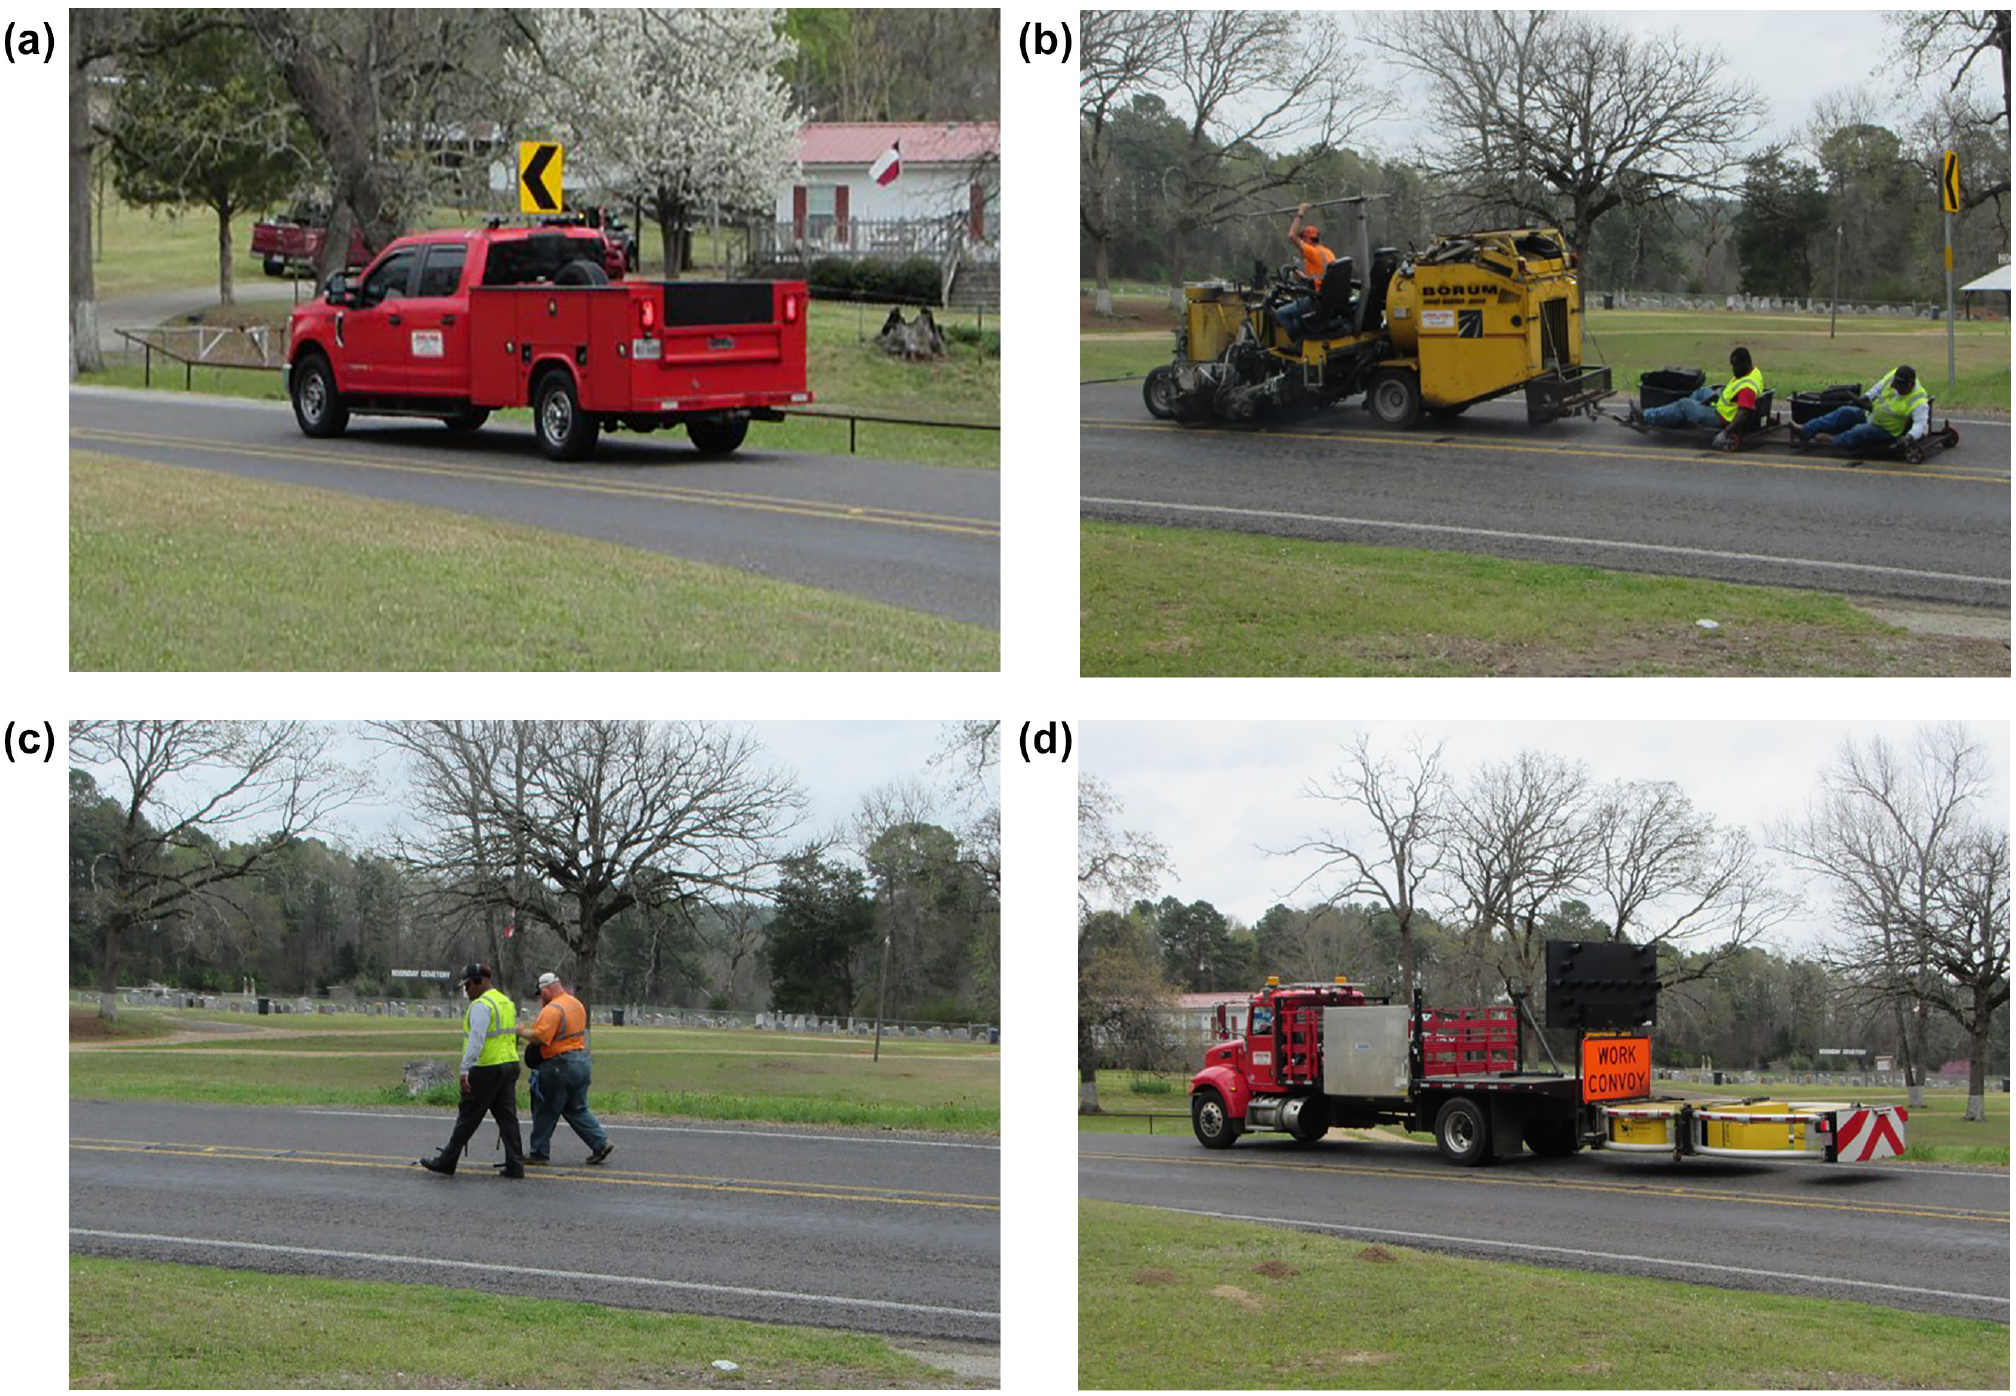
Rumble strip installation convoy: (a) Leading vehicle; (b) Preformed tape placement; (c) Preformed tape tamping; (d) one of two attenuator trucks.
Table 2 summarizes the data collected at the sites where rumble strips were installed. Traffic volumes in both directions (collected by researchers during the operations) were low, and long gaps in the opposing traffic were available. The terrain was rolling, with many horizontal and vertical curves in the roadway alignment; thus, there were high percentages of no passing zones at all three sites. Passing zone location data were documented from the videos, and researchers calculated the percent of no passing zones in the direction of the operation for each site.
Rumble Strip Installation Data Collection Summary
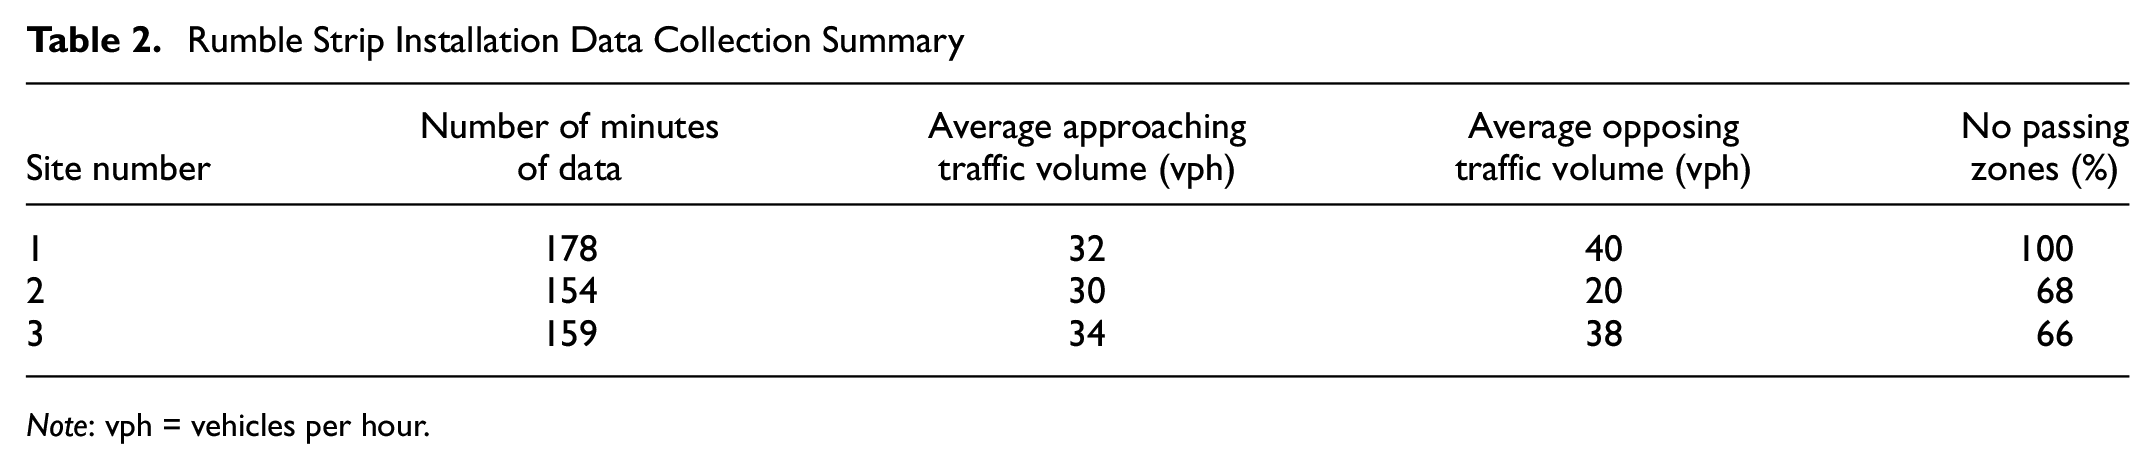
Note: vph = vehicles per hour.
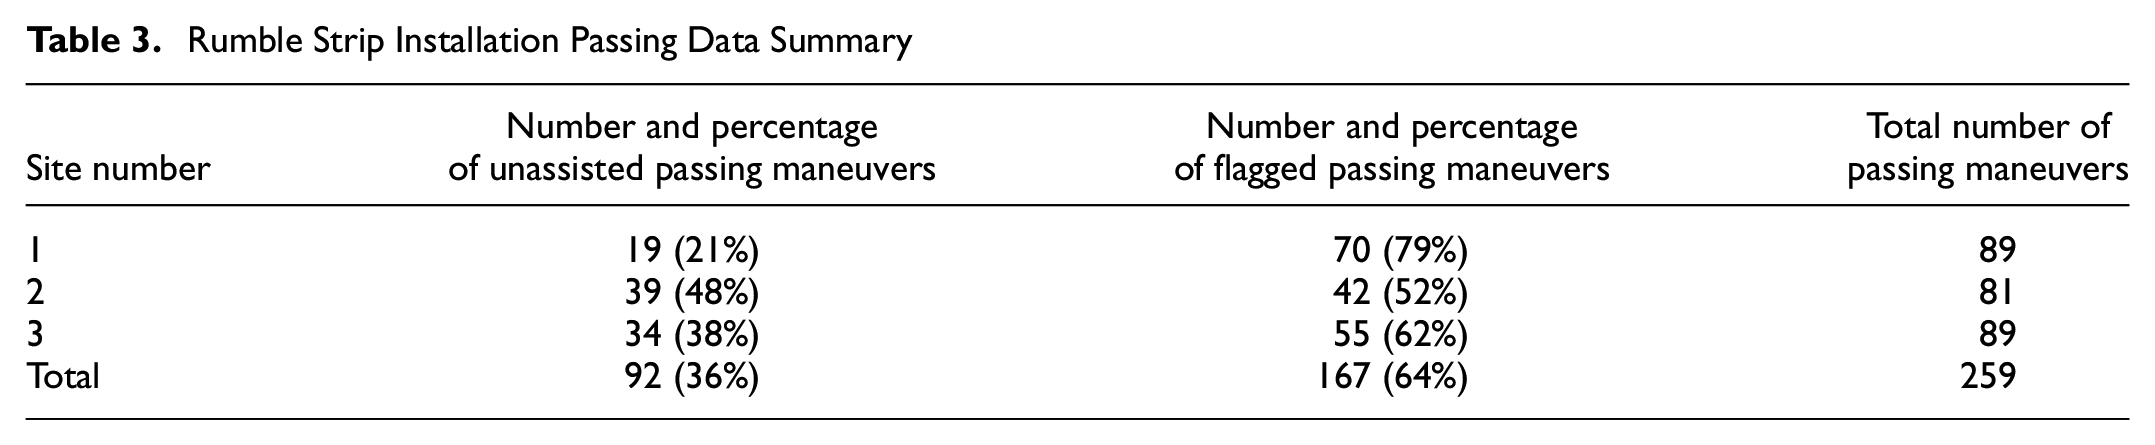
Each time the convoy stopped to replenish materials, traffic was flagged by workers. In addition, workers in the leading and trailing vehicles monitored traffic and occasionally performed coordinated, impromptu flagging operations to help many of the queued vehicles pass the convoy during the active work times. Thus, only 36% of the vehicles which passed the convoys were unassisted. Table 3 summarizes the passing data.
Rumble Strip Installation Passing Data Summary
Herbicide Spraying Operations
Eight sites involved herbicide spraying operations. The work convoy consisted of two work vehicles. The lead vehicle was a spray truck, and the trailing vehicle was an attenuator truck. Figure 4 shows these vehicles. The maximum speed of the convoy was approximately 12 mph.
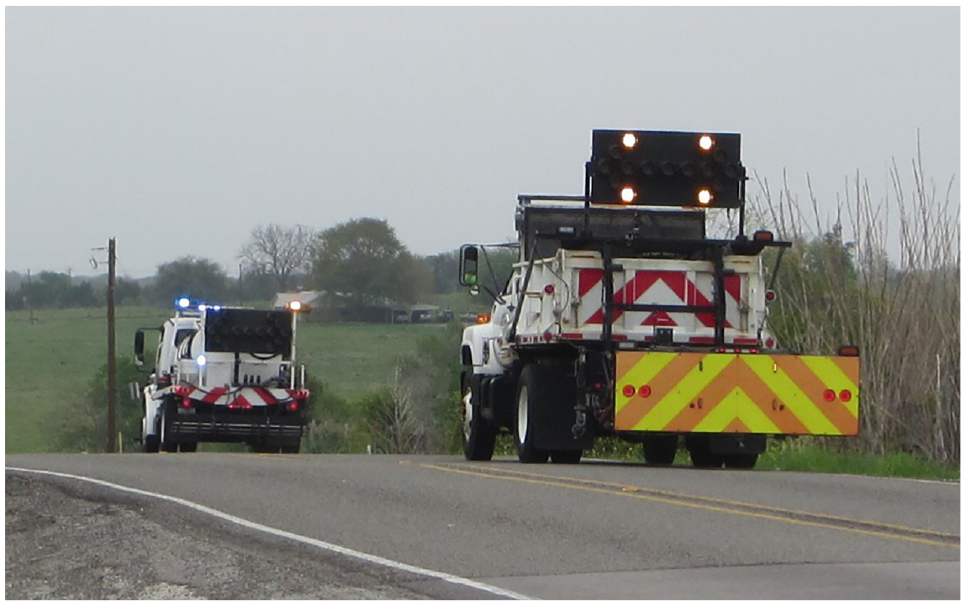
Herbicide spray convoy.
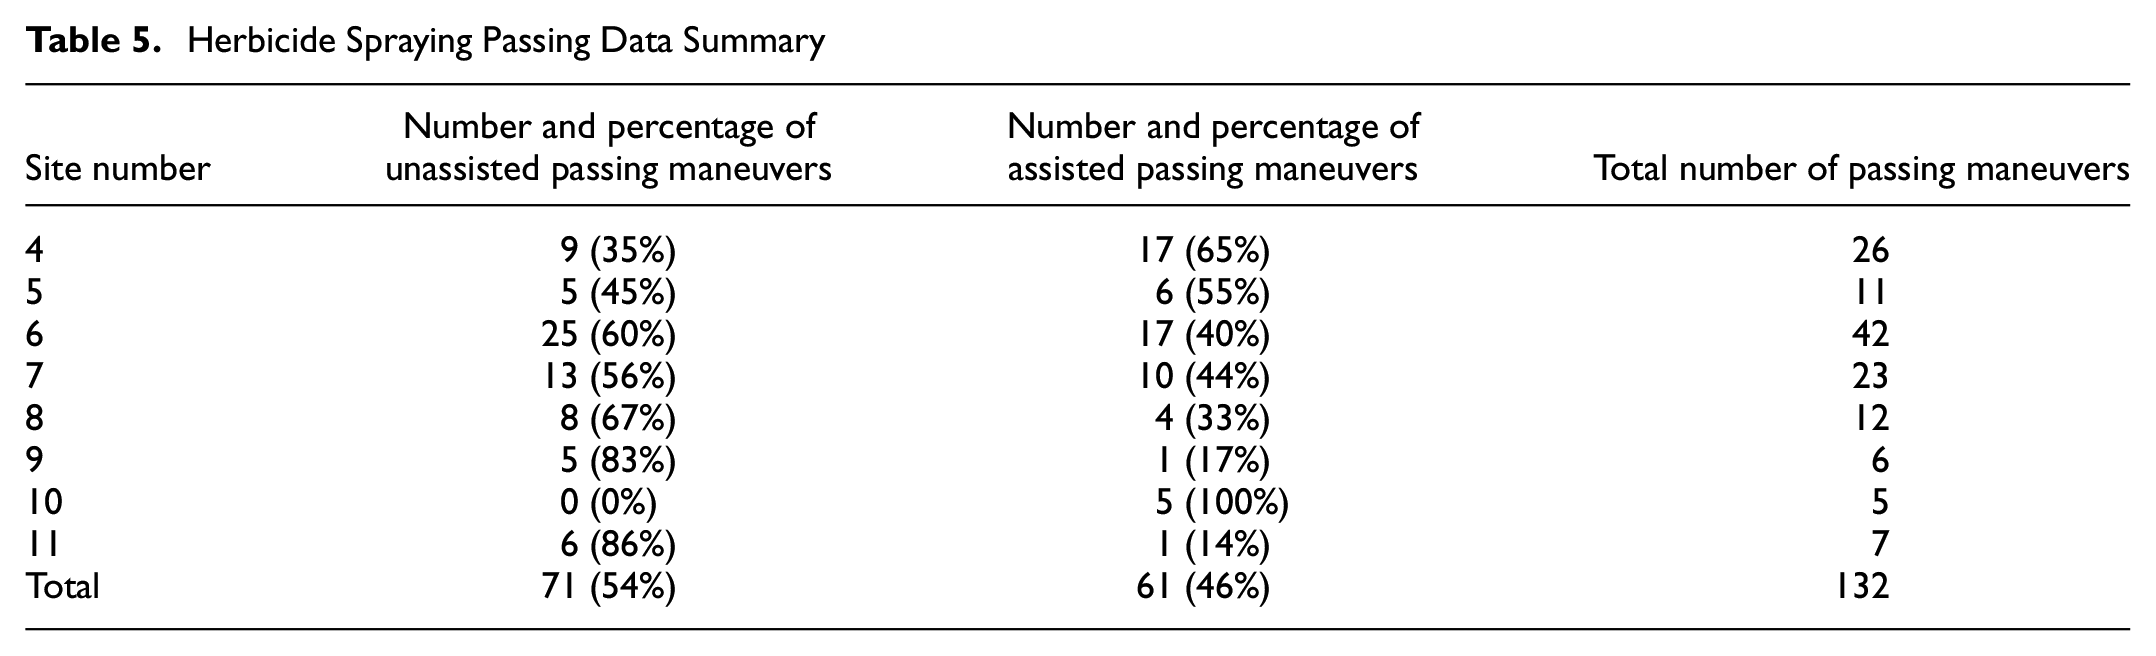
Table 4 summarizes the data collected at the herbicide spraying sites. Traffic volumes in both directions (collected by researchers during the operations) were low, and thus long gaps in the opposing traffic were available for passing. The terrain was rolling, allowing for occasional passing zones. Passing zone location data were documented from the videos, and researchers calculated the percent of no passing zones in the direction of the operation for each site. During these operations, workers monitored traffic and vacated the travel lane to help vehicles pass the convoy. Table 5 shows a passing data summary.
Herbicide Spraying Data Collection Summary
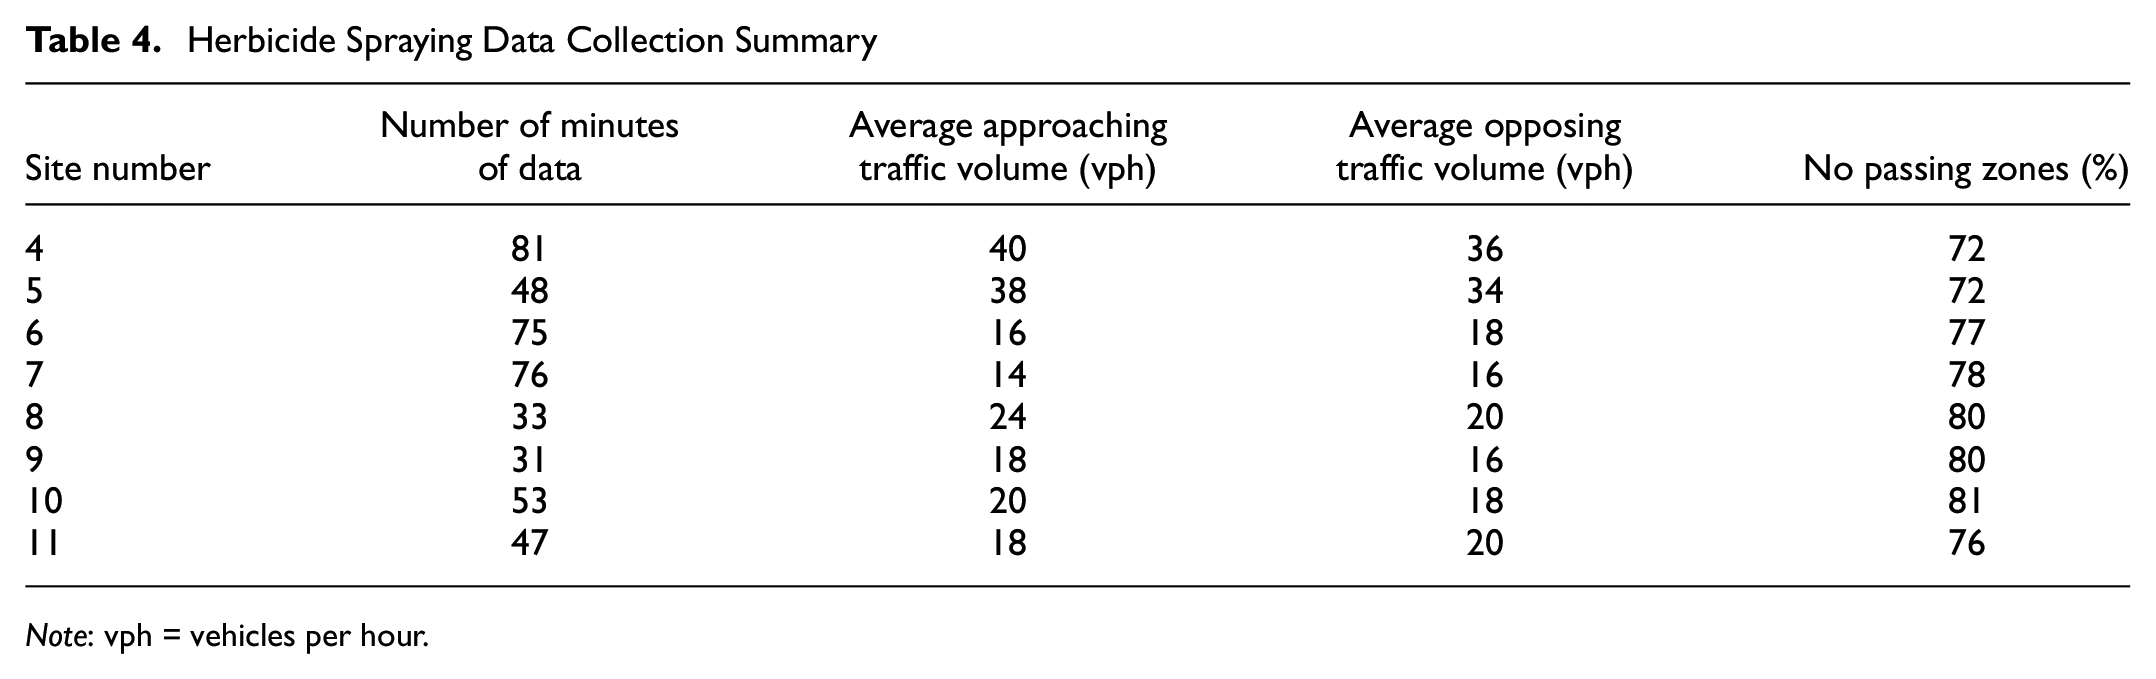
Note: vph = vehicles per hour.
Herbicide Spraying Passing Data Summary
Striping Operations
The work activity at the final six sites was long line striping. The work convoy consisted of two work vehicles. The lead vehicle was the striping truck, and the trailing vehicle was an attenuator truck. The maximum speed of the convoy was approximately 12 mph.
Table 6 summarizes the data collected at the striping sites. Traffic volumes in both directions were much higher than the rumble strip application and herbicide spraying sites. The terrain was level, with generous passing sight distance available. However, oncoming traffic volumes presented fewer gaps for passing maneuvers.
Striping Operation Data Collection Summary
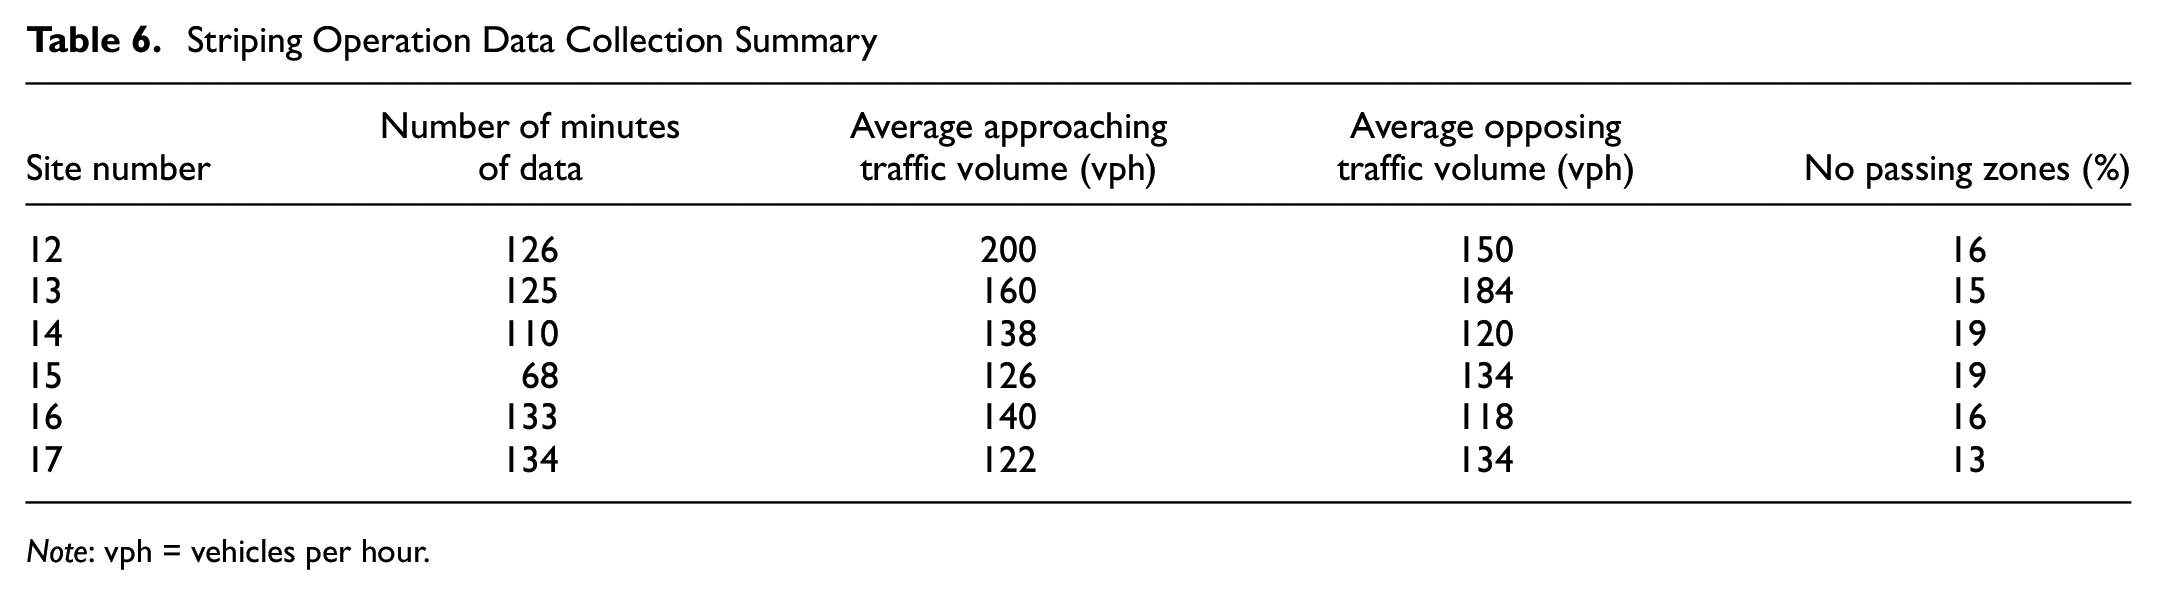
Note: vph = vehicles per hour.
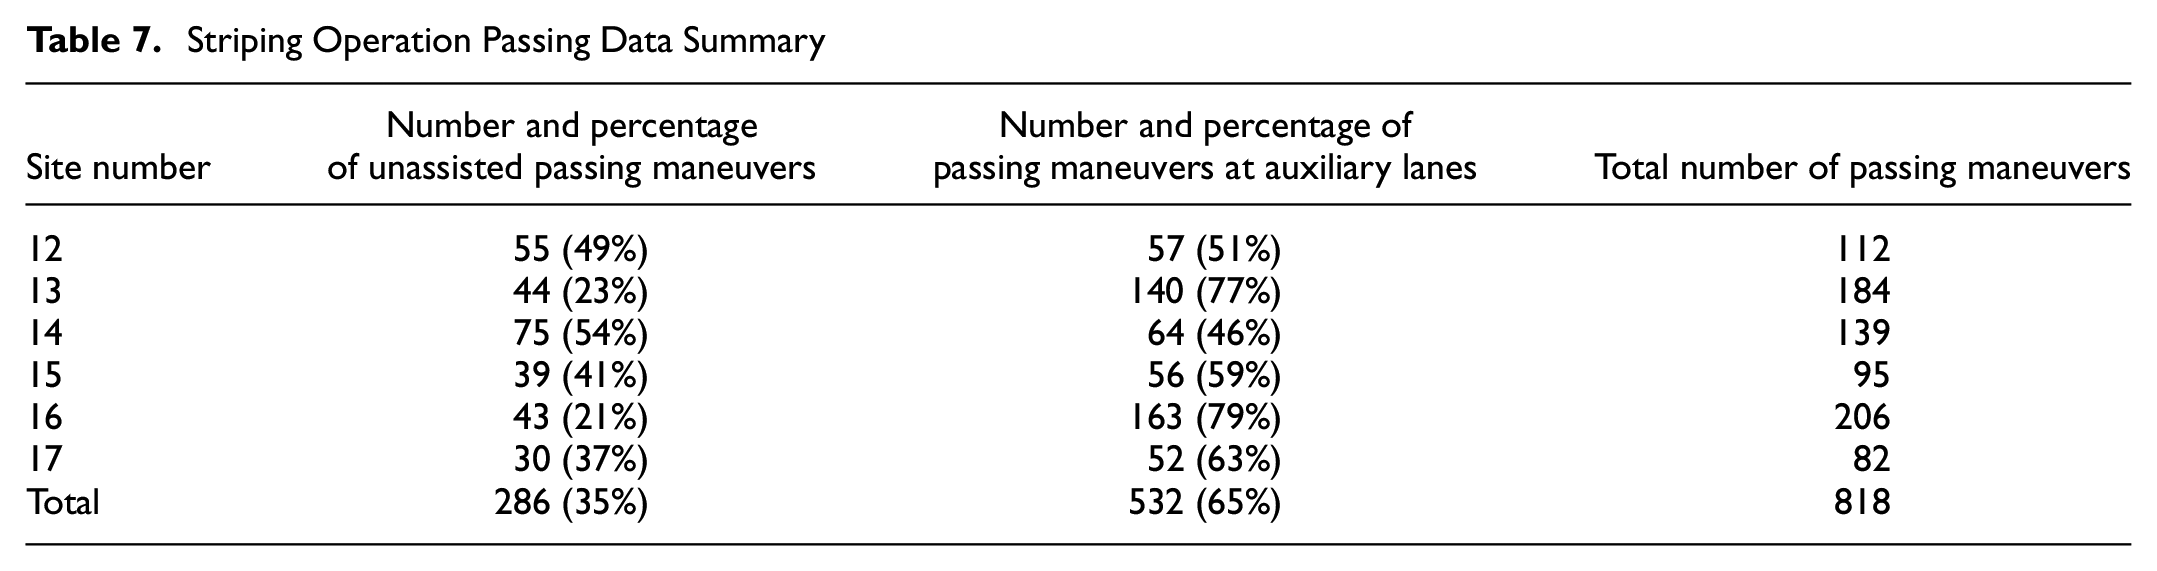
At all striping operation sites, periodic auxiliary lanes were available to allow traffic to flow around traffic without delay. In some cases, these lanes were bypass lanes around left-turning traffic, and, in other cases, a separate right turn lane was available. When the workers encountered these auxiliary lanes, the trailing vehicle stopped near the taper at the beginning of the auxiliary lane while the striping truck used multiple passes to paint all the lines. Many drivers used the lane not occupied by the striping truck to pass the convoy. Table 7 shows a passing data summary.
Striping Operation Passing Data Summary
A total of 1,209 passing maneuvers were captured in the data collection effort, which included passing maneuvers made under a variety of roadway conditions, traffic conditions, convoy speeds, and convoy lengths. There were 760 passing maneuvers (57%) that were made with the assistance of workers or because of the availability of auxiliary lanes. The remaining 449 passing maneuvers (43%) were made by independent, unassisted driver decisions and were the focus of the field data analysis.
Data Reduction
GPS Data
Using the speed and GPS coordinates contained in the telemetry data files, researchers examined the overall movement of each type of mobile operation. Figure 5 shows a speed profile of the trailing vehicle for one of the rumble strip installation operations. Overall, the trailing vehicle speed was very low (averaging 2 mph) except for a few cases where the vehicle lagged behind and had to catch up to the convoy. The periodic stops lasted for several minutes. The trailing vehicle speed data do not accurately reflect the progression speed of the whole mobile operation. However, they do reflect the apparent convoy speed or movement that an approaching driver experienced as they arrived behind the convoy.
Speed profile of trailing vehicle during rumble strip installation.
Figure 6 shows a speed profile of the trailing vehicle for one of the herbicide spraying operations. At this site, the trailing vehicle average speed was 10.5 mph. Periodic stops of only a few seconds (coordinated with the spray truck) were made when vacating the travel lane to allow vehicles to pass the convoy.
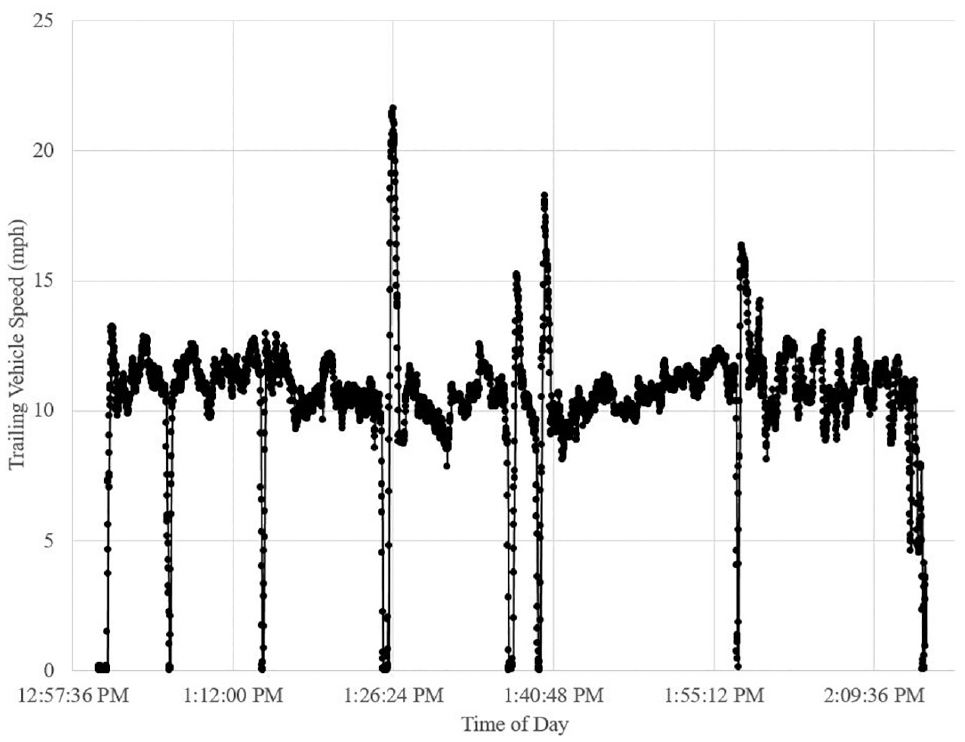
Speed profile of trailing vehicle during herbicide spraying.
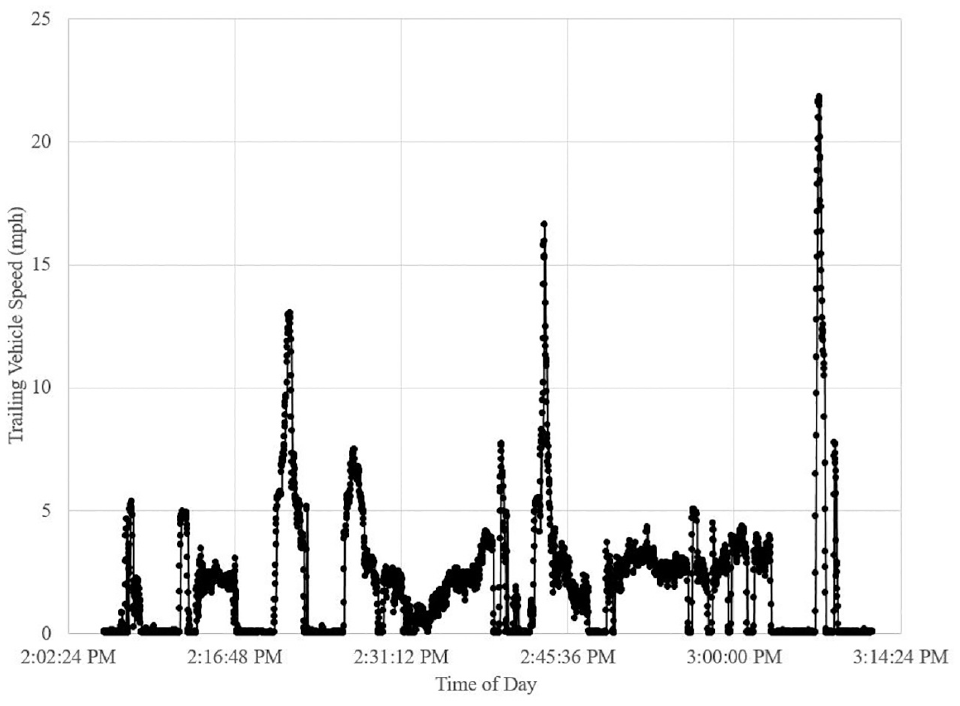
Figure 7 shows a speed profile of the trailing vehicle for one of the striping operations. In this case, the trailing vehicle speed averaged 8.6 mph and was much less consistent than the other types of operations, stopping for 1 to 2 min while the striping truck moved back and forth painting the additional lines required for the auxiliary lanes.
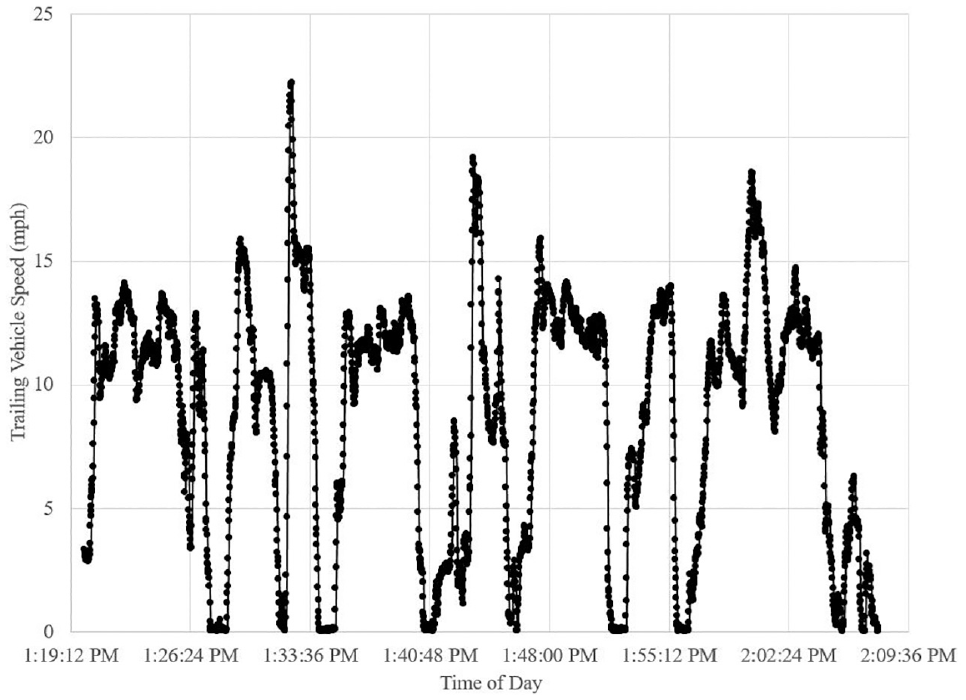
Speed profile of trailing vehicle during striping.
Next, researchers used the GPS data to examine the length of the convoy. By using matching timestamps from the telemetry data files, the distance between the leading and trailing vehicles was computed. Figures 8 to 10 show the results for one site from each of the three types of operations. For the rumble strip installation (Figure 8), the convoy length varied from 519 ft to 2,140 ft. The average length was 1,198 ft. For the herbicide spraying (Figure 9), the convoy length varied from 112 ft to 756 ft, and the average length was 257 ft. Last, the striping operation (Figure 10) showed convoy length variation from 162 ft to 802 ft, with an average length of 465 ft.
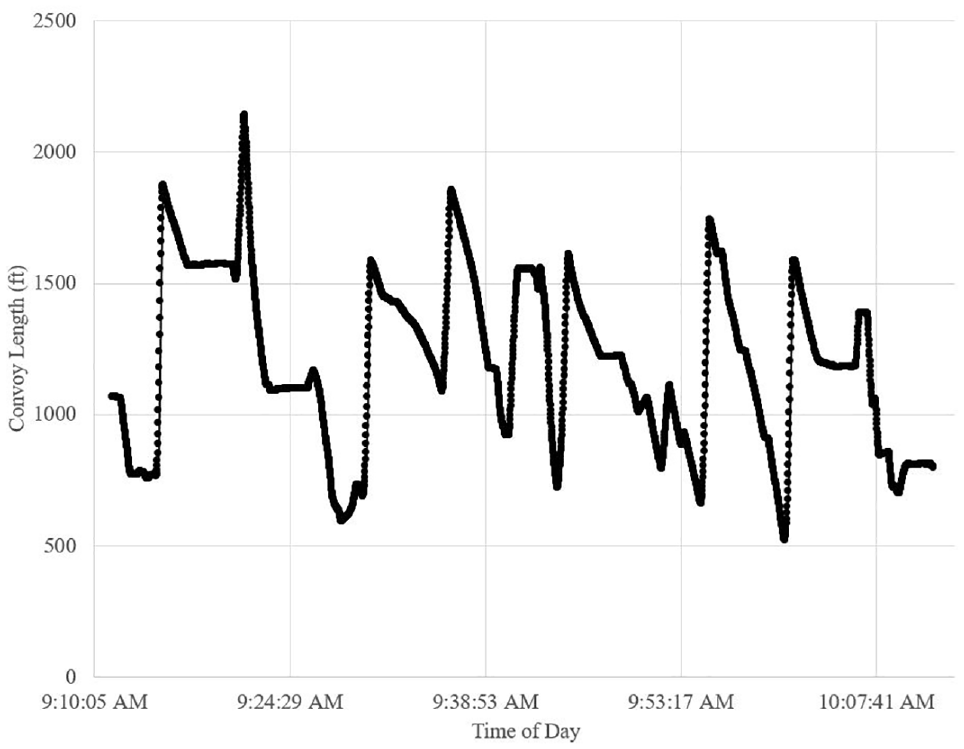
Convoy length during rumble strip installation.
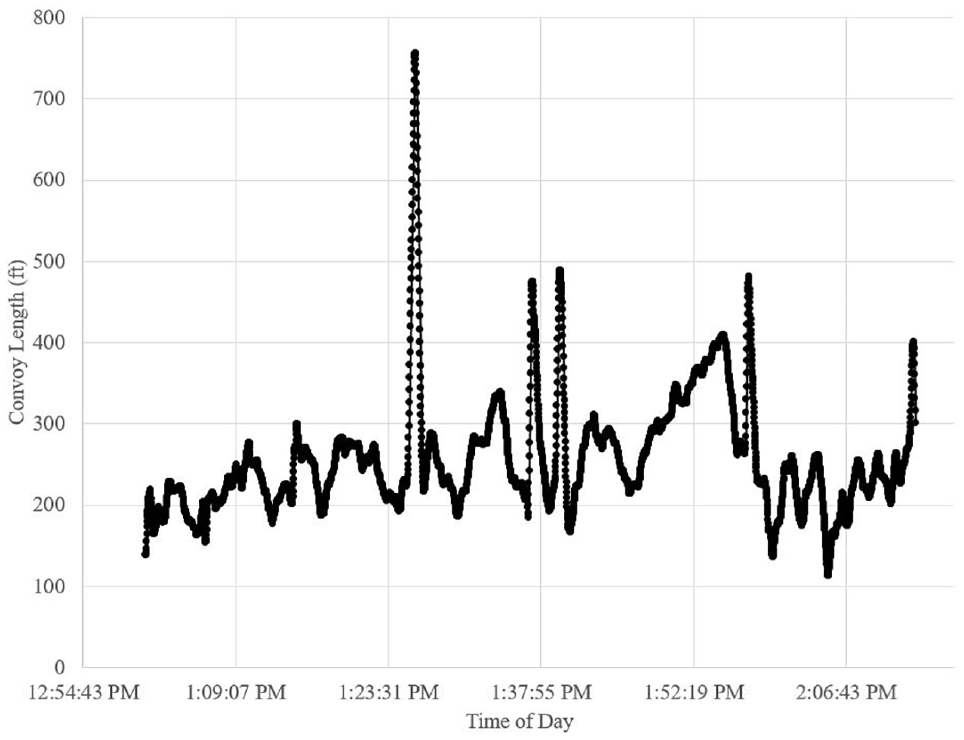
Convoy length during herbicide spraying.
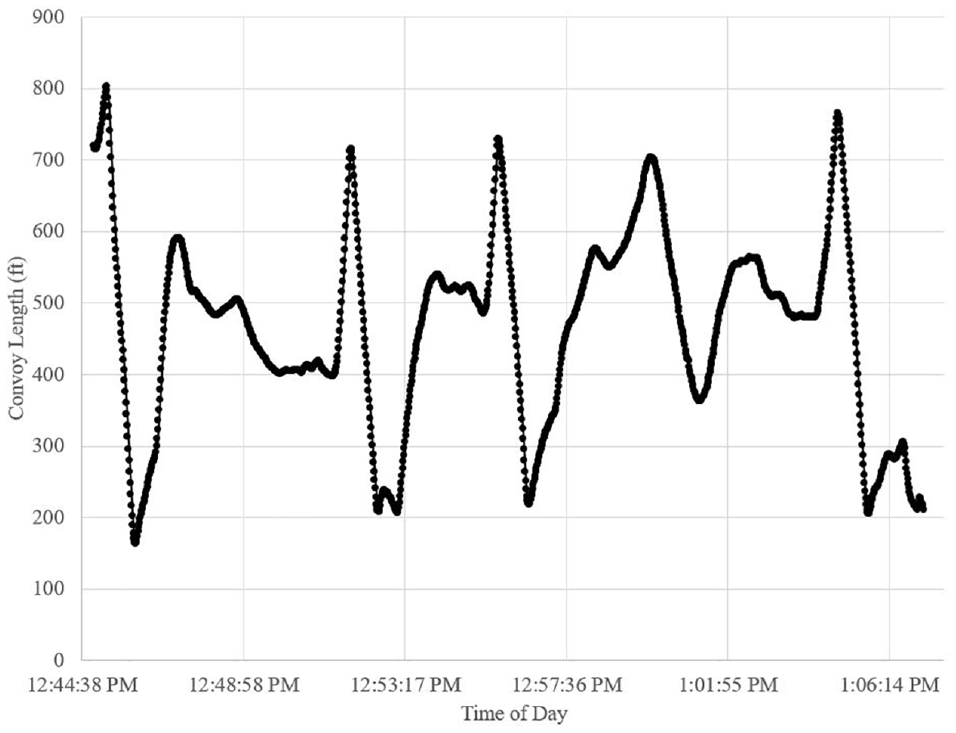
Convoy length during striping.
No Passing Zone Considerations
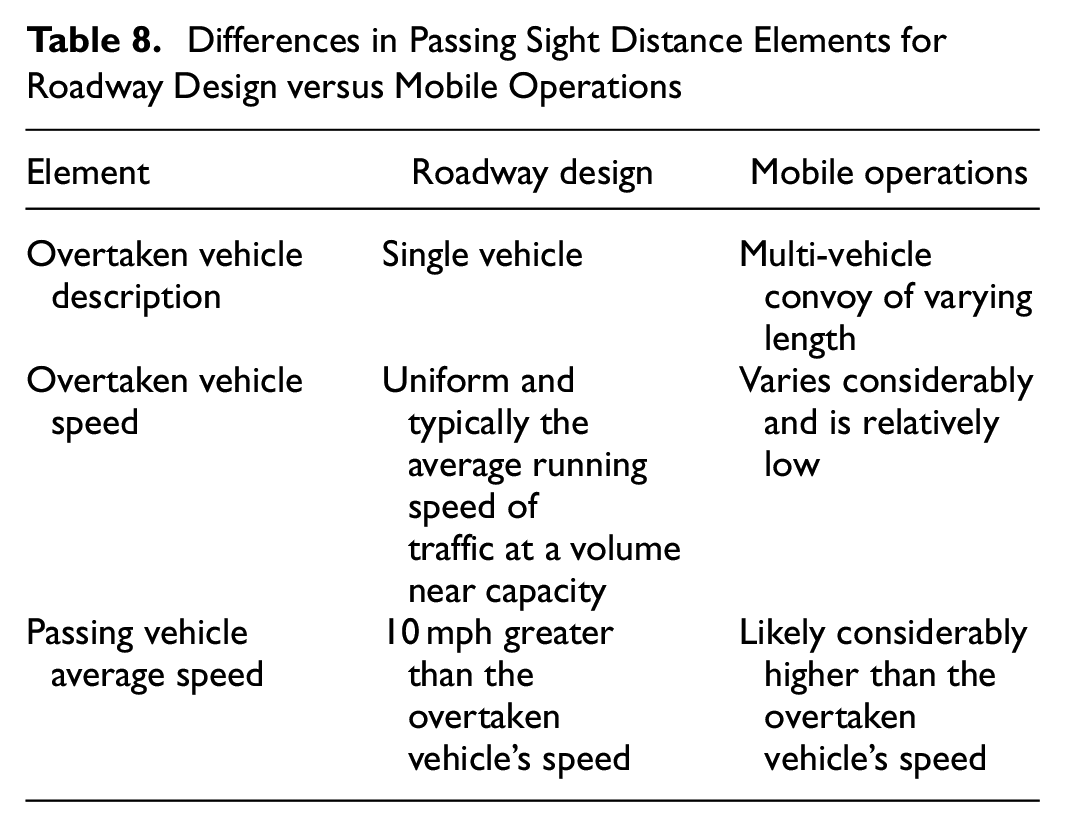
It has been well documented that no passing zones are established based on roadway curvature and availability of sufficient passing sight distance ( 1 ). Minimum passing sight distances for two-lane roadway designs are based on some assumptions about driver behavior and the overtaken vehicle ( 3 ). For example, the overtaken vehicle is assumed to be a single vehicle driving at a uniform speed (the running speed of traffic at a volume near capacity). The passing vehicle’s average speed is assumed to be 10 mph over the speed of the overtaken vehicle. Based on the speed profiles in Figures 5 to 7, along with the convoy lengths in Figures 8 to 10, we can infer that passing sight distance is likely very different for mobile work operations. During mobile operations, the passing vehicle must overtake a multi-vehicle convoy of varying length that moves along at relatively low speeds that vary considerably. Table 8 summarizes these differences.
Differences in Passing Sight Distance Elements for Roadway Design versus Mobile Operations
Driver interpretation of the applicability of no passing zones around mobile operations is not well understood. The video data showed that some drivers strictly adhered to the no passing zone markings, despite the availability of long gaps in opposing traffic. These drivers refused to pass until they were flagged or waved around by workers or until an auxiliary lane was available. Meanwhile, other drivers ignored the no passing zone markings and passed the convoy at their own discretion. Figure 11 shows an example of a driver passing in a no passing zone. Thus, the data were reduced without regard to the presence of no passing zone markings.
Example of a driver passing convoy in no passing zone.
Video Data
The trailing vehicle videos were reduced using spreadsheet tabulation of various events, including:
Description of approaching vehicles behind the mobile operation
Arrival timestamps for approaching vehicles
Timestamps for initiation of all passing maneuvers
Queue position from which all passing maneuvers were initiated.
Timestamps for arrival of all vehicles traveling in the opposite direction
From these data, researchers calculated the amount of time each passing vehicle spent in the queue following the mobile operation, which was the difference between the arrival time and the time at which a passing maneuver was initiated. For all vehicles that arrived subsequent to the first position in the queue (second, third, fourth, etc.), researchers also calculated the time spent in the queue while waiting to arrive at the first position in the queue. In addition, researchers calculated the duration of available passing gaps by tabulating the headways of traffic traveling in the opposite direction.
Analysis
Analysis of the passing maneuver data revealed the occurrence of unpredictable driver behaviors when queues formed behind the mobile work operation. The behavior of interest was passing maneuvers made from queue positions other than the first (or front) of the queue. These maneuvers create potential conflicts that can degrade the safety of the operation for both drivers and workers because the potential for a collision increases. Potential consequences of poor passing decisions by impatient drivers include collisions with other traffic, secondary collisions with workers and/or equipment, and unpredictable evasive maneuvers that may lead to work zone intrusions. Figure 12 shows an example of a conflict created when both the lead vehicle in the queue and another vehicle from further back in the queue attempted to pass the convoy at the same time.
Example of a passing conflict during striping operations.
An analysis of the passing maneuver data (independent driver decisions only) showed that 175 vehicles arrived behind the convoy as the first vehicle in the queue. Thus, they spent no time waiting for the first queue position, and their data were not used in this analysis. Next, 194 vehicles arrived in the second, third, fourth, and so on, positions and waited in the queue until other vehicles ahead passed the convoy and the first position became available to them. For these vehicles, researchers tabulated the values for the amount of time spent waiting to reach the first position in the queue. For simplicity of analysis, the data were then grouped into 1 min time increments. Finally, the remaining 80 vehicles joined the queue and impatiently made a passing maneuver before reaching the first position in the queue. Researchers tabulated the time these drivers waited until initiating the undesirable passing maneuver. Researchers then grouped the data into 1 min time increments. Table 9 shows the results.
Undesirable Passing Maneuver Analysis Results
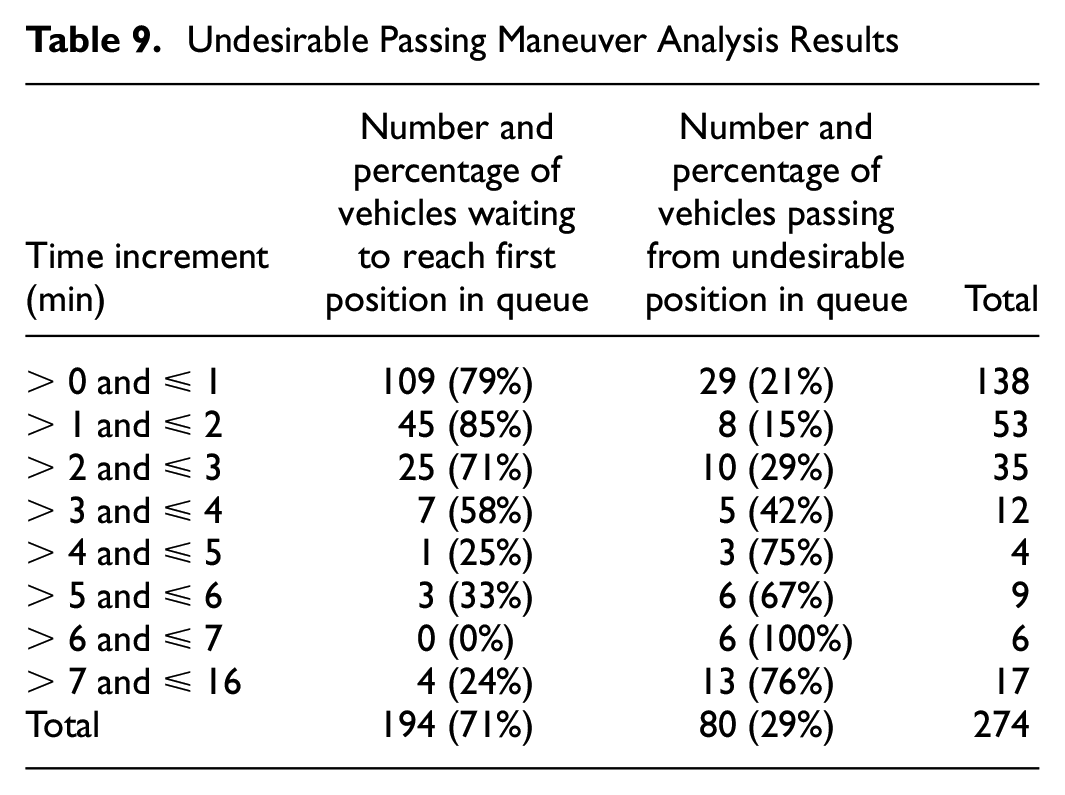
For 138 vehicles which spent 1 min or less in the queue, 109 (79%) reached the front of the queue, while 29 vehicles (21%) made a passing maneuver from an undesirable position farther back in the queue instead of waiting to reach the first position in the queue. Similar calculations were made for each time interval of interest. To facilitate interpretation of the data, Figure 13 shows a graphical depiction of the undesirable pass percentages. A trend line was manually drawn through the data points to help develop guidance that would be useful to practitioners.
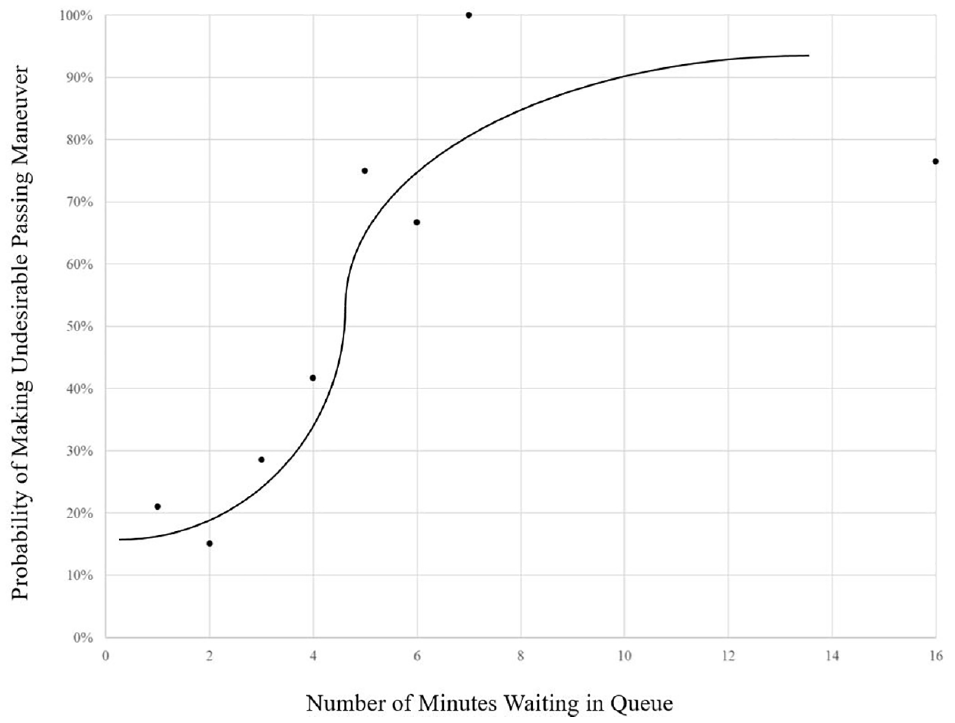
Undesirable passing maneuver analysis results.
The data showed that passing maneuvers made from undesirable positions in the queue occurred over all wait-time-in-queue increments. Even when wait times were very short, approximately 20% of vehicles opted to pass from an undesirable position rather than wait for the first position in the queue. However, as the amount of time spent waiting to reach the first position in the queue reached 4 to 5 min, the probability of undesirable passing maneuvers occurring increased significantly (exceeding 50%). When the amount of time spent waiting for vehicles in front of the queue to pass reached 6 min or more, there was a high probability of impatient drivers passing the mobile operation from an undesirable position in the queue.
Conclusions and Recommendations
Based on the research findings, the following conclusions and recommendations were developed:
Field studies of mobile operations on two-lane roadways illustrated that a major safety concern with mobile work operations occurs when a vehicle farther back in the trailing queue decides to pass other trailing vehicles in front of them in addition to the work operation. Several instances were observed wherein a vehicle farther back made a passing maneuver that created a potential collision risk with the first vehicle in the queue as their passing maneuver was initiated.
Data collected during the field studies also illustrated that the likelihood of an undesirable passing behavior occurring increased as the amount of time spent waiting in the trailing queue to pass increases. Data collected from 17 mobile operations in Texas and Minnesota suggest that nearly 50% of drivers who have to wait in a moving queue for 4 min or longer will attempt an undesirable passing maneuver. If wait-in-queue times reach or exceed 6 min, nearly 85% of drivers will attempt an undesirable passing maneuver.
Time spent following a moving queue waiting to pass a mobile operation is affected by work operation characteristics (e.g., length of convoy and operating speed), traffic volumes, and roadway topography (which dictates where sufficient passing sight distance exists). The frequency, length, and spacing of sections where passing cannot occur interacts in complex ways with regard to the time spent in the queue waiting to pass. Therefore, simple volume-based guidance as to when mobile operations will create long wait times in the queue cannot be determined.
As a result of this project, researchers created the following guidance:
Transportation agencies should strive to avoid creating conditions where multiple vehicles will queue (or platoon) behind the work operation and have to remain in that queue for more than 4 min. Selecting work periods where traffic volumes are lower is recommended.
If roadway and traffic conditions are such that longer elapsed times following the queue are likely to occur, the work crew should be directed to plan to pull over and vacate the travel lane to allow vehicles to pass. Agency pre-planning of potential pull-off locations along a section of roadway would help work crews implement these directions.
If prior experiences or analysis of a planned mobile operation on a roadway suggests that queues are likely to be created with long elapsed following times and there are no suitable locations for the work convoy to pull over to allow vehicles to pass, a stationary work zone with positive traffic control methods (e.g., flaggers, portable signals) should be considered.
Footnotes
Acknowledgements
The researchers wish to express their gratitude to the members of the project panel for their guidance during the performance of this research. This includes Chair Gevin J. McDaniel (HNTB Corporation), Ahmed F. Al-Kaisy (Montana State University), Raymond L. Brushart (Ohio DOT), Eric Jackson (Tennessee DOT), Cynthia Landez (KCI Technologies, Inc.), Scott Neidert (Delaware DOT), Shawn A. Smith (Maine DOT), Jim Wingerter (Montana DOT), Jawad N. Paracha (FHWA Liaison), and Trey Joseph Wadsworth (NCHRP). In addition, special thanks go to Rebecca Wells and Cliff Dawson of TxDOT and Brad Lechtenberg, Bob Vasek, and Ethan Peterson of MnDOT who provided access for researchers to collect passing maneuver data at mobile operations. This was essential for a successful evaluation.
Author Contributions
The authors confirm contribution to the paper as follows: study conception and design: L. Theiss, G. Ullman; data collection: L. Theiss; analysis and interpretation of results: L. Theiss, G. Ullman, J. Jackels; draft manuscript preparation: L. Theiss, G. Ullman, J. Jackels. All authors reviewed the results and approved the final version of the manuscript.
Declaration of Conflicting Interests
The author(s) declared no potential conflicts of interest with respect to the research, authorship, and/or publication of this article.
Funding
The author(s) disclosed receipt of the following financial support for the research, authorship, and/or publication of this article: This research is part of the NCHRP project 03-132, which is part of the National Cooperative Highway Research Program (NCHRP). NCHRP is administered by the Transportation Research Board (TRB) and funded by participating member states of the American Association of State Highway and Transportation Officials (AASHTO). NCHRP also receives critical technical support from the Federal Highway Administration (FHWA), United States Department of Transportation. The grant number was DTFH61-13-H-00024.