
Abstract
Railroad track ballast composed of uniformly graded crushed aggregate is susceptible to fouling from substances like ballast fines degraded during track service, coal dust, clay, and sand. Fouling reduces the drainage capacity of ballast, often leading to water accumulation and subsequent performance degradation. Fouled ballast with high moisture content experiences excessive settlement and could benefit from stabilization for safe operations. While previous studies have highlighted the efficacy of geogrids in stabilizing fouled ballast and minimizing the overall track settlement, the effect of geogrid on the performance of fouled ballast under progressive rainfall wetting and continuous cyclic loading conditions remains unexplored. This study examines the performance of geogrid-stabilized field-sourced fouled ballast through large-scale triaxial tests. The findings reveal that the inclusion of a single-layer geogrid can effectively reduce settlement and deformation rates under equivalent water content conditions. A layer of geogrid could prevent sample failure under saturated conditions, retaining approximately 1,000 kPa post-cyclic shear strength. Furthermore, the results indicate that geogrid stabilization enhances the resilience of fouled ballast and maintains the track geometry under progressive rainfall conditions. These findings offer crucial insights for geogrid applications in railroad maintenance.
The ballast layer serves as a critical structure in railroad tracks, transferring loads from sleepers to subgrade and facilitating efficient drainage. New ballasted tracks are typically constructed using uniformly graded clean ballast aggregates featuring irregular shapes and sharp corners, which helps maintain track stability and geometry. Nevertheless, these aggregates are subject to breakage and abrasion from repeated train loads, leading to degraded particles with rounded corners and smooth surface texture (1, 2). These degraded particles, along with other fine materials like coal dust, clay, and sand, accumulate within the voids between large ballast particles over time, leading to reduced drainage, and other track performance issues such as excessive settlement, mud pumping, track instability, and even derailment (3, 4). Recent research has explored the effects of fouling on the mechanical performance of ballast, primarily focusing on dry conditions and adding a single fouling source into laboratory-prepared ballast aggregates ( 5 – 13 ). These studies have found that the deformation of ballast generally increases with the fouling effect. When the ballast deformation is beyond acceptable limits, stabilization treatment is needed to ensure proper track performance. Geogrid is a popular material used to stabilize fouled ballast, and early studies indicate that geogrid is highly effective in increasing the strength and reducing settlement of fouled ballast ( 14 – 16 ). However, the results of previous studies were limited to dry conditions, and fouled ballast prepared in the laboratory with a single fouling source may not well represent field ballast materials. It is particularly important to consider the effect of moisture when investigating the impact of fouling and the potential benefit of geogrid. This is because in the field water commonly accumulates within the fouled ballast layer as a result of reduced drainage capacity (Figure 1).
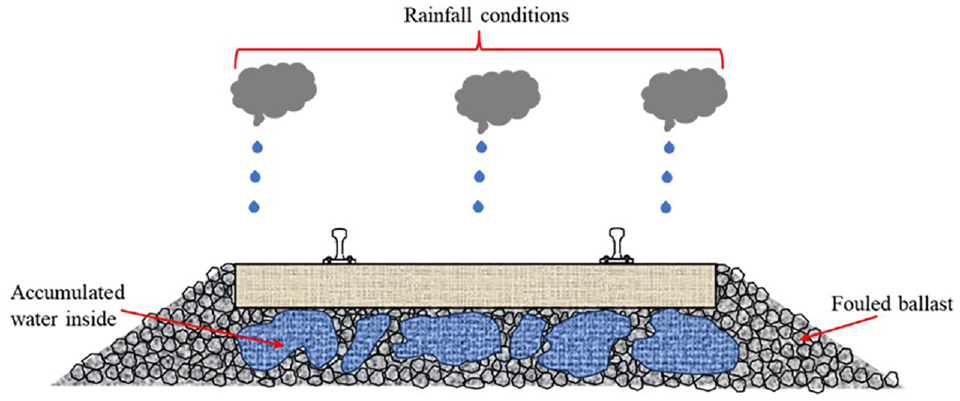
Wet fouled ballast under rainfall conditions.
The presence of moisture is known to significantly influence the mechanical performance of fouled ballast. When moisture is introduced, fouled ballast exhibits considerable permanent deformation and strength loss (17, 18). An increase in water content may reduce ballast shear strength linearly, and the rate of decrease is influenced by fouling levels (19, 20). Specifically, when fouling content exceeds 20%, changes in water content can markedly affect this deterioration ( 21 ). However, these effects are derived from tests on separate samples. In actual railroad tracks, moisture conditions within the same location can also vary with different rainfall intensities and durations ( 22 ). Although some fouled ballast tracks may not present clear performance degradation under low water content, they may present rapid deterioration under repeated loading when the rainfall intensity or duration increases. The performance variation of fouled ballast under progressively increasing water contents and repeated train loading has not been thoroughly explored. Furthermore, the impact of geogrid stabilization under these wetting and loading conditions remains unclear.
This study addresses the effect of progressively increasing water content on geogrid-stabilized fouled ballast under cyclic loading. Unlike previous laboratory tests, field fouled ballast material is directly collected from US Class I railroad revenue track instead of mixing a single type of fouling fines (clay, coal, or sand) into clean ballast aggregates. This study involves multi-stage testing of the same non-stabilized and geogrid-stabilized fouled ballast samples under simulated progressive rainfall wetting using a large-scale triaxial setup. The results show a direct correlation between increasing water content and the permanent deformation of fouled ballast. Introducing a single-layer geogrid can effectively reduce both settlement and deformation rates under equivalent water content conditions.
Experimental Study
Ballast Properties
Sieve analysis was performed to determine the grain size distribution of the ballast material used in this study, in accordance with the ASTM C136 Standard Test Method for Sieve Analysis of Fine and Coarse Aggregates ( 23 ). The sieve sizes utilized for the analysis were as follows: 50 mm (2 in.), 37.5 mm (1.5 in.), 25.4 mm (1 in.), 19 mm (3/4 in.), 12.7 mm (1/2 in.), 9.5 mm (3/8 in.), 4.75 mm (No. 4), 2.35 mm (No. 8), 1.19 mm (No. 16), 0.60 mm (No. 30), 0.30 mm (No. 50), 0.15 mm (No. 100), and 0.075 mm (No. 200). This set of sieves was chosen to enable an accurate characterization of both the coarse and fine fractions of the ballast. The fouling index (FI) was adopted to quantify the fouling level ( 24 ), defined as the sum of the cumulative percentages passing the No. 4 and No. 200 sieve sizes:

where
Depending on the substructure materials, track structure, and loading conditions, fouling fines will be generated and accumulate within the ballast layer. Based on our current research with BNSF Railway and Loram, most of the investigated ballasted tracks are moderately fouled. In this study, fouled ballast with FI value of 23 is tested to represent the case of moderately fouled condition, as shown in Figure 2a. Figure 2b shows the tested fouled ballast material, which was sourced directly from BNSF revenue track in the Black Hill subdivision.
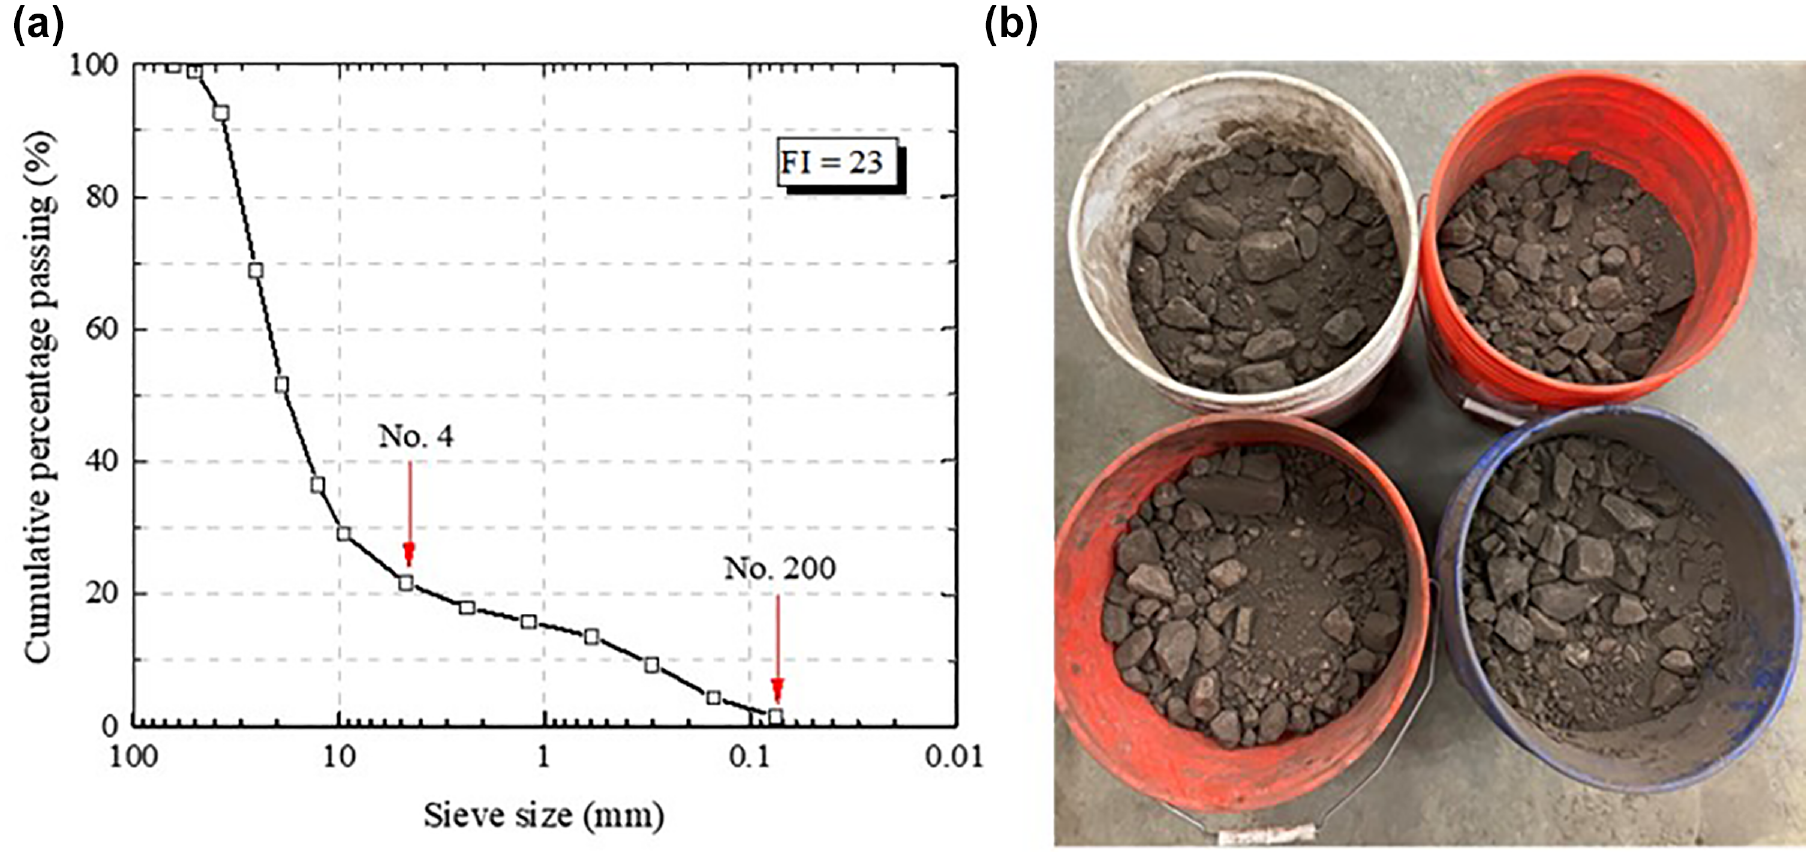
(a) Particle size distribution of fouled ballast and (b) photograph of tested material.
Atterberg limit tests were conducted to determine the plastic limit, liquid limit, and plasticity index for tested material; these were found to be 23.6, 18.0, and 5.6, respectively. This study investigates fouled ballast collected from the field rather than manually mixing particular types of fines into clean ballast aggregate, as was done in past studies. The main difference between field-sourced fouled ballast and laboratory-mixed fouled ballast is that the fouling material in the field is always a combination of different fines rather than a single type, and the coarse portion in the fouled ballast has already experienced degradation and abrasion and the ballast aggregate particle morphology has been significantly changed ( 1 ).
Triaxial Testing Equipment
A series of triaxial tests were conducted to examine the effects of geogrid stabilization on fouled ballast under progressive rainfall wetting and cyclic loading conditions. The University of South Carolina houses a state-of-the-art large-scale triaxial testing frame specifically designed for railroad ballast material testing, depicted in Figure 3a. As shown in Figure 3b, this testing setup is equipped with a hydraulic actuator mounted on the crossbeam, capable of applying both static and dynamic loadings. It can accommodate specimens up to 300 mm (12 in.) in diameter and 600 mm (24 in.) in height, with a loading magnitude of up to 250 kN and a loading frequency of up to 10 Hz. The testing is controlled by a pneumatic controller, a computer-controlled air pressure regulator with a maximum pressure output of 1 MPa, which also provides the confining pressure during testing. Further details about this equipment can be found in Huang et al. ( 25 ). The base pedestal includes three vacuum/drainage valves, two of which are connected to the top loading plate, and the third one is connected to the sample bottom. This design allows the introduction of water into the sample during the test to investigate the effects of varying rainfall conditions.
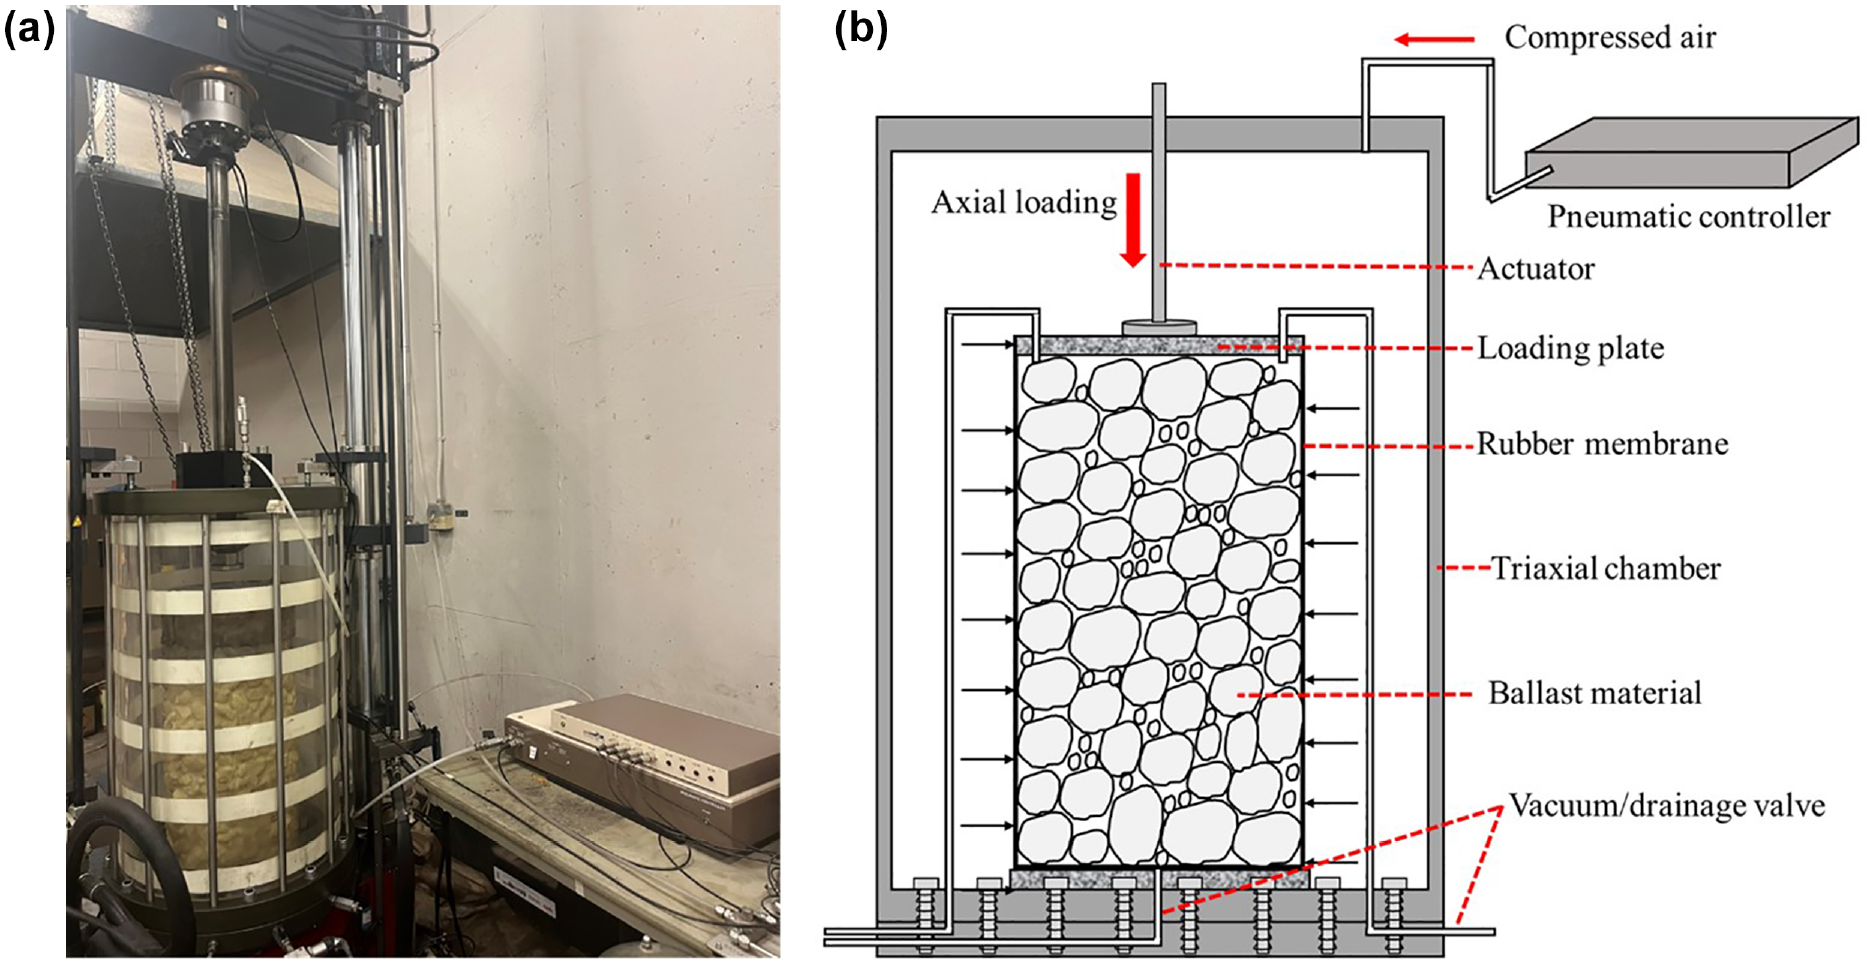
(a) Large-scale triaxial equipment and (b) schematic drawing of testing setup.
Testing Sample Preparation
To prepare the test sample, the triaxial cell is first elevated, facilitating the removal of the base pedestal to create space for the specimen. Initially, two rubber membranes, each 0.76 mm thick, are affixed securely onto the base pedestal using an O-ring. Subsequently, a vacuum line is employed to ensure the membranes tightly adhere to the cylindrical mold, and these membranes are then folded over the top of the mold, as illustrated in Figure 4a. The fouled ballast material is then introduced into the mold in four lifts, each lift undergoing compaction for 90 s with a 35 ft-lb jackhammer until a void ratio of 0.32 is achieved. For the geogrid-stabilized sample, a single-layer geogrid is installed at the midpoint of the sample after the compaction of the initial two lifts, as depicted in Figure 4b. The geogrid used in this study is the InterAx® geogrid supplied by Tensar Corporation, which is one of the latest innovations in geosynthetic products. The geogrid is designed to provide effective confinement for granular fill, creating an efficiently stabilized layer, thereby enhancing performance. The results of this research could quantify the benefit of using this type of geogrid in railway ballast stabilization. Finally, the compacted sample, with a diameter of 300 mm (12 in.) and height of 600 mm (24 in.), is sealed as demonstrated in Figure 4c.
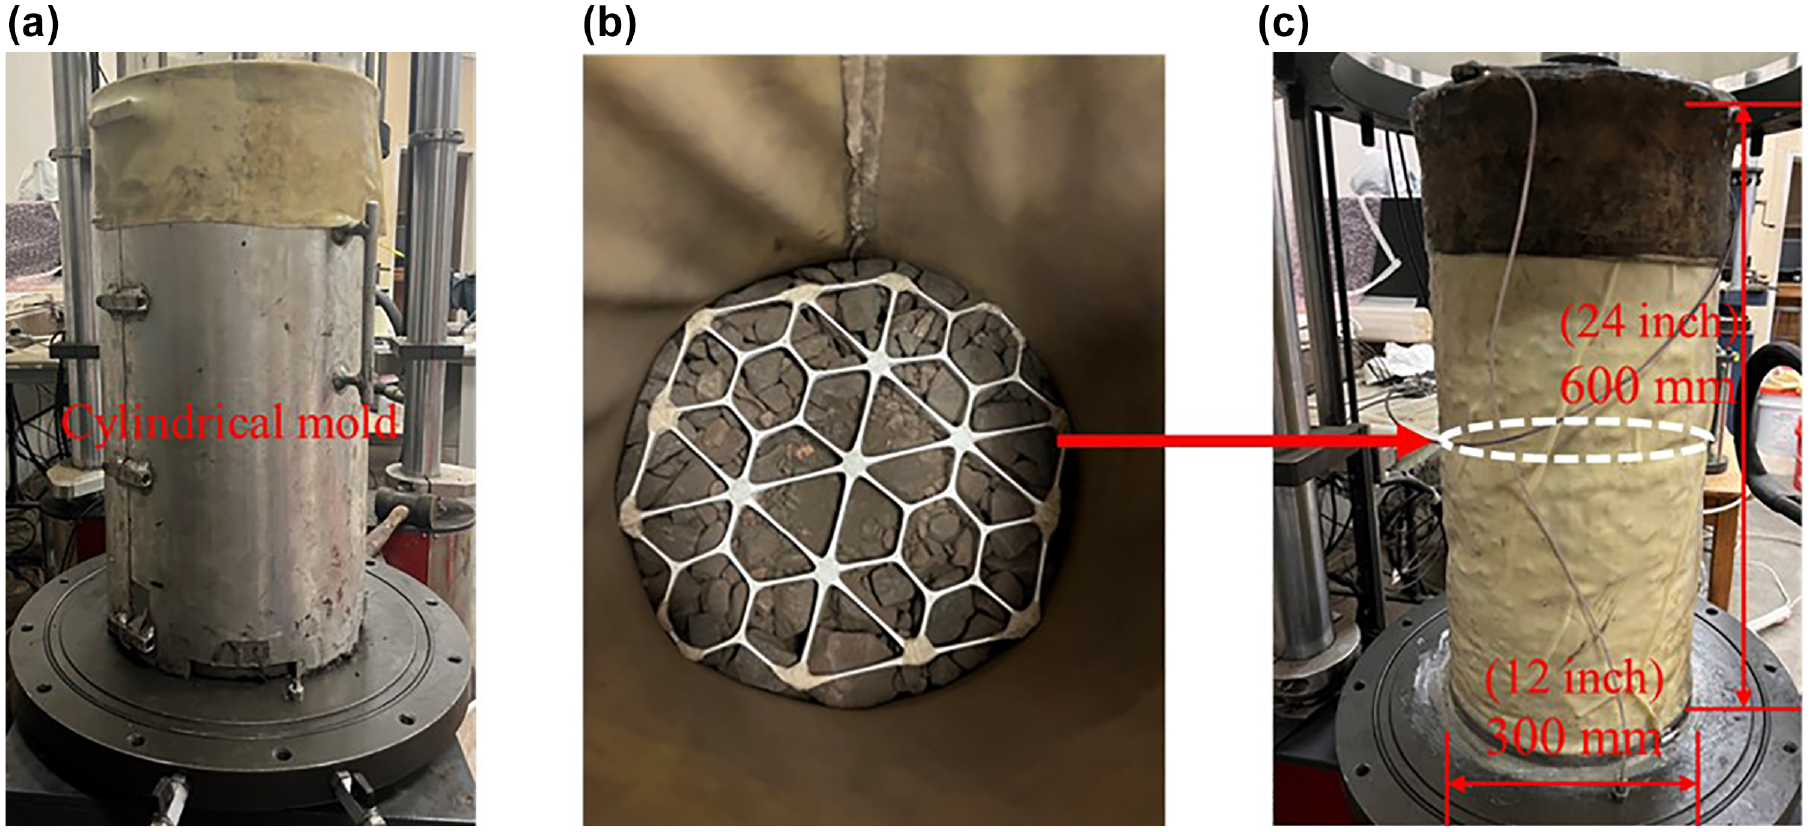
(a) Cylindrical mold for compaction, (b) included geogrid, and (c) sealed sample with a single-layer geogrid.
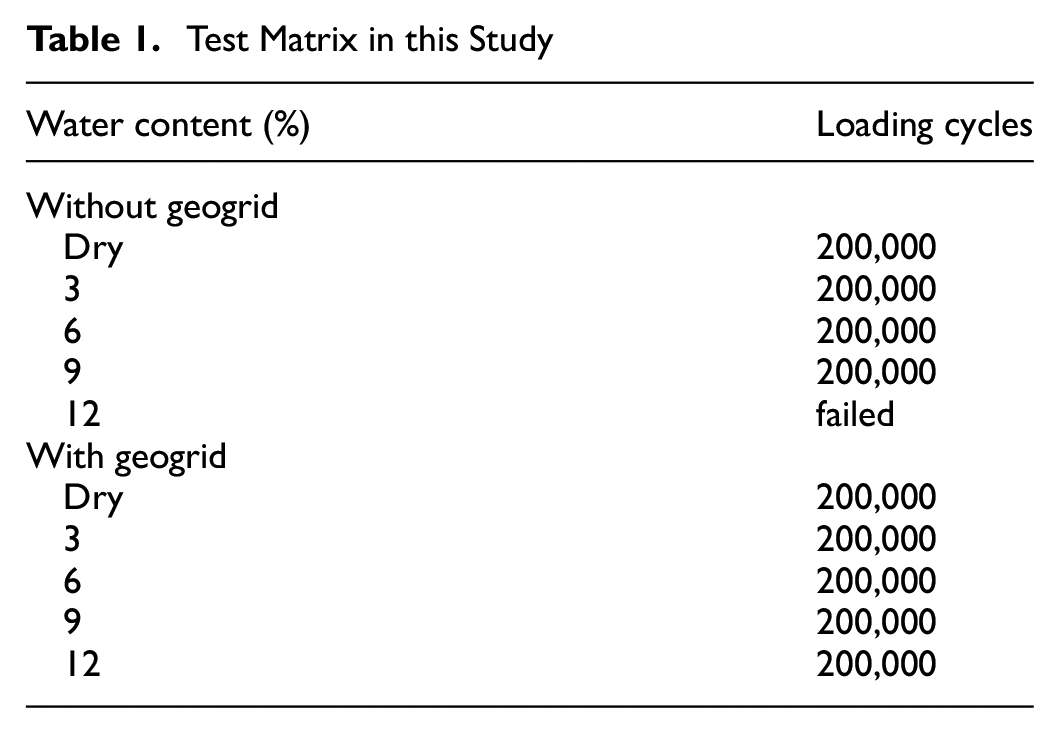
Cyclic Loading Design and Test Matrix
On completion of compaction, the sealed sample is relocated beneath the loading frame in conjunction with the base pedestal and then secured within the triaxial cell. A confining pressure of 69 kPa (10 pounds per square inch [psi]) is applied through the pneumatic controller. Field observations have indicated that the measured maximum horizontal stress within the ballast layer underneath the sleeper rarely exceeds 69 kPa (10 psi) ( 26 ), thereby validating the selection of a 69 kPa (10 psi) confining pressure for this study. This same confining pressure has been reported in literature related to triaxial testing of railroad ballast (27, 28). Before applying axial loading, the top cap of the load ram is adjusted to ensure effective contact with the specimen. Following this adjustment, a haversine loading pulse is applied, featuring a frequency of 3 Hz, a rest time of 0.297 s, a maximum deviator stress of 220 kPa (31.9 psi), and a minimum deviator stress of 20 kPa (2.9 psi), as shown in Figure 5. The minimum deviator stress of 20 kPa (2.9 psi), equivalent to a vertical load of 1.5 kN, mimics field ballast stress from the weight of track ( 29 ). The parameters of this loading pulse were determined during a previous BNSF-funded project aimed at studying the settlement and resilient modulus of various ballast materials.
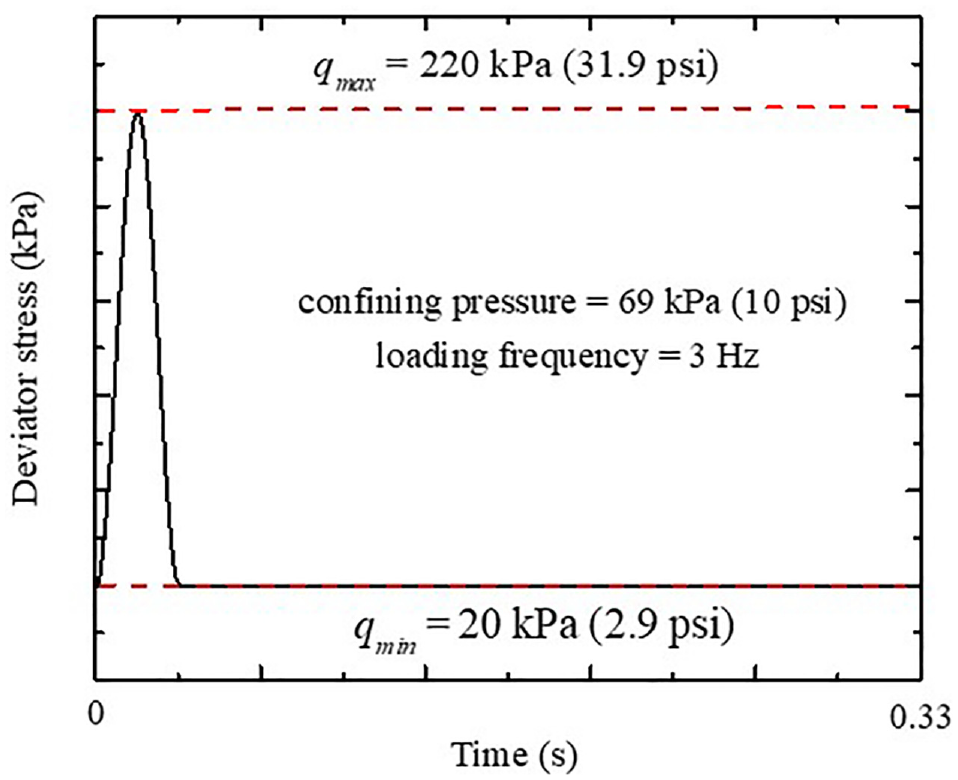
Applied cyclic loading profile.
The sample is initially subjected to 200,000 loading cycles under dry conditions. During this stage, the drainage valves on the base pedestal remain open to vent any air potentially trapped within the sample. As the sample is dry, no measurement of volumetric change is made. On completion of the dry test, a specified volume of water is gradually injected into the sample from the top via the drainage valve, as shown in Figure 3b. This top-down injection simulates rainfall. The injection process halts when the water content (WC) by weight of the total sample reaches 3%. In this study, water inclusion is quantified using WC rather than degree of saturation because of the lack of volume change measurements during testing. After a 24 h period allowing for water redistribution, the triaxial testing resumes. Subsequent wet condition tests are summarized in Table 1. Each test involves 200,000 loading cycles and an incremental WC increase of 3%, to account for the effect of progressive rainfall wetting. When WC reached 12%, a small percentage of water was observed to percolate through the sample from the bottom drainage valve. To maintain the desired WC, an equivalent amount of water is re-injected until all calculated water remains within the sample. At this stage, the sample can be considered near saturation. To make it clear, this condition is referred to as “fully saturated” in the following discussion. It is important to note that, although the calculated amount of water is injected from the top to simulate rainfall wetting, this study does not focus on how the water redistributes within the sample, which is beyond the current research objective. This study considers the overall WC of the entire sample. Note that the 12% WC test was not completed for the non-stabilized sample because of its failure, whereas the geogrid-stabilized sample continued to function through the repeated cyclic tests. Once all cyclic tests were completed, a post-cyclic monotonic shear test was conducted at an axial strain rate of 1% strain/min (0.1 mm/s in this study) (27, 28).
Test Matrix in this Study
Results and Discussion
Permanent Deformation
Permanent deformation under cyclic loading is crucial for assessing the stability of ballasted tracks. Figure 6 presents the permanent deformation from two sets of large-scale triaxial tests. Overall, at all levels of WC, the non-stabilized sample consistently exhibits greater permanent deformation than the geogrid-stabilized sample. Importantly, under fully saturated conditions, the non-stabilized sample failed, while the geogrid-stabilized sample survived.
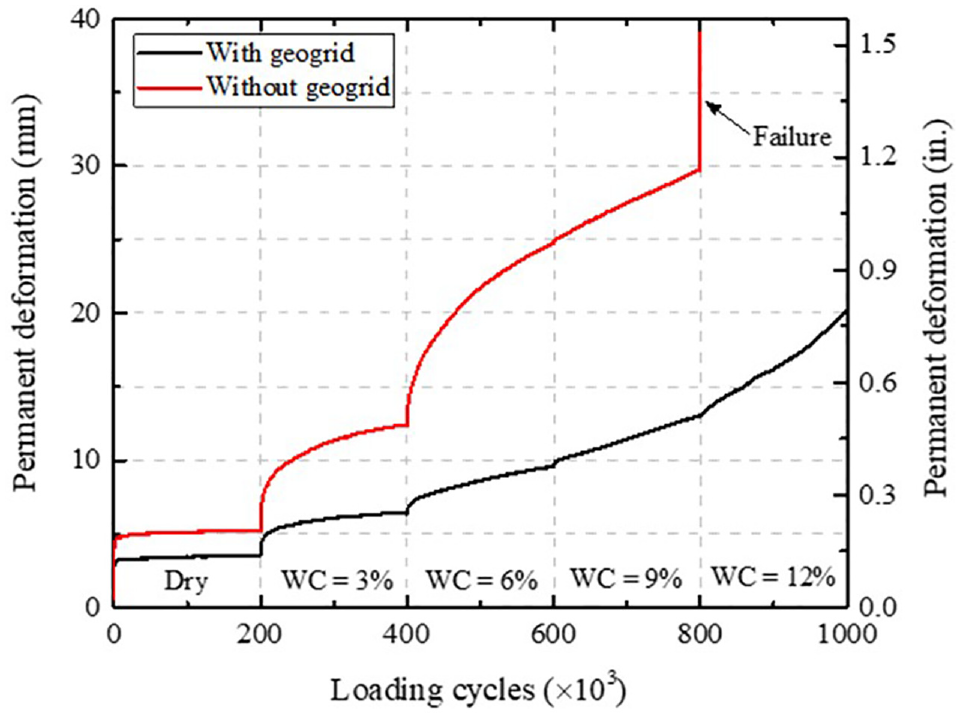
Permanent deformation under simulated progressive rainfall wetting.
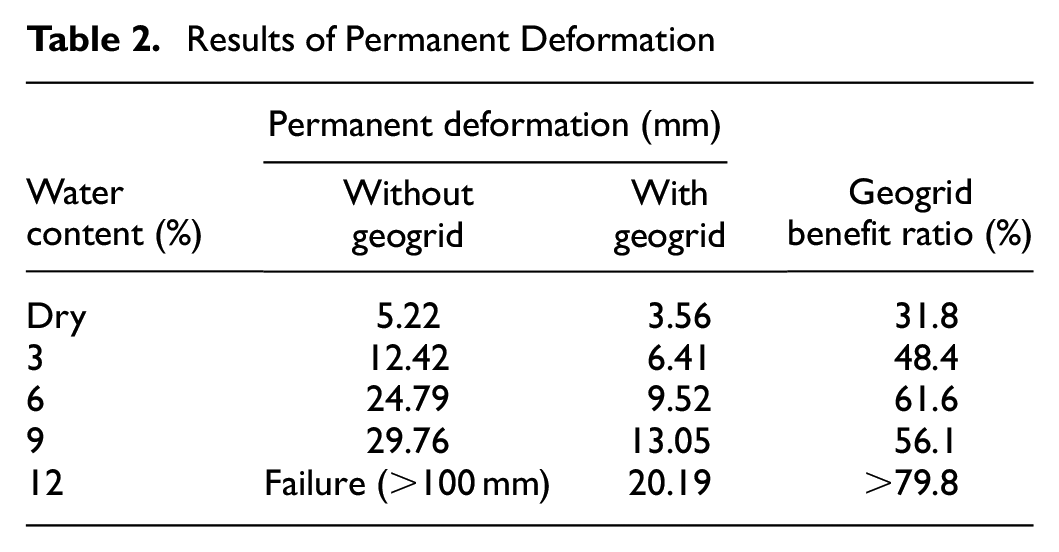
The influence of geogrid on permanent deformation is observable even under dry conditions, with a comparison of 5.22 mm (0.2 in.) for the non-stabilized sample and 3.56 mm (0.14 in.) for the geogrid-stabilized one. At 3% WC, the geogrid-stabilized sample has a permanent deformation of 6.41 mm (0.25 in.), while the non-stabilized sample exhibits 12.42 mm (0.49 in.) of permanent deformation. As WC increases to 6%, the non-stabilized sample deforms to 24.79 mm (0.98 in.), which is nearly double the deformation from the previous test stage. However, with a single-layer geogrid, the permanent deformation only increases 3.11 mm (0.12 in.) when WC rises from 3% to 6%. Further incremental permanent deformations of 4.97 mm (0.19 in.) for the non-stabilized sample and 3.53 mm (0.14 in.) for the geogrid-stabilized sample are recorded when WC increases from 6% to 9%. In contrast, at WC of 12%, the geogrid-stabilized sample remains stable with an increased permanent deformation of 7.14 mm (0.28 in.), while failure occurs in the non-stabilized sample, indicating track instability. For a quantitative comparison of the geogrid stabilization on fouled ballast under progressive rainfall wetting, an index of “geogrid benefit ratio” (GBR) is introduced, defined as the reduced permanent deformation under geogrid stabilization divided by the permanent deformation of non-stabilized sample under the same WC and loading cycles:

where GBR is the index introduced to assess geogrid improvement on permanent deformation;
The permanent deformation and GBR at each loading stage are summarized in Table 2. For example, the GBR is 31.8% in the dry condition, and increases to 61.6% at WC of 6%. When WC is 12%, the non-stabilized sample fails and the corresponding GBR reaches 79.8%. The results suggest that geogrid can effectively reduce the long-term settlement of fouled ballast and maintain the stability of fouled ballasted tracks, especially during rainy seasons.
Results of Permanent Deformation
Resilient Modulus
The resilient modulus is another critical metric to evaluate the mechanical properties of a railroad track. The methodology for determining the resilient modulus from large-scale triaxial cyclic tests is depicted in Figure 7a. Within each loading cycle, the maximum strain corresponding to the peak deviator stress is the sum of the permanent and resilient strains. The resilience of the tested samples is represented in Figure 7b. As WC increases, changes in the resilient modulus are not clearly shown. This is attributed to the observation that despite the increase in WC, the test samples grow denser, corresponding to the increase in permanent deformation. Under dry conditions, even though the geogrid stabilization effect is observable in permanent deformation, the resilient modulus of the geogrid-stabilized sample is found to be slightly lower than that of the non-stabilized sample. This may be caused by different initial particle arrangements of coarse aggregate in the two individual samples during the preparation stage ( 28 ).
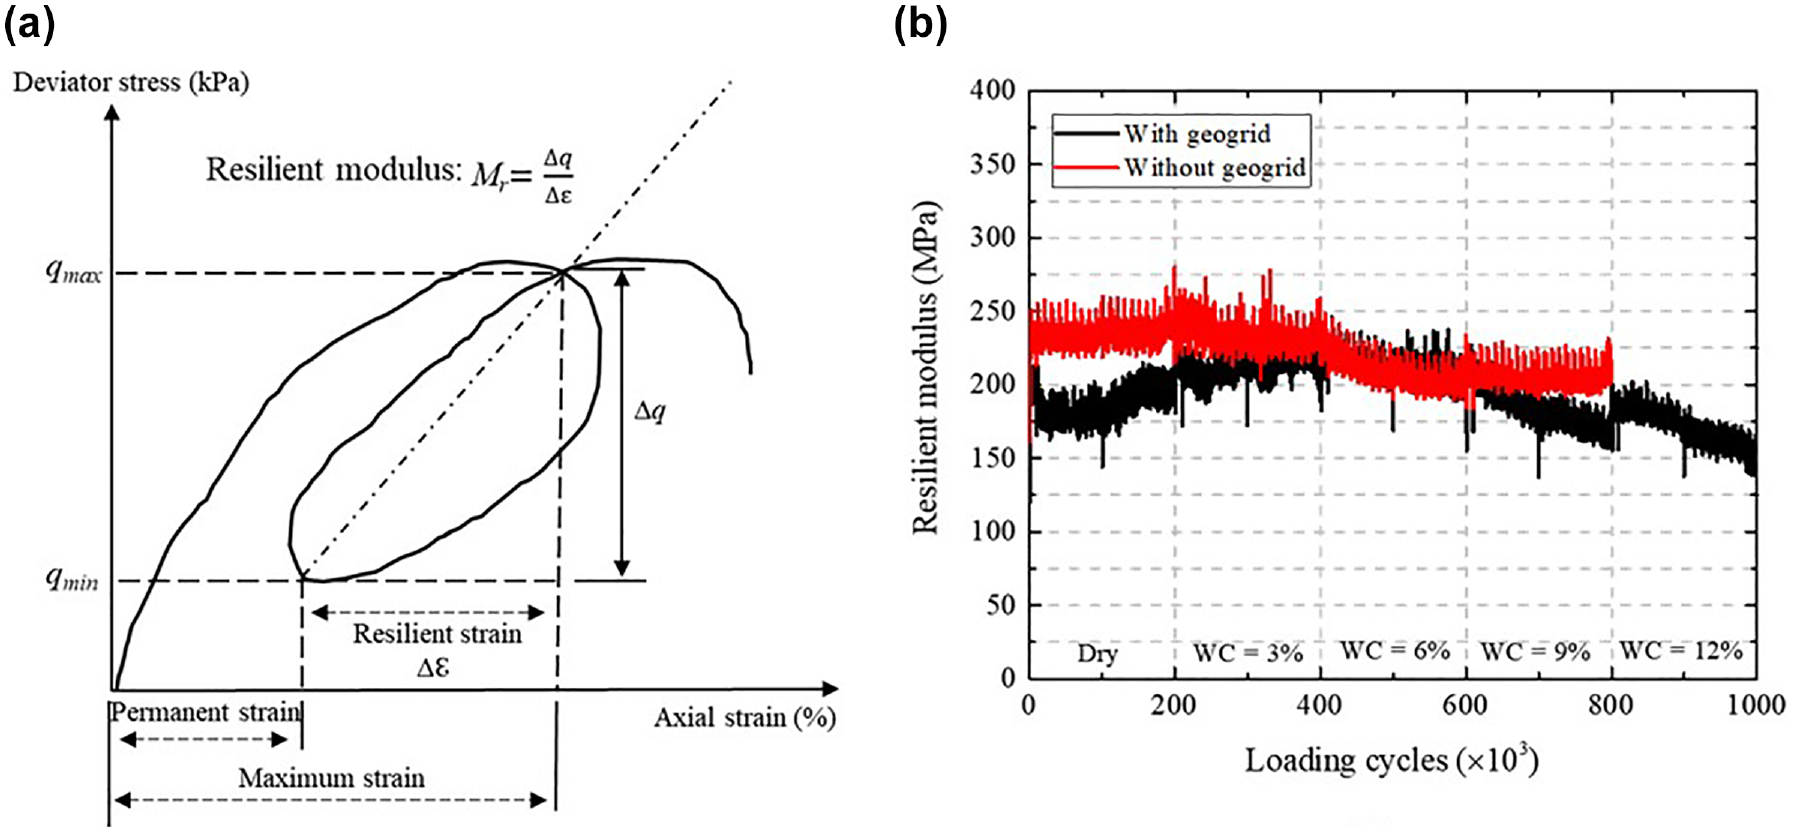
(a) Definition of resilient modulus and (b) observed resilient modulus in tests.
When WC increases from dry condition to 3%, the average resilient modulus of the geogrid-stabilized sample rises to 208.89 MPa. As WC climbs to 6%, the resilient modulus of the geogrid-stabilized sample continues to increase slightly to 209.01 MPa. However, the resilience of the stabilized sample begins to decline when WC exceeds 6% and rises to 12%. For the non-stabilized sample, its resilient modulus continues to decrease under progressive wet conditions, from 232.27 MPa under dry conditions to 205.82 MPa at a WC of 9%. The repeatability of resilient modulus under progressive rainfall wetting has been confirmed in the laboratory for field-collected fouled ballast with different fouling sources and levels, and the results will be found in our forthcoming publications. Resilient modulus under 12% WC is not reported because of the sample failure.
To compare quantitatively changes in resilient modulus with progressive rainfall wetting under repeated loading, the resilient modulus of the two samples at each wetting stage is summarized in Table 3. Although the overall resilient modulus of the geogrid-stabilized sample is slightly smaller than that of the non-geogrid sample, because of the initial particle arrangement, its performance against progressive wetting surpasses that of the non-stabilized sample, especially when WC is within 6%. This observation suggests that geogrid can bolster the resilience of fouled ballast, contributing positively to the preservation of railroad track geometry under rainy conditions.
Results of Resilient Modulus
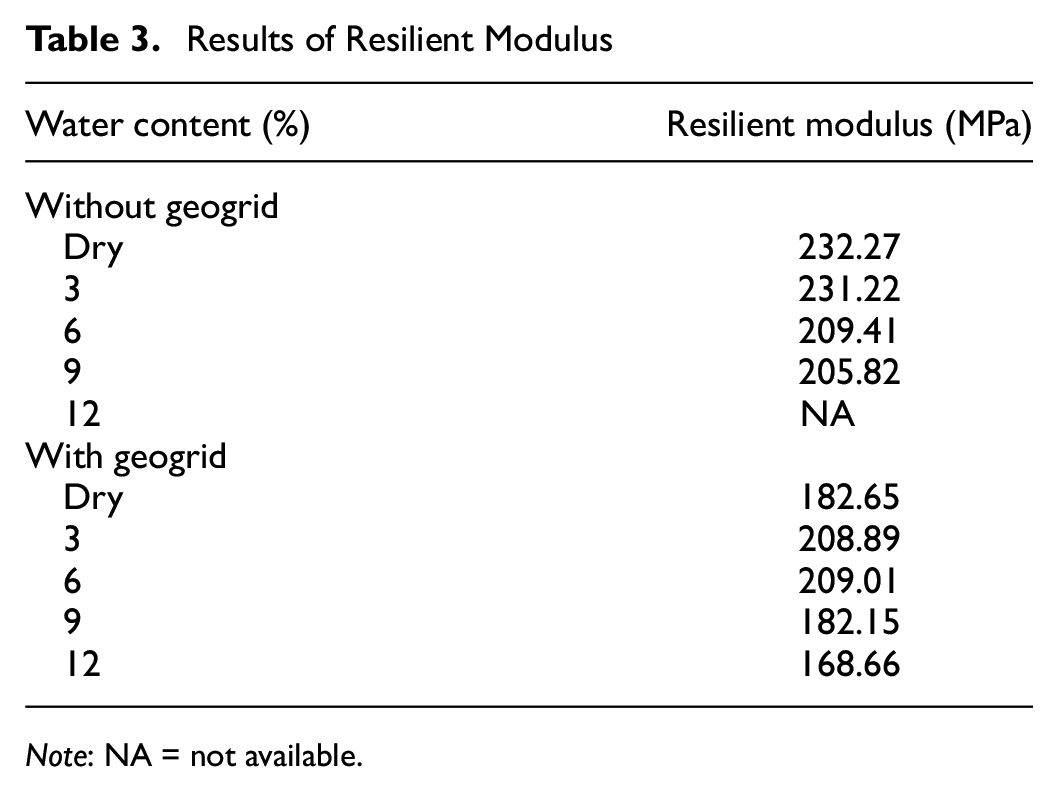
Note: NA = not available.
Permanent Strain and Resilient Strain
As previously mentioned, permanent deformation and resilient modulus are related to permanent strain and resilient strain, respectively. To provide a more comprehensive understanding of the observed permanent deformation and resilient modulus, the distribution characteristics of permanent strain and resilient strain across various WCs under repeated loading are illustrated in Figure 8. The permanent deformation shown in Figure 6 is calculated by the permanent strain multiplied by the triaxial sample height. Except for permanent strain, resilient strain under cyclic loading is a critical parameter affecting resilient modulus. Therefore, the results of axial strain and resilient strain are presented to reveal their relationship with the observed resilient modulus above. In Figure 8a, the maximum strain is the sum of permanent strain and resilient strain, corresponding to the strain under peak deviator stress in each loading cycle. Generally, the evolution of permanent strain and maximum strain follow trends similar to those discussed in Figure 6. For the geogrid-stabilized sample, both permanent strain and maximum strain are smaller than those in the non-geogrid sample, indicating the effectiveness of geogrid on both permanent strain and maximum strain simultaneously. Figure 8b presents the resilient strain under varying WCs. Overall, the resilient strains for both the geogrid-stabilized and non-stabilized samples are relatively similar, but their evolution patterns under progressive rainfall wetting differ. For the non-stabilized sample, resilient strain continuously increases with rising WC. Based on the definition of resilient modulus in Figure 7a, the deviator stress remains consistent as the cyclic loading profile does not change, and the resilient strain continues to increase with progressive wetting. As a result, the resilient modulus for the non-stabilized sample should continually decrease, which explains the observed resilient modulus in Figure 7b. For the geogrid-stabilized sample, the resilient strain initially decreases when WC is below 6% and then progressively increases as more water is injected into the sample. This pattern aligns well with the trend shift of the resilient modulus for the geogrid-stabilized sample. This insight suggests that the effect of geogrid on resilient modulus can be traced to the behavior of resilient strain.
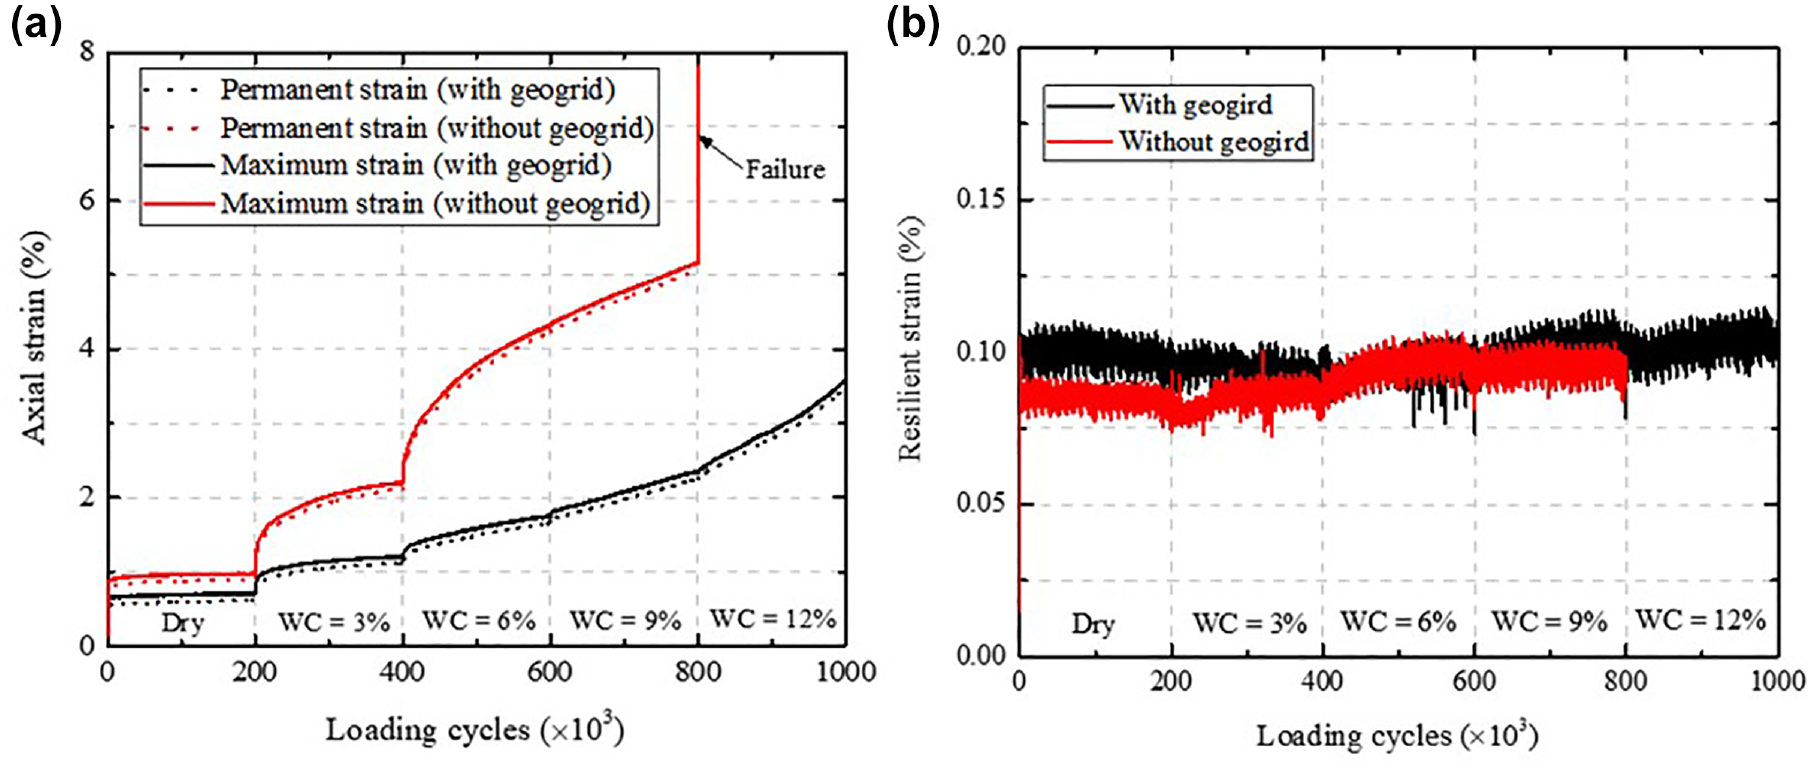
(a) Axial strain varied with simulated progressive rainfall wetting and (b) observed resilient strain in tests.
Shakedown Behavior
Shakedown behavior not only indicates the stability status of the tested samples, but it also influences the observed permanent deformation ( 30 ). Establishing the limit loading cycles for shakedown behavior can provide valuable insights for track design and maintenance. Nguyen and Indraratna ( 21 ) neglected the permanent strain during the initial 10 loading cycles when studying the wetting effect on mud-fouled ballast. However, this study has found that the strain within these first 10 loading cycles can be helpful in better understanding shakedown behavior. As depicted in Figure 9a, the permanent strain experiences a dramatic development within the first 10 loading cycles, followed by a clear drop in the growth rate after these cycles. It is evident that the 10th loading cycle is the turning point for the permanent strain for both geogrid-stabilized and non-stabilized samples. The proportion of permanent strain within the first 10 loading cycles accounts for 64.11% of the total for the stabilized sample and 53.93% for the non-stabilized sample during the entire dry loading condition.
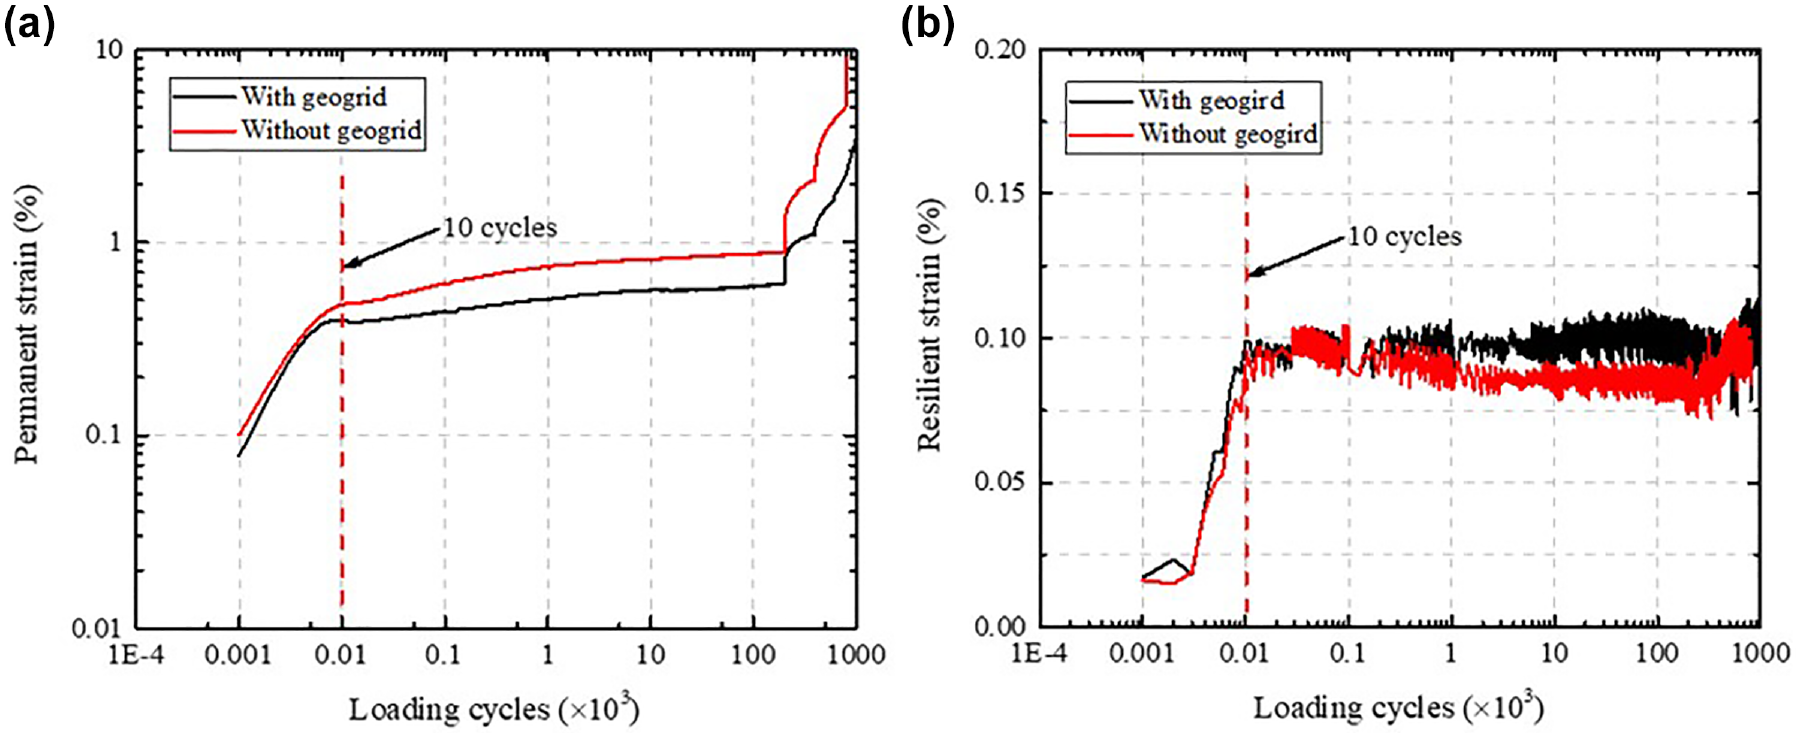
(a) Shakedown behavior from permanent strain and (b) shakedown behavior from resilient strain.
Conversely, resilient strain exhibits a different growth pattern, as shown in Figure 9b. In the first 10 loading cycles, the resilient strain rapidly increases to its peak point and then remains relatively constant for subsequent loading cycles. The 10th loading cycle also serves as a turning point for resilient strain. Given the definition in Figure 7a, it is reasonable to conclude that the resilient modulus stabilizes within the first 10 loading cycles. These observations suggest that shakedown behavior concludes within the initial 10 loading cycles, leading to the stabilization of the resilient strain and resilient modulus post these cycles. However, the applicability of this conclusion for samples with different densities, particle size distributions, or compaction methods requires further investigation.
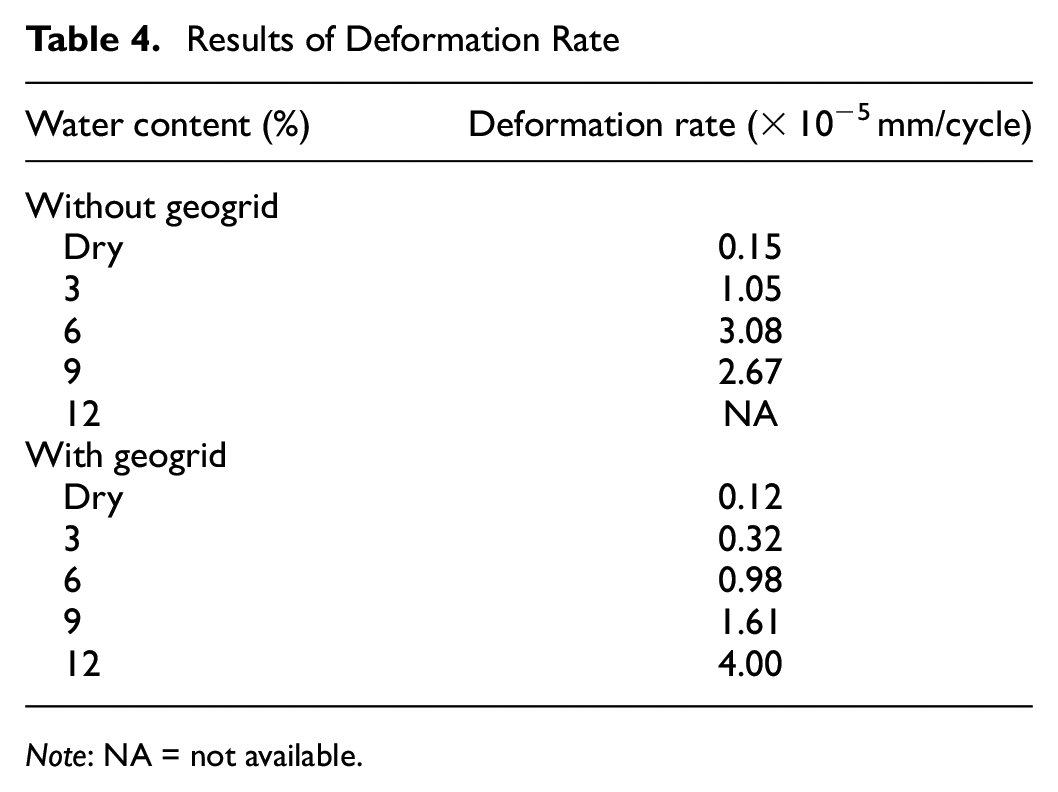
Deformation Rate
The deformation rate, compared with permanent deformation and resilient modulus, provides a more comprehensive evaluation of the growth trend of track settlement. It also aids in predicting track settlement under millions of train-loading cycles or large track tonnages. In this study, we define the deformation rate as the average deformation value over the last 100,000 loading cycles of each test, as illustrated in Figure 10a. The calculated deformation rate is presented in both Figure 10b and Table 4. The results demonstrate that the deformation rate increases with rising WC. Under the same WC conditions, the deformation rate for the sample with geogrid is consistently much lower than that without geogrid. Compared with other wet conditions, the deformation rates in the dry condition are most similar for the two samples. However, once a 3% WC is introduced, the deformation rate for the non-stabilized sample suddenly increases about seven times, while a deformation rate of less than triple is observed in the geogrid-stabilized sample.
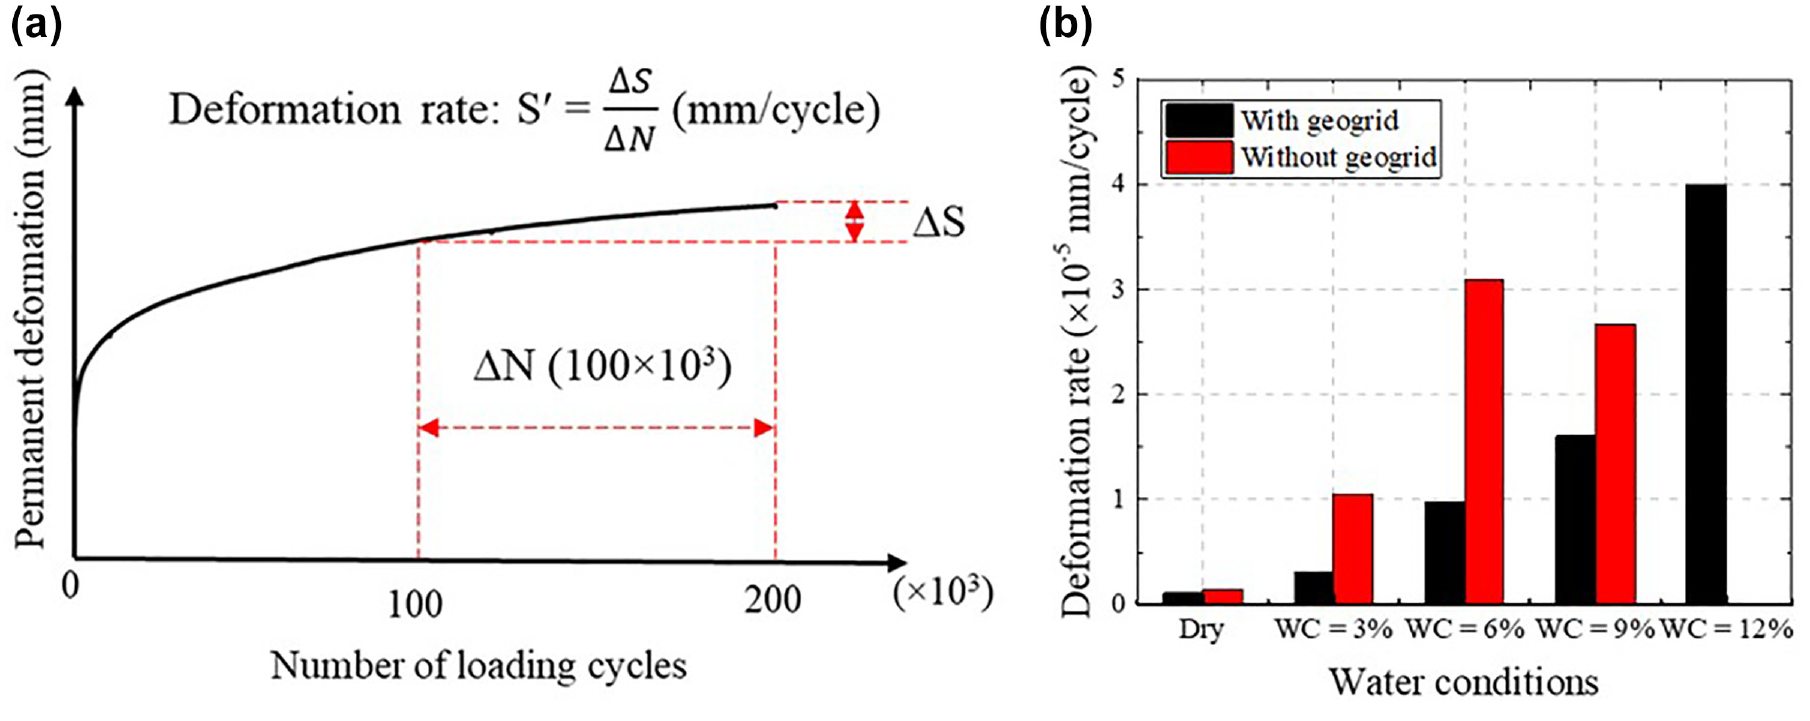
(a) Definition of deformation rate and (b) observed deformation rate in tests.
Results of Deformation Rate
Note: NA = not available.
When WC reaches 6%, the deformation rate of the non-stabilized sample is more than three times that of the geogrid-stabilized sample. If the sample reaches saturation, the sample without geogrid loses its stability while the stabilized sample still maintains its stability. The observed slight drop in the deformation rate for the non-stabilized sample when WC increases from 6% to 9% could be attributed to loading-induced densification. These findings indicate that geogrid can significantly reduce track settlement, especially under high WC conditions, and maintain track stability, even in fully saturated conditions.
Post-Cyclic Monotonic Testing
To evaluate shear strength following the cyclic loading test, a post-cyclic monotonic shear test is conducted on the geogrid-stabilize sample, as demonstrated in Figure 11. Despite the saturation of the sample, the shear strength (deviator stress) is approximately 1,000 kPa because of the presence of the geogrid. It is worth noting that there are no shear results available for the case without geogrid, as this sample had already failed at WC of 12%. Figure 11b displays the geogrid failure pattern after the post-cyclic monotonic test, with the broken rib within the geogrid circled in red, illustrating the shearing zone between the geogrid and the failed sample. For the geogrid-stabilized sample, the circled geogrid zone plays a significant role in improving bearing capacity and enhancing strength. This is because a portion of the external loads are distributed across these geogrid ribs. In contrast, for the non-stabilized sample, all the external loads are exerted directly on the fouled ballast materials. This observation provides valuable insights for understanding the mechanism of geogrid stabilization.
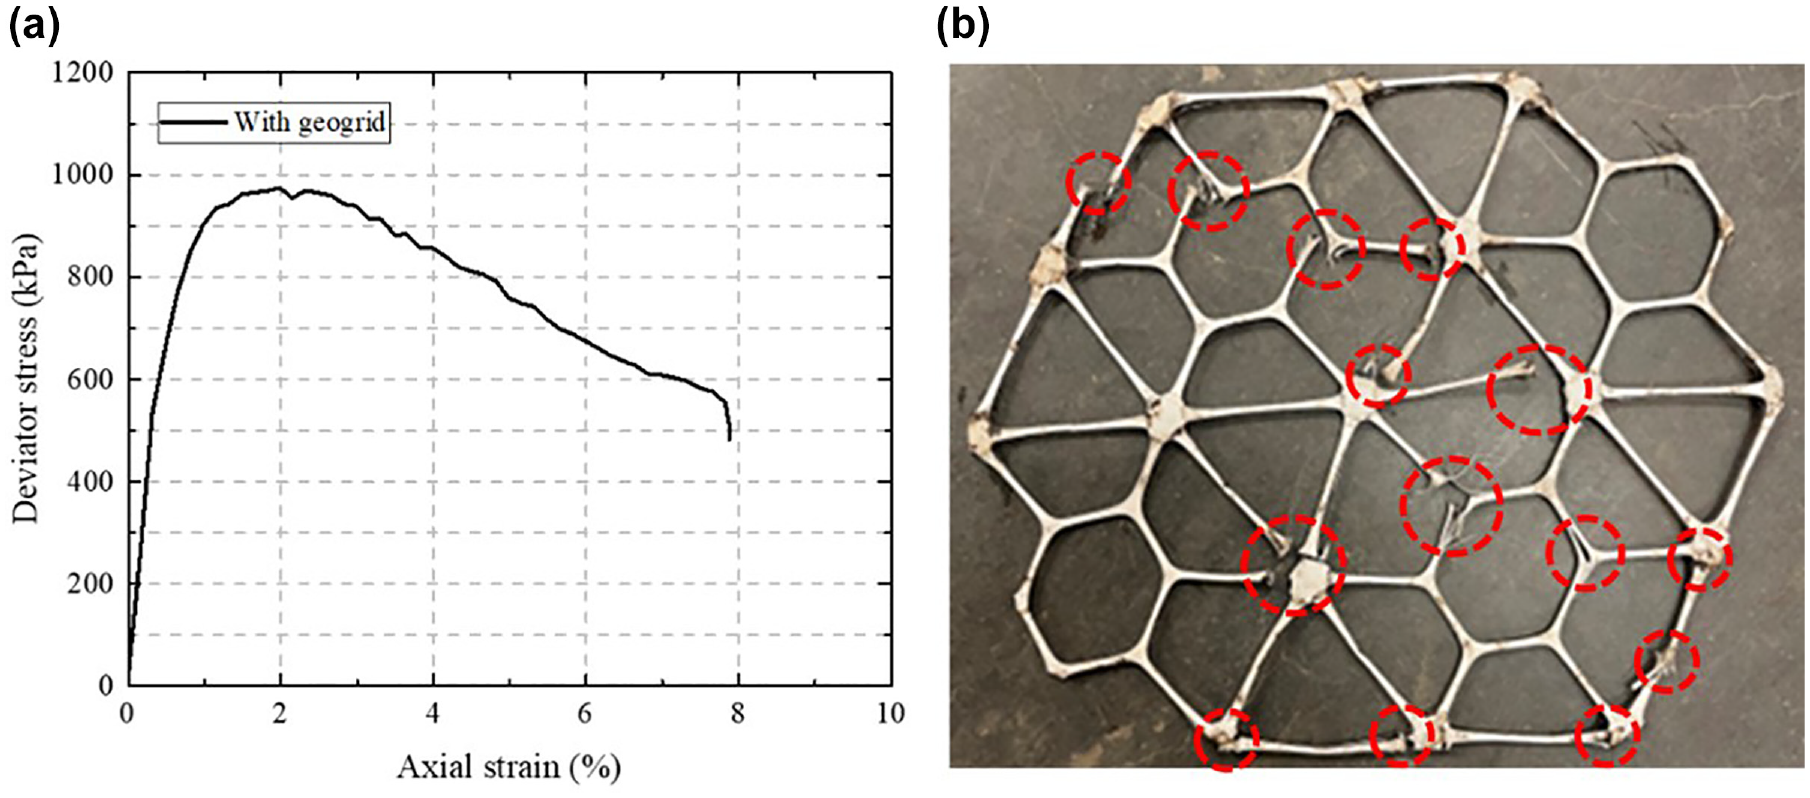
(a) Post-cyclic monotonic shear testing for the sample with geogrid and (b) geogrid failure pattern.
Conclusions
This study investigates the performance of geogrid-stabilized fouled ballast under cyclic loading, utilizing large-scale triaxial testing. Fouled ballast material directly collected from Class I railroad revenue track is used, instead of using single-sourced fouling fines manually-mixed into clean ballast aggregates. Both non-stabilized and geogrid-stabilized fouled ballast samples were tested consistently under progressively increasing wetting. The key findings from this study can be summarized as follows:
A direct correlation exists between increasing WC and the permanent deformation of fouled ballast. An index named “geogrid benefit ratio” (GBR) is introduced for quantitative assessment of geogrid stabilization. The inclusion of a single-layer geogrid could achieve GBR of 31.8% under dry condition and 61.6% at WC of 6%.
Under the fully saturated condition, the sample without geogrid fails, and the corresponding GBR reaches 79.8%. The sample stabilized with a single-layer geogrid sustains a shear strength of approximately 1,000 kPa, thereby averting sample failure.
As WC progressively increases, the resilient modulus of the non-stabilized sample gradually decreases because of the slow increase of resilient strain. However, the resilient modulus of the geogrid-stabilized sample initially increases, then decreases, a trend that mirrors the behavior of its resilient strain.
In both non-stabilized and geogrid-stabilized samples, the shakedown behavior completes within the initial 10 loading cycles, and both resilient strain and resilient modulus stabilize after these 10 loading cycles.
The deformation rate significantly increases with rising WC, but a single layer of geogrid efficiently mitigates the rate of deformation growth.
It should be noted that this study focuses on geogrid stabilization on fouled ballast under simulated progressive rainfall wetting using large-scale triaxial tests. The distribution characteristics of water within the tested sample and the fouling level, limited to FI 23 in this study, are not considered. Further research could explore the effect of water distribution and varying FI levels on the permanent deformation and resilient behavior of fouled ballast with and without geogrid.
Footnotes
Acknowledgements
The authors appreciate Tensar International, a division of CMC, for providing the geogrid for testing. The authors also gratefully appreciate the valuable guidance and advice on improving this manuscript from Dr. Mark Wayne at Tensar International.
Author Contributions
The authors confirm contribution to the paper as follows: study conception and design: S. Huang, Y. Qian; data collection: S. Huang; analysis and interpretation of results: S. Huang, Y. Qian; draft manuscript preparation: S. Huang, Y. Qian. All authors reviewed the results and approved the final version of the manuscript.
Declaration of Conflicting Interests
The author(s) declared no potential conflicts of interest with respect to the research, authorship, and/or publication of this article.
Funding
The author(s) disclosed receipt of the following financial support for the research, authorship, and/or publication of this article: This research is funded by the Federal Railroad Administration (FRA), grant number 693JJ621C000007. MxV Rail and BNSF Railway have provided guidance and support.
The opinions expressed in this paper are solely those of the authors and do not represent the opinions of the funding agencies.