
Abstract
This paper explores user/nonuser perceptions of bus transit attributes in Melbourne, Sydney, and South East Queensland (SEQ). It aims to understand the relative importance and performance of various bus transit attributes and how the assessment varies according to city, socioeconomic cohort, and user/nonuser groups. Primary data were collected via a screening survey, enabling a very large sample (n = 13,537) and a smaller, more representative subset collating more detailed survey data (n = 2,420). Personal safety stood out as a key bus transit attribute of importance in all cities. Specifically, safety when traveling on the bus during the daytime and at night, and safety getting to and from the bus stop were ranked as very important bus transit attributes. Some findings differed by region: service levels, punctuality, frequency, and timetable adherence (reliability) were rated relatively high in importance but low in performance in Sydney and Melbourne compared with SEQ. This suggests that Melbourne and Sydney might require service-level improvements more immediately than SEQ. Implications for policy for each Australian metropolitan region (Sydney, Melbourne, and SEQ) are later discussed.
Bus services dominate transportation coverage of urban areas in almost all cities worldwide. However, there is a significant bias and positive preference toward rail-based urban transit in the perception of both users and nonusers of transit ( 1 ). This does not help the case for improvement in bus services. For over 70% of the Australian population, buses are the only form of public transport within walking distance ( 2 ). Despite the high level of accessibility, buses are often an underutilized and underappreciated mode of transport ( 3 ). Therefore, what drives user and nonuser perceptions of bus services and how does this vary between cities and between different groups of the population?
This paper aims to explore both user and nonuser perceptions of bus service attributes in Melbourne, Sydney, and South East Queensland (SEQ). A major motivation for the research is to understand what features of services are considered more important and to see how this varies within cities, by socioeconomic cohorts, and also between user and nonuser groups.
The paper is structured as follows: a short literature review, an outline of the research methodology, presentation of results, discussion of key findings and policy implications, and finally the conclusion.
Literature Review
Published research literature was examined to identify bus service attributes that can influence perceptions and use of services. A summary of key findings is given below.
Service Frequency and Span
Service frequency was identified to be the most important attribute influencing ridership in an international study of factors affecting bus ridership ( 4 ) and is confirmed by many studies in the field ( 5 – 7 ). A range of studies also identified that greater user satisfaction across various sociodemographic cohorts was linked with bus services that operated more frequently ( 6 , 7 ).
Islam et al. ( 7 ) and Güner ( 8 ) also suggest service span (length of hours operated) is another important attribute for user satisfaction, although both studies note it has a lesser effect on bus service satisfaction compared with service frequency.
Punctuality
Han et al. ( 9 ) define service punctuality as the amount of delay in arrival time, operational speed of the bus, and bus stop waiting time. Many studies have found a positive correlation between service punctuality and user satisfaction levels ( 4 , 10 ).
Directness
Service directness resulting in competitive travel times is another important factor that influences bus service patronage. De Oña et al. ( 11 ) noted service directness played an important role in fostering an attractive bus service. Direct services can reduce travel times and ensure the time taken for a given journey is more competitive compared with shorter journey times by private vehicle. Jansson ( 12 ) identified that straightening out routes (to make services quicker and more direct) can offer travel time savings in the order of 30%.
Accessibility
Accessibility to, from, and between services had mixed effects on ridership. Clayton et al. ( 10 ) found that frequent and direct services were preferable, and attracted higher patronage levels compared with services that were closer to a user’s place of origin or destination.
Knowledge and Information
Legibility of the network or the ease with which it can be understood by users and potential users plays a role in improving bus service attractiveness ( 13 ). Scott et al. ( 14 ) highlighted the effect knowledge of a public transport system has on user choice. This suggests that simple, clear, and easy-to-understand public communication tools are needed to promote bus service awareness. Devney ( 5 ) identified the importance of branding, distinct color schemes, logos, signage, and information display boards in improving awareness and attractiveness of services.
Comfort
Bus users’ sense of comfort was found to be an important quality affecting the perception of bus services. Van Lierop et al. ( 6 ), Islam et al. ( 7 ), and Carreira et al. ( 15 ) identified factors such as availability of a seat, ride quality, crowding, and overall commuting experience as highly influential in affecting user satisfaction. Higher levels of comfort can also improve users’ perception of operational characteristics such as bus speed and journey time. Negative perceptions of services can be mitigated through comfort-related improvements including installing weather protection features, provision of seating, and ensuring cleanliness at bus stops.
Safety and Security
The sense of security, both with regard to road safety and personal security, was found to influence an individual’s perception of bus service quality ( 14 ). Negative perceptions of personal safety on public transport were found to be a major concern in both Australian and international cities ( 16 ).
Methodology and Analytical Framework
The research method is outlined in Figure 1. Key components are a primary survey of both bus users and nonusers in Melbourne, Sydney, and SEQ, and an analysis of the survey results by socioeconomic, city, and user/nonuser groups. An importance–performance analysis was undertaken to assess the evaluation of several bus service attributes ( 16 ).
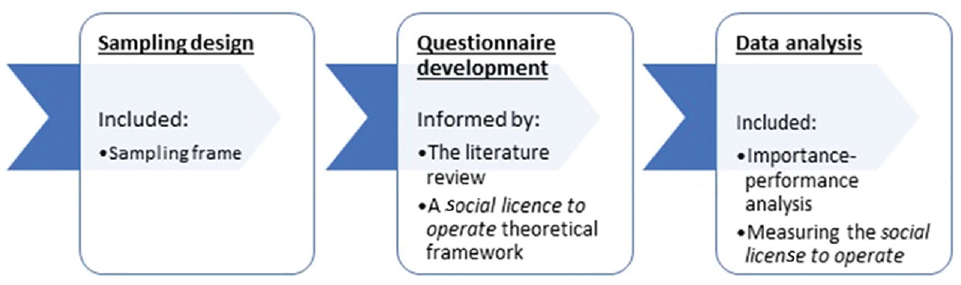
Research method.
Sampling Design
The survey aimed to achieve a representative sample through random sampling within a frame structured by age, income, and gender. The sampling design including the following components:
Target population (population of interest):
Bus users and nonusers living in metropolitan Melbourne, metropolitan Sydney, and SEQ
Sampling frame (accessible target population for the study):
The Institut Public de Sondage d’Opinion Secteur, a commercial market research company, provided a panel of registered survey respondents living in the cities of interest
Sampling (method of drawing sample from the frame):
Bus users and nonusers
As far as possible, to be representative of age, income, and gender
Sample (participants selected for the study):
A minimum of 400 bus users and 400 nonusers for each geographic region of interest
A screening survey first covered a much larger number of responses including the participants’ attitudinal responses to a range of service attributes. These results are reported separately. Respondents who met the sampling criteria were selected to complete a longer and more detailed survey and, again, these results are reported separately. Attachment A presents the sampling approach in more detail.
Questionnaire Development
The questionnaire was informed by the literature review and explored public transport use, attitudes toward buses, and sociodemographic attributes. An importance–performance analysis was adopted to explore perceptions. This rates issues from both a performance and an importance perspective to isolate more significant issues from the respondents’ perspective. This technique is common in all industry performance analysis ( 17 ) and is commonly adopted in urban transit research ( 16 ). A 7-point Likert scale was used to measure attitudes toward buses and importance–performance. Key dimensions and scoring ranged from -3 for strongly disagree/extremely unimportant to +3 for strongly agree/extremely important. A score of 0 would indicate neither agree nor disagree/neither important nor unimportant.
Analysis Approach
Two key approaches were adopted:
Disaggregate attribute analysis by ○ Sociodemographic characteristics (age, gender, occupation, and income) ○ Transport habits (bus use frequency, frequency of use of other public transport modes, possession of a driving license, and access to a car) ○ Attitudes toward buses
Importance–performance analysis (perceived importance of specific service attributes and the perceived performance of buses in their area in relation to a specific service attribute). Average values of both performance and importance are adopted in each case. No weighting of cases is undertaken.
The survey data were analyzed using various statistical analysis approaches. This enabled investigation of whether statistically significant relationships or differences between groups existed. Post-hoc analysis was performed to identify specific groups that have significant differences at a 95% confidence interval. The statistical analysis involved Chi-square tests and analysis of variance (ANOVA) tests.
Results
This section outlines the key findings from the survey data analysis. The first section focuses on the insights from the screening survey (n = 13,537), and the second section presents the analysis of the detailed survey (n = 2,420).
Screening Survey Results
Demographic Analysis
There were a similar number of respondents from Melbourne (n = 4,789) and Sydney (n = 4,878), but a smaller number of respondents from SEQ (n = 3,870). Around 8% of screening survey respondents did not own or have access to a car, aligning with census figures on household car ownership. This indicates the sample relevance and highlights that although car ownership is prevalent in Australia, one in every 10 households does not own a car; these households are heavily reliant on public transport such as bus services.
Attitudes Toward Buses
The screening survey included questions on respondents’ attitudes toward and perceptions of buses. A statistical test (one-way ANOVA) was performed to determine whether sociodemographic characteristics were significantly linked with differences in attitudes toward buses. A post-hoc test was used to explore these differences in detail. Table 1 summarizes the ANOVA results.
Statistical Differences between the Groups using ANOVA
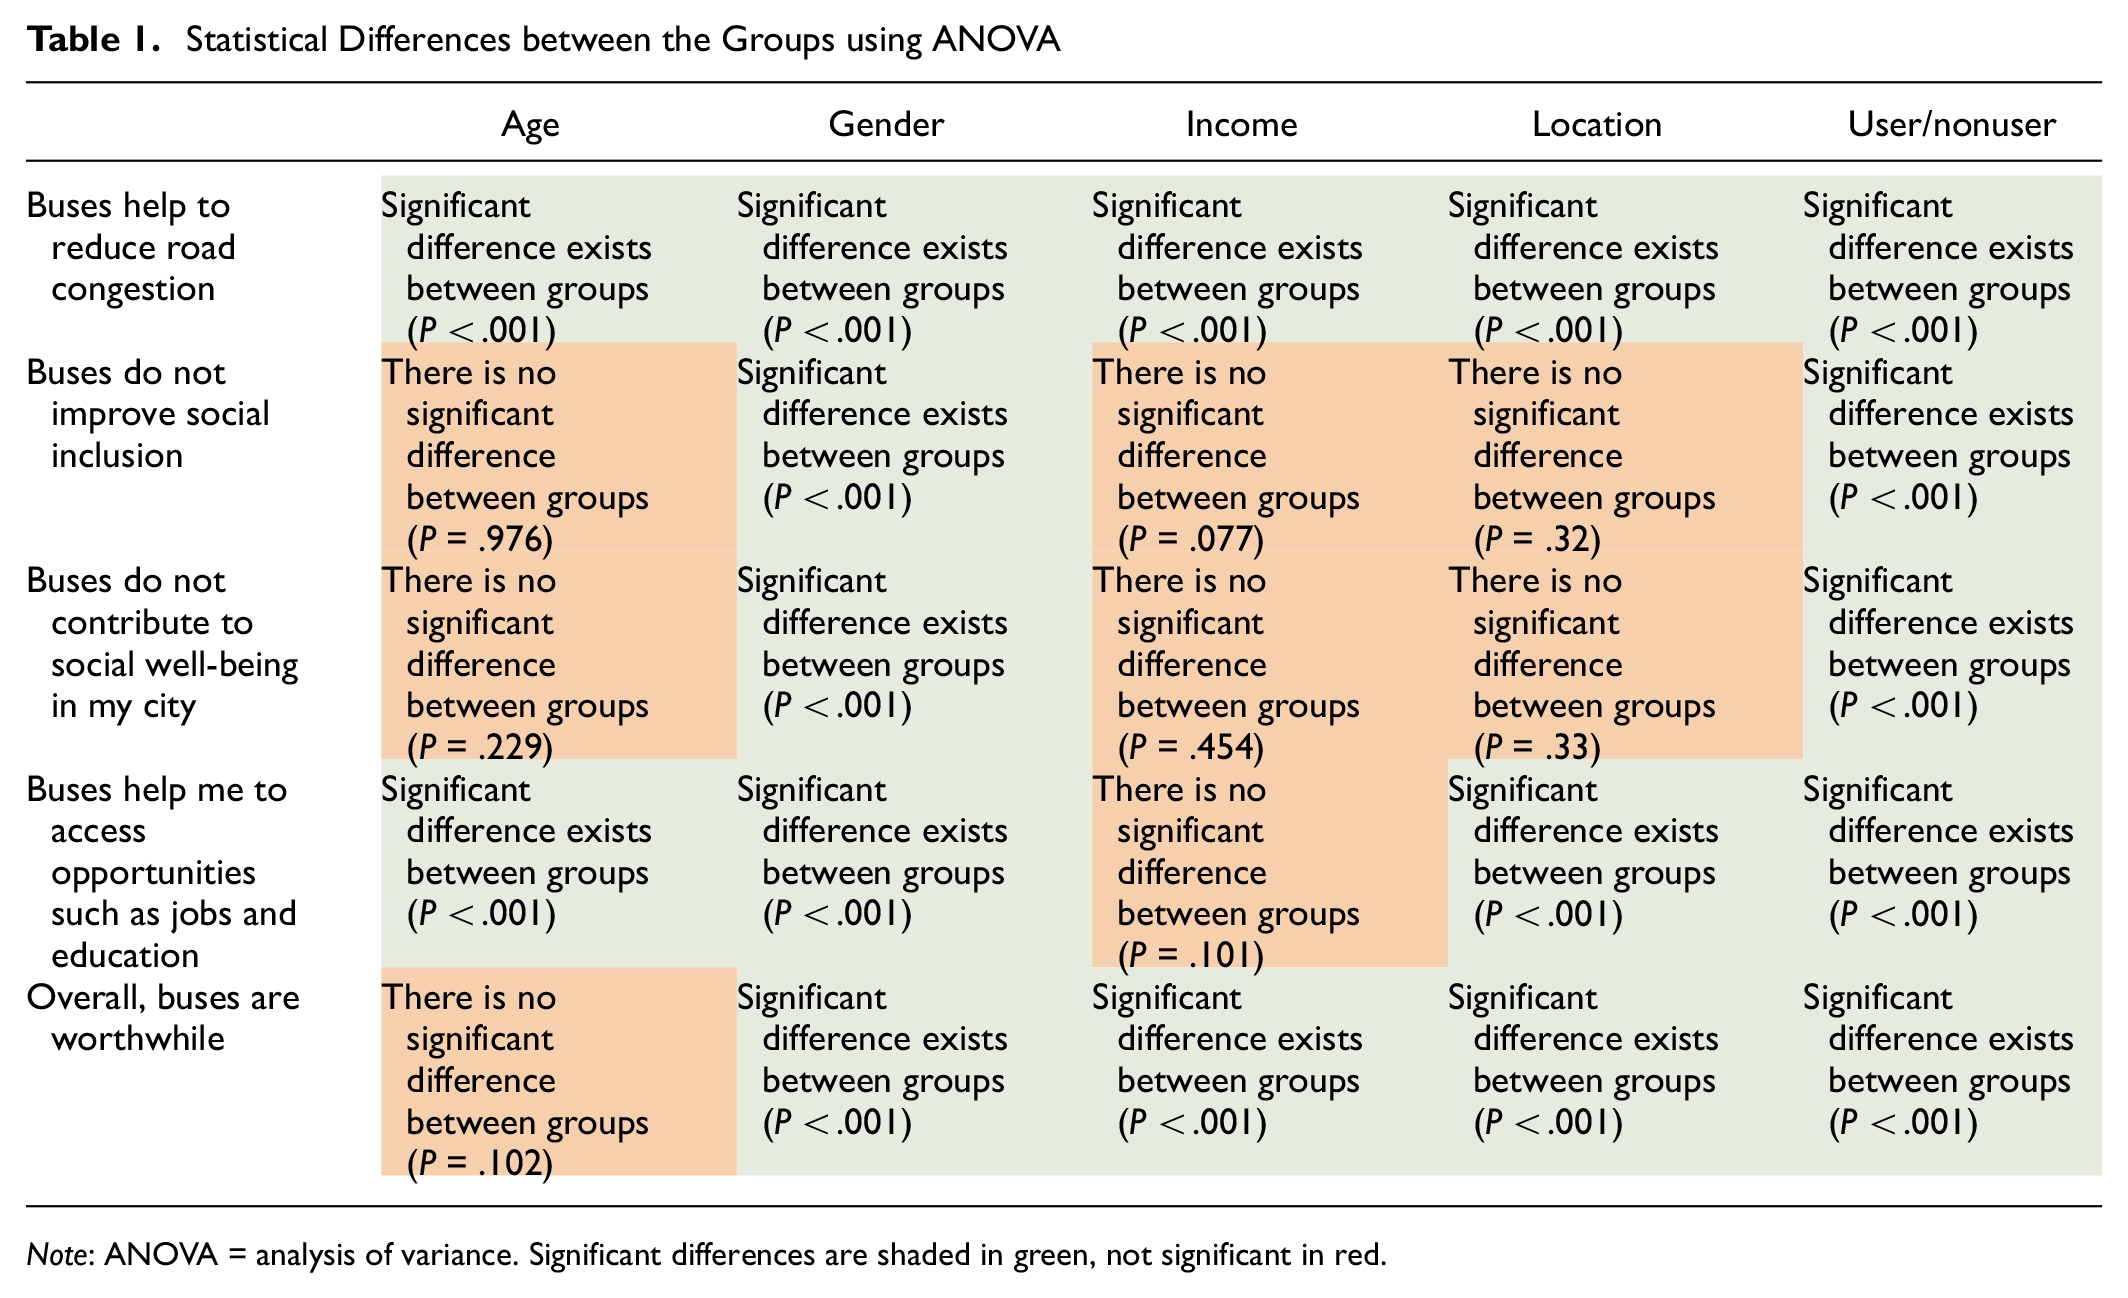
Note: ANOVA = analysis of variance. Significant differences are shaded in green, not significant in red.
The aggregated mean scores for each statement are outlined below from highest to lowest (from greatest level of agreement to the least):
“Overall, buses are worthwhile” (mean = 1.60)
“Buses help to reduce road congestion” (mean = 1.05)
“Buses help me to access opportunities such as jobs and education” (mean = 0.60)
“Buses do not improve social inclusion” (mean = −0.27)
“Buses do not contribute to social well-being in my city” (mean = −0.50)
The results indicate that although respondents generally believe that buses have a positive role in their cities, they are less likely to believe that buses have a social equity function.
Gender in relation to bus use was found to result in statistically significant differences in responses to all five of the above statements. Men were more likely to believe that buses contribute to reducing congestion, whereas women were more likely to believe that buses play a social equity role, including improving access to opportunities and improving social well-being and inclusion. Bus users were significantly more likely to believe that buses play a positive role, scoring all the statements more highly than nonusers.
Age significantly influenced responses to the statements on congestion reduction and access to opportunities. Respondents aged 35 and over were more likely to agree that buses help to reduce congestion, whereas respondents aged 18 to 34 were more likely to agree that buses improve access to opportunities.
Income significantly influenced responses to statements on congestion reduction and the worthwhileness of buses. Higher-income groups were more likely to believe that buses are worthwhile and help to reduce traffic congestion. Higher-income groups are more likely to work and, thus, commute and better understand congestion problems and the value of buses in addressing these issues.
Location significantly influenced responses to the statements on congestion reduction, access to opportunities, and the worthwhileness of buses. Respondents from Sydney and SEQ were more likely to believe that buses contribute to reducing congestion, improve access to opportunities, and are worthwhile overall. It is possible that negative attitudes toward buses are contributing to a lower bus mode share in Melbourne compared with Sydney and SEQ.
Detailed Survey Results
A total of 2,420 respondents were selected for the second stage of the survey based on the sampling criteria. In total, 1,555 men and 860 women participated in the detailed survey. Because of the disproportionate difference in the number of male and female respondents, responses were weighted by gender. Responses were also weighted by age and income to emulate population distributions. There were a similar number of respondents from Melbourne (n = 801), Sydney (n = 812), and SEQ (807). Table 2 provides a summary of the demographic composition of the respondents selected for the detailed survey.
Demographics of the Respondents in the Three Locations
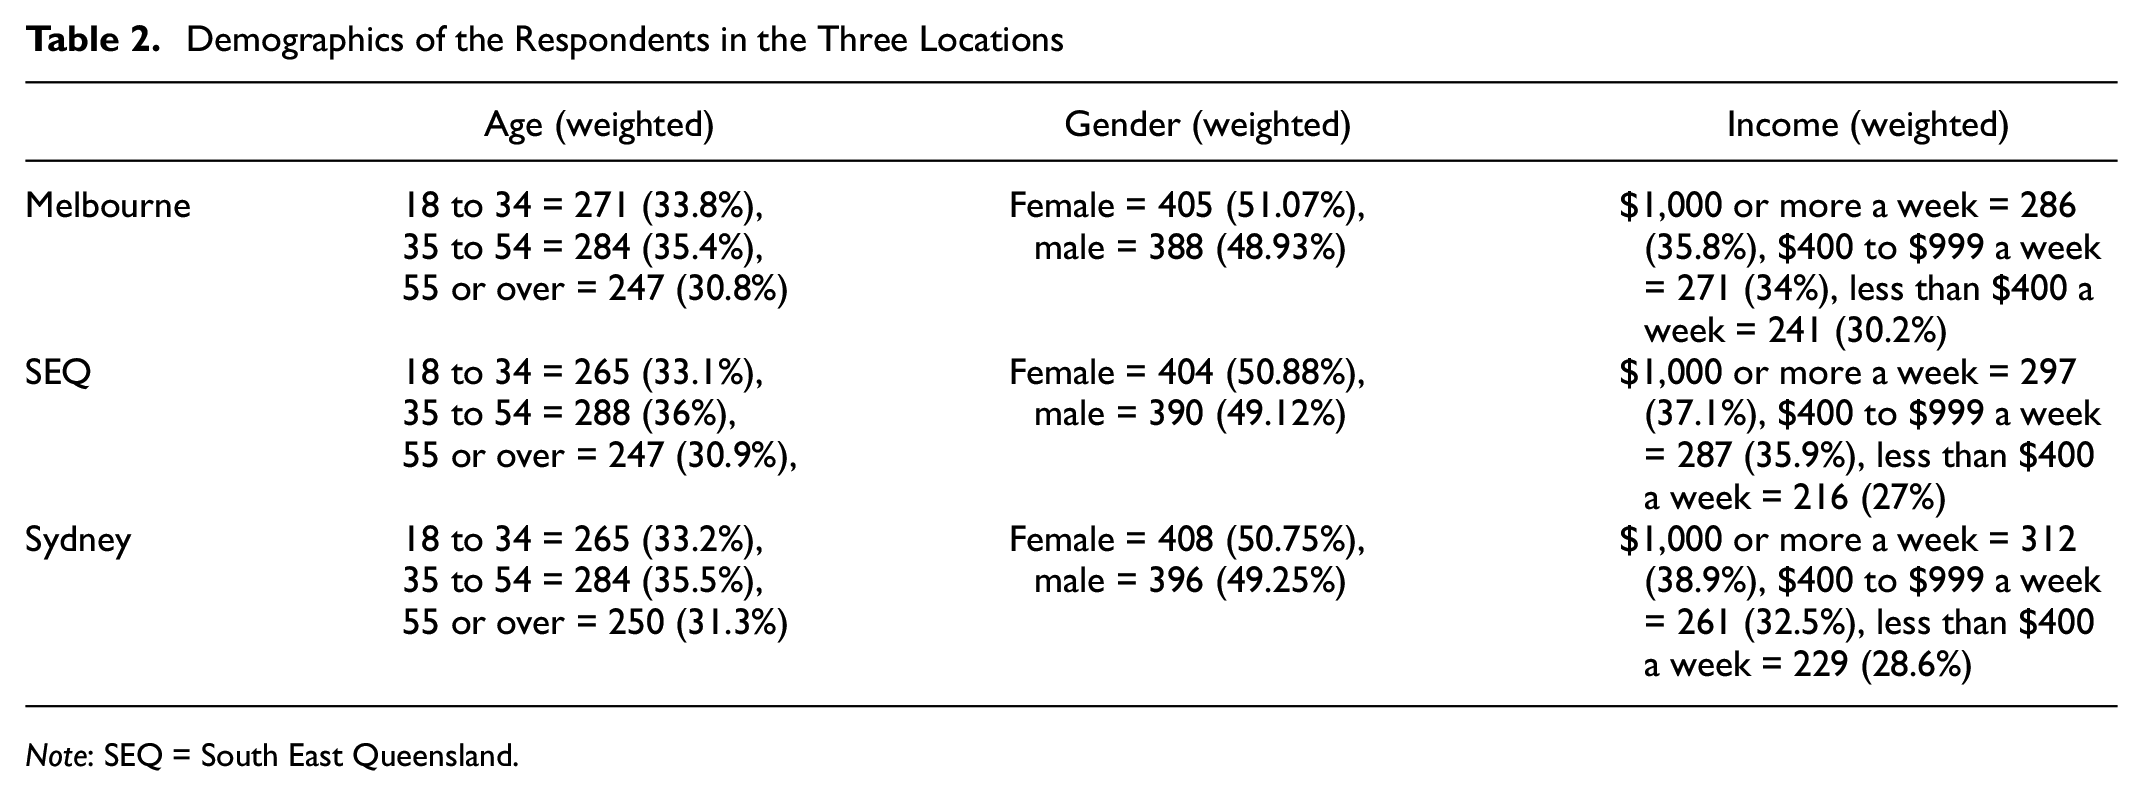
Note: SEQ = South East Queensland.
Overall Importance–Performance Analysis Results
An importance–performance analysis was performed on the detailed survey responses. This aimed to identify the perceived importance and the perceived performance of 23 bus service attributes (see items column in Table 3). The Quadrant column in Table 3 identifies sectors of the importance performance graphic (Figure 2) notably highlighting Quadrant A where importance is above average and performance is below average.
Bus Service Attributes and Importance–Performance Analysis Summary with Overall Average Scores
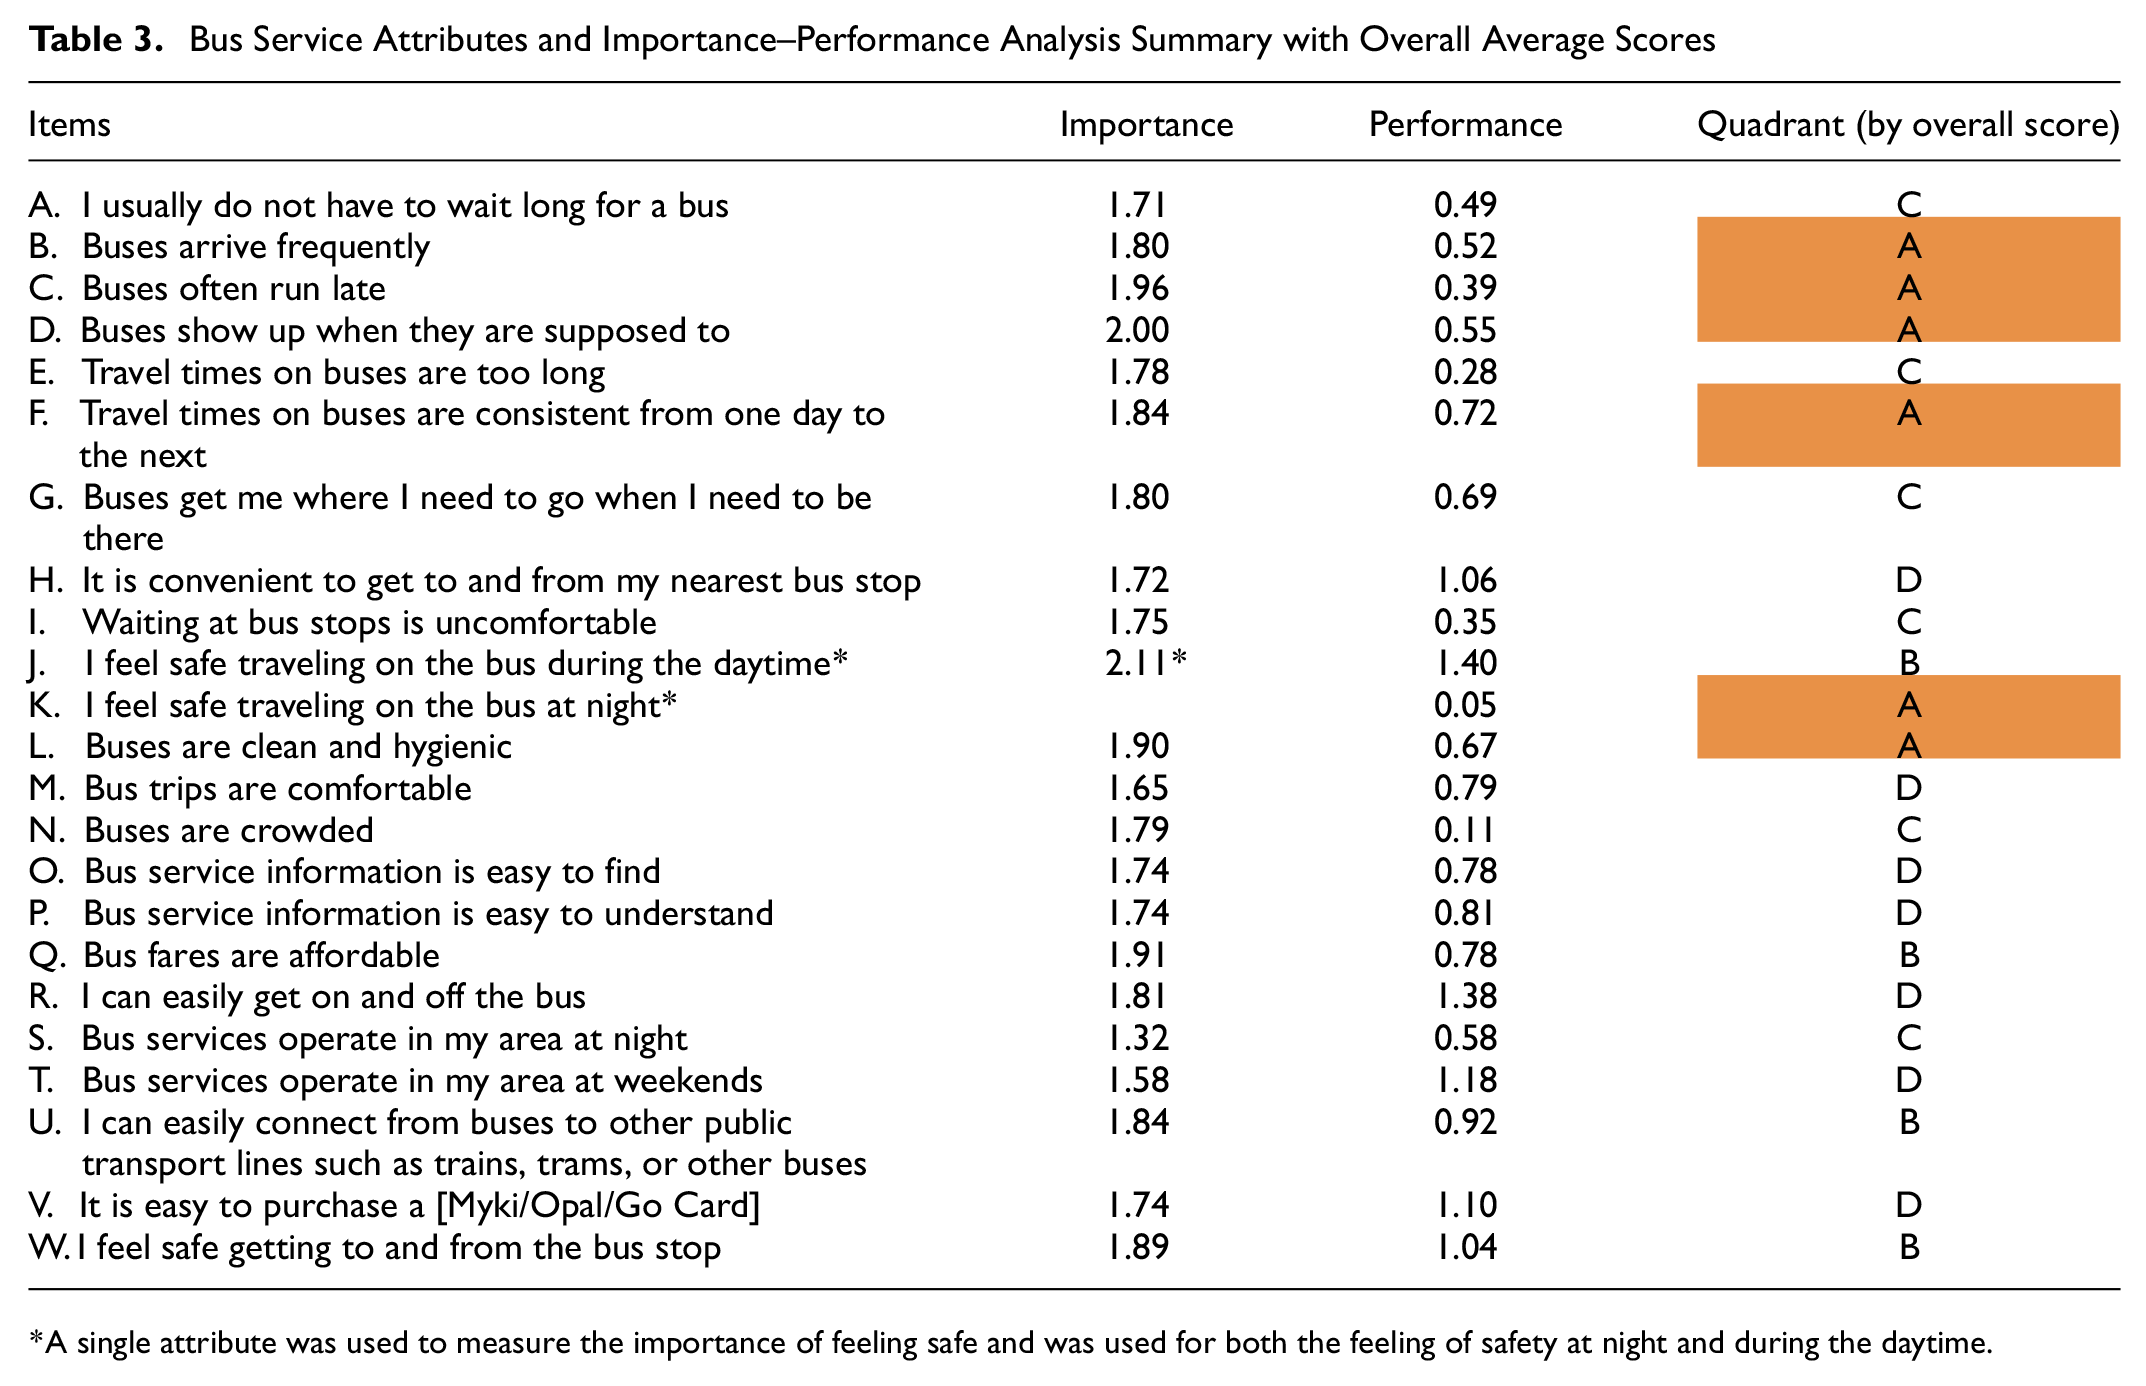
A single attribute was used to measure the importance of feeling safe and was used for both the feeling of safety at night and during the daytime.
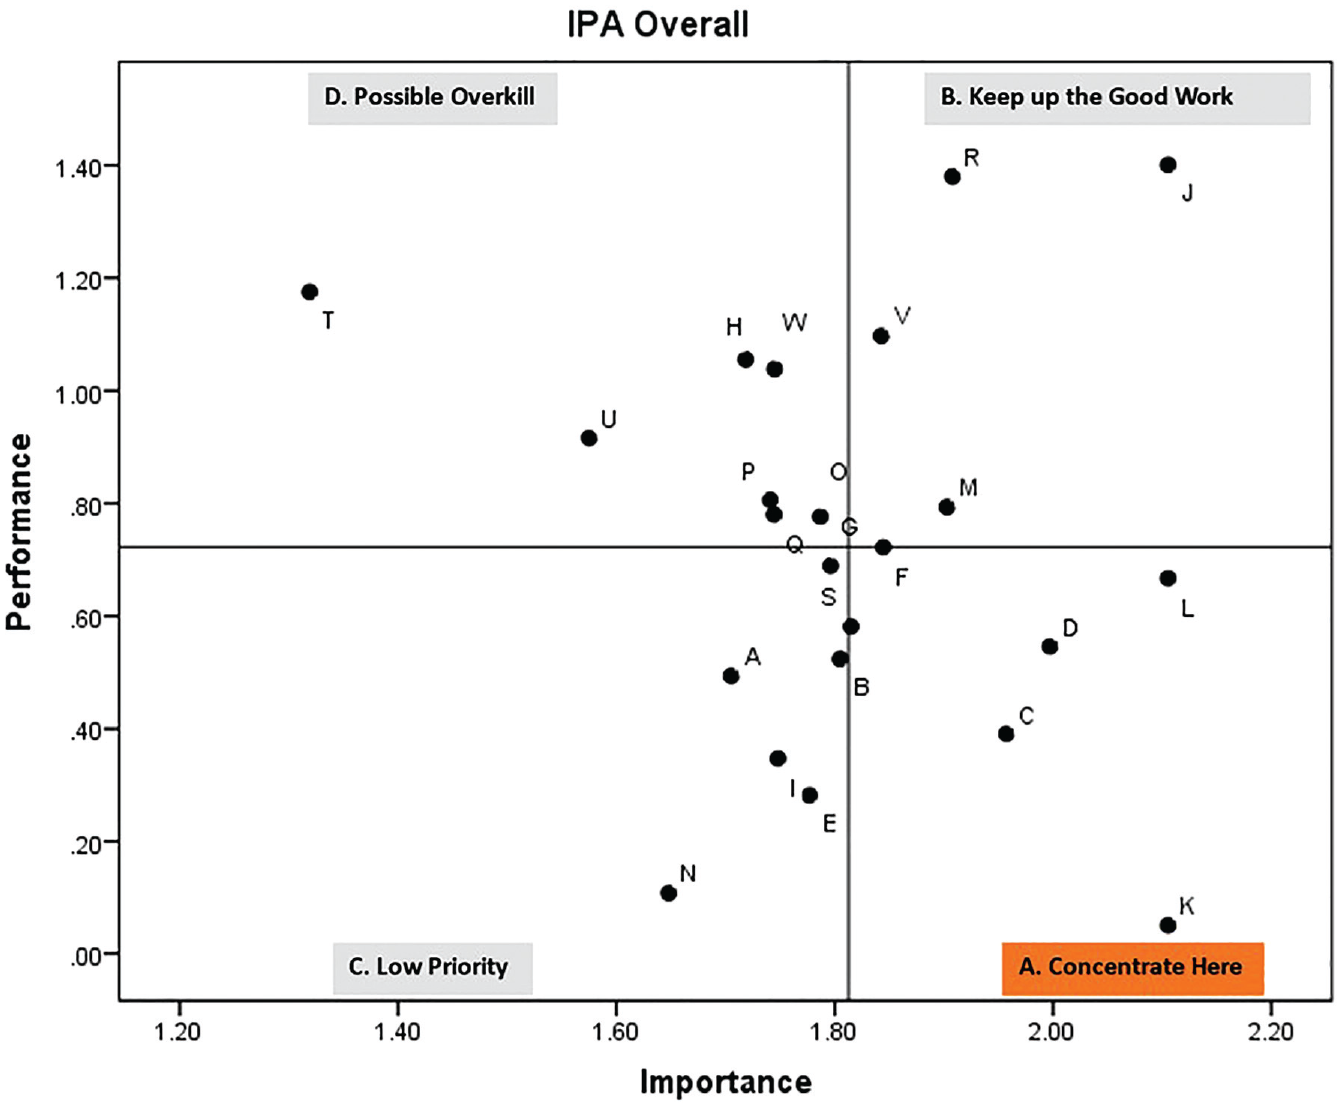
Overall average importance–performance score distribution (item codes listed in Table 3).
A key goal of the research was to investigate the variation in the importance–performance between different cohorts. The cohorts investigated were the following:
Overall cohort (n = 2,420)
By geographic region
By user/nonuser segmentation
Figure 2 shows the importance–performance distribution for the overall cohort. This analysis focuses on the attributes that fall within the shaded area; “Quadrant A: Concentrate |Here,” because respondents rated them as the most important but deemed them to be low performing.
Personal safety, both perceived and actual, was found to be the most important attribute overall. Interestingly, this attribute’s performance varied markedly by time of day. Safety was a high-performing attribute during the daytime (see attribute J), but plunged to the worst performing attribute at night (see attribute K).
Other attributes in Quadrant A relate to bus service levels. Bus service frequency, punctuality, and timetable adherence (reliability) were found to be relatively important but poor performing attributes (see attributes B, C, and D). Journey time reliability and in-vehicle cleanliness were also considered relatively important but performed poorly (see attributes F and L).
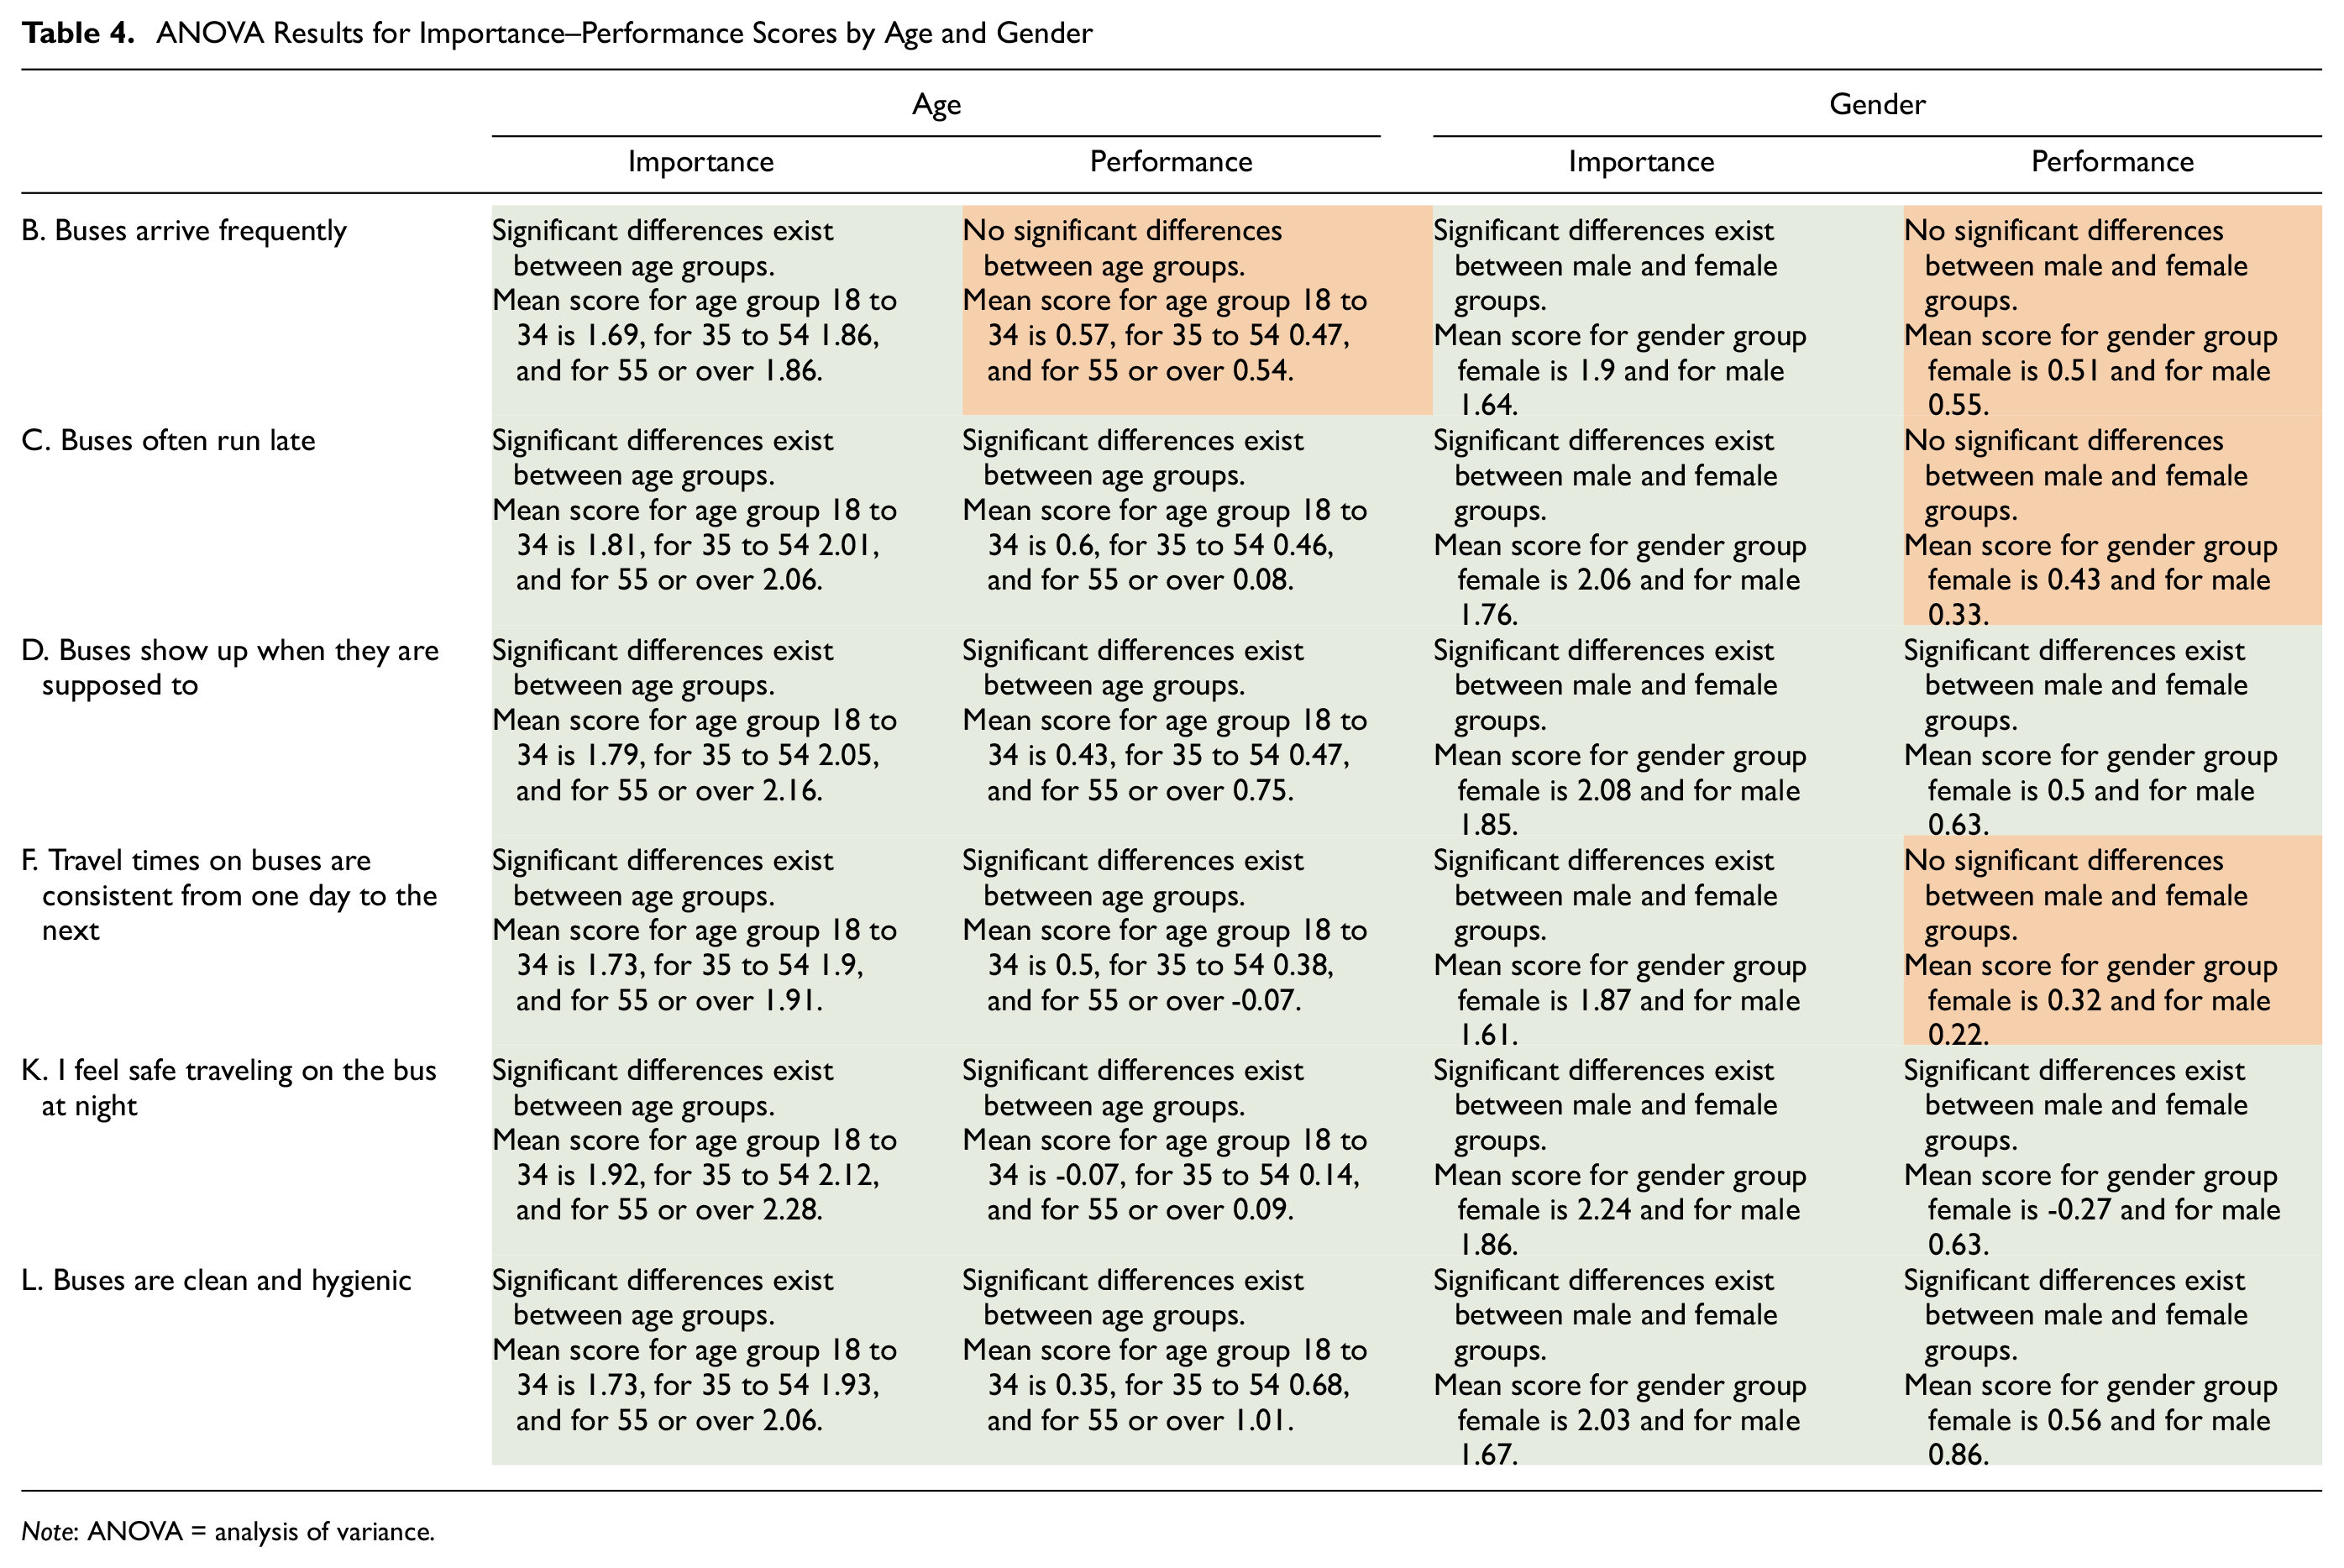
A one-way ANOVA test was conducted to determine whether age and gender significantly influence importance–performance scoring for Quadrant A attributes (see Table 4). Green shaded cells have statistically significant results and red, results with no statistical significance.
ANOVA Results for Importance–Performance Scores by Age and Gender
Note: ANOVA = analysis of variance.
There was a significant difference between women and men with regard to how they experienced nighttime safety. Women scored nighttime safety poorer on performance than men, but scored its importance higher.
Age also significantly influenced the perceived importance and performance of nighttime safety. The importance score of nighttime safety increased from the youngest to the oldest age cohort, indicating that older commuters deem nighttime safety more important than younger commuters. However, respondents aged 35 to 54 scored nighttime safety performance much higher than those aged 18 to 34 and those aged 55 and over. This indicates that age and gender should be considered during the implementation of safety improvements.
Women rated the importance of bus service attributes such as frequency, punctuality, timetable adherence (reliability), and in-vehicle travel times higher than men, potentially indicating that women are more time-sensitive than men.
Age also significantly influenced the perceived importance of bus service attributes such as frequency, punctuality, timetable adherence (reliability), and in-vehicle travel times. Respondents aged 18 to 34 rated these attributes as less important than those aged 35 and over, potentially indicating that older commuters are more time-sensitive.
Women rated the importance of bus cleanliness higher but rated its performance lower than men. Age also significantly influenced the importance–performance scoring of bus cleanliness, with older cohorts deeming it more important but performing more poorly than younger cohorts.
Importance–Performance Analysis Results by City
Figure 3 shows the importance–performance score distributions for Melbourne, Sydney, and SEQ. As with Figure 2, each of the 3 graphics have 4 Quadrants. The research is particularly interested in Quadrant A (high importance, low performance). Respondents from all three locations consistently rated safety and bus cleanliness as the two most important attributes. Respondents also consistently rated nighttime safety as one of the worst performing attributes, indicating that this is a key attribute requiring improvement in all three regions.
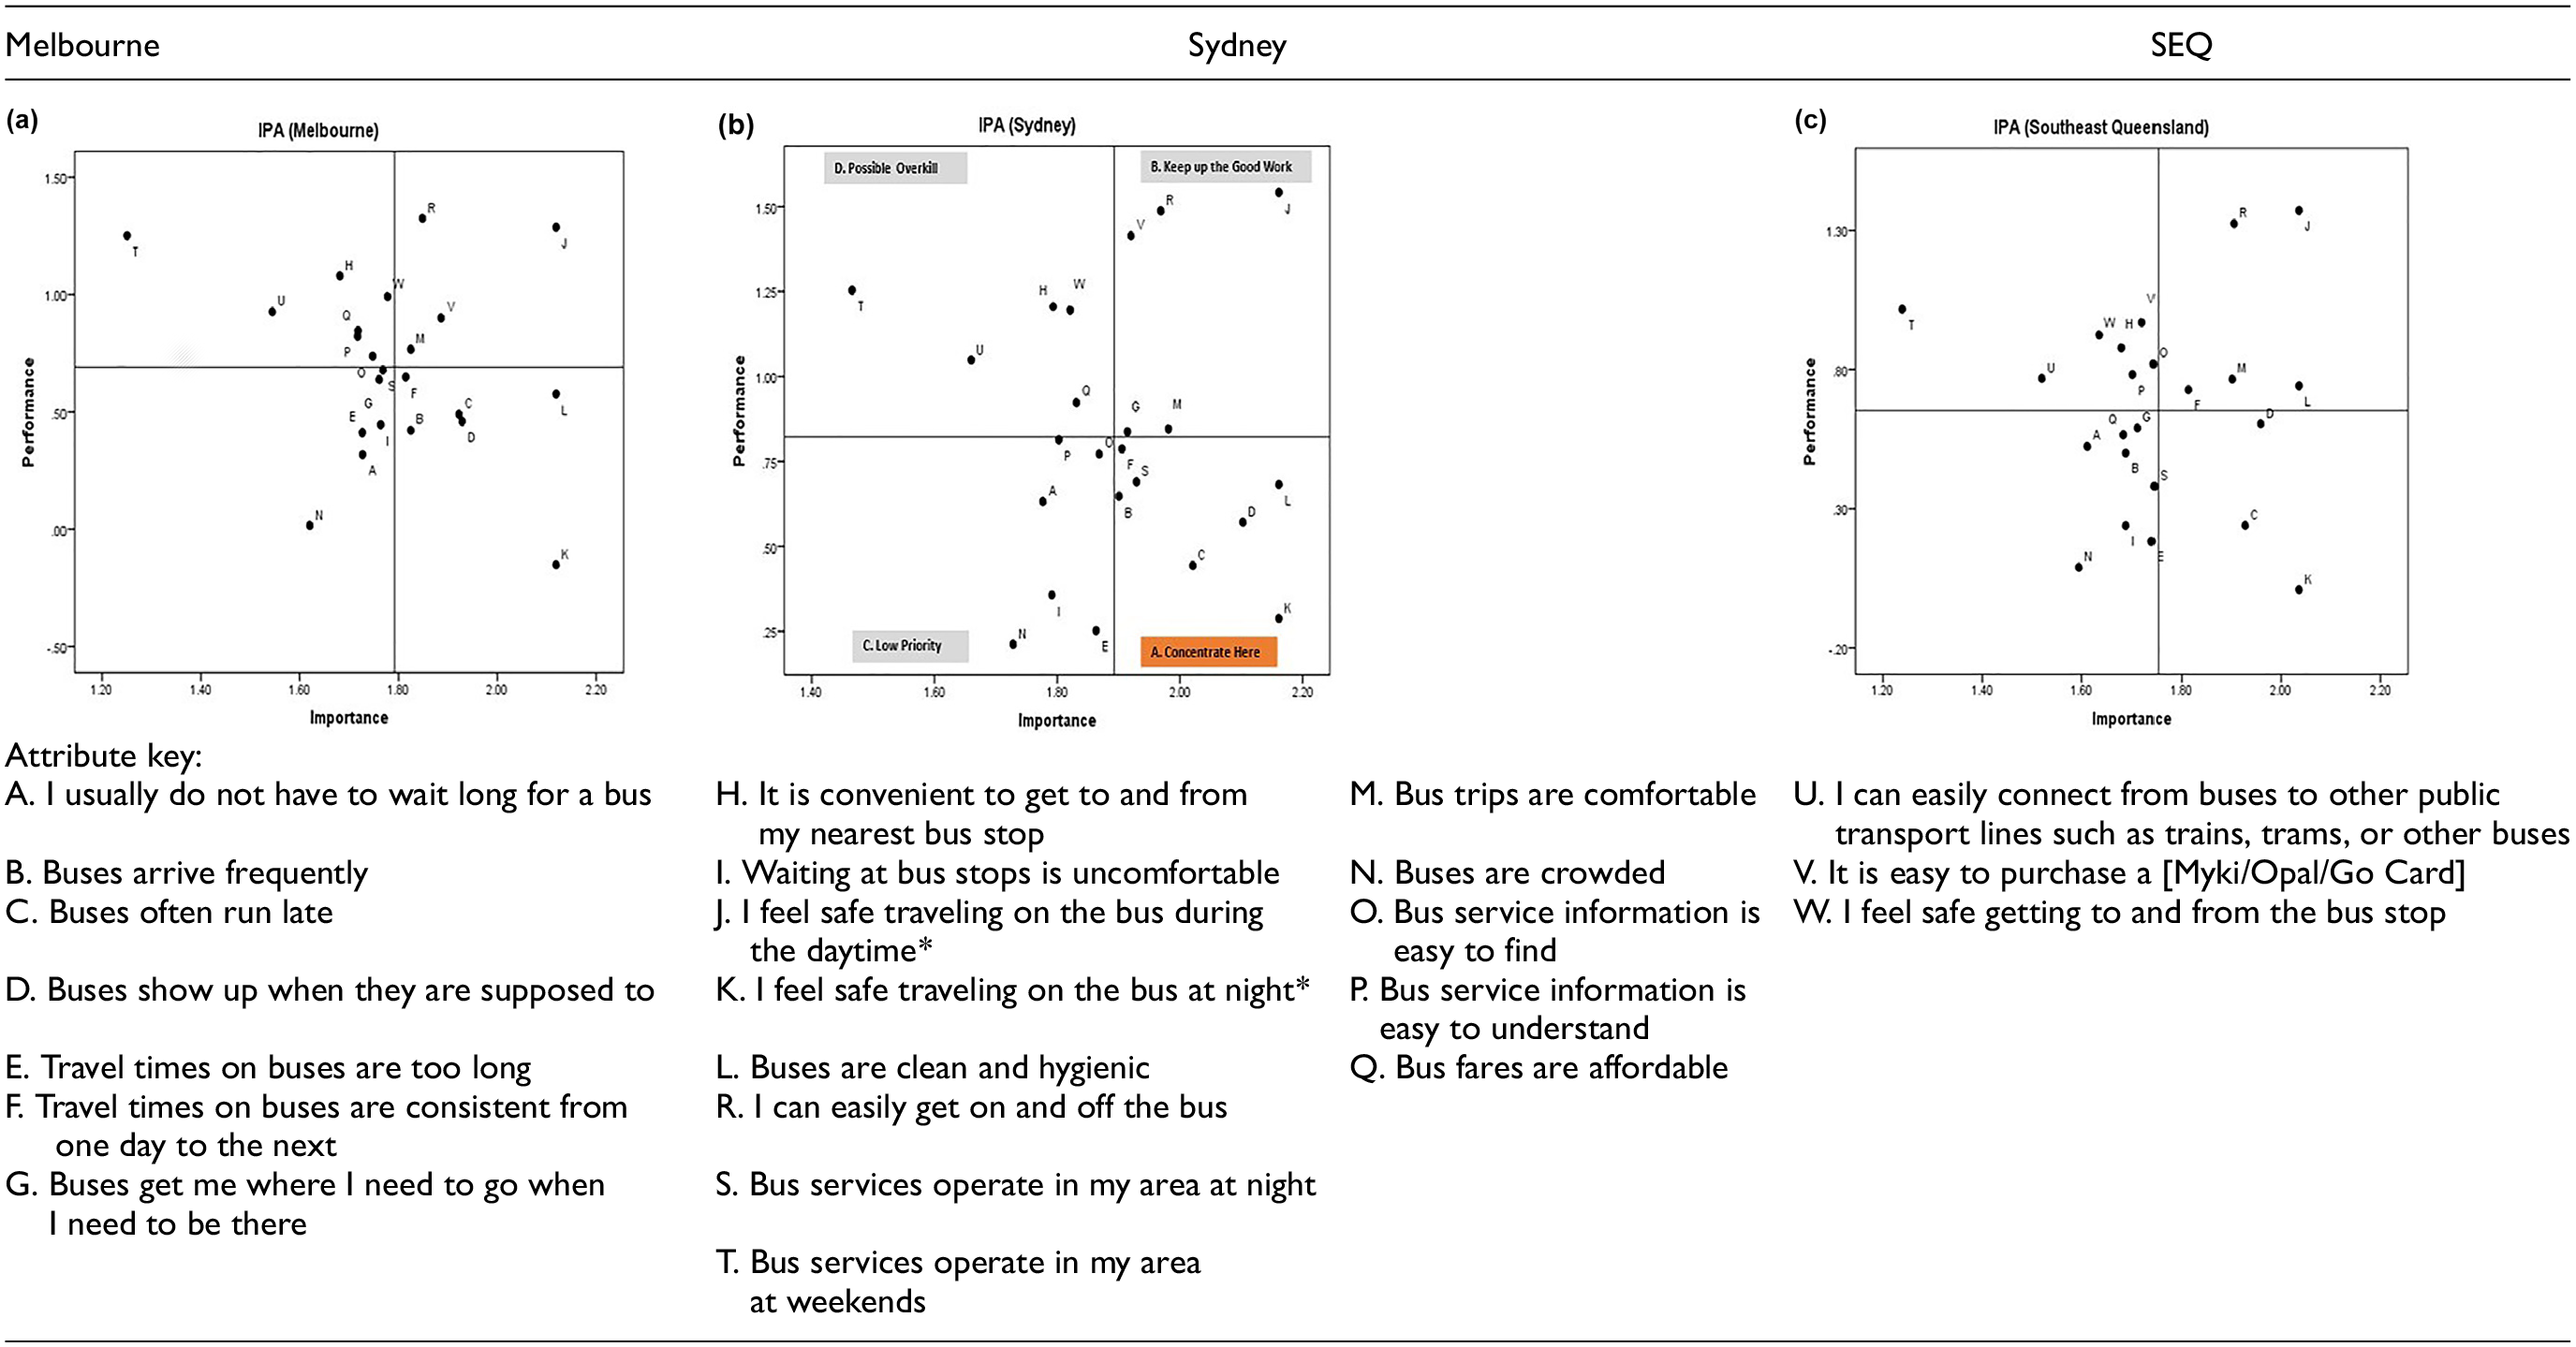
Importance–performance score distribution for (a) Melbourne, (b) Sydney, and (c) SEQ.
Respondents from Sydney and Melbourne identified more attributes as relatively high in importance but low in performance compared with SEQ. These attributes were largely related to bus service levels such as punctuality, frequency, and timetable adherence (reliability), suggesting that Melbourne and Sydney might require service-level improvements more immediately than SEQ.
Results imply poor reliability performance perceptions for populations in larger, more densely populated cities.
A one-way ANOVA test was conducted to determine whether location had a significant influence on performance and importance scores with regard to Quadrant A attributes as shown in Table 5. The cells in Table 5 are shaded according to statistical significance outcomes; green is significance, red not.
ANOVA Results for Importance–Performance Scores by Location
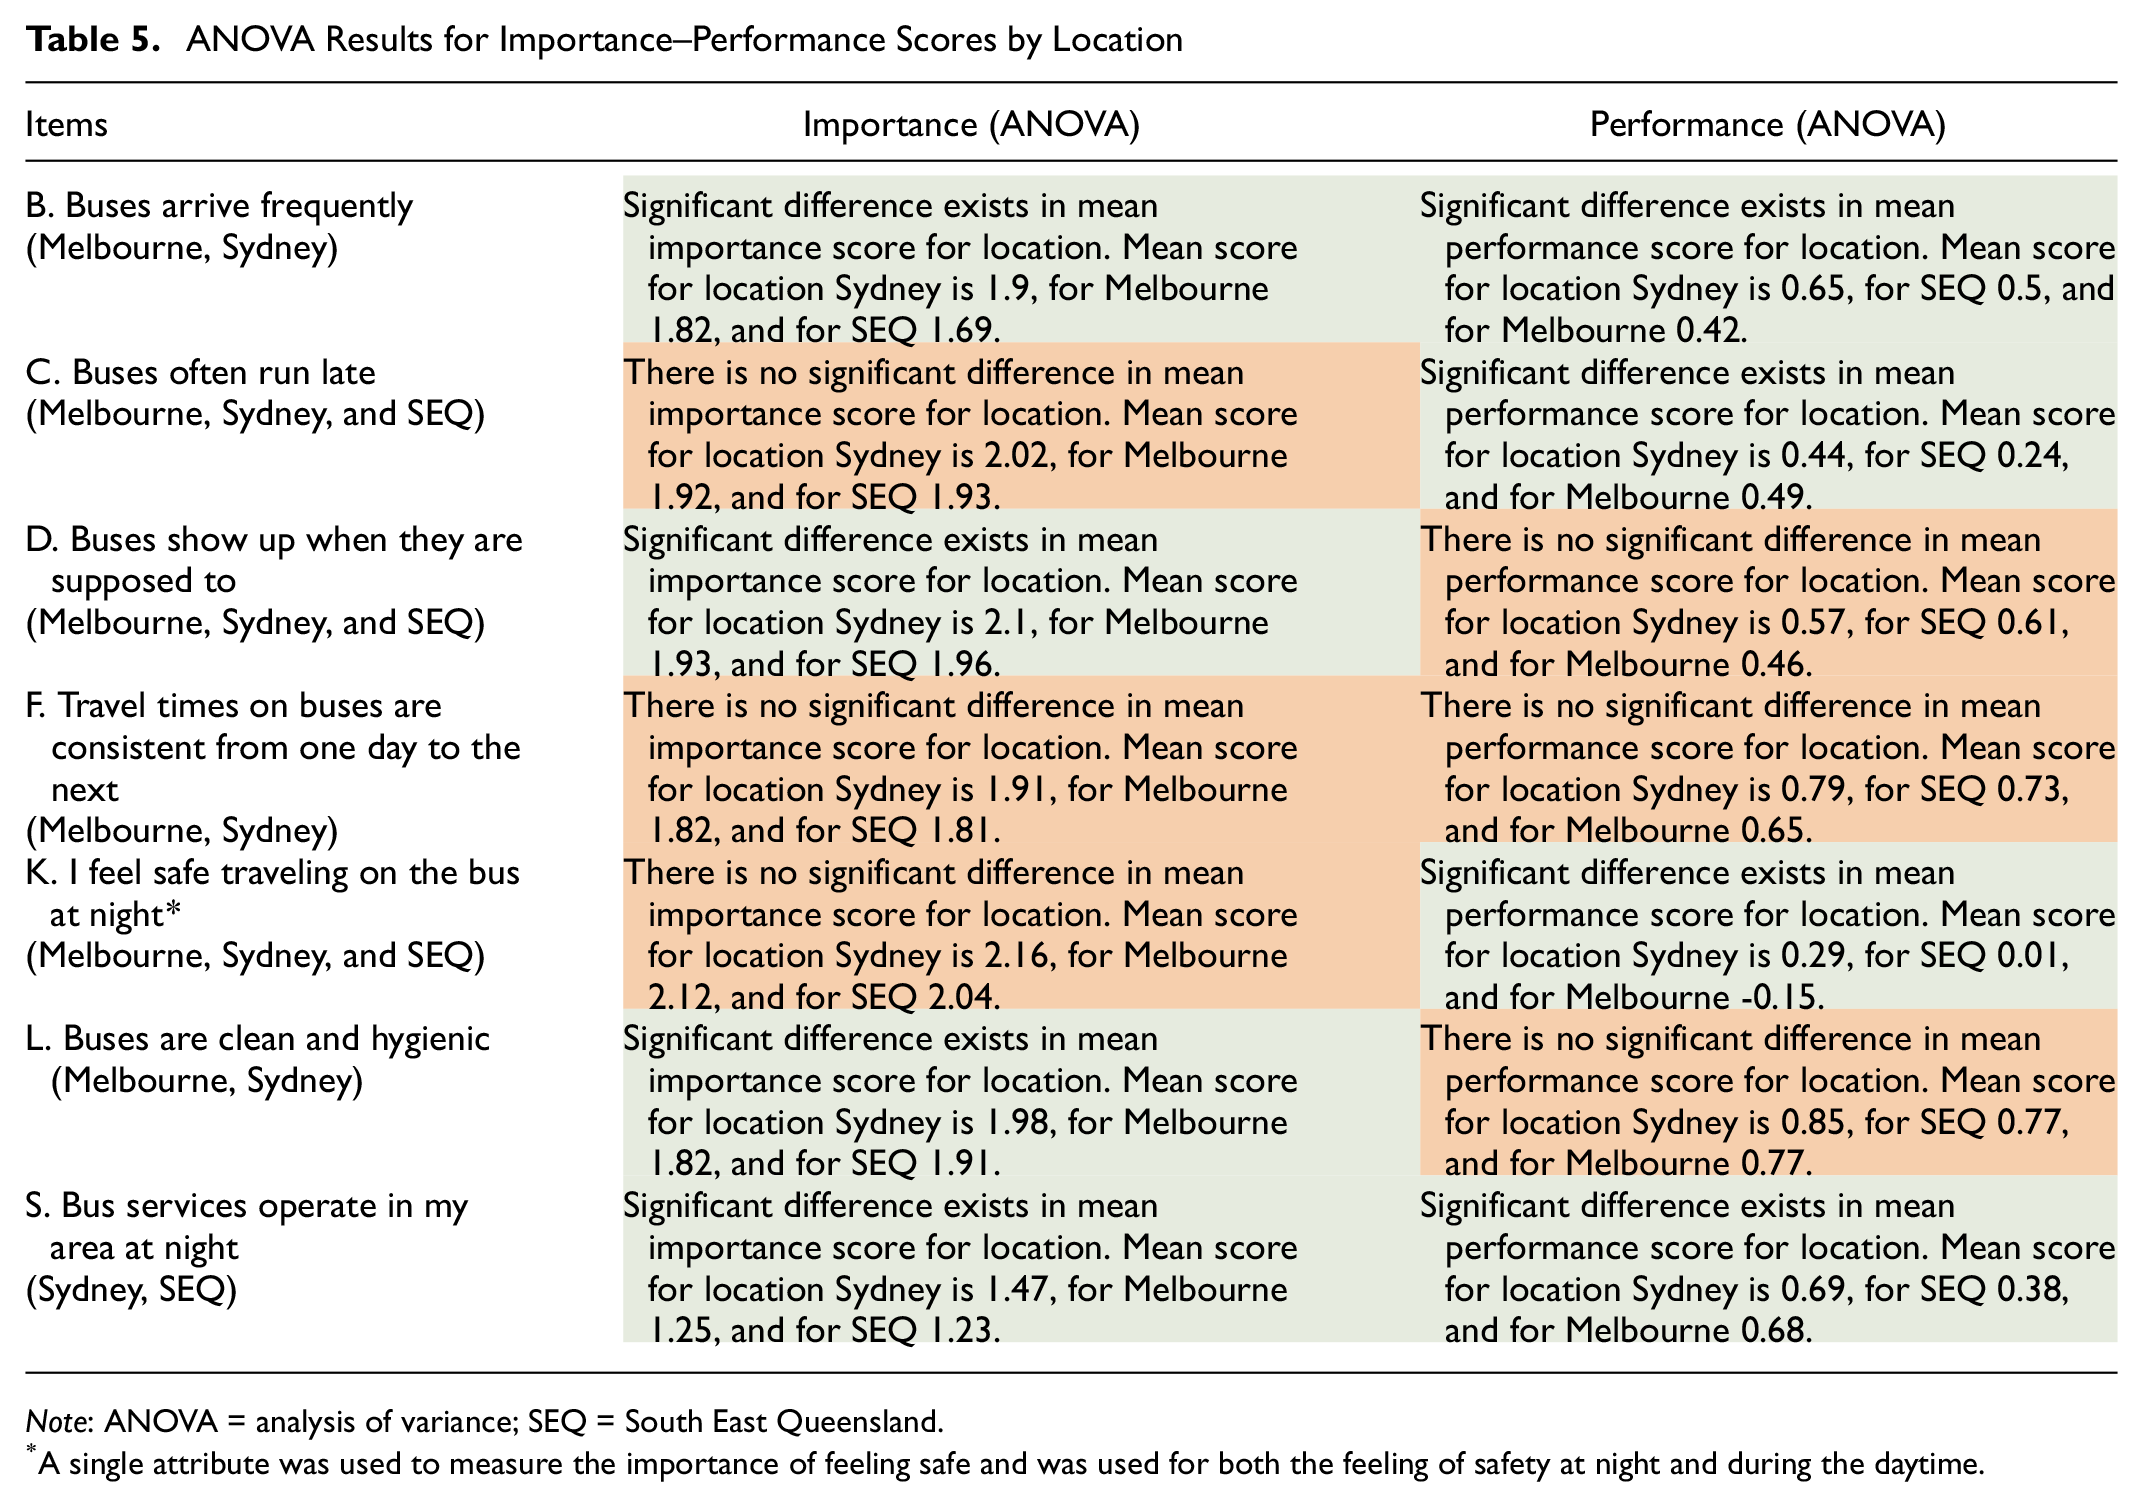
Note: ANOVA = analysis of variance; SEQ = South East Queensland.
A single attribute was used to measure the importance of feeling safe and was used for both the feeling of safety at night and during the daytime.
The results indicate that:
Nighttime safety is equally important in all three locations, but respondents from Melbourne feel more unsafe than those in SEQ and Sydney.
Travel time consistency is also important in all three locations, with respondents scoring its performance to a similar degree.
Punctuality is important in all three locations, but respondents from SEQ rated punctuality higher than those in Melbourne and Sydney.
Night services, bus cleanliness, timetable adherence (reliability), and frequency are more important to respondents in Sydney than those in SEQ and Melbourne.
Low service frequencies are a relatively greater concern for respondents in Melbourne than those in SEQ and Sydney.
Lateness and a lack of night services are a relatively greater concern for respondents in SEQ than those in Sydney and Melbourne.
Importance–Performance Analysis Results for Bus Users/Nonusers
Figure 4 shows the importance–performance score distributions for bus users and nonusers.
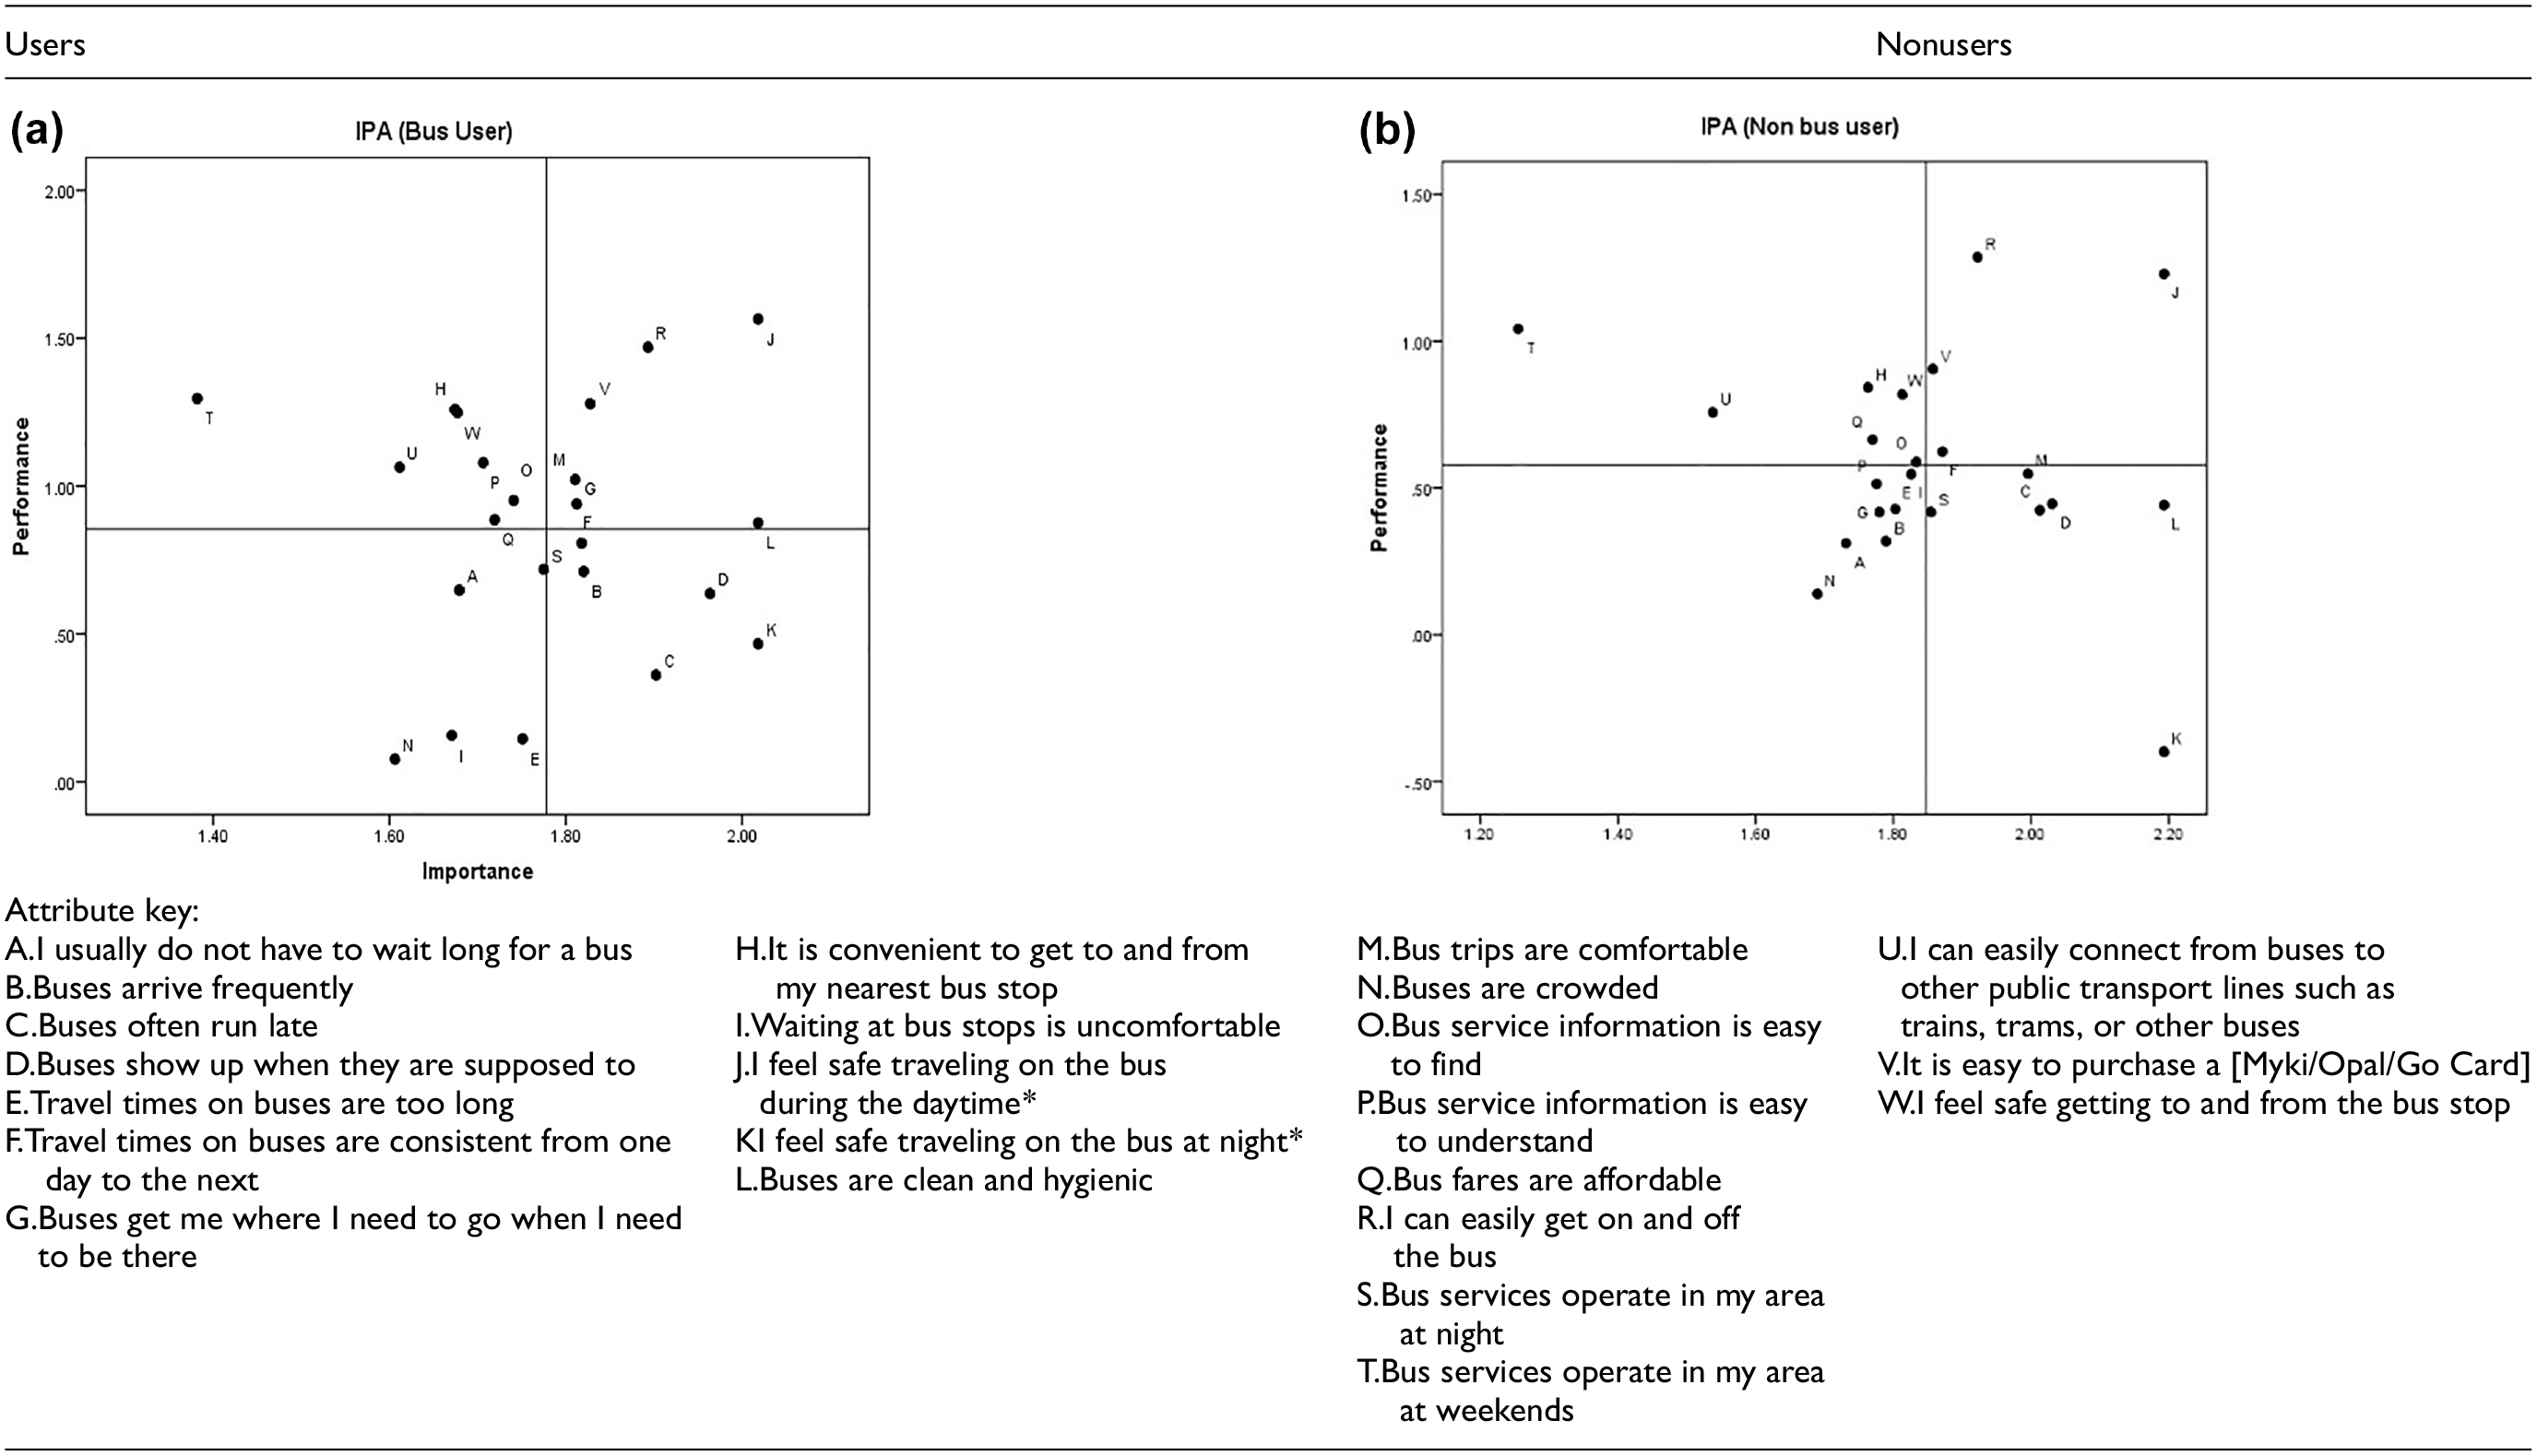
Importance–performance score distribution for (a) user groups, (b) nonuser groups.
There are some differences in the Quadrant A attributes for bus users and nonusers.
Consistent with previous sections, nighttime safety was deemed to be an important but poorly performing attribute by both users and nonusers. Both cohorts also think running night buses is important and there are currently not enough services at night.
Bus cleanliness and journey comfort were both deemed important by users and nonusers, but nonusers felt they were both underperforming attributes whereas the bus users did not.
Frequency and timetable adherence (reliability) were more important to bus users than nonusers, with bus users rating these attributes’ performance more poorly in comparison.
A one-way ANOVA test was conducted to determine whether bus use significantly influences importance–performance scoring for Quadrant A attributes as shown in Table 6. The cells in Table 6 are shaded according to statistical significance outcomes; green is significance, red not.
ANOVA Results for Importance–Performance Scores by Bus Use and Nonuse
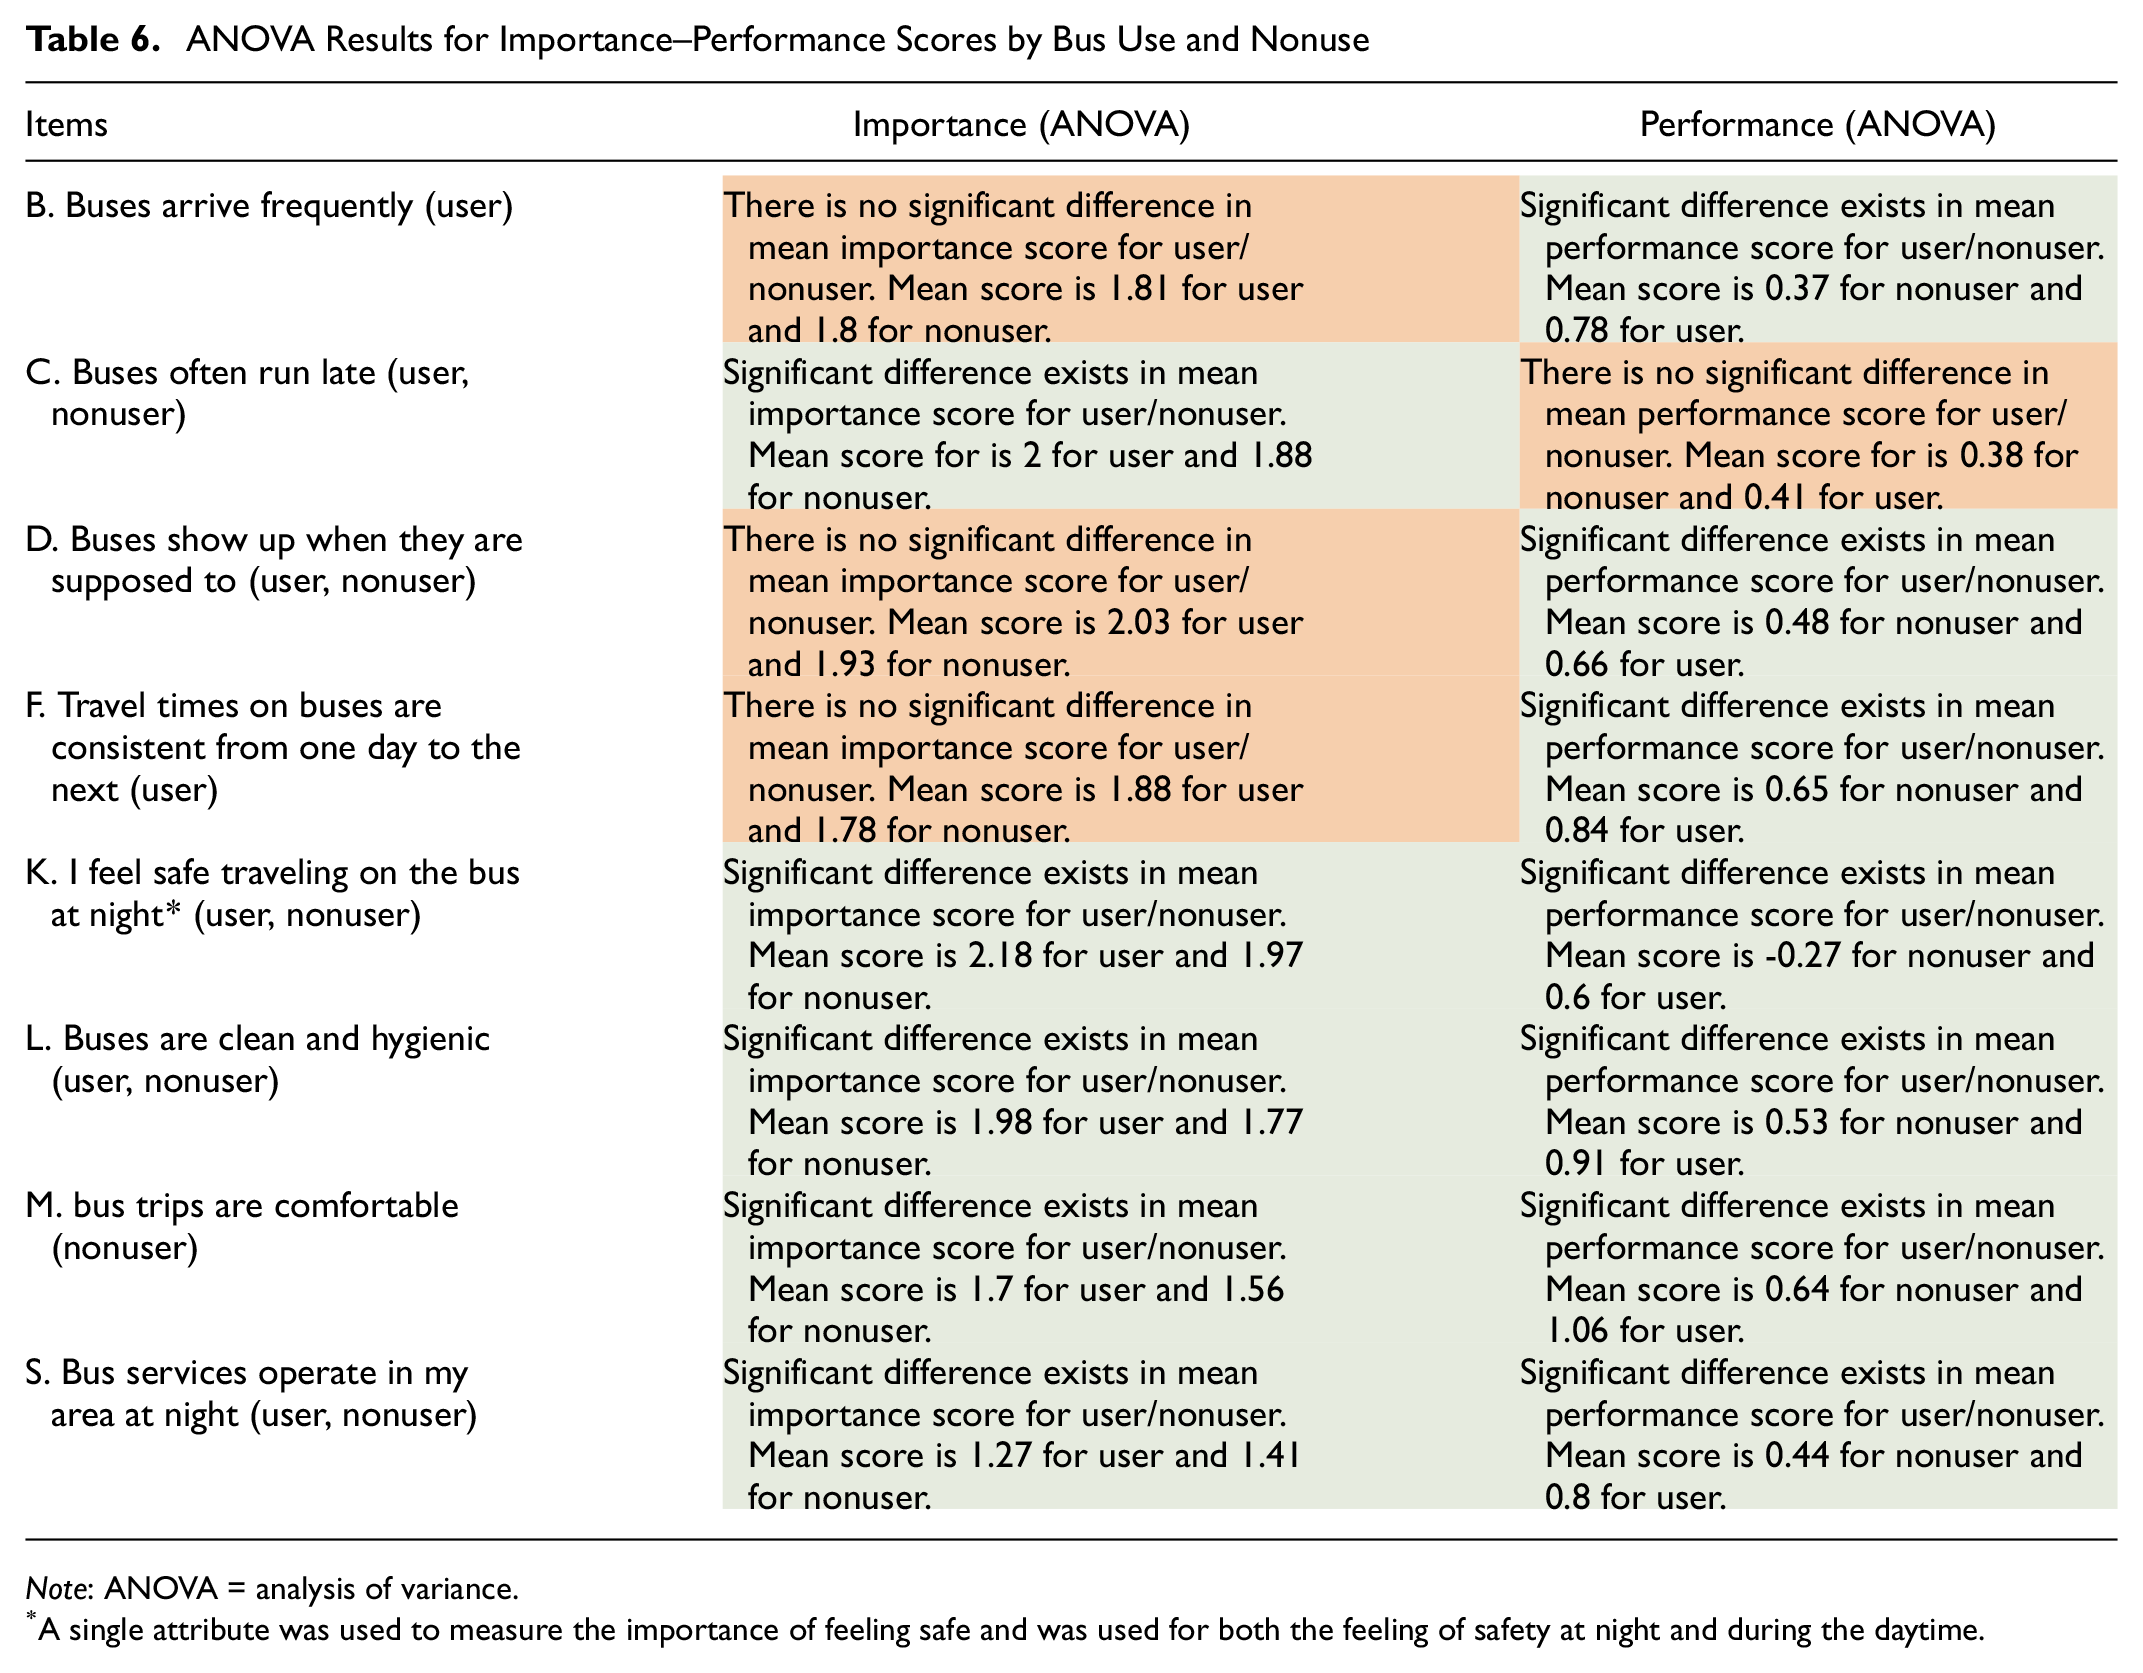
Note: ANOVA = analysis of variance.
A single attribute was used to measure the importance of feeling safe and was used for both the feeling of safety at night and during the daytime.
Nighttime safety ratings for both importance and performance were significantly different between bus users and nonusers. Whereas nonusers rated nighttime safety as less important than bus users, nonusers identified nighttime safety as the worst performing attribute.
Nonusers also identified journey comfort as a problem, even though overall it was less important to nonusers than users.
Timetable adherence (reliability) and punctuality had a similar degree of importance for both bus users and nonusers. However, nonusers rated their performance poorly compared with bus users.
Discussion and Conclusions
This paper aims to explore both user and nonuser perceptions of bus service attributes in Melbourne, Sydney, and SEQ. A major motivation for this research is to understand what service attributes are considered important and to see how the assessment varies according to city, socioeconomic cohort, and user/nonuser groups. Survey findings indicate that sociodemographic characteristics significantly mediate respondents’ perceptions and attitudes toward buses.
This section provides policy and practice recommendations to encourage greater bus patronage and improve perceptions of bus services. Growing patronage requires buses to meet more people’s transport needs and, thus, is closely linked with improving service levels/quality.
Policy and Practice Implementations
Safety
Personal safety stood out as the key concern for respondents across multiple demographic groups. All safety attributes, that is, safety when traveling on the bus, and safety getting to and from the bus stop, were ranked as very important attributes of the bus network.
Although daytime safety and safety accessing bus stops were considered relatively well-performing attributes, nighttime safety was the worst performing attribute overall. Demographic variables, such as gender and age, significantly influence how nighttime safety is perceived. In particular, female respondents were more likely to feel unsafe at night. Age was also a contributory factor, with respondents aged 18 to 34 years and 55 years and over more likely to feel unsafe at night.
Interestingly, bus nonusers believe that traveling on the bus at night is more unsafe than bus users, suggesting that perceived safety—especially at night—could be inhibiting greater bus patronage, which is an important consideration when marketing services to new users. Although nighttime safety was a poorly performing attribute in all locations, respondents in Melbourne rated nighttime safety much more poorly than respondents in SEQ and Sydney. This suggests that it would be more important for Melbourne to improve perceptions of nighttime safety than other cities.
Addressing perceived nighttime safety from a gender and age perspective will be critical to encourage more people to view the bus as a viable transport alternative. Previous research has found that feeling safe has a positive influence on how often people use public transport. Therefore, improving commuters’ sense of personal safety could potentially encourage bus users to travel more frequently by bus, and might even encourage some nonusers to travel by bus ( 18 ).
Research indicates that crime prevention through environmental design approaches can improve commuters’ sense of safety, especially at night. Such approaches include the following:
Well-lit footpaths, stations, and stops
CCTV
The presence of staff, such as customer service staff and security personnel
Emergency call points
Safety audits
Sydney, Melbourne, and SEQ have implemented various safety improvement initiatives, such as the use of protective services officers in Melbourne. However, the general consensus of responses in relation to safety was that safety when traveling on the bus at night was a key concern. This indicates that targeted personal safety programs for buses should be considered as a core part of public transport policy in Australia.
Service Levels and Quality
Service levels and quality stood out as issues for bus users and nonusers alike in all locations. However nonusers often perceive service levels to be worse than do users, an important point to note when marketing services to new users. In Melbourne, the service-level attributes that require the most attention are the following:
Service frequency
Punctuality
Timetable adherence (reliability)
Travel time consistency
In Sydney, the service-level attributes that require the most attention are the following:
Service frequency
Punctuality
Timetable adherence (reliability)
Travel time consistency
Night bus service operation
In SEQ, the service-level attributes that require the most attention are the following:
Punctuality
Timetable adherence (reliability)
Previous research has demonstrated that increasing service levels, particularly frequency, results in commensurate increases in bus patronage. Increasing headways to every 10 to 15 min, especially for bus routes running in areas where residents have a high propensity to use public transport, will be especially beneficial for increasing bus patronage. This should be considered in Sydney and Melbourne, where service frequency is a concern for commuters.
Service punctuality and timetable adherence (reliability) are key concerns in all locations but particularly in the larger, more densely populated cities. Limited on-road bus priority provision results in bus services becoming ensnared in traffic congestion, particularly during the a.m. and p.m. peak periods. Comprehensive on-road bus priority provision, such as bus lanes and priority signaling, should be considered in Sydney, Melbourne, and SEQ, especially in areas where congestion is having a significant impact on bus service reliability.
Night bus service provision should be expanded in Sydney, especially in areas with an established or emerging nighttime economy. The planning of such services must prioritize nighttime safety in all elements of the bus journey, such as in-vehicle safety and safety when accessing the bus stop.
Comfort
One of this study’s main objectives is to determine the factors that contribute to the underutilization of buses, thereby identifying key recommendations for increasing bus patronage and improving the overall perception of buses.
Therefore, understanding the distinctions between bus user and nonuser perceptions is critical to this project’s objectives. Journey comfort was identified as a major concern by bus nonusers. This differed significantly from bus users, who rated comfort as a less important and higher performing attribute than nonusers.
The comfort attributes that require the most attention are the following:
Cleanliness and hygiene
In-vehicle comfort
Comfort when waiting at the bus stop
Vehicle crowding
Since the COVID-19 pandemic, cleanliness and hygiene have become chief concerns, with all states intensifying public transport cleaning programs to minimize infection risk. Although cleaning awareness campaigns have publicized the steps taken to keep commuters safe from COVID-19, other general concerns such as removing graffiti should be addressed to keep the branding of bus services strong.
Although not included in this research, zero emissions buses (ZEB) have the potential to improve in-vehicle comfort significantly ( 19 ) because they lack the vibration of an internal combustion engine, and contribute to the overall sustainability of the public transport network. Sydney, Melbourne, and SEQ have ZEB fleet rollout plans, with New South Wales being the most ambitious of the states.
The provision of high-quality bus stops and interchanges will also be an important way of improving overall perceptions of bus journey comfort. Quality bus stops will need to provide the following:
Comfortable seating that is accessible for all
Easy-to-understand commuter information
Effective shelter from the weather that includes consideration of thermal comfort
Improved service frequencies and reliability will contribute to a more consistent passenger load across vehicles, reducing the likelihood of services being overcrowded. Melbourne is currently trialing real-time crowding tracking on public transport, including on several bus routes. This has the potential to improve public perceptions of crowding on public transport, generating more positive perceptions of buses.
Supplemental Material
sj-docx-1-trr-10.1177_03611981231207844 – Supplemental material for Variation in Bus Transit Attribute Perceptions between Australian Cities
Supplemental material, sj-docx-1-trr-10.1177_03611981231207844 for Variation in Bus Transit Attribute Perceptions between Australian Cities by Hesara Weliwitiya, Mustafizur Rahman, Steven Horvat, Knowles Tivendale and Graham Currie in Transportation Research Record
Footnotes
Author Contributions
The authors confirm contribution to the paper as follows: study conception and design: H. Weliwitiya, K. Tivendale, G. Currie; Primary data collection, analysis and interpretation of the results: H. Weliwitiya, M. Rahaman, S. Horvat; draft manuscript preparation: H. Weliwitiya, M. Rahaman, S. Horvat, G. Currie. All authors reviewed the results and approved the final version of the manuscript.
Declaration of Conflicting Interests
The author(s) declared no potential conflicts of interest with respect to the research, authorship, and/or publication of this article.
Funding
The author(s) disclosed receipt of the following financial support for the research, authorship, and/or publication of this article: The research was funded from a research grant provided by Roads Australia.
Supplemental Material
Supplemental material for this article is available online.
References
Supplementary Material
Please find the following supplemental material available below.
For Open Access articles published under a Creative Commons License, all supplemental material carries the same license as the article it is associated with.
For non-Open Access articles published, all supplemental material carries a non-exclusive license, and permission requests for re-use of supplemental material or any part of supplemental material shall be sent directly to the copyright owner as specified in the copyright notice associated with the article.