
Abstract
In recent years, assisted driving and self-driving have captured the imagination of manufacturers, designers, technology providers, and the general public with the expectation of a sustainable, safer, and intelligent mobility in the near future. Self-driving or assisted driving vehicles are complex systems that integrate environmental perception, intelligent planning and decision-making, tracking, and control. With the increasing intelligence of vehicles, personalized design is an inevitable trend. A design that is in line with the driver’s personality can bring a better driving experience to the driver. Thus, classifying driving types while driving in a self-driving environment may play an important role in the construction of trajectory planning algorithms. This paper uses the motion-in-mind model from game refinement theory to model driver behavior. Further, a classification of the model parameters into three categories helped in distinguishing cautious, aggressive, and average drivers. The results showed that the self-driving environment can be successfully modeled as a game and adaptation to match the riders’ driving skills may improve satisfaction.
Keywords
In recent years, assisted driving and self-driving have captured the imagination of manufacturers, designers, technology providers, and the general public with the expectation of a sustainable, safer, and intelligent mobility in near the future. Self-driving or assisted driving vehicles are complex systems that integrate environmental perception, intelligent planning and decision-making, tracking, and control ( 1 , 2 ). With the increasing intelligence of vehicles, personalized design is an inevitable future. A design that adapts to the driver’s personality can bring about a better driving experience. Identification of driving style and then optimizing personalized driving trajectory planning for the occupant/driver would be a step toward the future of intelligent automated driving.
In the literature there exist many methods and algorithms to classify or identify different driving styles by analyzing driving behavior data. For example, Wang et al. ( 3 ) identified differences in driving styles considering a set of statistics namely, the mean, standard deviation, maximum, and minimum values. Qindt et al. ( 4 ) proposed to estimate driving style recognition coefficients based on impact (rate of change of acceleration) and entropy theory. Ouali et al. ( 5 ) proposed an algorithm for differentiating driving styles (the driving style indicator—DSI) considering the correlation between driving style scores and fuel consumption. Very few studies considered the DSI from the perspective of drivers’ psychology. del Campo et al. ( 6 ) proposed a DSI method focusing on the global comfort of the driver and the passengers. The criterion of global comfort was based on the amplitude and frequency of acceleration but no analysis was carried out considering the drivers’ perception of comfort. The mood of a driver can greatly affect her/his driving behavior. Therefore, further studies are necessary to fully comprehend this factor in DSIs. Further, none of these models or algorithms considered identification of driving style from the perspective of drivers’ psychology, especially treating the act of driving as a game. In this paper, we propose to model the act of driving considering the concepts of game refinement (GR) theory ( 8 ). This enables clustering the measures of drivers’ psychological states during the driving process to more accurately classify their driving style.
Several researchers have studied strategic decision-making within game theory, focusing on mathematical models of conflict and cooperation between intelligent rational game players. Game theory is used in economics, political science, psychology, logic, and biology because of the assumption that two-person zero-sum games have a mixed-strategy equilibrium ( 7 ). A GR theory-based logical paradigm was applied to several board games, including chess variants. A generic GR paradigm based on game progression and game information progression was recently suggested that connected chess and soccer. Iida et al. ( 8 ) suggested a GR metric based on game result uncertainty. GR theory is a game theory focusing on the attractiveness and sophistication of games. The foundation of this direction was made by Iida et al. ( 8 ), in which a measure of GR was proposed based on the concept of information about game outcome uncertainty. This theory provides a perspective to analyze the psychology of a player or participant with respect to the game and determine the degree of their entertainment, rather than focusing on winning or losing the match. A game is enjoyable when its challenge matches the preferences and skills of a player. In GR theory, the uncertainty of the game outcome is described with classical physics (theory of kinematics)-based models. The GR measure reflects the attractiveness of a game from the viewpoint of the players. This theory has been applied to almost all board games ( 9 , 10 ). Later, it has been used not only for board games ( 11 ) but also video games, educational games ( 12 ), business ( 13 ), and riding comfort ( 14 ) as well. In this study, GR theory has been adopted assuming that the action of driving or the experience of a driver when assisted through a smart system is the most comfortable when it is the most enjoyable.
This paper uses the motion-in-mind model ( 15 ) from GR theory to design the act of handling a steering wheel as a game. The motion-in-mind model ( 15 ) defines a player’s feelings during a game by finding the relationship between game-play indicators and the movement of information in the player’s mind indicators. Each of these indicators represents a game-play feeling of the player, such as sense of control, motivation, curiosity, and so forth. A balanced perception of the player’s experience in each dimension of the game can bring satisfaction to the player. As an extension of the motion-in-mind model, a player satisfaction model ( 16 ), which focuses on the reward system using a reward ratio ( 17 ) has been developed, which provided a new method to calculate the motion-in-mind values. In this study, by linking the drivers’ level of satisfaction or enjoyment from handling the steering and subsequent trajectory navigation of the vehicle has been modeled in a motion-in-mind framework. Further, the driving styles are classified applying traditional classification methods, namely k-means clustering, to the designed satisfaction indicators. The good agreement of the results with subjective classification information illustrated the validity of the proposed methodology. Further, this study provides a new way of imagining the act of driving and personalizing assisted driving.
To implement the concept personalization of autonomous driving, the study used end-to-end learning to model autonomous driving. At present, the majority of the industrial design for autonomous driving, assisted driving, or both, is composed of multiple modules, namely detection (of traffic signs, lights, cars, pedestrians), segmentation (of lanes, facades), motion estimation, tracking, and so forth. The results from these components are then typically combined in a predictive planning module, which feeds the control module. This requires detailed scene understanding with the objective of controlling the vehicle for safe and efficient navigation. Furthermore, auxiliary loss functions are required to train each module independently. This often ignores the traditional traffic modeling-based objectives of the driving task, which include optimized travel time, safety, and comfort. As an alternative, many studies are now considering autonomous driving as an end-to-end learning problem. In this approach, the tasks of perception, planning, and control are combined, and a single model is trained end-to-end using a deep neural network. Most end-to-end autonomous driving systems map from sensory inputs, such as front-facing camera images, directly to driving actions such as steering angle. These methods consider a model input and output without having to consider many of the intermediate steps, which is usually more efficient.
End-to-end driving methods are typically trained from expert demonstrations to learn a driving strategy that imitates the behavior of a human expert or using reinforcement learning (RL) to explore the environment by trial and error through simulations. Well-known methods in this area are behavior cloning approaches where the system learns to map sensor observations, such as RGB images, to desired driving behavior by learning to clone the behavior of an expert ( 18 , 19 ) and approaches based on RL where the system learns to drive by training an agent that tries to maximize a user-defined reward that the agent receives while interacting with the environment ( 20 ). This paper is utilizes an end-to-end autonomous driving deep learning algorithm from NVIDIA ( 21 ). This algorithm uses convolutional neural networks (CNNs) to capture images by the car’s front camera and correspond them to the direction of travel of the self-driving car. Because it is a pure CNN, the algorithm works on both normal roads and highways, with and without road markings. This architecture minimizes the mean square error between the directional angle output by the CNN and the directional angle of the car when driven by a real person.
The remaining part of the paper is organized as follows: the next section presents the theory of the proposed methods, the third section describes the design of experiments, followed by the results and discussion and the conclusion.
Methodology
In this section, brief theoretical descriptions of the models used in this study are presented.
Game Refinement Theory
GR theory is a mathematical method that focuses on the attractiveness and the sophistication of games. This method assumes the entertainment of a game by modeling the uncertainty during the process of the game ( 8 ). The GR theory is based on the concept of game progress and game information progress. Game information progress presents the degree of certainty of a game’s results in time or in steps. Having full information of the game progress after its conclusion, game progress x(t) will be given as a linear function of time t. However, the game information progress given by a linear function will remain unknown during the in-game period. The presence of uncertainty during the game, often until the final moments of a game, renders exponential game progress. Therefore, a realistic model of game information progress is given by the following:

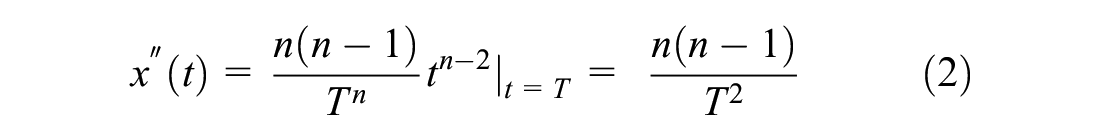

A realistic formulation of game progress with the known outcome is given as Equation 1. The parameter n (
For board and scoring games, the GR measure is determined by Equation 5 using the model of move candidate selection and scoring rate ( 15 ). Here we referred to Xiong and Iida’s ( 22 ) work, where B and G represent the average branching factor and average goals (number of possible options), respectively. Meanwhile, D is the game length (total number of plies) and T is the total points or goals (depth of the whole game tree). One round in board games can be illustrated as a decision tree. At each depth of the game tree, one will choose a move and the game will progress. Figure 1 illustrates one level of the game tree. The distance d, which is shown in Figure 1, can be found by using the simple Pythagoras theorem, a realistic game progress model for board games, which is given by Equation 4:


These respective variables were collected from the average of the total number of play-testing experiments. The sophistication of games converges to an almost similar sense of thrill (or noble uncertainty [ 23 ]) of GR ∈ [0.07,0.08] (Table 1).
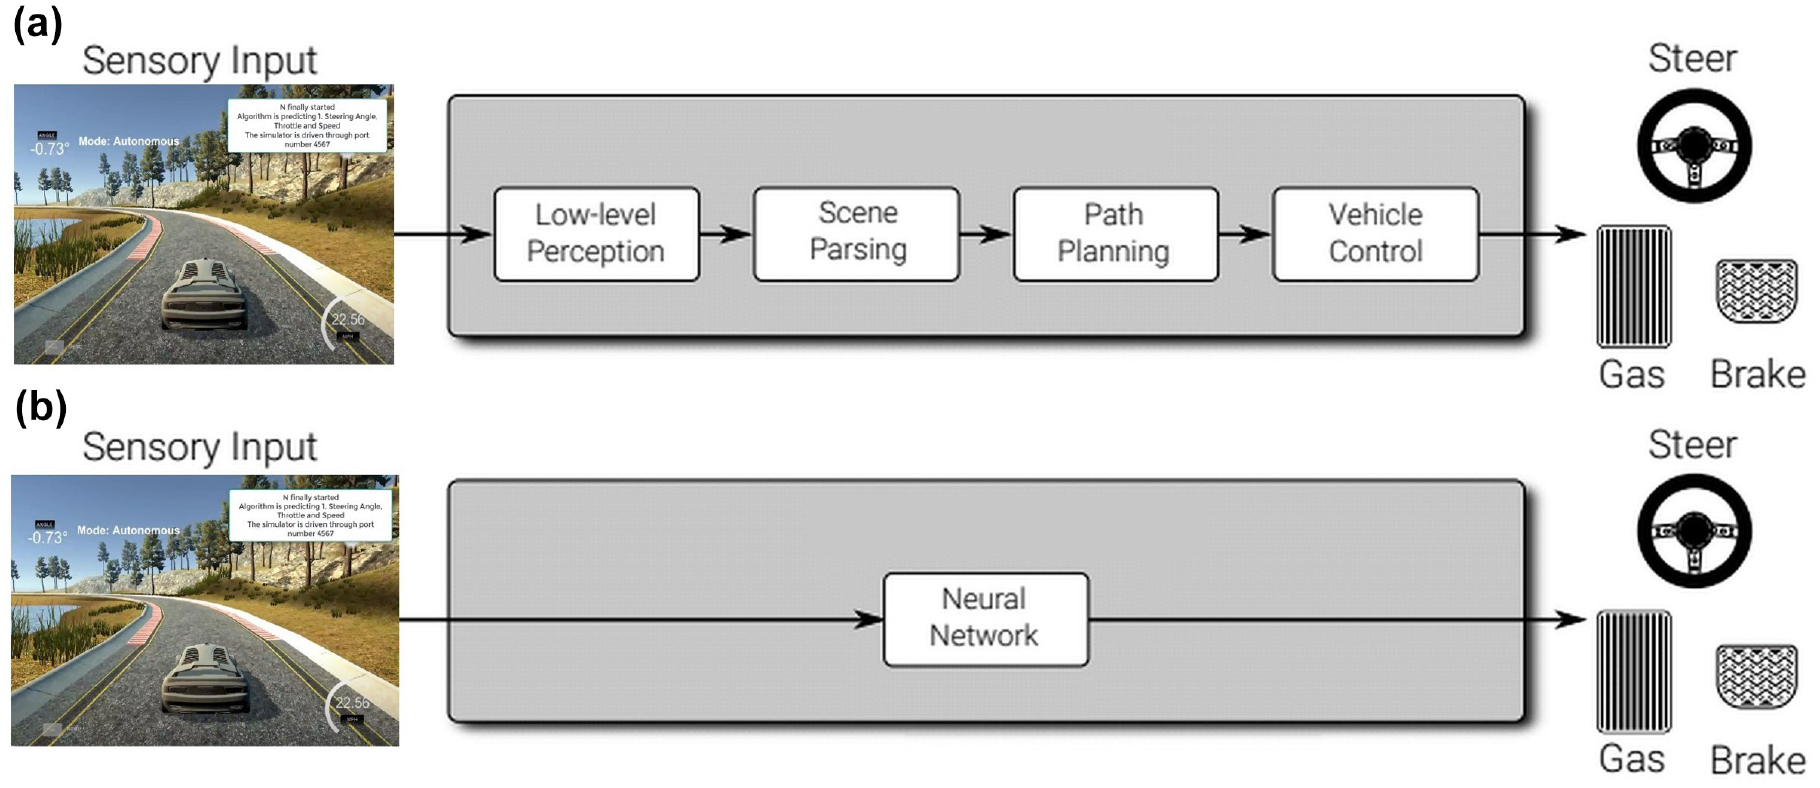
Learning approaches for automated driving: (a) traditional model and (b) end-to-end model.
Measures of Game Refinement for Various Games ( 16 )
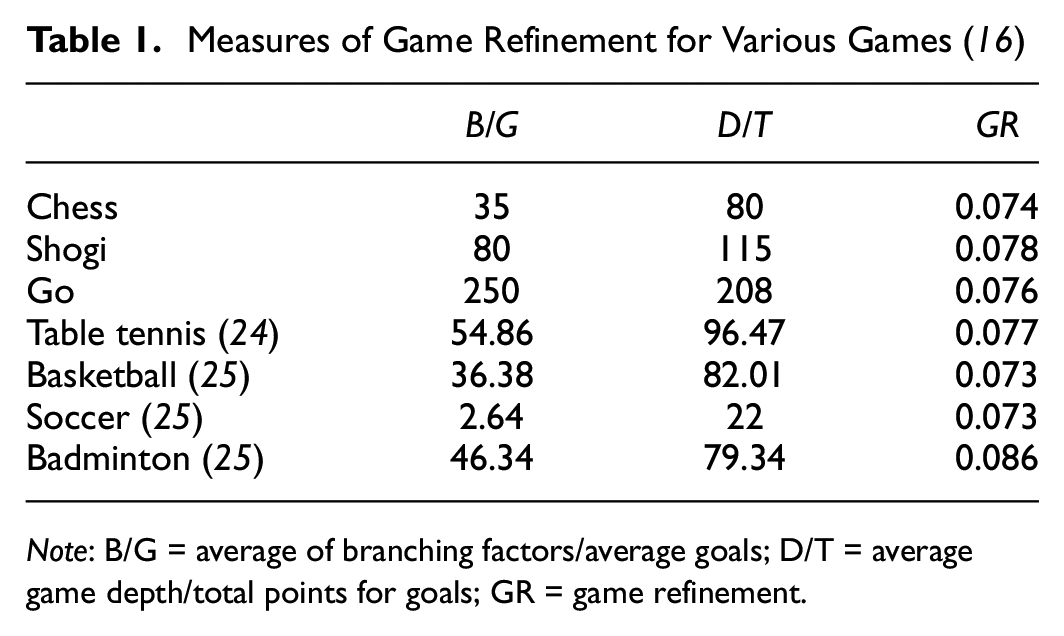
Note: B/G = average of branching factors/average goals; D/T = average game depth/total points for goals; GR = game refinement.
Variable Ratio Schedule (N) and Winning Hardness (m) in Games
With the development of GR theory, focusing on the reward, we connected the theory with a variable ratio schedule to further research from a reward view. The basic notion of game playing depends on the rate of information representation, which constitutes the speed or “velocity” of a game, and is generally defined as the success rate/winning rate (v). In contrast, the challenge faced or difficulty of reaching such a success, which constitutes the weight or “mass” of a game, is generally defined as the difficulty rate/winning hardness (m).
In Variable Ratio (VR) schedule, the parameter N shows the average reward frequency, where

Motions in Mind
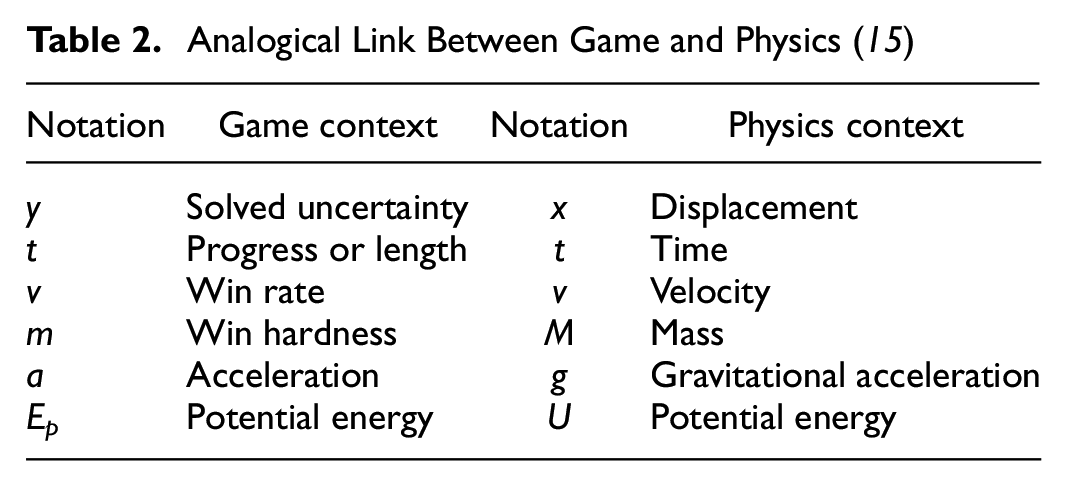
Analogical links between motions in physics and motions in mind have been previously established based on the notions of winning rate (or velocity) v and winning hardness m ( 15 ). The winning rate and winning hardness are defined as the velocity and mass, respectively. The various motions in mind quantities can be determined accordingly. The correspondence between the variables from the theory of kinematics and the progress of games (game information) are presented in Table 2.
Analogical Link Between Game and Physics ( 15 )
Previous work by Iida and Khalid (
15
) defined F as the player’s strength to move a game or ability in general, where a is the growth rate of the “flow” experience of the player in the game (since a =

The potential energy (


Similar to the law of conservation of energy in classical physics, Ep is expected to be conserved, where the momentum of the game-playing motions, while differing in level, contains both objective (in-game) and subjective (in-mind) recognition. Potential energy is transformed into the sum of the momentum from the game’s motion (
Therefore, it is expected that


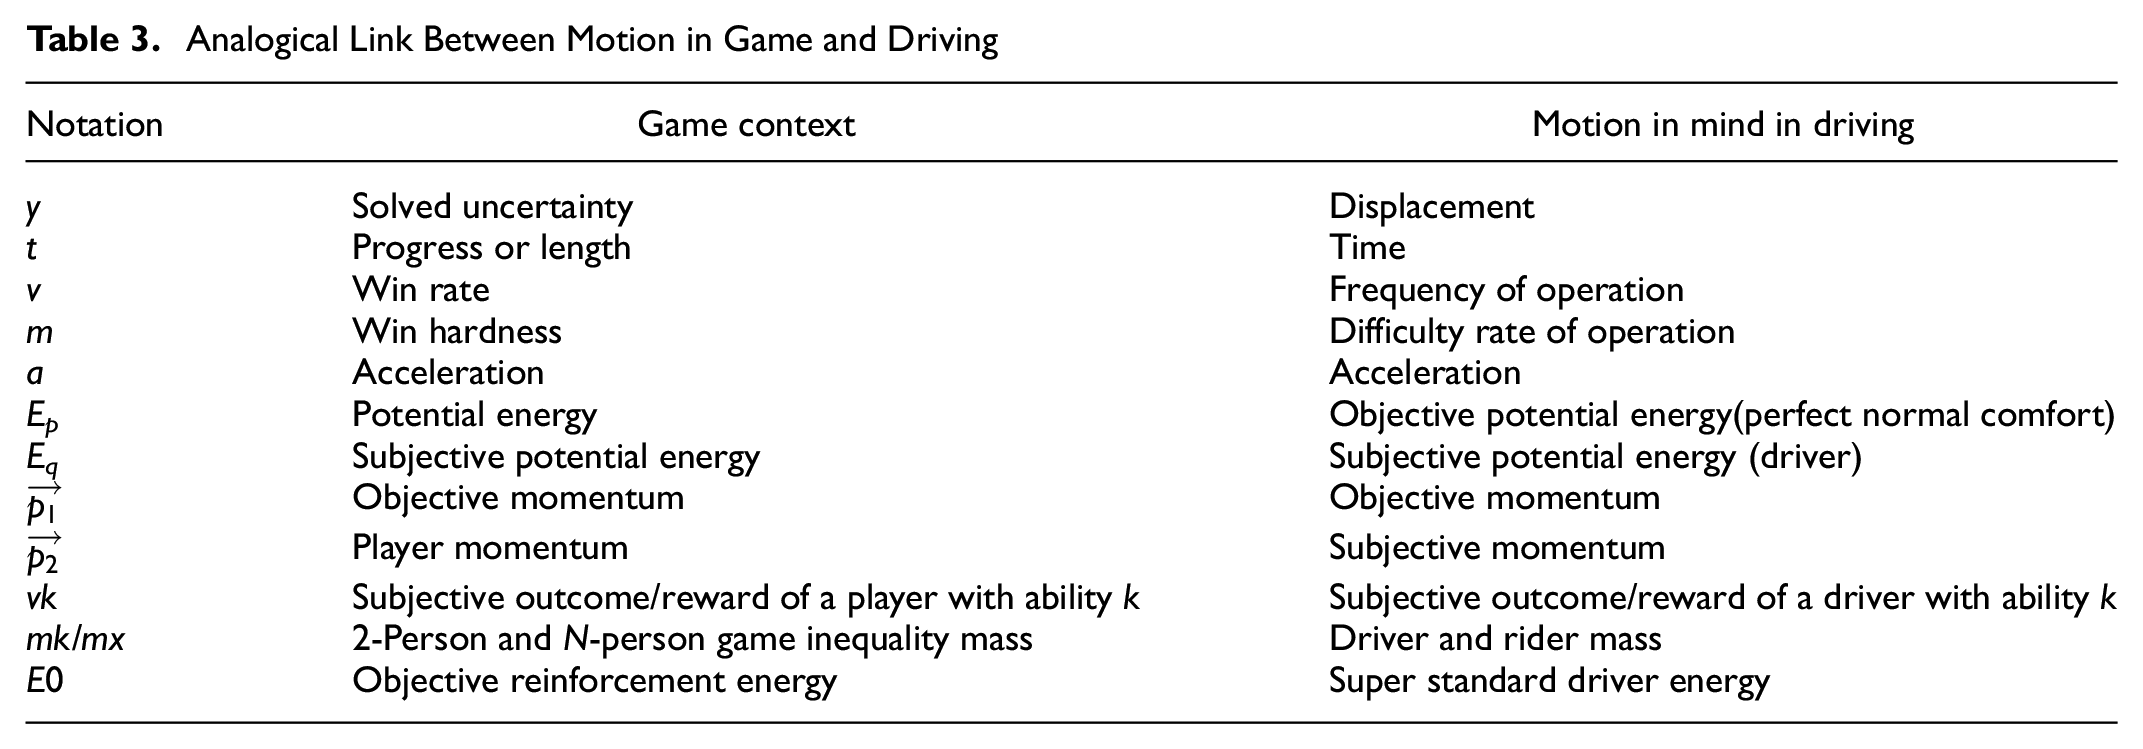
The analogous connections between the physics model and the game progress model were presented in Table 2. In this paper, for the application aspect of motion in mind in a driving environment, Table 3 shows an analogous connection between the motion-in-mind model in the game and driving environments.
Analogical Link Between Motion in Game and Driving
End-to-End Deep Learning-Based Self-Driving Model
This paper utilized end-to-end deep learning rather than the traditional models incorporating several modules (see Figure 1).
This paper is based on an end-to-end autonomous driving deep learning algorithm from Bojarski et al. ( 21 ) (Figure 2).
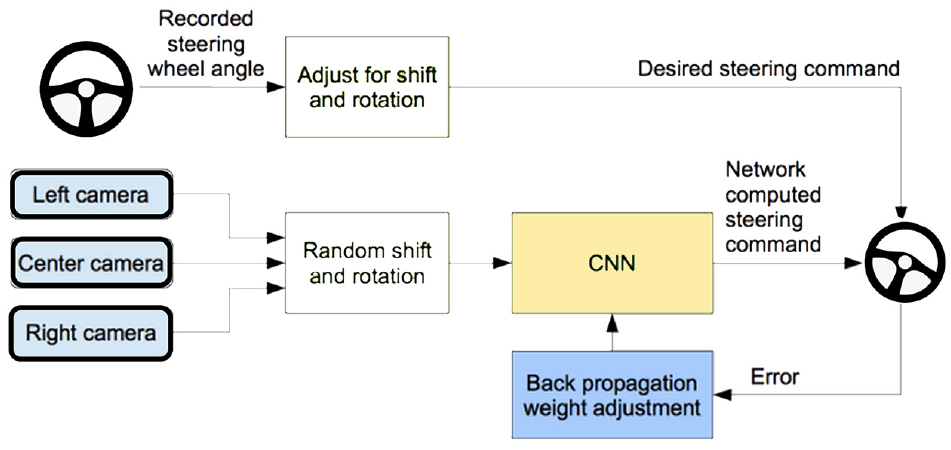
End-to-end deep learning model for automated driving ( 21 ).
In this model, a CNN has been used to map the raw pixels from a front-facing camera to the steering commands for a self-driving car. This powerful end-to-end approach means that with minimum training data from humans, the system learns to steer, with or without lane markings, on both local roads and highways. The system can also operate in areas with unclear visual guidance, such as parking lots or unpaved roads. There are five convolutional layers and three fully coupled layers, and the network is very small compared to networks commonly used in image recognition.
Driver Category
Driving style is a characteristic of a driver’s behavior when driving and is reflected in the human input to the car and the overall response ( 5 ). The classification and identification of driving styles can help to improve driving safety and fuel efficiency ( 29 ). By identifying different driving styles, it is also possible to detect potentially dangerous situations and regulate abnormal driving behavior ( 30 ). It helps to enhance safe driving. In this study, the player satisfaction or driver satisfaction is modeled considering the concepts of motion-in-mind theory.
Here, N is an important unit for measuring player satisfaction, and in this paper it is connected with the driver’s comfort. Here, we consider N to be the number of times the steering wheel is operated in each turn, and in general we consider that N will be smaller for novices and larger for the experienced. Similarly, the size of N will vary between drivers with different personalities. Adventurous drivers seeking the thrill of deviating from the curve will have a smaller N, while cautious drivers seeking a smooth driving experience will have a correspondingly larger N for the curve. The validity of N was justified using a simulation-based experiment which showed that N improved with practice and N stabilized for values of 4–6.
Based on this idea, the drivers were divided into three groups (cautious, regular, aggressive).
Each type is defined as follows.
Driver Category Classification
In general, acceleration, speed, and pulling power during acceleration can be good indicators of a driver’s driving habits (
31
), but the use of the brake pedal, following distance, and number of lane changes can sometimes be better indicators of a driver’s driving personality (
32
). For this reason, the selection of different DSIs may produce different results with respect to driving style classification. The degree to which the selection of DSIs is reasonable will affect the results of the driving style classification, and in this paper six values of motion in mind were selected: Ep, Eq, F1, F2,
Design of Experiments
The experiments were designed in three steps: (1) establishing N as the driving style identifier; (2) driving style database creation; and (3) driving style classification (Figure 3).
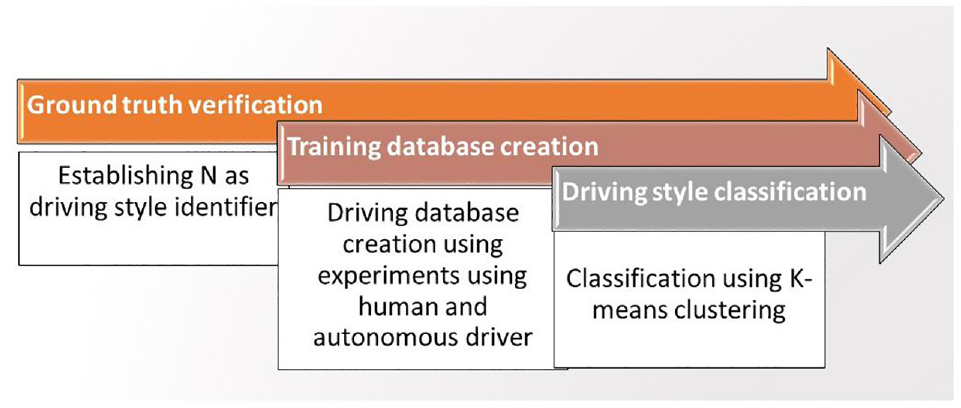
Design of experiment process flow.
In this study all driving was recorded in Udacity’s self-driving car, Nanodegree (Figure 4). The Nanodegree project is designed to teach students how to train self-driving cars and navigate road courses using deep learning. All the assets in this repository require free game making engine Unity.
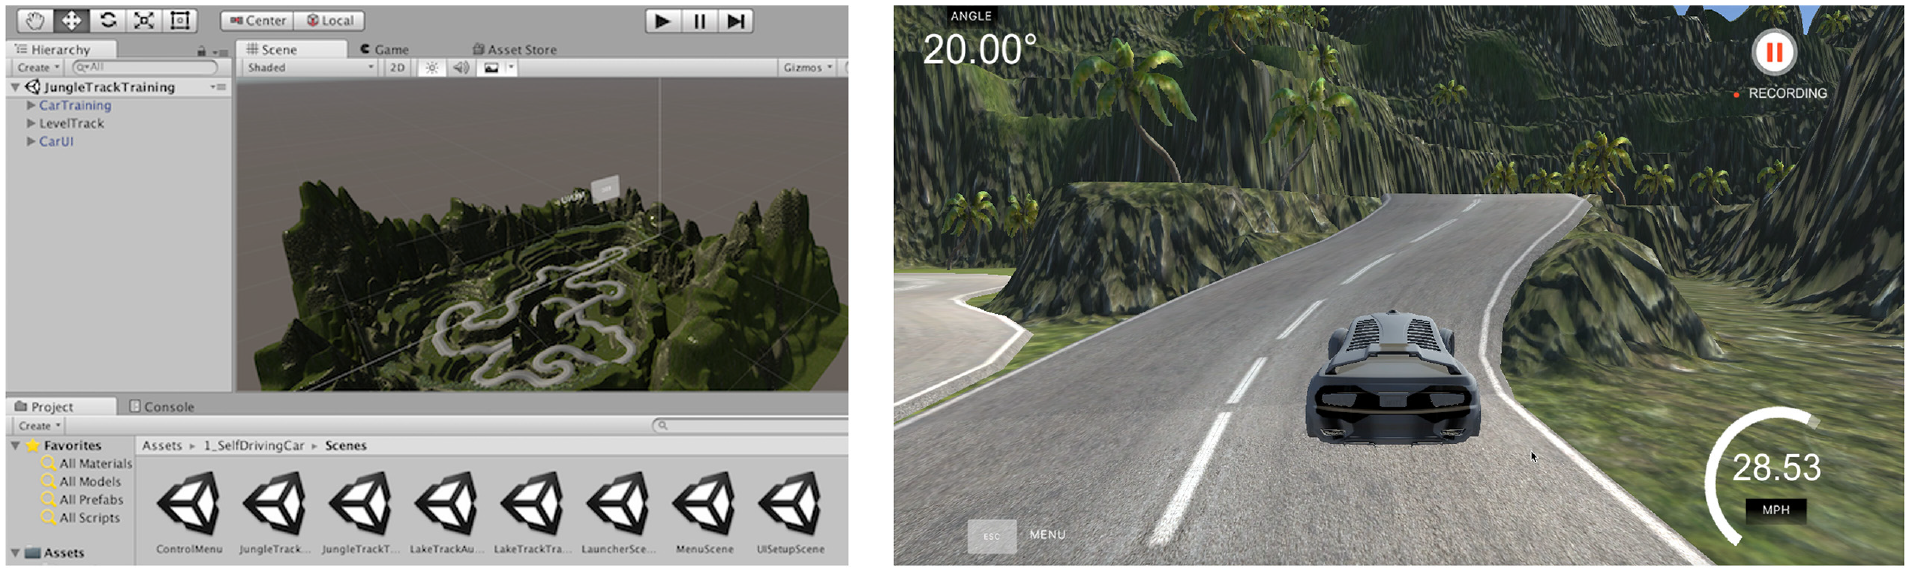
Simulator from Udacity’s self-driving car, Nanodegree.
Establishing N as a Driving Style Identifier
Following the player satisfaction model, we know that N represents the average number of rewards in the game activity, which is an important indicator to measure user experience. Observation of N is necessary to calculate the variables of the motion-in-mind model. Further, it is necessary to establish that N is linked with turns of the steering wheel and comfort levels.
To investigate the reasonableness of the N setting, we have conducted an experiment. Using the unity simulation environment, we asked the same driver to drive the same mountain road section (with many bends) 100 times in a row and observed the change in the subject’s growth. As a prediction, the subject’s N will slowly increase and then become stable at a value. The result is shown in Figure 5; as the player gained experience, their N will be larger, which means the veteran period players are more inclined to fine-tune the steering wheel with more N. An end-to-end learning environment was used in this experiment.
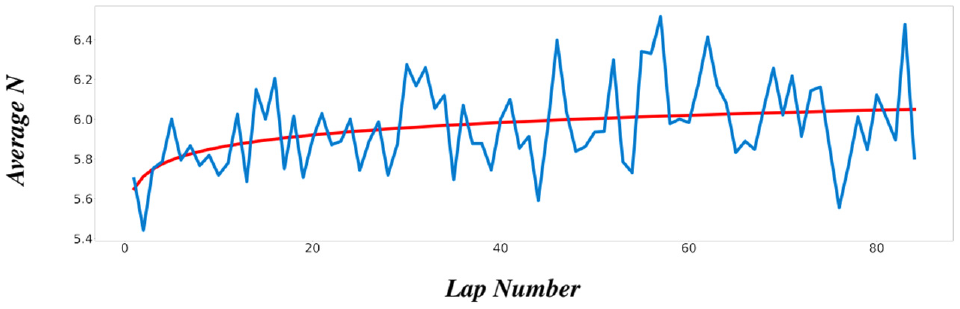
Variations in N during the one-player 80-lap growth experiment (where N represents the average number of changes per turn.).
Driving Style Database Creation
The driving style database was created using two approaches. Firstly, experiments were conducted with human players, in which data was collected on the performance of human players during driving on the mountain road in Udacity’s self-driving car, Nanodegree. Secondly, experiments were conducted using artificial intelligence (AI) players, where an end-to-end learning algorithm ( 21 ) was used to train the AI average player and collect data on their performance in the same scenario. The use of AI drivers were necessary as a limited number of human drivers were available and the training data-set needed to be of reasonable size for proper implementation and testing of the methodology.
As for human drivers, 10 candidates of varying ages and personalities who had never used the simulator before and who had real-life driving qualifications were sought as subjects. Each driver did 20 laps of the circuit. We assumed that the first five laps and the last five laps were representative of the novice and expert behavior of each driver. Observations collected from 10 subjects were included in the database.
As it is not possible to rank or classify driving style from the data of 10 candidates/drivers driving on a self-driving simulator, AI was used to generate more driving data. The AI players are trained by the data of each driver’s novice and veteran periods. From 10 human players, the 20 models that were representative of individual styles were trained. In a follow-up experiment, 10 human players will perform manual classification for the 20 models from their performance to validate the results. It was designed to derive steering control commands directly using the end-to-end learning algorithm from the input video from the camera. Data of 200 laps of approximately were simulated using a standard-level AI driver model. As shown in Figure 5, it was found that the trends and values were largely correlated and therefore the simulation data could be approximated as an analogy to the human data.
Analysis and Results
Motion-in-Mind Model
In this section, the values for motion-in-mind model variables of the drivers when driving a car in a self-driving environment are reported in Table 4.
Motions in the Experiment for 10 Players
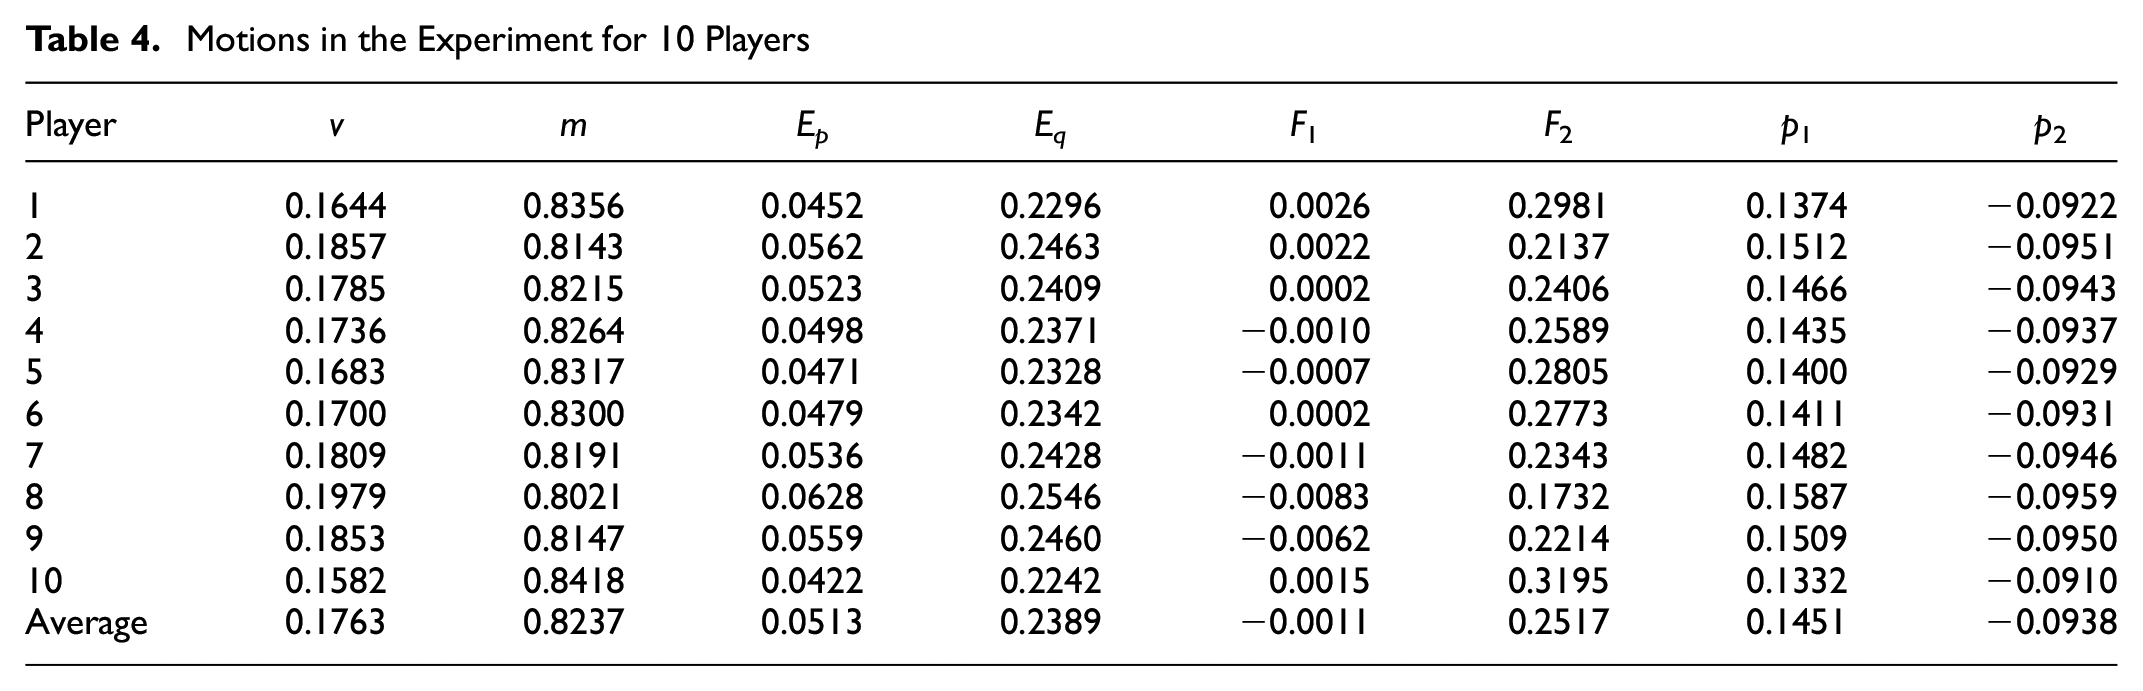
According to the motion-in-mind model, Ep is subjective energy and represents the connection between the player and the game; when the Ep value is large, the player has high subjective energy and a stronger subjective connection to the game. Through the data we can see that the mean value of Ep is 0.0513, ranging from 0.0422 to 0.0628, while the Eq value is much larger than the Ep value, with a value of around 0.2390. The objective game energy is greater compared to the player’s energy connection to the game, and indicates that the driving activity is an activity with low freedom, where the driving process is limited by road settings, safety considerations, and other factors. The objective settings of the activity itself place great restrictions on the driver’s behavior. Thus, the objective energy needs to be greater than the subjective energy. Similarly, the F-value represents the force between the game and the player, and in the case of driving activities, the force of driving itself is similarly greater than the driver’s willpower to ensure safety. In the F1 values we find that players 4, 5, 7, 8, and 9 are even negative, indicating that in this process the player does not manage the whole process very well and is not able to gain the initiative under the rules. Whereas momentum indicates the intensity with which the player can advance the game, in the driving activity,
Classification Results
As discussed in the Methodology section, the driving database was classified using the k-means clustering algorithm. Here, F1, Ep, and acceleration are used as the benchmarks for classifying the 600 driving clips of 10 players, and determined the driving style of the player according to their percentage (Figure 6).
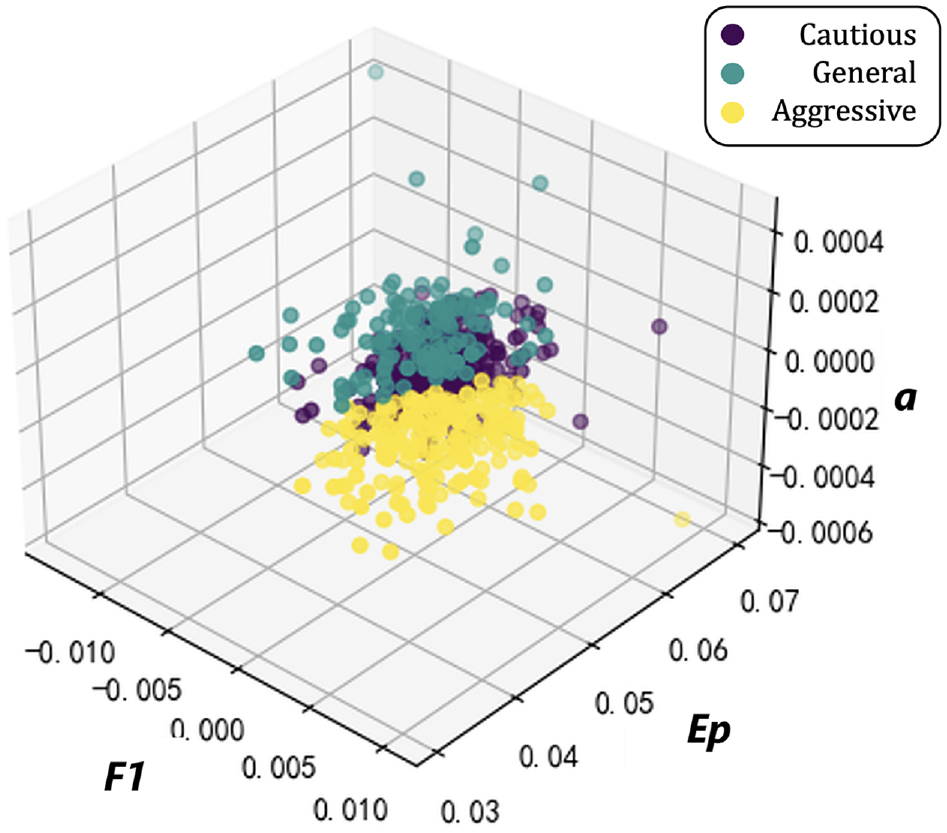
The k-means classification result.
The number of elements in the three clusters was 129, 278, and 193, and the three centers are [−0.47, 0.49 −0.25], [−0.35, 0.01, 1.37], and [0.91, −0.72, −0.55]. For the cautious driver there is usually a smaller F1, taking less initiative to follow the rules of the game to the greatest extent possible, and a larger Ep, that is, more energy to interact with the game to keep an eye on it and ensure it is under control. and a smaller realistic acceleration. Aggressive drivers, on the other hand, usually have a larger F1 and are more focused on taking greater initiative to enjoy the thrill of the act of driving as opposed to respecting the rules. Smaller Ep values indicate less subjective energy interaction during the process, with drivers enjoying the feeling of losing control of themselves more, while requiring less acceleration to ensure safety. Whereas between Ep and F1 for an average (general) driver, acceleration is approximately equal to 1 to ensure safety and smooth driving.
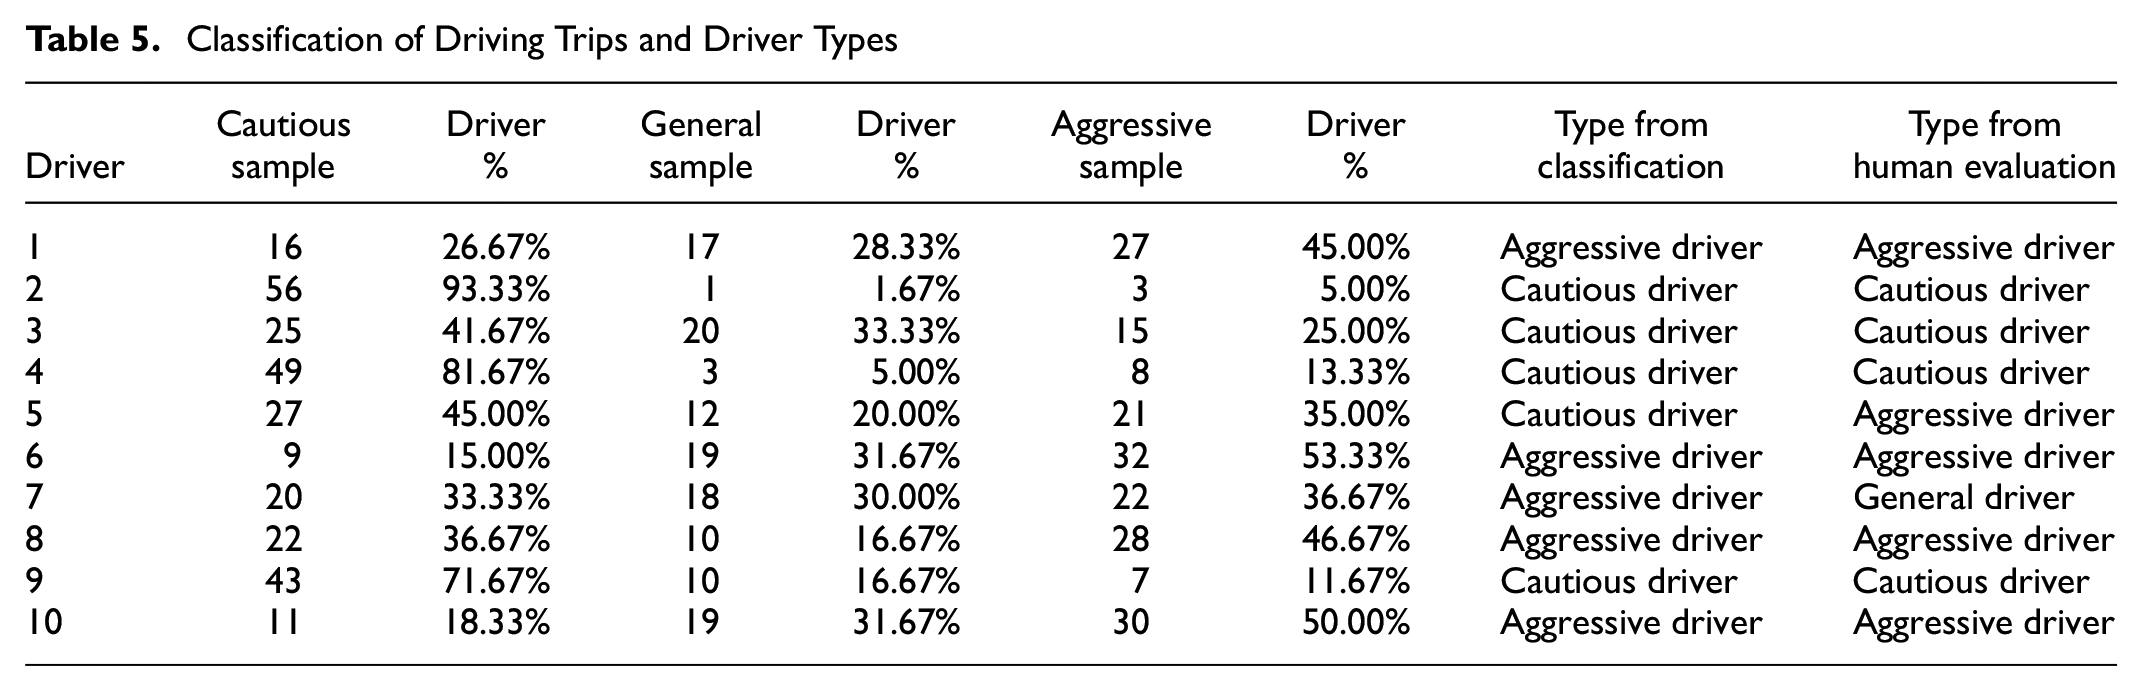
The driver type was identified based on the highest percentage of driving trips, as shown in the Table 5. No driver was identified as general/average type. Further to the k-means clustering, a subjective evaluation was carried out by voting. In this process, 10 subjects were shown a set of 20 randomly chosen videos of driving from the created database. The subjects then classified the driver of each video into a category. The results of this experiment were compared with the data obtained from Table 5 and there was an 80% match between subjective voting and machine learning-based classification. Machine clustering classification focuses more on the data performance of each segment of samples. In our experiments, we selected three relevant metrics to classify the driving style of each person for multiple segments of samples, whichever accounted for more. However, when classified by human players, the overall atmosphere of driving will be of interest. For example, in divergent player 5, the machine classifies the player as cautious because the number of samples classified as cautious is higher, yet the player also has a fairly high number of aggressive samples, so the majority of human players with respect to overall atmosphere believe that their style should be more aggressive. This resulted in a difference in the data. To eliminate or reduce such discrepancies, we believe that valid indicators for this issue could be added to future studies.
Classification of Driving Trips and Driver Types
Conclusion
This paper proposes to use GR theory to model the behavior of self-driving cars. The motivation behind this implementation was the idea that a driver would draw the most enjoyment out of a riding experience in a self-driving car environment if the driving style of the driver matches that of the car. Accordingly, the study designed an experiment where a driver’s style was classified based on their steering wheel handling characteristics when negotiating turns in Udacity’s self-driving car, Nanodegree. An end-to-end deep-learning algorithm was used to measure the driving behaviors. The steering wheel handling characteristics were measured and then modeled using the motion-in-mind model of GR theory. The motion-in-mind variables were further classified to identify the driving style of each driver. The study provided the first application of successfully modeling the self-driving car environment as a game and establishing that driving style can be identified from the interaction of a driver with the steering wheel of a Nanodegree vehicle. In the future, a more complex and detailed formulation of the motion-in-mind concept for driver satisfaction modeling can be developed by including more driving variables. Adaptation of assisted or automated driving according to the characteristics of the rider for enhanced satisfaction and driving comfort can be explored further with experimentation in a simulated self-driving environment especially for dangerous conditions. Also, real-world rewards are often not simply a varied schedule but frequently the consequence of a combination of sophisticated reward mechanisms. In such situations, the ambiguity generated by rewards has ramifications for player psychology and game participation that call for additional study.
Footnotes
Author Contributions
The authors confirm contribution to the paper as follows: study conception and design: X. Kang, W. Qiu, H. Iida, B. Ghosh; data collection: X. Kang, W. Qiu, H. Iida, B. Ghosh; analysis and interpretation of results: X. Kang, W. Qiu, H. Iida, B. Ghosh; draft manuscript preparation: X. Kang, W. Qiu, H. Iida, B. Ghosh. All authors reviewed the results and approved the final version of the manuscript.
Declaration of Conflicting Interests
The author(s) declared no potential conflicts of interest with respect to the research, authorship, and/or publication of this article.
Funding
The author(s) disclosed receipt of the following financial support for the research, authorship, and/or publication of this article: This research has been supported by funding from European Union’s Horizon Europe Research and Innovation Program under grant agreement 101056931. This research has also been funded by NexSys which is financially supported by Science Foundation Ireland under the SFI Strategic Partnership Programme (Grant 21/SPP/3756)