
Abstract
Crowdsourced shipping or crowdshipping is a promising solution to sustainable parcel delivery, owing to the potential to consolidate freight trips with preexisting passenger trips. Previous literature focuses on these consolidation benefits but does not address the possibility of new activity generation in crowdshipping. In this study, we investigate the willingness of private persons to accept shipments based on a newly generated home-based trip. We compare this to the choices of occasional carriers who build on the daily home–work commute to deliver parcels. Two stated preference experiments are conducted and a multinomial logit choice model and a latent class choice model are employed. These allow us to provide values of time of the occasional carriers, as an original contribution to the literature. The results show that commute-based carrier values of time are higher than those of home-based carriers. Concerning the trip generating power of crowdshipping, we find that low-income groups have a relatively high propensity to generate a home-based pickup and delivery trip. Finally, parcel lockers as delivery points positively influence acceptance of crowdshipping requests, as they allow for more flexibility in delivery times. Together, these results support the notion that crowdshipping can act as a potential trip generator in households.
Consumers’ expectations for last-mile delivery are becoming more sophisticated with on-demand, customized, and low-cost delivery requests ( 1 ). Currently, the share of same-day or instant delivery orders lies around 25% and is increasing among younger consumers ( 2 ). As a consequence, last-mile delivery has become the least efficient segment of the supply chain, responsible for almost 30% of total delivery costs ( 3 ), as well as the most polluting part ( 4 ). Logistics service providers are continuously challenged to meet customer demands and reduce the resulting pressure on delivery costs. One option is to outsource shipping assignments to private individuals who can act as an occasional, cheap carrier. Whereas this approach might reduce costs, it could also lead to new trips and therefore increase the burden on traffic and the environment. Whether this outsourcing relieves or exacerbates the negative externalities of last-mile deliveries remains an open question.
Crowdshipping is defined as a service that links senders (citizens) to a crowd of travelers (i.e., occasional carriers; OCs) who are potentially willing to pick up and deliver packages ( 5 ). In current implementations of crowdshipping, app-based platforms play the role of matching the senders of shipments to the OC community ( 6 , 7 ) and arrange for their monetary compensation ( 8 ). OCs make a trade-off between the effort involved in the pickup and delivery versus this fee. The most efficient case is when a traveler who has already planned a trip for their own private purposes agrees to deliver a package on the way to their destination. The service could result in a more environmentally friendly delivery of goods and reduce the volume of freight trips in a city ( 9 ). Despite these theoretical benefits, it is still not completely clear whether the expected positive outcomes of such a service can be achieved in practice. This is partly because of the possibility of carriers making detours from their original trip ( 10 ). However, there might also be OCs who had not planned to take a trip and generate a new trip just to deliver the parcel. Our study focus is on this second possibility.
Much of the crowdshipping research focuses on crowdshipping users ( 11 – 13 ) and on OCs—travelers who occasionally act as couriers ( 12 , 14 , 15 ). Several lines of evidence in previous studies show the promising effects of crowdshipping when connected to other logistics services such as parcel lockers (PLs)—also one of the main focuses of this study ( 16 – 18 ). In the literature, the mentioned benefits of such a service are similar to the ones attributed to ride-hailing applications, such as Uber or Lyft, in their early times. However, after the initial implementation, the use of ride-hailing platforms resulted in an increase of vehicle kilometers and a full-time profession for some of its drivers ( 19 ). With this in mind and to foresee such side effects, we aim to investigate the willingness of people to become an OC in more detail, with two main crowdshipping scenarios: commute-based and home-based. Commute-based crowdshipping relates to a delivery based on regular commute patterns such as work, education, or recreational purposes ( 12 , 14 , 15 ). These OCs are characterized as “those who travel anyway” ( 8 ). However, we argue that crowdshipping can also cause new trips. We refer to this second category as home-based crowdshipping.
This research has a twofold objective. First, we aim to investigate the willingness of OCs to execute deliveries within a crowdshipping system, during planned commute trips as well as with newly generated delivery trips. In this system, carriers can make use of complementary PLs. Second, we aim to identify any heterogeneity in preferences among OCs. Noting the novelty of crowdshipping, our study aim to provide new insights into crowdshipping by applying state-of-the-art models: (1) a stated preference (SP) survey with crowdshipping scenarios: commute-based and home-based; and (2) a latent class analysis revealing user groups with distinctly different preferences.
In the following, a brief literature review on crowdshipping is provided. Next, the methodology used and the research results are presented. Finally, our conclusions from the research are discussed.
Literature Review
Several streams of research can be identified on the topic of on-demand delivery crowdshipping from the OCs perspective. Archetti et al. propose that crowdshipping can be modeled as a novel variation of the vehicle routing problem ( 14 ). The authors find that crowdshipping can achieve significant cost savings if many OCs are available and if they show flexibility in executing the delivery task. In addition, crowdshipping requires fewer freight vehicles ( 14 ). Another optimization study based on a large-scale mobile crowd tasking model show that OCs are preferred to perform last-mile deliveries ( 20 ).
Studies on the underlying determinants of OC behavior are limited ( 15 ). A recent behavioral study show that OCs are willing to travel longer distances depending on the compensation they are offered ( 15 ). It is generally assumed that OCs have free capacity in relation to space and time ( 8 ). Another behavioral study shows the market potential of bicycle crowdshipping for both users and OCs ( 12 ), taking into account the demand and supply sides of such a service. Punel et al. highlight that crowdshipping is generally cheaper than traditional delivery, which brings economic convenience for its users ( 11 ). However, the core assumption is that crowdshipping participation is based on minimizing driver detours ( 21 ), in other words, willingness to pick up a parcel is determined by the delivery location being near to the OC’s working place, home, or close to their destination point.
Not all studies are positive about the possible impacts of crowdshipping. A simulation study ( 10 ) find that car-based crowdshipping may be less environmentally friendly than public transport-based crowdshipping. Similarly, Tapia et al. highlight that crowdshipping is likely to increase congestion and emissions owing to its trip generating effect ( 22 ). Another study states that the mode is crucial when evaluating crowdshipping performance and impact in cities ( 17 ). Crowdshipping is described as “a double-edged sword” for sustainable logistics operations ( 10 ). Depending on the different implementations of crowdshipping, its impacts might result in unintended consequences, for example, in emissions, travel times, and congestion.
Since crowdshipping is in its early growth stage in most countries, there is insufficient data available to analyze the actual impact of such a service. However, it may be possible to draw parallels between crowdshipping and recent research on the possible risks of ride-hailing and shared economy services for sustainable mobility ( 23 ). A recent study highlights the effects of ride-hailing services on vehicle kilometers traveled as well as on environmental inefficiencies ( 24 ). Well-known service providers such as Uber and Lyft ( 25 ) see crowdshipping services as a possible addition to their business model, to fill idle capacity and time. However, it is still not clear whether such a service might create new trips for people who are available to pick up a delivery and drop it off at its destination. Some studies point out that certain sociodemographic characteristics can be determinants of becoming an OC. Rai et al. discover that age, gender, ethnicity, and education affect the willingness to become an OC ( 26 ). Le and Ukkusuri also include the relevant socioeconomic variables employment and financial circumstances in their study ( 15 ). The consequences of the generation of new trips have not yet been studied systematically, however. Our study aims to contribute to filling this void.
Limited research has been undertaken to date with regard to the potential of connecting PLs with crowdshipping services. The success of crowdshipping depends on the connectivity of the service to other last-mile delivery options ( 17 ). Gatta et al. assert that crowdshipping is a promising way to diminish pollution originating from last-mile deliveries in the city by making use of metro networks and smart lockers (i.e., PLs) inside or outside of stations ( 16 ). Another study investigates the possibility of connecting these two last-mile logistics services through optimization ( 18 ). The authors find that this type of joint delivery can result in higher delivery success rates. However, as PLs can potentially fuel the emergence of crowdshipping services, they can also contribute to the generation of new trips.
In summary, crowdshipping service markets have been studied through behavioral and optimization studies. These studies generally assume that travelers have already decided to make a trip close to the pickup or drop-off point. Therefore, the research question that arises from the literature review is,
When are occasional carriers willing to accept a delivery request, even if the delivery operation generates a new trip?
In the next section, we present the modeling methodology and the data acquisition approach taken.
Methodology
The general approach taken in this study is to model the discrete choice of OCs, that is, whether or not to undertake to deliver a parcel. We introduce the experiment design and the mathematical formulation of the model below.
Experiment Design
Figure 1 shows the conceptualization of the selection of alternatives, made by OCs. Various trip attributes are expected to affect delivery choice directly. For example, some people may be more inclined to become an OC if the total remuneration is high, whereas others may be reluctant because of the travel distance involved. Personal characteristics will influence sensitivity to different attributes, leading to variations in individual preferences.
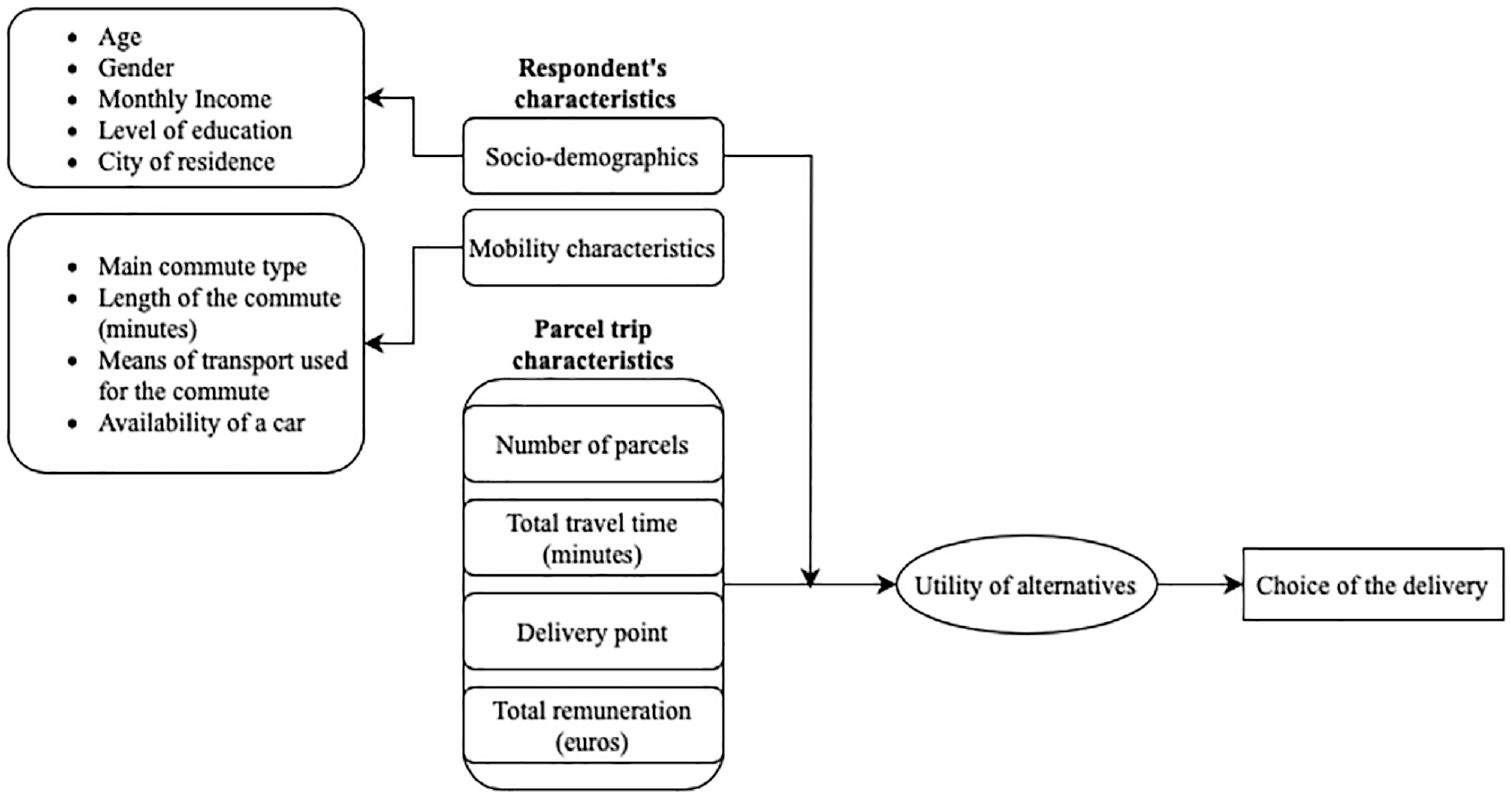
Conceptual model.
To test the conceptual model (Figure 1), a stated preference experiment (SPE) is designed for two reasons: firstly, no data are available on crowdshipping services that are linked to the required characteristics of OCs, that is, including their personal travel choices. Secondly, an SPE enables control over the choice sets presented to decision-makers ( 27 ). Our objectives for the SPE are twofold, and positioned within two SP scenarios. Firstly, we are interested in exploring the willingness to carry a parcel while traveling, given specific parcel characteristics as provided in the commute-based. Secondly, we focus on the possibility of carrying a parcel by starting a new trip from the home-based. Since both scenarios address the question of whether or not to become an OC, they need to be designed consistently.
The questionnaire was developed in the Qualtrics online web platform and data collection took place during July 2022. The survey was circulated among the authors' direct contacts and on social media platforms. Moreover, flyers were handed out in public areas to reach more respondents. There is particular interest in the student population because of previous research findings (12, 13). Only respondents who live in the Netherlands and are above 18 years of age were allowed to fill in the survey. Finally, 298 responses were ultimately collected, of which 250 were fully completed.
For the first SP scenario, the aim is not only to investigate willingness to drop-off a parcel at a PL or its final destination, but also to explore changing preferences depending on the possibility of picking it up before or after an activity. In this part of the SPE, respondents were asked to choose whether they would prefer to pick up a parcel before, after, or continue on their current trip uninterrupted (i.e., opt out of delivery), to see whether the specific point in time of the delivery affected willingness to become an OC. Additional data describing the mobility characteristics of the respondents were collected, such as trip motive, frequency, and available vehicles. It is important to point out that crowdshipping via public transport (PT) is not considered in the experimental design. PT travelers only completed the home-based survey. In the second SP scenario, respondents were asked to make a choice based on the assumption that they are at home and available to deliver a package. This part of the survey aims to explore trip generation resulting from new opportunities to earn money. The choice set includes “stay at home” (i.e., opt out) or to do the pickup and delivery either by bike or car (if available in the household). In this design, every respondent is assumed to have access to a bicycle, which was confirmed by the descriptive characteristics of the respondents. Attributes related to parcel operations are identified and validated through interviews with a crowdshipping company; these include number of parcels, total travel time, delivery point, and total remuneration. “Number of parcels” is included to generate credible variability in the remuneration and associated extra travel time involved, to allow us to test larger remunerations and travel times. It is worth noting that, in both SP scenarios, extra travel time and -remuneration are calculated as a function of the number of parcels, to increase the realism of the study. Total travel time and -remuneration are generated by multiplying the number of parcels with a detour per parcel and a remuneration per parcel. Only the total remuneration and -travel time are shown to the respondents.
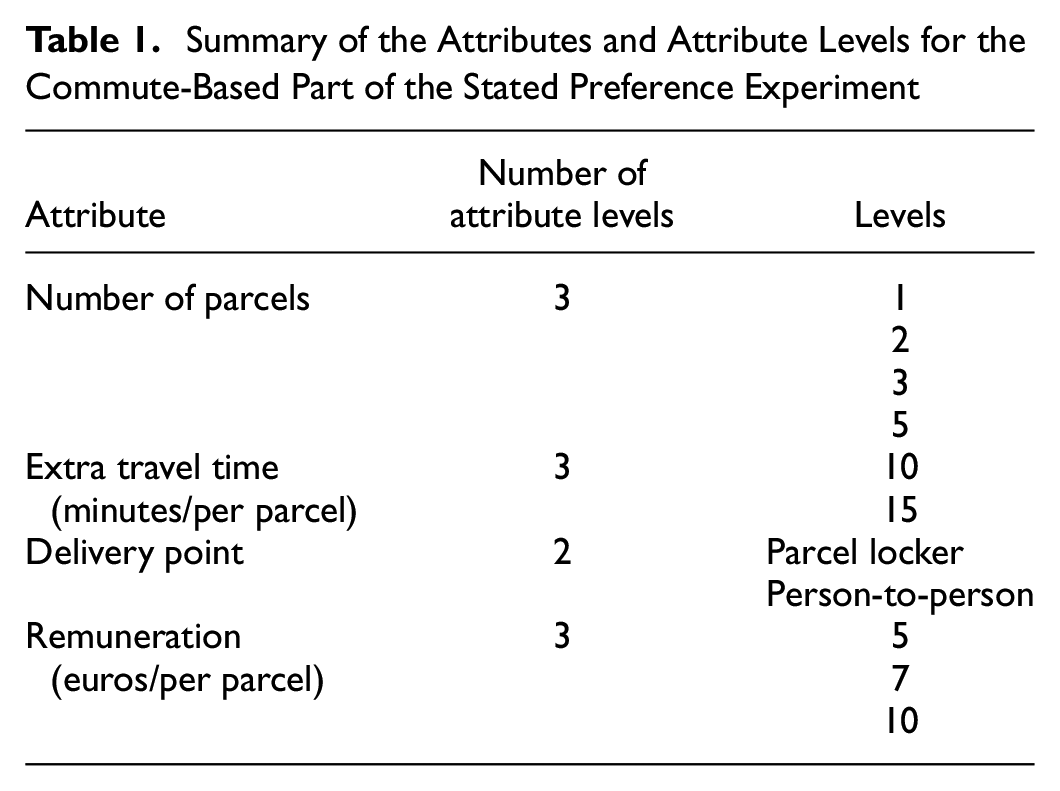
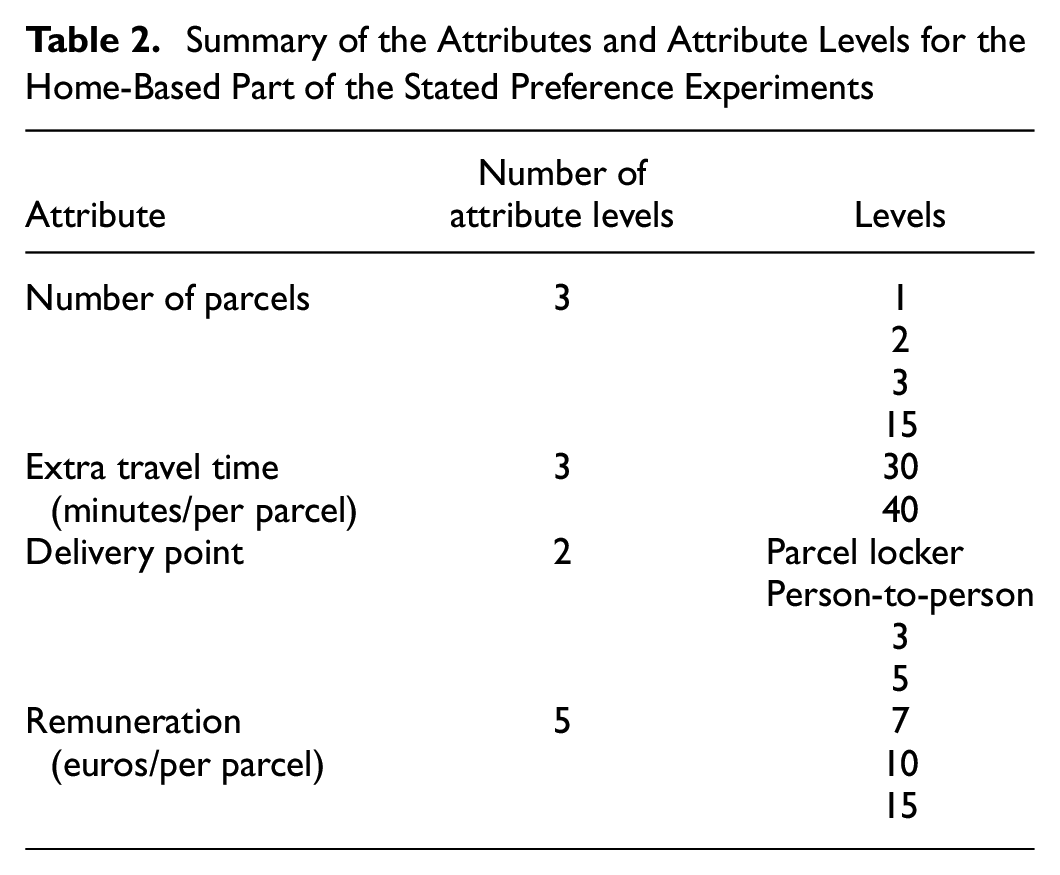
Tables 1 and 2 show the attributes and attribute levels for the commute- and home-based SPEs, respectively. The attribute levels are also validated through discussions with a crowdshipping service provider. Three levels are defined for the number of parcels and two levels for delivery points (DPs). Given the specific focus of the experiment, PLs, as a DP option, are considered together with person-to-person delivery. Importantly, extra travel time and remuneration are illustrated with different attribute levels. The reason for this is that there is no travel time effect in the home-based scenarios, therefore choice sets are designed with larger extra travel times and more levels of remuneration.
Summary of the Attributes and Attribute Levels for the Commute-Based Part of the Stated Preference Experiment
Summary of the Attributes and Attribute Levels for the Home-Based Part of the Stated Preference Experiments
An efficient design approach is used to generate the choice scenarios ( 28 ). The prior beta values for remuneration and cost are adopted from a Dutch value of time (VoT) survey ( 29 ). The effect of PLs is assumed to be slightly positive for three reasons. Firstly, the use of PLs provides a new level of flexibility for the distribution of products ( 30 ). Secondly, PLs enable different entities in the delivery channel to participate in a joint delivery ( 31 ). Lastly, owing to the nature of the crowdshipping service, OCs are travelers who are not employed by a commercial carrier, which might lead to privacy and safety issues since senders would not be willing to share their home address and personal information ( 8 ). Therefore, PLs can facilitate privacy and secure delivery since OCs and receivers do not need to meet face-to-face.
Delivery costs in the Dutch transport market range from €8 to €15 (US$1 = €0.93; 2023) among the main carriers for a small local-to-local (L2L) parcel. As stated, by defining travel time and delivery cost as a function of the number of packages transported, we aim to increase the realism of the study. Both SP scenarios have the same set of attributes, base equations, and priors. The experiment is designed in two blocks, and six choice situations for both commute- and home-based trips were randomly assigned to the respondents, that is, each respondent was faced with six delivery choice situations during a commuting trip and six for a home-based trip.
In the literature, an increasing tendency toward undertaking SPEs is evident, in which the features of the alternatives are pivoted based on the knowledge of the sampled respondents ( 32 ). To achieve this, SPEs utilize respondents' initial responses to derive the attribute levels in the experiment. For the commute-based scenario, a pivot design is used for the choice sets, incorporating the actual mobility characteristics of the respondents, including factors such as car availability, main commute type and length, and the actual transportation means used. These variables are used to create pivoted SP situations specifically tailored to the context of the commute-based experiment. Figure 2 shows an example choice task for a respondent who commutes for 5 to 15 min.
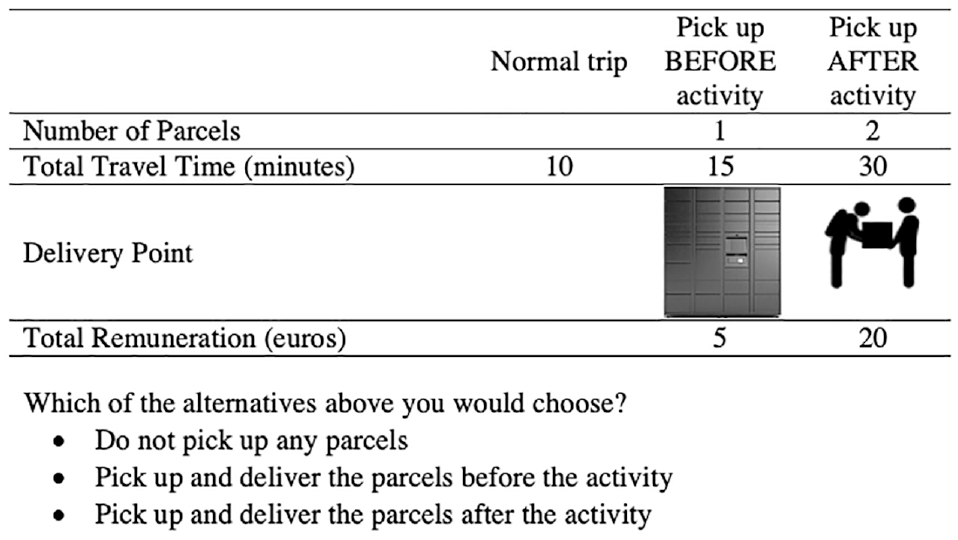
An example choice task for the commute-based part of the stated preference experiment.
In the second part of the SPE, based on the availability of car and/or bicycle, two different SP scenarios were directed toward the respondents. It is worth noting that an approximation of travel cost by car is added when this mode was available. Unlike in the commute-based SPE, the attribute levels were not pivoted around the current travel times of the respondents in this part. This is mainly because the home-based trips are initiated from home. Figure 3 shows the choice task for the home-based scenarios in which the respondent has both a car and bicycle available to them; Figure 4 illustrates a scenario when only a bicycle is available.
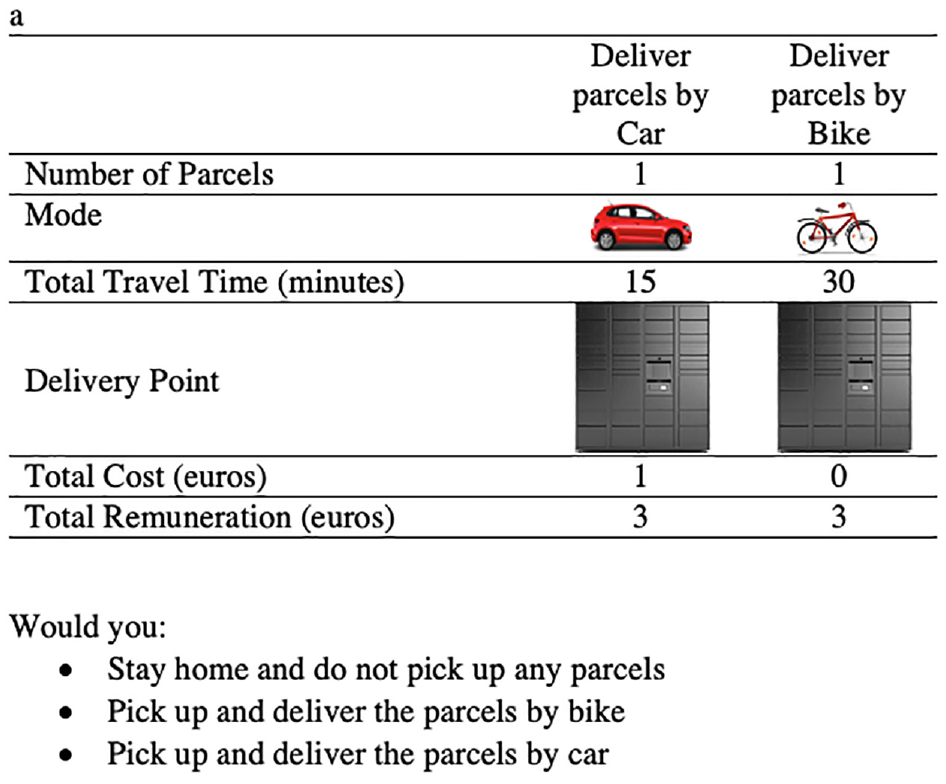
An example choice task for the home-based part of the stated preference experiment: both car and bike available.
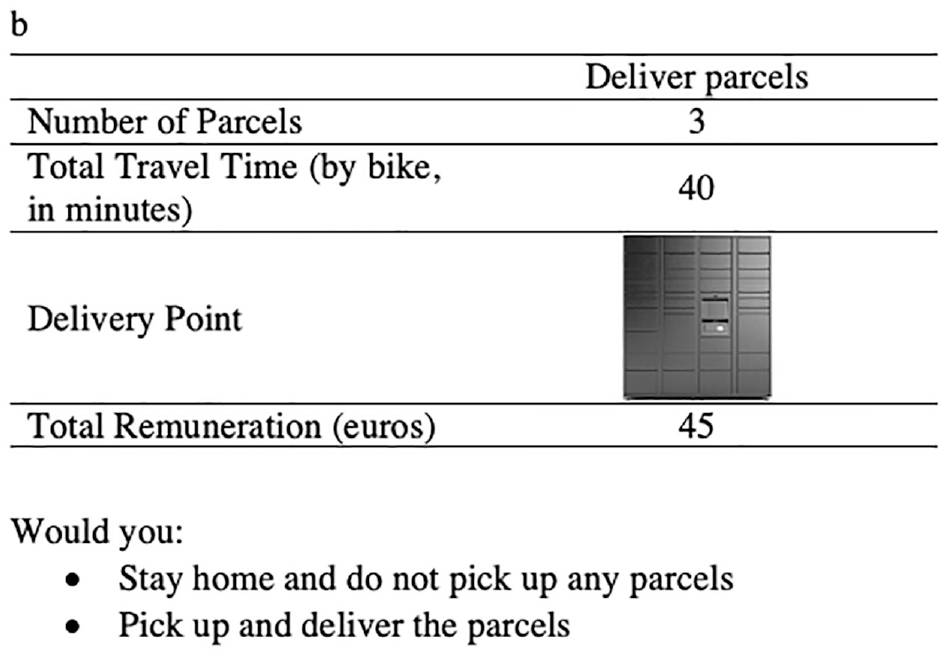
An example choice task for the home-based part of the stated preference experiment: only bike available.
Along with SP scenarios, the survey collated data on the sociodemographic- (e.g., age, gender, income level, level of education) and mobility characteristics of the respondents (main commute activity, the length of the commute, and transportation mode used).
Figure 5 gives an overview of the SPEs used in this study.
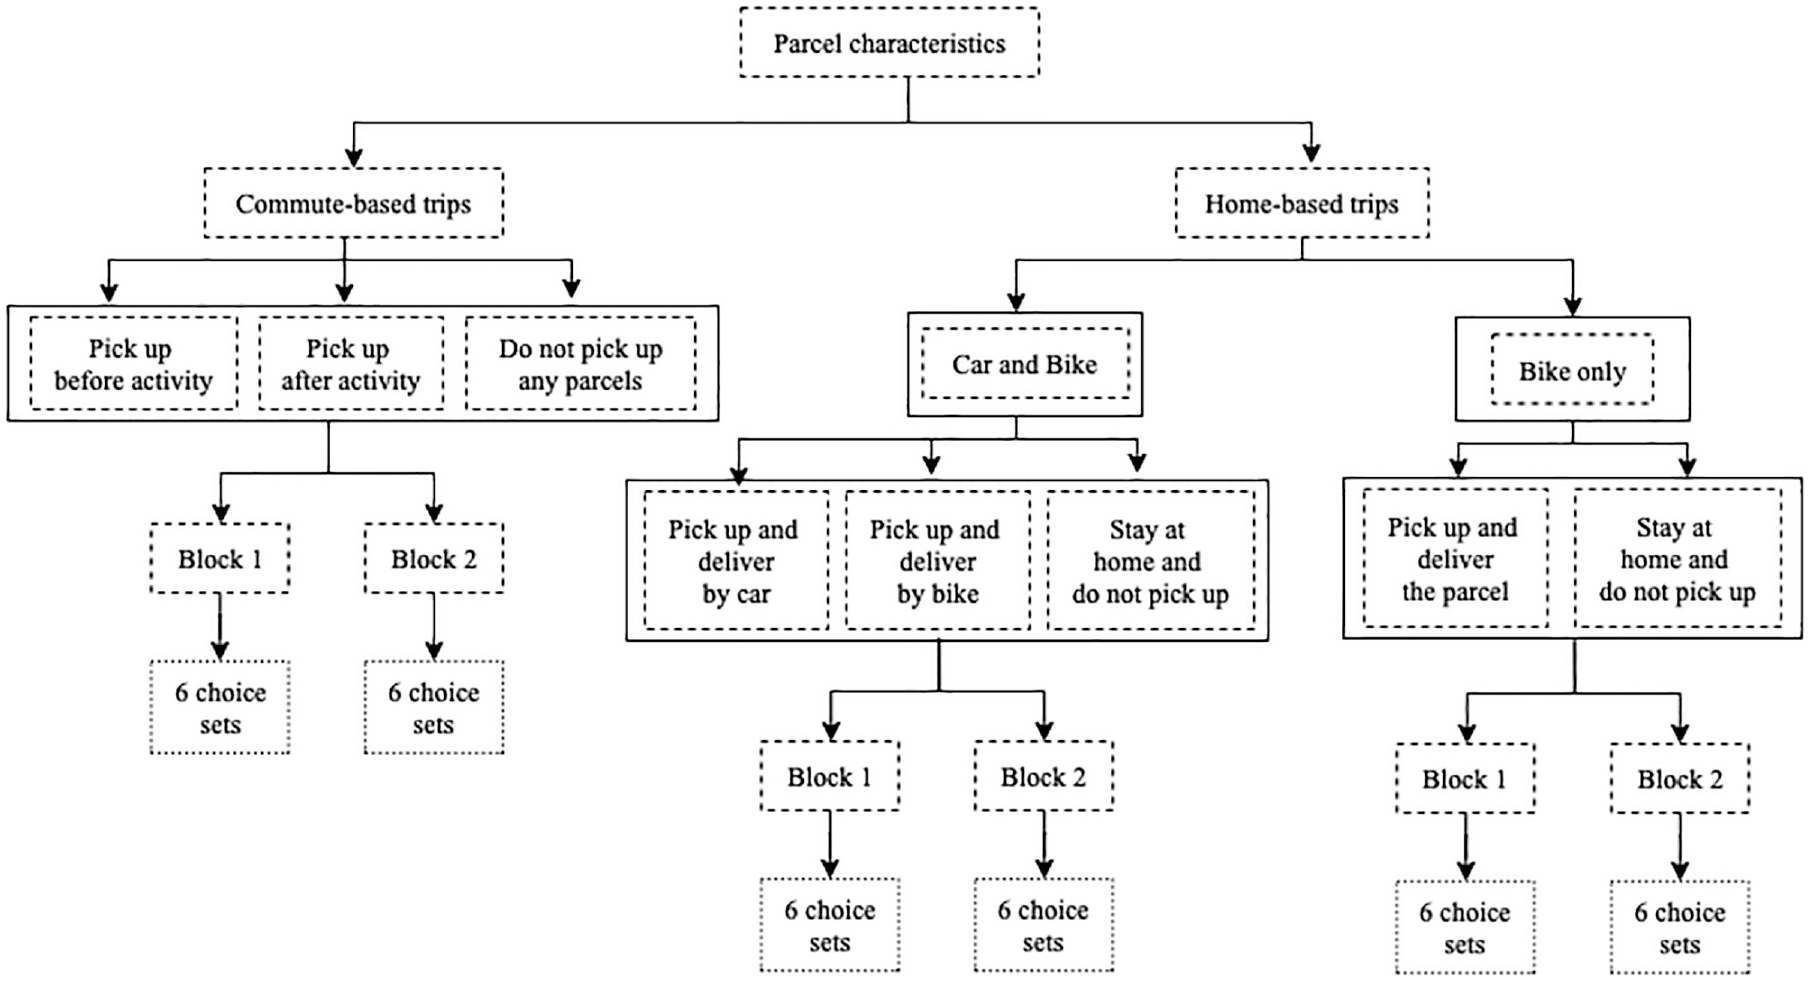
Overview of the stated preference experiments.
Discrete Choice Models
Discrete choice models (DCMs) are deployed to analyze the decision making of the respondents ( 33 ). Here, behavioral preferences of the respondents are identified using econometric modeling techniques. DCMs employ the principle of random utility maximization (RUM) ( 34 ), by which a decision maker is assumed to choose the alternative, i, that has the higher utility, Ui, than alternative j in a given choice set, M, as shown ( 35 ),

The utility of an alternative, i, is composed of a systematic component, Vi, which includes observed factors such as travel time, travel cost, and an error term,

The total utility is defined as a linear additive function and an error term, as shown in Equation 3. In the equation,

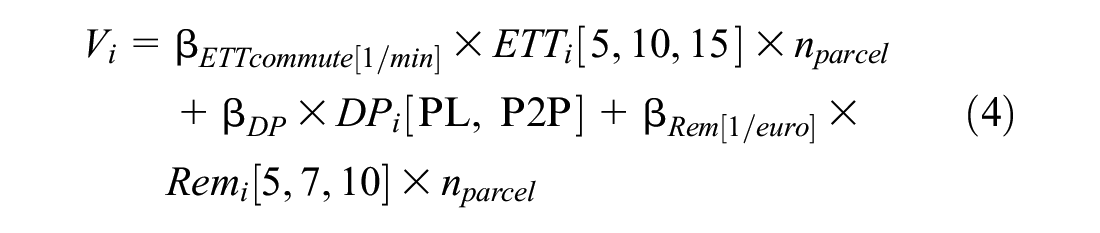
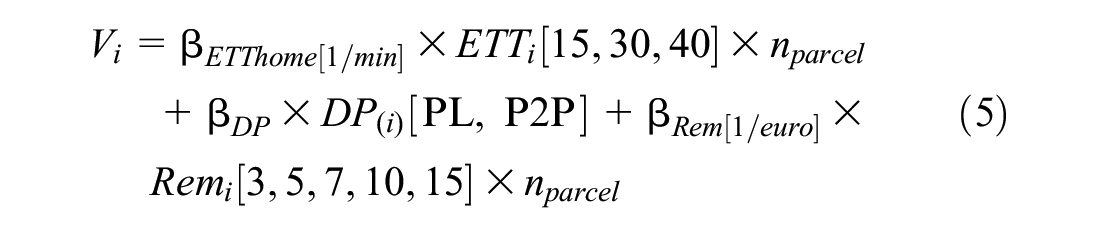
Equations 4 and 5 show the utility functions in relation to total travel time and -remuneration, with respect to the number of parcels. Here,
By using the coefficient for remuneration as the marginal utility of money, we can calculate VoT. To do this, the delta method is applied ( 36 , 37 ). VoT for low- and high-income classes are calculated as follows:

The multinomial logit (MNL) model is the most common and simplest way to model discrete choice under the RUM assumption. The approach assumes independent and identically Gumbel distributed error terms. In this type of model, the probability of a person, n, to opt for an alternative, i, is estimated by Equation 7 (Ben-Akiva and Lerman, 1985). Here, I denotes the set of alternatives used in the experiment.

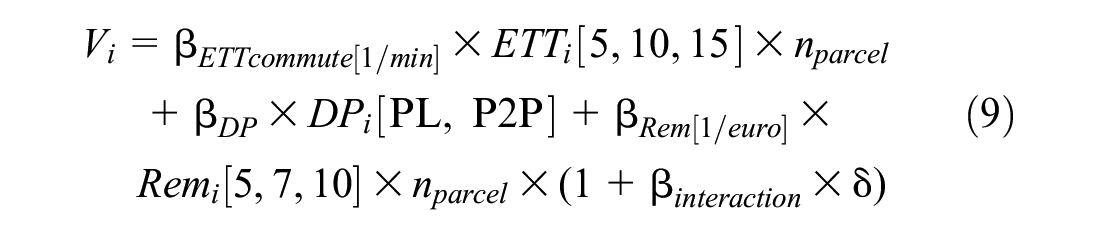
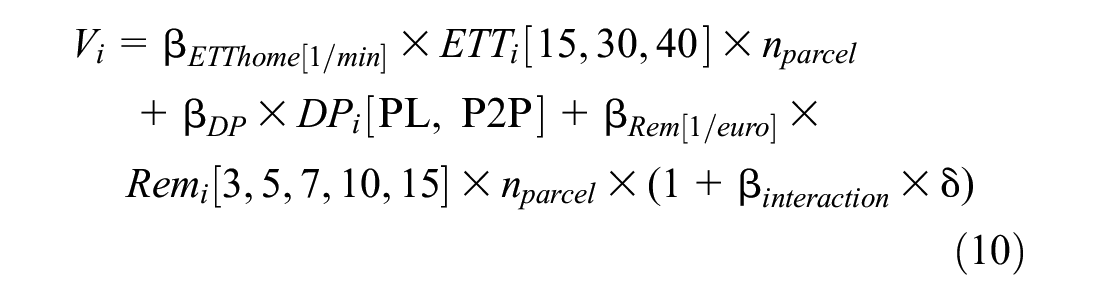
To improve the model and explore the impact of sociodemographic characteristics, interaction effects are added to the utility equations of the alternatives. At least one variable in these interaction terms varies depending on the alternative. The interactions are defined in a similar manner to that of Tapia et al. as follows ( 38 ):

where
With this representation of the interaction term, interactions can be interpreted as having a magnifying effect. The coefficient becomes
MNL models including only the main attributes are estimated using Equations 4 and 5 for the alternatives defined in the experiment, with the addition of socioeconomic interactions according to Equations 9 and 10. The resulting utility functions with interactions for MNL are shown below.
Although the MNL model is easy to interpret, the assumptions about the error term are very simplistic and provide little room to model heterogeneous groups of individuals. To better account for the heterogeneity of preferences within the sample, a latent class choice model (LCCM) is applied.
Latent Class Choice Model
The LCCM probabilistically splits the respondents into several nontrivial classes based on their choices and sociodemographic characteristics, and then stochastically allocates each individual into those classes ( 39 ). The model is run for an increasing number of classes, resulting in two optimum classes. The Bayesian information criterion (BIC) and Akaike information criterion (AIC) are used to determine the local measures of the model fit ( 40 ).
The LCCM is defined by Equation 11 (
41
) where

To investigate an individual’s probability of belonging to each class, a class membership function is estimated. This enables examination of whether the probability is related to personal characteristics or not; its formulation is given in Equation 12 (
41
). Class-specific constants,

To find the optimum number of classes, BIC and AIC were employed as indicators of global and parsimonious model fit. In general, the smaller these values are, the better the fit ( 42 ). We also considered the interpretability of the models and the size of the classes. It is important that behavioral models are realistic, that classes are distinguishable, and that they can be easily labeled based on the heterogeneity they represent ( 42 – 44 ).
Results
Sample Characteristics
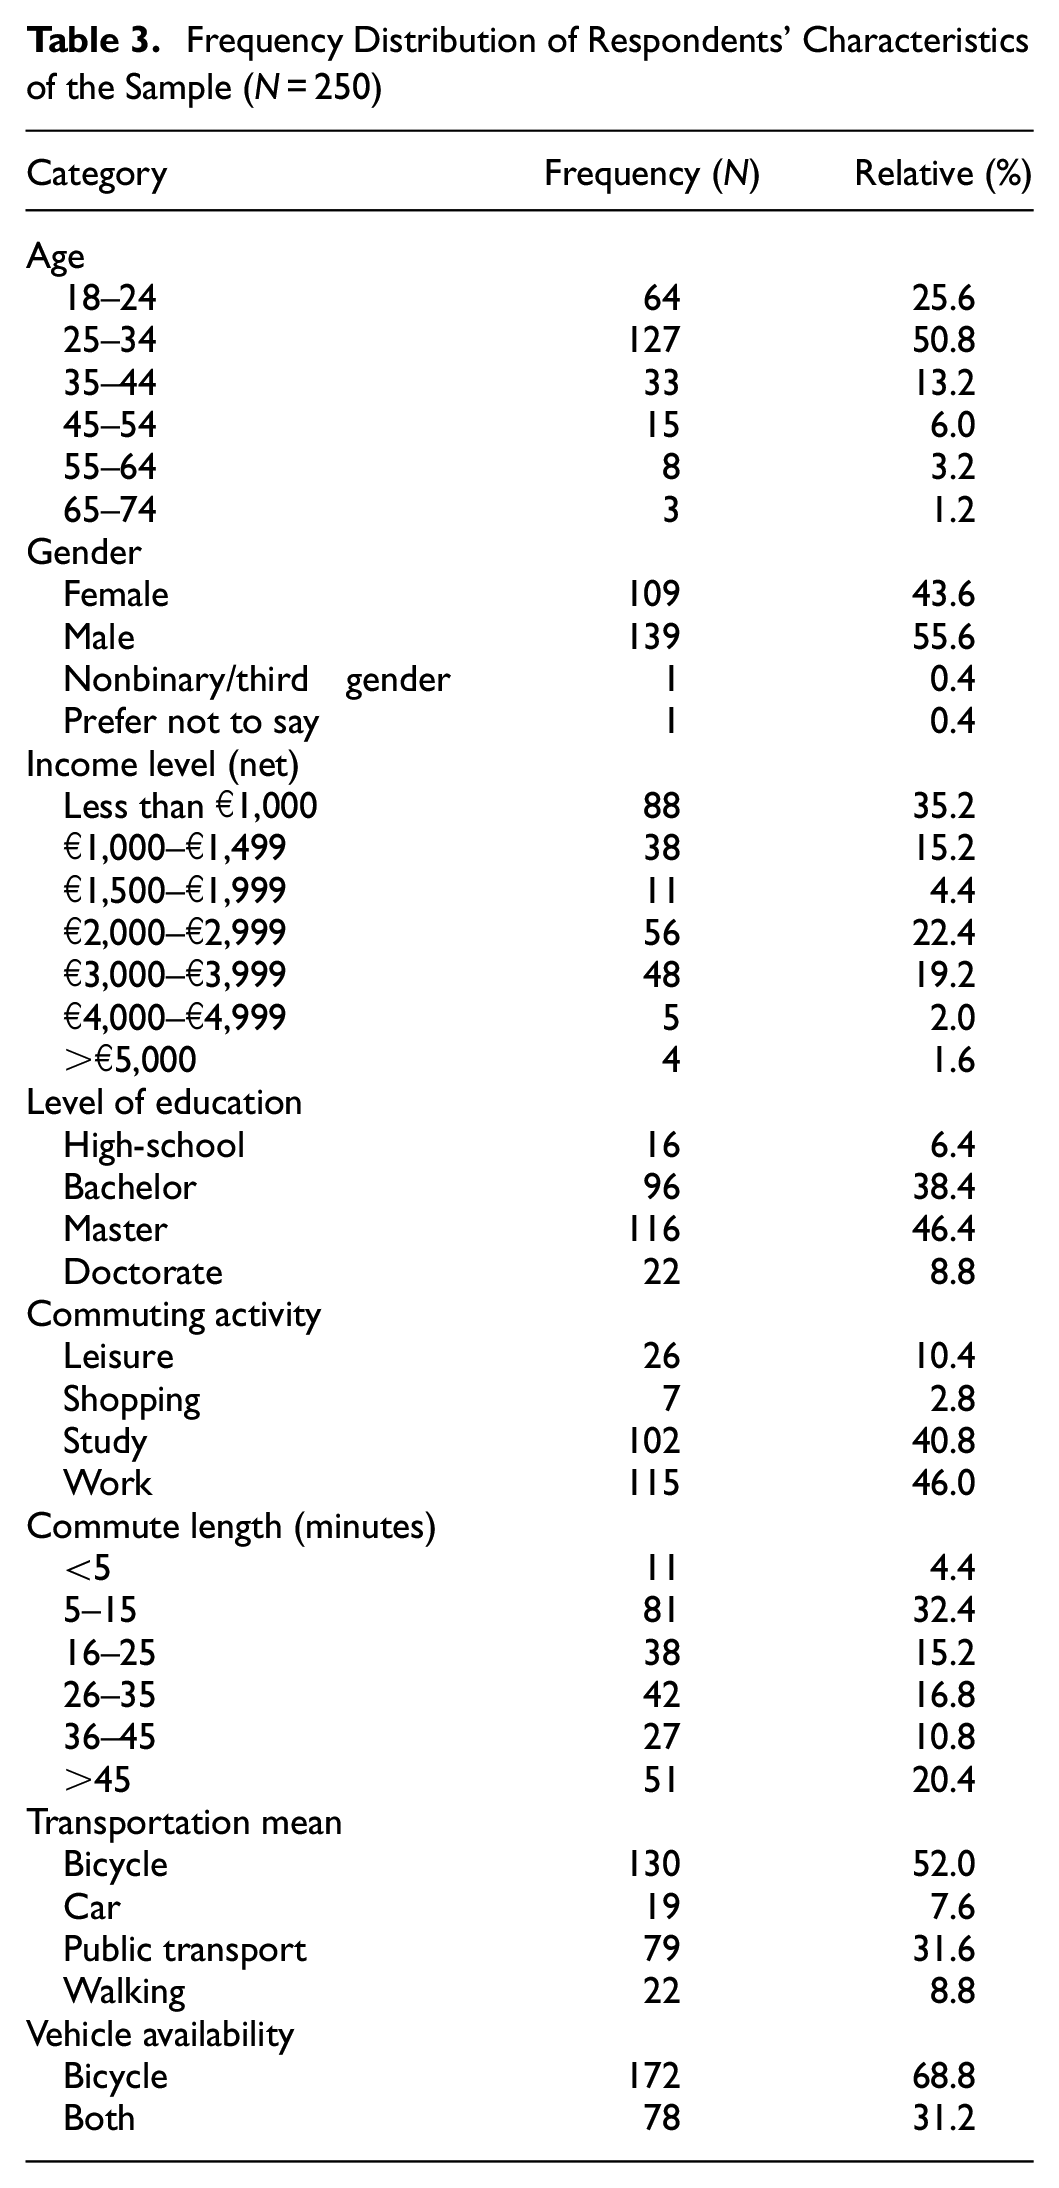
Based on the data, the frequency distribution of respondents’ characteristics is presented in Table 3. As can be seen, around 25% of the respondents belong to the 18 to 24 age group and about 35% of the respondents have a monthly net income of less than €1,000. Because a quarter of the sample consists of students, this result is as expected. For gender ratio, the sample is representative of the Dutch context ( 45 ). The sample includes highly educated individuals in the Netherlands, with almost half of the respondents holding a master's degree. Not surprisingly, the sample also shows that a considerable proportion of the respondents commutes for either study- or work-related purposes, and all respondents have a bicycle available, which confirms our aforementioned assumption (see the section describing the design of the experiment).
Frequency Distribution of Respondents’ Characteristics of the Sample (N = 250)
Descriptive Characteristics of the Stated Preference Experiments
Table 4 shows the frequency distribution of the sample choices within the two SP scenarios, namely commute- and home-based crowdshipping.
Descriptive Characteristics of the Stated Preference Experiments
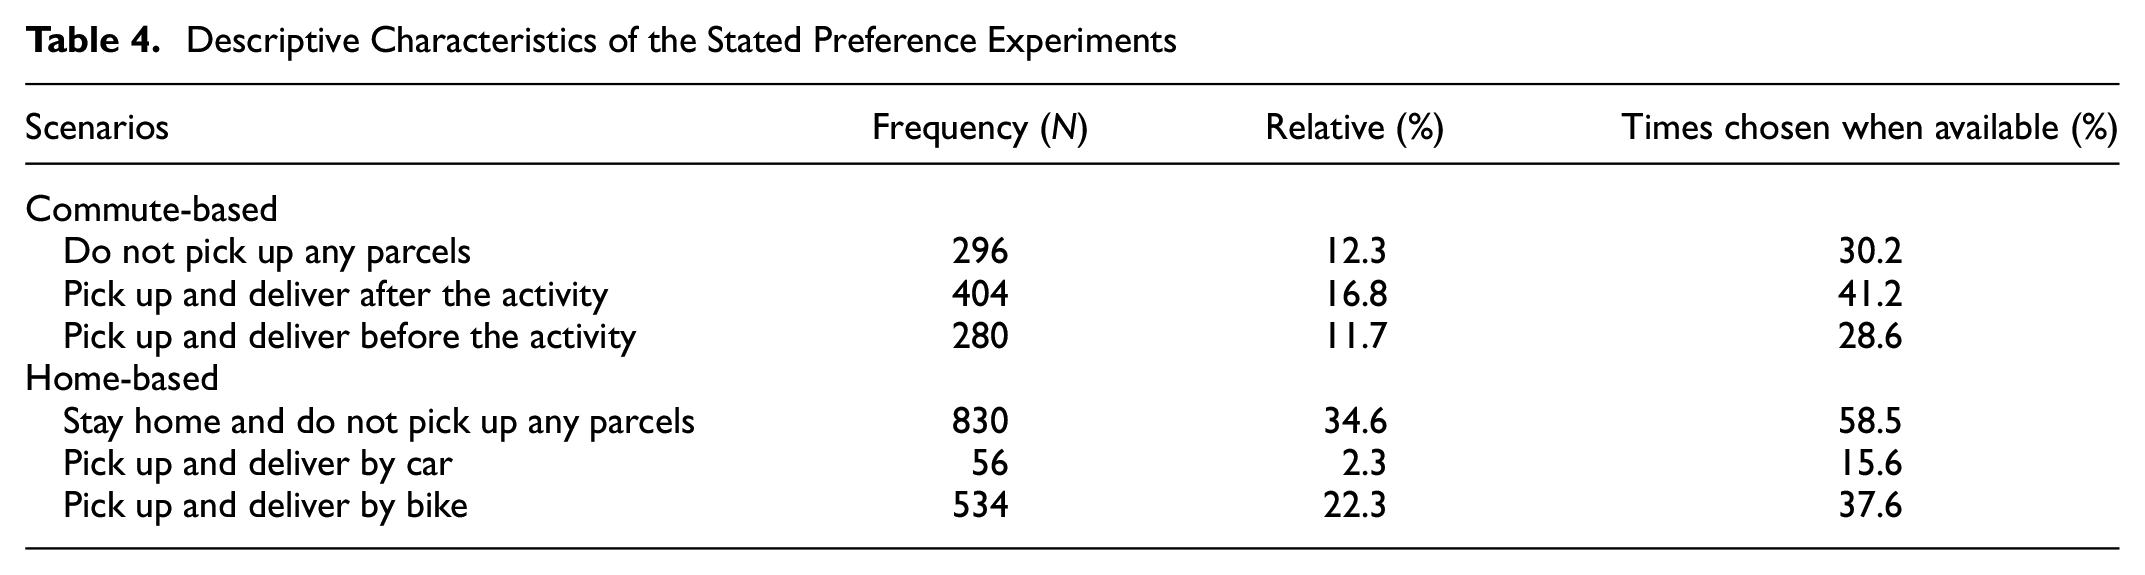
In total, 40.8% of the responses are collected from commute-based, and the rest consisted of home-based trips. The reason for this difference is that in the commute-based SPE, PT is not included as a choice alternative. However, respondents who commute by PT were able to complete the home-based SPE. An overview of the LCCM choices is given for commute- and home-based trips in Table 4. To do this, three indicators are used: (1) the times when an alternative was chosen, (2) relative percentage overall, and (3) the percentage of a chosen alternative when it was available. For commute-based trips, more than 40% of the responses indicate a preference for delivering parcels after the main activity, whereas almost 30% indicate a preference for pickup and delivery before the activity. Some 30.2% of respondents prefer not to pick up the parcel. For home-based trips, around 38% of the respondents select picking up and delivering parcels by bike—as expected, given the convenience of cycling in the Netherlands. However, the majority of the home-related responses (58.5%) indicate a preference for staying at home instead of delivering parcels. Because of the novelty of crowdshipping, it is not surprising that some might be skeptical about the service.
Modeling Results
The two SP scenarios—commute- and home-based—are combined into one model. Both scenarios reflect similar behaviors and have the same base design. By combining them in one model, we are able to consider the panel effect, in which there are multiple observations per individual, and we also consider the sequences of choices made by each person ( 46 ). To better integrate the models, the same remuneration coefficient is used. This allows us to link both situations and ensure consistency with broader microeconomic theory, which states that the marginal rate of substitution is identical at equilibrium ( 47 ). We also allow differences in travel times. This generates different VoTs for each scenario (commute- and home-based crowdshipping). We examine models containing various PL coefficients for each class as well as a model with a shared coefficient. The later option demontrates better statistical performance, as indicated by a lower BIC and AIC. This implies that both classess assign similar importance to the presence of PL, with a slightly positive value, indicating that respondents would be more likely to become OCs if a PL is utilized.
We test different utility function specifications, including nonlinearities and correlation between alternatives using a nested logit model ( 48 ). Estimations show that the MNL model and the LCCM provide the best model fit. Therefore, we opt for modeling willingness to become an OC in the commuting scenario, as shown in Equation 4; whereas home-based utility is shown in Equation 5.
From Tables 5 and 6, it can be seen that the MNL and LCCM share the same variables: total travel time (commute-based), total travel time (home-based), DP (PL), and remuneration. All coefficients have the expected sign, indicating the direction of the relationship: negative for total travel times, and positive for remuneration and the use of PLs. Specifically for car-based crowdshipping, we include total delivery cost in both models, as shown in Figure 3. Since this attribute is not statistically significant in home- or commute-based crowdshipping scenarios, we add delivery cost to the utility function by equalizing it with the difference in remuneration. With this, we aim to capture the effect of travel cost by car on remuneration. We set a p-value threshold of less than 0.05 (i.e., a coefficient p-value > 0.05 indicates that the corresponding parameter is not statistically significant, whereas a p-value below 0.05 indicates statistical significance. When an observed result is statistically significant at a p-value of 0.05, it indicates that the null hypothesis is unlikely to encompass the range of values within the 95% confidence interval [ 49 ]).
Multinomial Logit Model Results
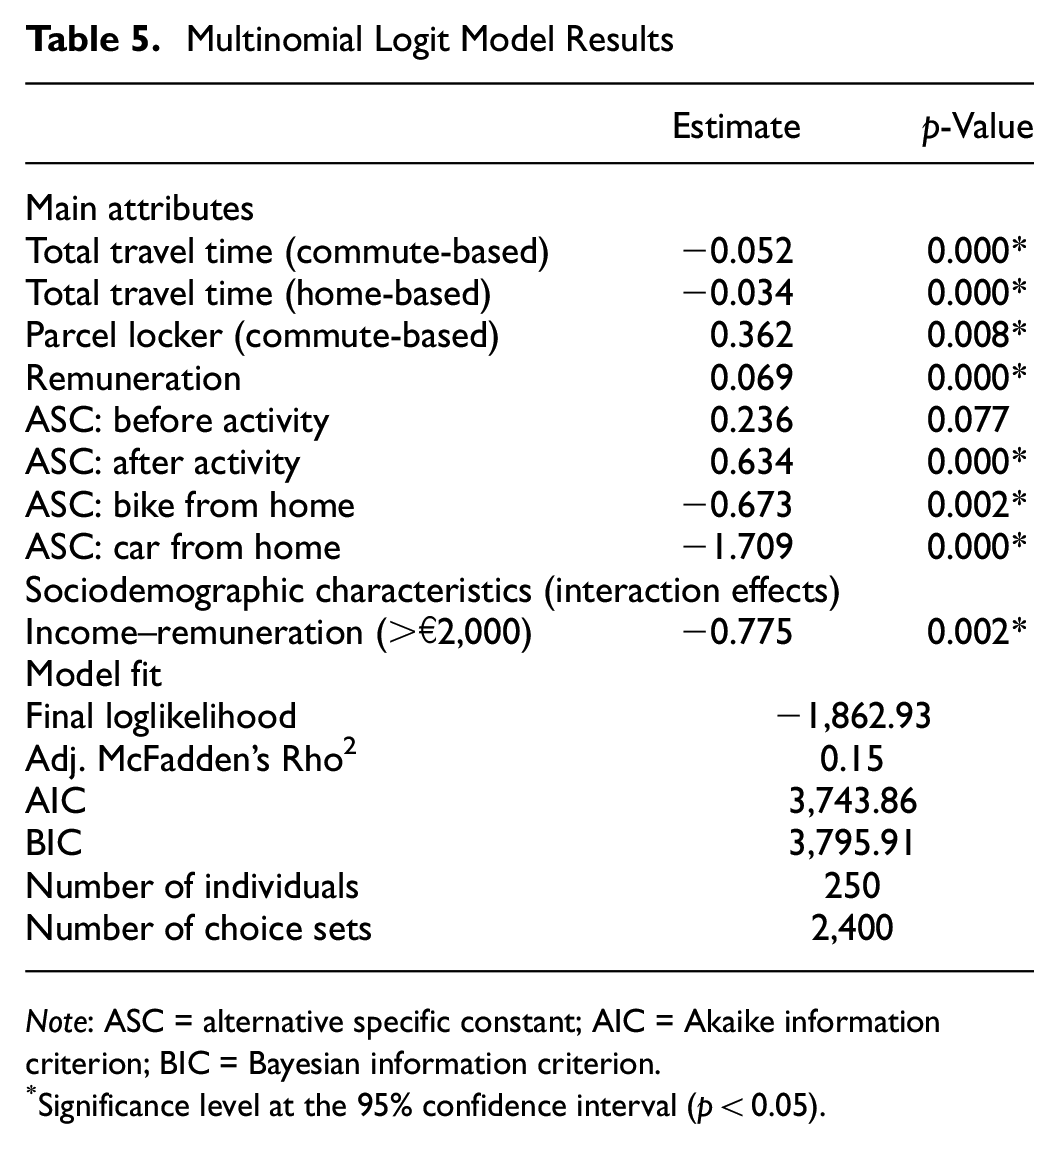
Note: ASC = alternative specific constant; AIC = Akaike information criterion; BIC = Bayesian information criterion.
Significance level at the 95% confidence interval (p < 0.05).
Latent Class Choice Model Results
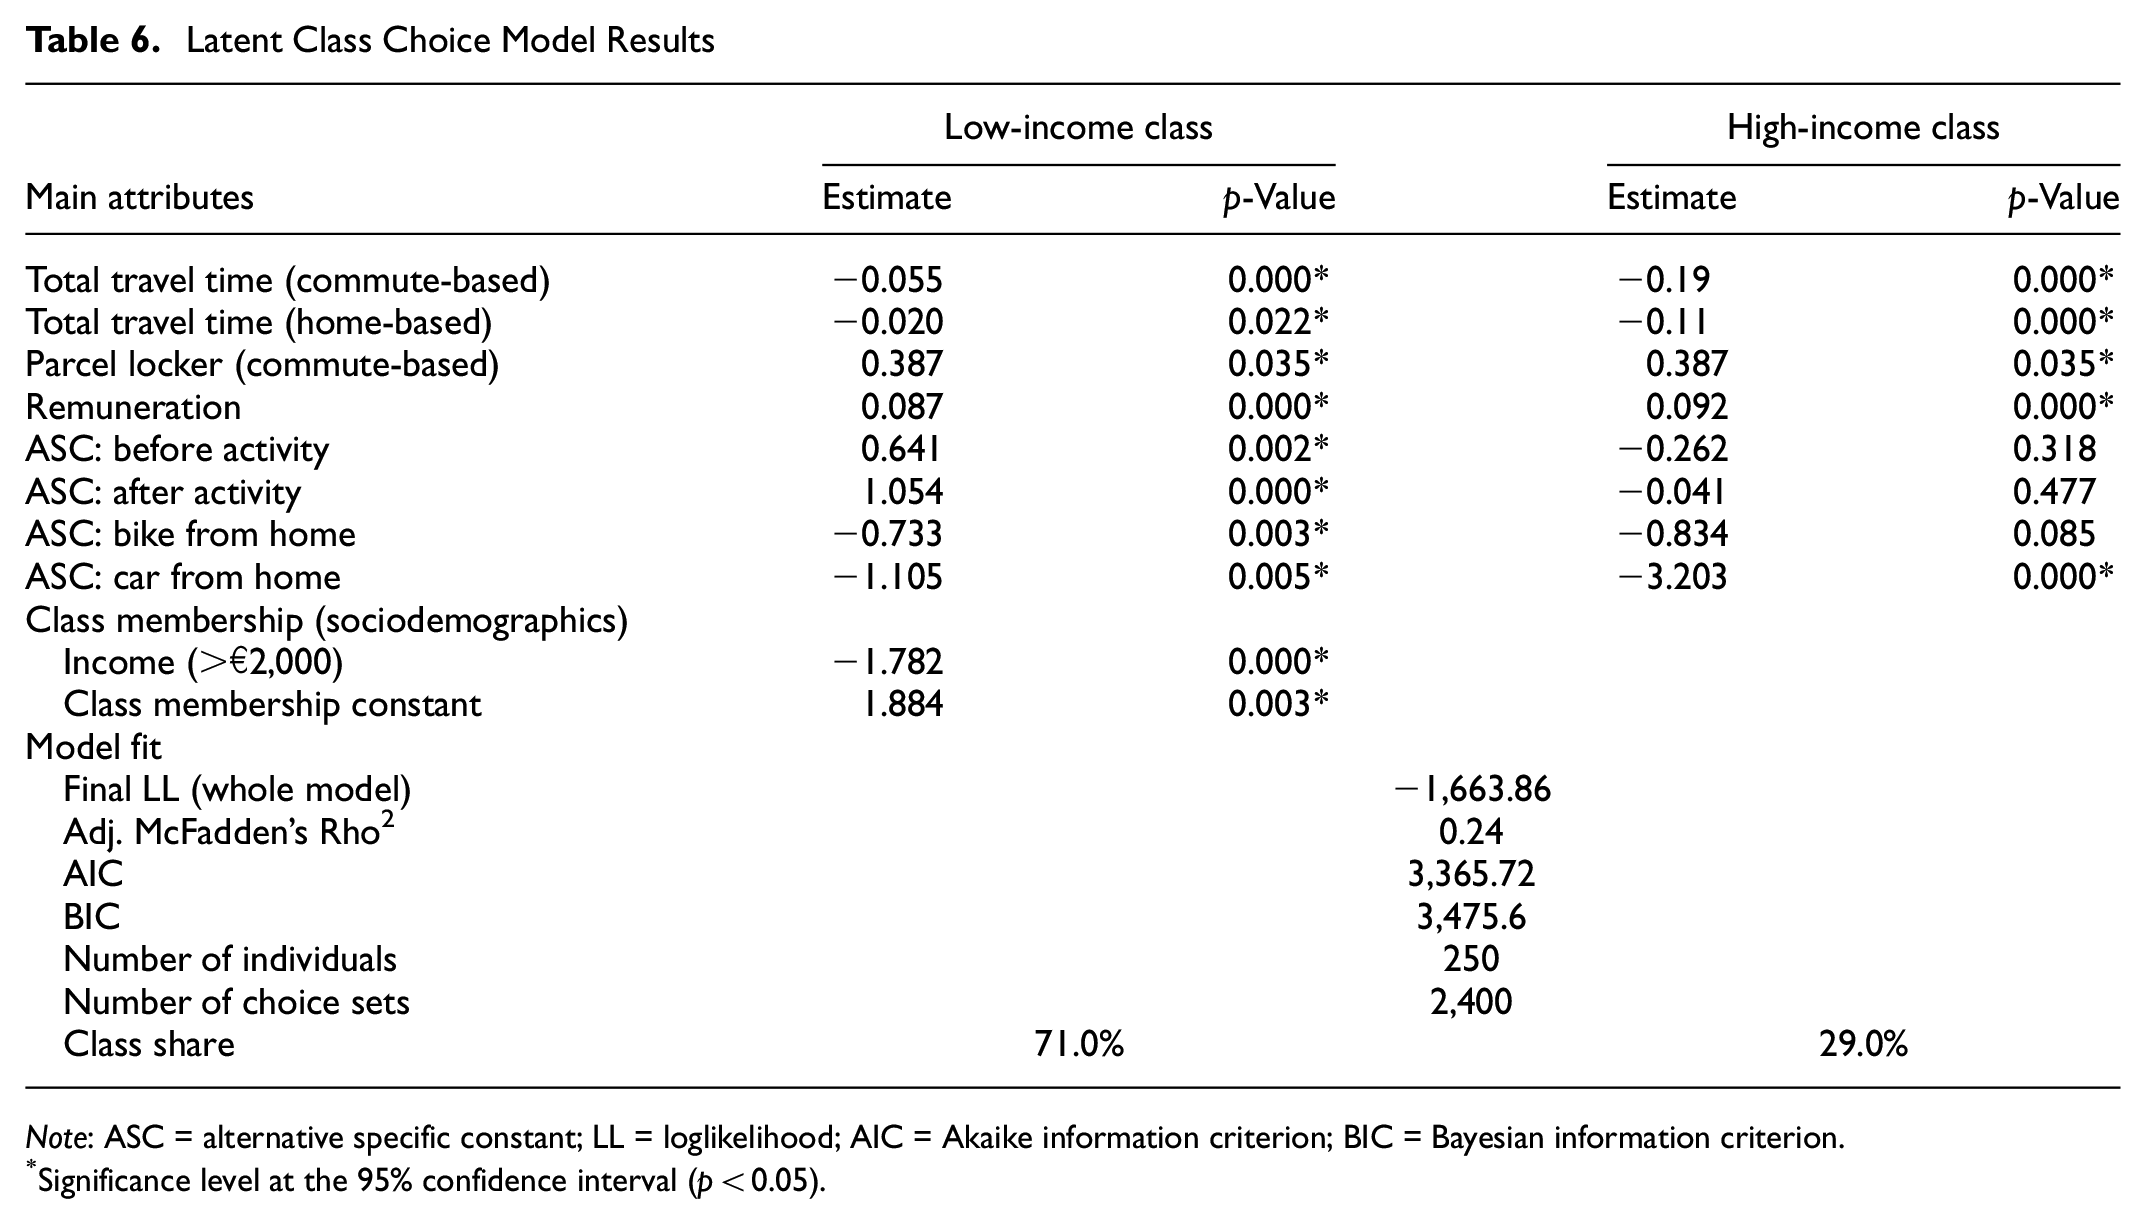
Note: ASC = alternative specific constant; LL = loglikelihood; AIC = Akaike information criterion; BIC = Bayesian information criterion.
Significance level at the 95% confidence interval (p < 0.05).
The main difference between these two models is the socioeconomic characteristics included. In both models, we have tested multiple model specifications with different sociodemographic characteristics, such as age, gender, and income level. Income level appears to be the only one of these that is statistically significant. Finally, the MNL model incorporates income as an interaction effect with remuneration, whereas the LCCM incorporates heterogeneity by including income in the class membership function.
Statistics on the goodness-of-fit of the MNL and LCCM need to be compared to determine which model is a better fit. To this aim, we assess the final loglikelihood (LL), BIC and AIC values as well as Rho2. The higher final LL indicates a better model fit ( 50 ), the smaller values of BIC and AIC indicate a better the model fit ( 42 ). Rho 2 can have a value between 0 and 1, and the higher the value, the better the model fit ( 51 ). As can be seen from Tables 5 and 6, the LL, Rho2, BIC, and AIC values that the LCCM provides a better model fit than the MNL model. We therefore determine that the two-class model provides a satisfactory explanation of respondent behavior, low- and high-income classes being easily identifiable. However, it is important to recognize that the results may vary when working with a larger sample size. The outcomes of the MNL—the base model—and the LCCM are given in the next section.
Based on the model estimations, 5% of the sample consists of the respondents who choose the same alternative (called nontraders) most of the time. However, they are not excluded from the sample since there is no difference in their characteristics compared with the respondents who show variation (traders) in their response patterns.
To assess the predictive power of the model on unseen data, we use out-of-sample validation. We divide the individuals from the data into 80% training and 20% test sets, which are randomly drawn from the main data set. Then, to evaluate the proportion of variance in the data that can be explained by the fitted model compared with the baseline model, we used the likelihood ratio index (Rho2) as presented in Equation 13 ( 52 , 53 ). A higher Rho 2 value indicates that the model captures a larger portion of the observed variation in the choices ( 51 ),

where
The likelihood ratio index shows that the prediction power of the model for the training and testing data sets are 0.23 and 0.17, respectively. The results suggest that model performance on the testing data is slightly worse than its performance on the training data. It is important to highlight that a slightly low model prediction power compared with machine learning models (MLMs) should not be misinterpreted as a weakness. Firstly, MLMs are predictive as they are mostly data-driven methods ( 54 ) as opposed to theory-driven traditional DCMs ( 55 ). Secondly, DCMs have an explanatory nature that assumes parametric relationships, and do not guarantee high prediction power compared with MLMs, which excel in prediction but often lack interpretability ( 56 ).
It is important to acknowledge that the predictive performance of the model may be influenced by inherent bias when only one validation sample is tested, as that particular sample might not be representative of the entire population. To address this, a potential solution is to randomly select multiple pairs of estimation and validation samples from the complete data set and repeat the process for each pair, allowing calculation of a confidence interval for the out-of-sample measure of fit ( 37 ). We employe k-fold cross-validation to assess the model’s prediction stability ( 57 ). This involves dividing the data set into roughly equal-sized segments; one segment serves as the training set whereas the remaining data are used for evaluation. The process is repeated K times, with each segment designated as the training data in a progressive manner during each iteration ( 58 ). We conduct 30 runs of k-fold cross-validation and find that, on average, the model’s prediction power on the test data sets was 3.26% lower than on the training set.
Discussion
The LCCM shows two clearly differentiated classes: low-income and high-income groups. This differentiation is based on the estimated choice constant, which is 1.884, and on the income levels of the respondents. The structure of the utility functions across groups is the same, favoring comparison across classes. On average, around 70% of the sample is from the low-income group. Using Equation 12, we calculate the probability of belonging to this group in the case of lower and higher monthly incomes of €2,000. The results show that if the monthly income of a person is higher than €2,000, the probability of them belonging to the low-income group is 53%; this probability becomes 87% if the level of income is lower than €2,000.
The two classes share the same overall behavior with respect to the value of travel time. The VoT for commute- is larger than that of the home-based scenario. Moreover, use of PLs is relevant for the realization of commute-based crowdshipping, probably because of the flexibility it can provide within an existing trip. That there is a preference for delivery after a trip also supports the idea that PLs can help to avoid delays during a trip. PLs are also found to be important in the delivery process as they help to ensure a problem-free pickup and delivery, for example, avoiding a lack of coordination between the sender and receiver, or an unsuccessful delivery. The benefit of PLs’ offering flexibility is acknowledged earlier by Rohmer and Gendron ( 30 ). We acknowledge that for home-based crowdshipping deliveries this might be less relevant, since departure times can be coordinated relatively easily by the parties involved.
Alternative specific constants (ASCs) are parameters that represent the effects on the utility of unobserved attributes ( 59 ). ASCs are estimated for each alternative, relative to one base alternative, for which the parameter is fixed to 0 ( 59 ). The interpretation is of a baseline preference for one alternative, given that all the other attributes are equal; ASCs also highlight the notion of flexibility. In this study, two constants are introduced for both SP scenarios (i.e., commute- and home-based trips), because each have three alternatives, including an opt out. The ASC for “after activity” is higher than “before activity” (Tables 5 and 6), indicating a preference for this alternative that is not captured by trip characteristics. All the parameters being equal, having a delivery after an activity reduces the risk of being late, thereby making it a preferred option. The ASCs also reveal a difference between classes. For the low-income group, all four ASCs are larger than those of the high-income group. This indicates an overall preference for participating in crowdshipping, as highlighted in the literature ( 26 ).
The findings on VoT are noteworthy, as our study is the first to produce such numbers for crowdshipping carriers, differentiated by type of trip and income class. This could be of relevance to cost–benefit studies to assess accessibility changes for parcel delivery services. The largest difference between classes is shown in the VoT (Table 7; p-value estimated using the delta method ( 36 ]). The VoTs of both the low- and high-income classes are statistically significant (p < 0.05).
Commute-Based and Home-Based Trips for Different Income Levels
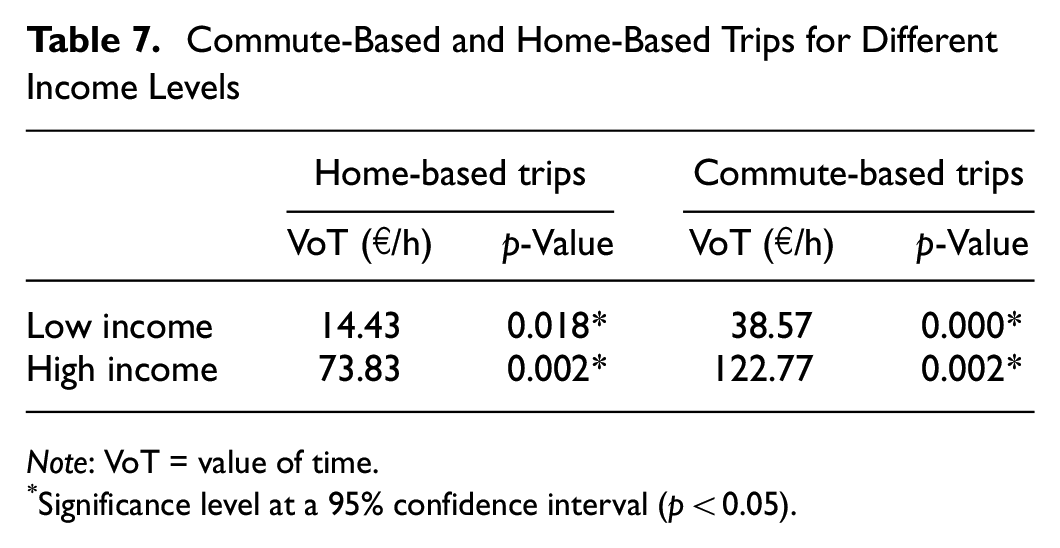
Note: VoT = value of time.
Significance level at a 95% confidence interval (p < 0.05).
The model also provides new indicators worthy of discussion. As expected, VoT for the high-income class is larger than that of the low-income class. With regard to the ratio between the commute- and home-based VoT, commute-based trips for low-income class carriers is around 2.5 times higher that of home-based trips. Interestingly, high-income class carriers for commute-based trips have a VoT around 1.5 times higher that of home-based trips. This result suggests that for commute-based crowdshipping, there is a trade-off between commuting- and working time. One interpretation of this is that respondents perceive the crowdshipping task as an extension of their working time, thus, they place more importance on it and expect higher remuneration for their time. In the case of home-based trip crowdshipping, respondents expect lower remuneration and are more willing to become an OC. A trade-off for home-based crowdshipping is seen between leisure time and commuting time, for which there can be several underlying reasons. Firstly, OCs might think that they are earning in their free time. Secondly, in the case of bicycle crowdshipping, OCs might derive satisfaction from exercising and earning money at the same time. Lastly, they might feel that they are contributing to diminishing the negative impact of last-mile deliveries.
A recent study investigating ride acceptance behavior in the context of ride-sourcing indicates that part- and full-time drivers have different VoTs, ranging from $35 to $81.6/h ( 60 ). The study also find that full-time drivers have a higher VoT than part-time drivers. It can be said that part-time drivers perceives ride-sourcing activity as their working time instead of commuting. Although our categorization is different, this interpretation provides a base of comparison with our commute- versus home-based crowdshipping case. An earlier study on bicycle crowdshipping find that VoT for a student OC is €24/h which fall within the range of the commute- and home-based VoT for the low-income class ( 12 ). Overall, we conclude that our results are consistent with known VoTs for crowdshipping carriers from the current literature.
In practice, by obtaining the journey time by bicycle from Google Maps, the VoT results imply that for commute-based trips, respondents belonging to the high-income group are willing to deviate around 5 min from their tour for a remuneration of €10, which is roughly the price of an express parcel delivery between cities in the Netherlands. This rises to 16 min for the low-income group, a detour of approximately 5 km by bicycle. A 5-km detour for a commute between two points can provide good population coverage, providing some support for the feasibility of a crowdshipping market for L2L parcel deliveries. Feasible detours and times are similar for home-based trips as for commute-based trips, in line with the needs of L2L deliveries, where trips remain within the urban agglomeration ( 22 ). Given the hypothetical bias of SPEs ( 61 ), although we cannot draw definite conclusions on whether the participants would actually take a parcel given these conditions, in line with the findings by Le and Ukkusuri ( 15 ) and Rai et al. ( 26 ), we can say that crowdshipping could be feasible for L2L deliveries, especially if people earning below €2,000 are targeted as potential OCs. Figure 6, a to c , presents the coverage of a person living in one of the big cities in the Netherlands: The Hague (Den Haag), Rotterdam, and Amsterdam, respectively, with a radius of 2.5 km.
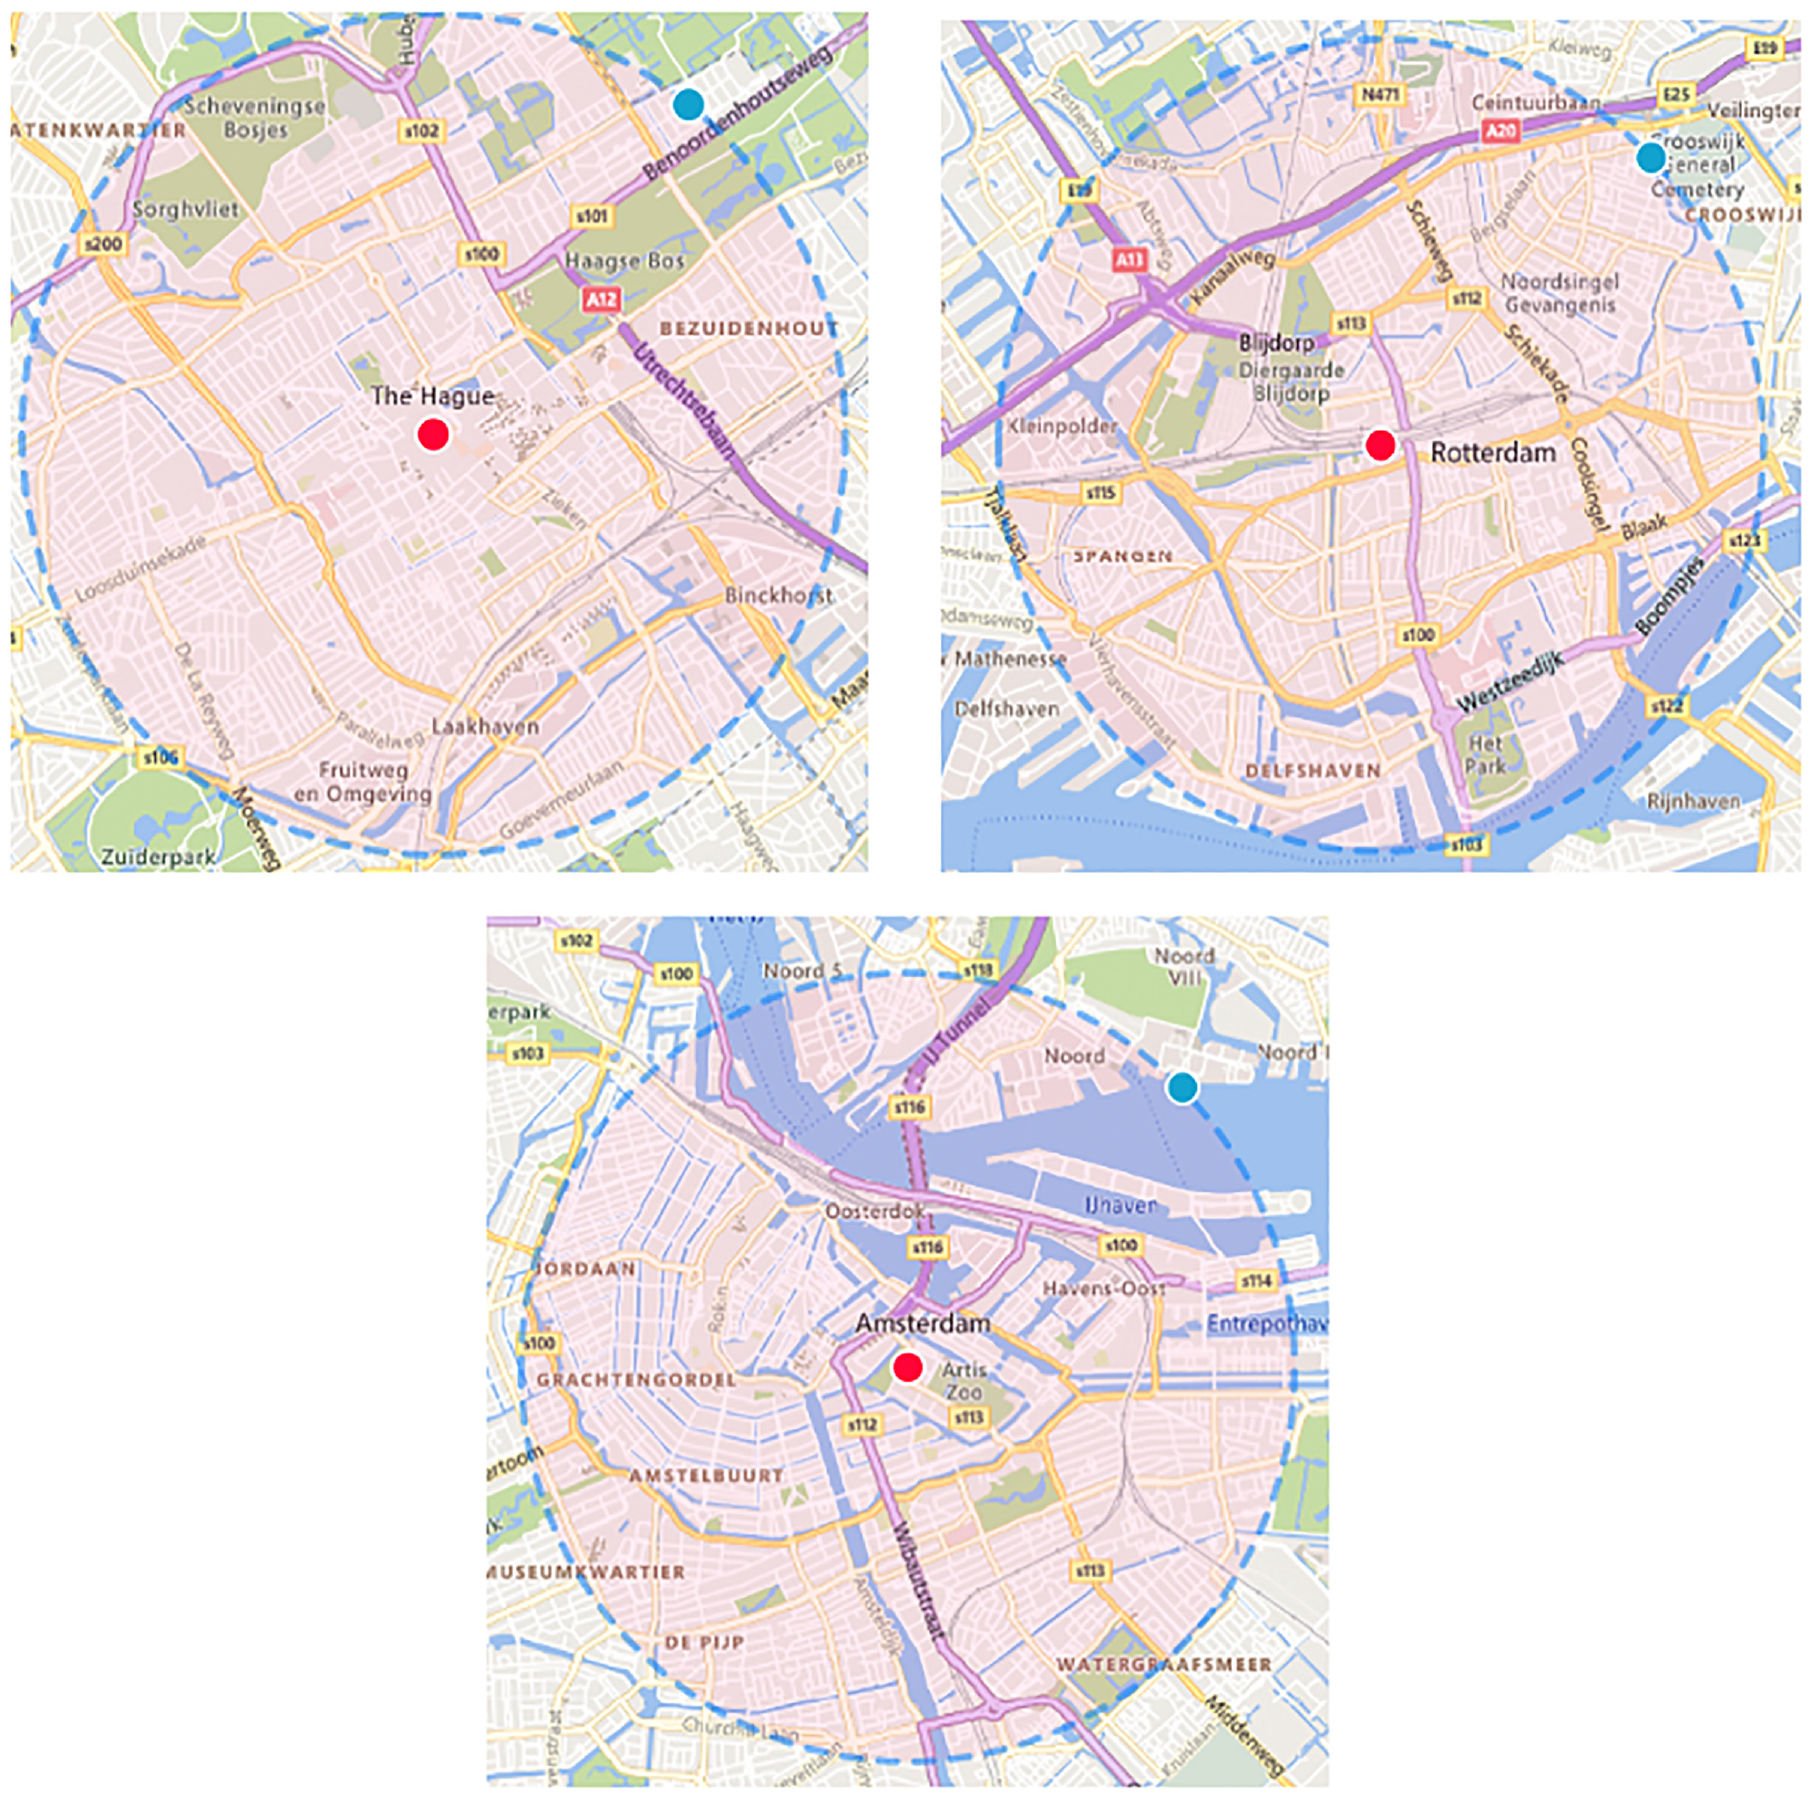
Representation of a 2.5-km radius of three big cities: (a) The Hague, (b) Rotterdam, and (c) Amsterdam.
Even though the distance is only with a radius of 2.5 km, the maps show that a big portion of the populated areas of these cities are covered, in the order of 100,000 inhabitants. The large coverage for home-based deliveries in high-dense areas, such as the Dutch cities, can potentially make home-based crowdshipping a competitive service in the L2L delivery landscape. Furthermore, this availability of OCs can generate a significant amount of trips to perform L2L delivery. Part of this potential is already evidenced by the success of food deliveries such as Uber Eats or the Dutch Thuisbezorgd ( 62 ).
Conclusions
In this research, we investigate the supply side of the crowdshipping system, considering the willingness of OCs to carry parcels, based on an existing commute trip, or a new home-based trip. The research is built on an SPE within these two different scenarios. The main contribution of the study is this separation of the motivation for crowdshipping. Although commute-based crowdshipping is closer to the original concept, taking advantage of existing trips to undertake deliveries, home-based crowdshipping implies the generation of new dedicated trips. Owing to the high volumes of e-commerce deliveries, traditional couriers tend to be highly efficient in the consolidation of the deliveries. Replacing these with new trips in the form of home-based individual deliveries may increase the total amount of kilometers traveled in urban areas, and contribute to traffic problems. The experiments suggests that crowdshipping is feasible for L2L deliveries, and can generate a significant amount of new trips, by bicycle and to a lesser extent by car.
The two-class LCCM provides new insights into the willingness to become an OC, by separating respondents into low- and high-income groups. People belonging to the low-income group are more likely to become OCs, and more willing to take a longer detour to deliver a parcel. This is reflected in two estimation results: (1) VoTs for the low-income group are approximately five- and three-times lower than those of the high-income group for home- and commute-based crowdshipping, as shown in Table 7; and (2) the constants (ASCs) indicate a higher overall appreciation of crowdshipping by low-income groups. These insights are relevant for economic assessments of urban accessibility improvements, which take both induced traffic as well as VoTs as inputs.
The study shows that home-based crowdshipping can be feasible for L2L deliveries. Notably, low-income respondents (i.e., under €2,000 monthly income), can find this activity more attractive as their VoT is lower than that of the high-income group. In countries like the Netherlands, the impact of these extra trips can be relatively low owing to the high quality of the cycling infrastructure and the high willingness of commuters to use the bike as an active mode. However, for countries where the dominant mode of transport is the private car, these added trips can be considered a potential downside to the crowdshipping system.
One of the limitations of this study is a consequence of the novelty of the service, and the consequential lack of revealed preference data. In this research, an SP survey is necessary since crowdshipping services have not yet been offered in the Netherlands. Because of their unfamiliarity with the service, respondents of the survey might under- or overestimate some of the attributes provided in the experiment (i.e., because of hypothetical bias [ 41 ]). As a consequence, it is not possible to investigate actual elasticity of demand, and claim forecasting ability without revealed preference data. Moreover, we limit the factors involved in the delivery choice to keep execution of the survey feasible. Further research can be undertaken using revealed preference data from other countries, to shed more light on demand elasticity and aggregate impacts at a city level.
From a practical point of view, the following conclusions are relevant. Firstly, we obtain numbers that may be important for crowdshipping business models. Considering the average value of a parcel in the Netherlands, with commute-based crowdshipping, a low-income group carrier might be willing to make a 16-min detour to execute a delivery with €10 remuneration, whereas a high-income group carrier might be willing to take only a 5-min detour from their original trip. With respect to home-based trips, for a similar detour time, OCs would be willing to settle for earning less than €5 for the trip. Further validation is recommended with revealed choices to address potential bias resulting from the hypothesized choices. Secondly, by using the results of this study, it will be possible to estimate the probability of a person becoming an OC by generating a new trip. This is necessary input for future simulation studies to understand the mobility impact of new services. Thirdly, the suggestion that there is a market for L2L deliveries with new trips supports further consideration of the possible negative consequences for urban traffic. The mode used for deliveries would have a significant impact on this, since bicycle-based crowdshipping raises different concerns (safety, health) from the car (congestion, emissions). This highlights the need for the public sector to be engaged in the introduction of crowdshipping services.
Footnotes
Author Contributions
The authors confirm contribution to the paper as follows: study conception and design: R. J. Tapia; data collection: R. J. Tapia; analysis and interpretation of results: M. S. Cebeci, R. J. Tapia, A. Nadi, M. de Bok, L. Tavasszy; draft manuscript preparation: M. S. Cebeci, R. J. Tapia, A. Nadi, M. de Bok, L. Tavasszy. All authors reviewed the results and approved the final version of the manuscript.
Declaration of Conflicting Interests
The authors declared no potential conflicts of interest with respect to the research, authorship, and/or publication of this article.
Funding
The authors disclosed receipt of the following financial support for the research, authorship, and/or publication of this article: This project has received funding from the European Union’s Horizon 2020 research and innovation program under grant agreement No 861598.