
Abstract
Cities nationwide have adopted so-called road diets to improve traffic safety, though they are sometimes met with intense opposition from motorists who fear that road diets will increase traffic delays. Road diets typically convert four-lane roadways with no left-turn lanes into streets with a center left-turn lane, two through-traffic lanes, and (often) bicycle lanes and right turn pockets at intersections. The resulting safety improvements are often dramatic. The Federal Highway Administration currently recommends that road diets should be applied to roadways with fewer than 20,000 average daily trips, but that cities should carefully consider whether to apply road diets above 20,000 average daily traffic (ADT). However, study of higher-traffic-volume road diets to inform decisions about them has been limited. In particular, there is scant evidence that safety benefits erode and traffic delays increase meaningfully above this threshold, though this is implied by the 20,000-ADT threshold. To address this literature gap, we examined the safety and traffic outcomes of high-traffic-volume road diets in Los Angeles, CA. To do this, we compared collisions on five high-traffic-volume road diet corridors with 16 similar multilane, untreated street segments. We found that collisions, injuries, and deaths were lower by 31.2% to 100%, depending on the measure, whereas traffic speeds were lower by about 6.7% (peak) to 7.9% (off-peak). We concluded that in Los Angeles higher-traffic-volume road diets appeared to significantly increase safety with only minor effects on traffic speeds.
Keywords
Cities nationwide have adopted “Vision Zero” policies to address growing concerns about traffic safety. The common goal of these policies is to eliminate, or at the very least meaningfully reduce, severe and fatal traffic collisions. For example, Los Angeles’ Vision Zero policy, adopted in 2015, calls for the elimination of all traffic deaths by 2025. Since then, the Los Angeles Department of Transportation (LADOT) has identified 72 Vision Zero Priority Corridors, totaling 132 centerline miles in length, that have been improved or will be in the near future ( 1 ). The projects include a wide range of safety measures, from real-time speed feedback signs telling drivers how fast they are traveling, to redesigning intersections, pedestrian crossing islands, and pedestrian-activated yellow flashing beacons, to name a few.
Although it is difficult to find anyone opposed to improving traffic safety, one Vision Zero tool stands out because it has often proven polarizing: the so-called road diet. A road diet, also known as a lane reconfiguration, consists of converting motor vehicle through-traffic lanes to other uses to advance safety or transportation-related goals, such as slowing motor vehicle speeds, reducing collision frequency and severity, and encouraging more sustainable modes of travel, such as walking and biking. In addition, road diets are increasingly employed to discourage speeding and reduce risky lane changes to help achieve Vision Zero policy goals. However, road diets are often polarizing because some motorists view them as thinly veiled efforts to make driving more difficult. In Los Angeles, frustrated motorists even mounted an (ultimately unsuccessful) recall effort of a city council member over the issue of road diets ( 2 ).
The classic road diet converts a four-lane undivided road with average daily traffic (ADT) levels below 20,000 to a three-lane road with one travel lane in each direction and one center bidirectional left-turn lane. According to a Federal Highway Administration (FHWA) guide, this change is a proven safety countermeasure estimated to reduce crashes by about 29%, on average ( 3 ).
Road diets that diverge from the aforementioned classic design or parameters are referred to as unconventional road diets. One type of unconventional road diet follows the same three-lane configuration as a classic road diet but differs in context because it is implemented on roads with ADT levels higher than the 20,000-threshold recommended by FHWA. Why the 20,000-ADT threshold? Our review of the literature suggests that this threshold is based more on conventional wisdom than careful study; indeed, it is plausible that implementing road diets on streets with ADT above 20,000 might negatively affect traffic flow and possibly cause more collisions as a result. However, there is little research on the safety or traffic effects of such high-traffic-volume road diets, in no small part because the federal 20,000-ADT guidance is likely to have dissuaded local jurisdictions from implementing road diets on higher-traffic-volume corridors. This conundrum appears to have yielded two outcomes: 1) fewer road diets are implemented on higher-collision-rate-, higher-traffic-volume streets, despite the diets' proven track record as a safety countermeasure, and 2) where they have been implemented on streets that exceeded, or later came to exceed, 20,000 ADT, their effects on safety are considered uncertain, and their effects on traffic flow are typically assumed to be problematic. Each of these hypothesized outcomes would benefit considerably from more empirical study.
To address these gaps in our understanding of road diets, this article examines the safety and traffic-flow impacts of high-ADT road diets to determine whether the 20,000-ADT threshold should be revisited. To do so, we examined collisions and traffic speeds on five high-ADT road diet corridors in comparison with 16 otherwise similar multilane, untreated street segments in Los Angeles.
We begin with an overview of traffic safety and Vision Zero policies in Los Angeles that guide the implementation of road diets. We then define road diets and review the literature on them, including the benefits, guidelines, and the relatively sparse existing research on high-ADT road diets. We then describe the data and methods used to examine the performance of high-traffic-volume road diets in Los Angeles, including how we selected the study corridors, collected data, and evaluated both safety and traffic flows. We then present the results of this comparison of road diet- and control group corridors in relation to both safety and traffic speeds, and conclude with a discussion of the implications of our results for traffic safety and transportation policy.
Overview
Traffic Safety in Los Angeles
The city of Los Angeles, CA has one of the highest traffic-related fatality rates in the United States ( 4 ). For this reason, the then Los Angeles Mayor Eric Garcetti and LADOT adopted Vision Zero in 2015. Vision Zero is an international public policy movement that calls for eliminating all traffic fatalities and severe injuries. The city set the goal of a 20% reduction in traffic fatalities by the year 2017, and to fully eliminate traffic fatalities by 2025 ( 5 ). However, between its adoption in 2015 and 2019, Figure 1 shows that traffic fatalities actually increased. Amidst the COVID-19 pandemic of 2020, traffic volumes decreased dramatically and many observers at the time expressed the hope that this would mean fewer people would die or be seriously injured in traffic collisions. Despite the drop in traffic, however, traffic-related injuries and fatalities increased even further, with the year 2021 marking the highest traffic-related death toll in Los Angeles in nearly two decades ( 6 ). Instead of significantly reducing traffic fatalities as a result of the reduced amount of vehicle travel, as many had hoped, the pandemic saw increased speeding and reckless driving because of the many wide, empty roads ( 6 ).
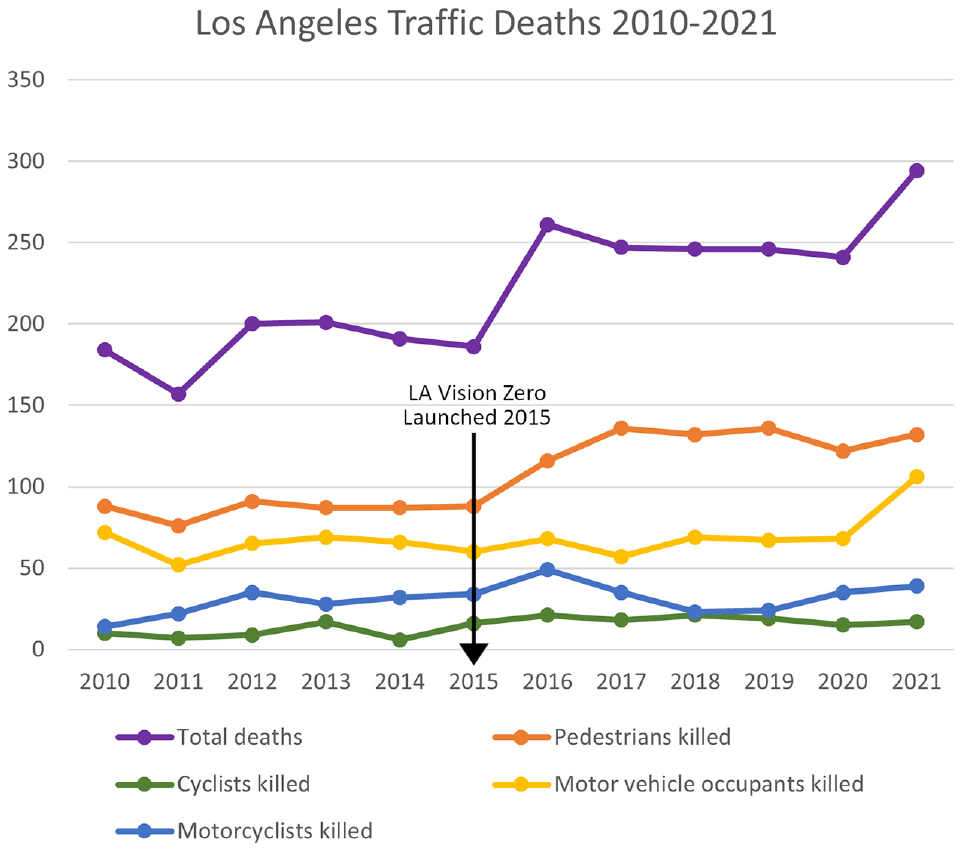
Fatal collisions in the city of Los Angeles, CA between 2010 and 2021.
A 2017 Los Angeles Vision Zero safety study found that driving speed was the top contributor to collision fatalities. An increase in driving speed from 20 to 40 mph decreases a pedestrian’s chance of surviving a vehicle crash from 80% to 10% ( 4 ). The study also found that pedestrians are the most vulnerable road users, accounting for 44% of all collision fatalities despite being involved in only 8% of collisions ( 4 ).
Although aggressive driver behavior certainly accounts for some of the unfortunate trends in crashes, injuries, and deaths, road design can significantly affect safety as well. A nationwide study identified 60 unique hotspot corridors with the highest rates of crashes involving pedestrians over an 8-year period. The study found that the corridors shared many common characteristics: multilane roadways, speed limits of 30 mph or higher, and traffic volumes exceeding 25,000 vehicles per day (vpd) ( 7 ).
By reducing the number of travel lanes on streets with no protected left-turn pockets, road diets typically reduce unsafe lane changes, separate vehicle turning movements from through travel, and discourage speeding ( 8 ). Pedestrians and bicyclists benefit from the reprioritization of the road to better allow for walking and riding since road diets often include wider sidewalks, more prominent crosswalk amenities such as crossing islands, and/or dedicated bicycle lanes.
Despite their demonstrated safety benefits, many city officials are hesitant to implement road diets, particularly on higher-volume streets. Road diet guidelines proffered by FHWA advise that “roadways with ADT of 20,000 [vehicles per day] or less may be good candidates” for the classic road diet. This federal guidance, and local policies influenced by it, imply that implementing road diets on streets with an ADT higher than 20,000 could have negative effects on traffic, such as significantly increasing traffic congestion and/or diverting traffic to other streets ( 3 ). Such framing elevates the potential inconveniences to driving vis-a-vis the underlying motivation for road diets—improving safety. The caution attached to exceeding the 20,000-ADT threshold for road diets predates contemporary Vision Zero policies, and fragmentary evidence suggests that it has depressed the appetite for local governments to exceed this threshold in their road diets.
Defining a Road Diet
Road diets typically replace through-traffic lanes with both left- (and sometimes right-) turning lanes and bicycle lanes to improve safety, mobility, and access for all roadway users. Other road diet features can include added street parking, improved pedestrian infrastructure, and landscaped medians ( 9 ). Road diets have a track record of making roads safer for pedestrians and bicyclists, calming traffic, and reducing the overall number of collisions ( 10 ). The most common, or “classic,” road diet converts a four-lane, undivided roadway with two travel lanes in each direction to a three-lane roadway consisting of two travel lanes (one running in each direction) and a center, two-way left-turn lane ( 11 ). This type of conversion usually frees up additional space for bike lanes (see Figures 2 and 3) ( 12 ). Although a road diet can technically refer to any situation in which the number of through-traffic lanes is reduced to allocate more space to left-turning vehicles, cyclists, or pedestrians, we focus in this analysis on the classic road diet configuration.

Typical configuration before a classic road diet is implemented.
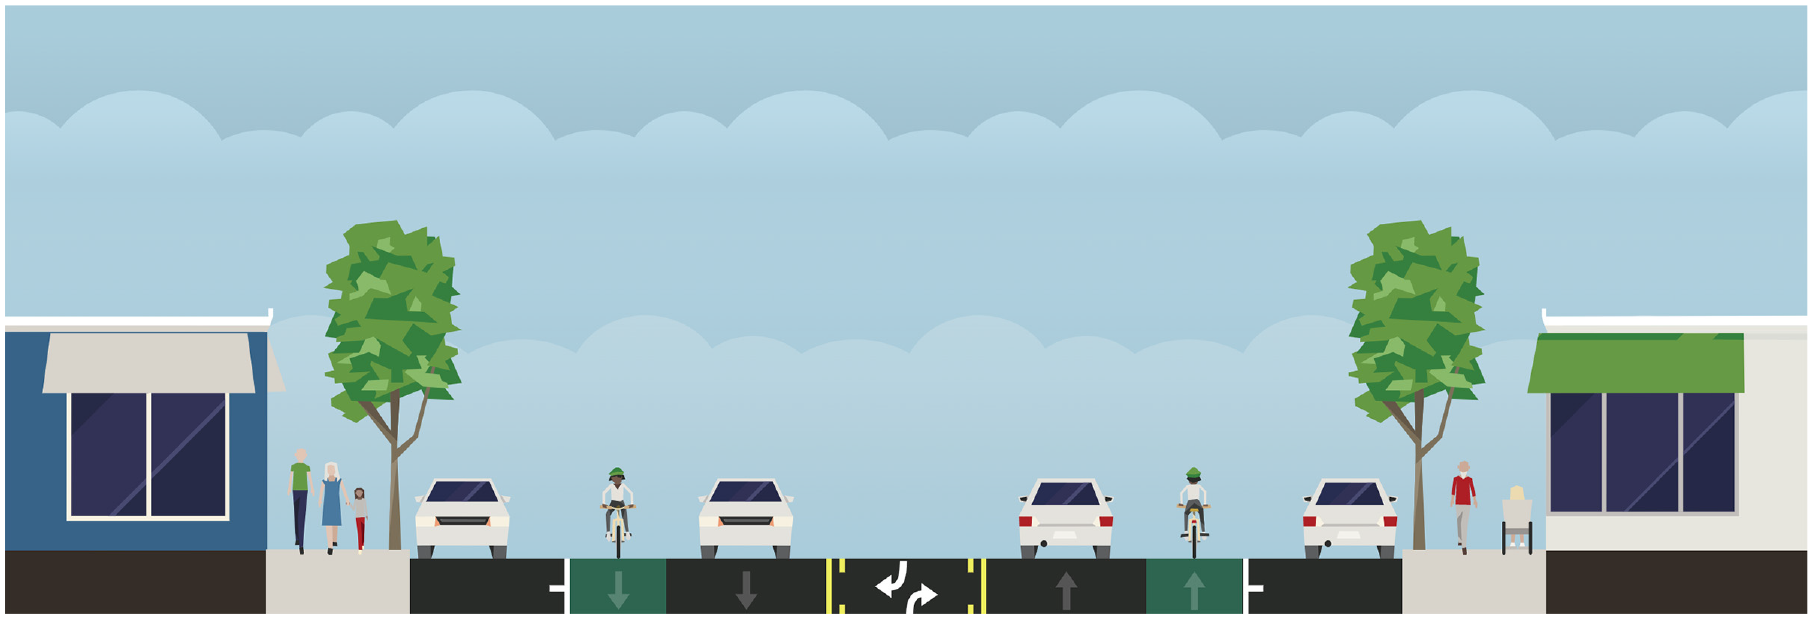
Typical configuration after a classic road diet is implemented.
Brief History of Road Diets
The classic road diet was developed to address the safety issues that arose from road geometry practices in the 1950s and 1960s of squeezing as many travel lanes as possible onto streets to increase their traffic-carrying capacity. The term “road diet” was first used by Burden and Lagerwey in 1996 to describe converting wider roads with problematic safety records to be smaller, safer roads by removing through-traffic lanes ( 13 ).
The city of Seattle is often credited with implementing the first U.S. road diet in 1972 ( 13 ). Although the ADT of that road diet increased from 19,400 to 20,274 after the conversion, collisions on the road decreased by 48.9%. Los Angeles implemented its first road diet in 1979 on 98th Street. The project converted general travel lanes to bike lanes on a 0.35-mi stretch of 98th Street between Western Avenue and Halldale Avenue.
Surprisingly, it took until 1999 for the first comprehensive road diet safety and traffic analysis to be conducted ( 13 , 14 ). Burden and Lagerwey studied 17 road diet projects from six U.S. cities and Toronto, Canada that followed the four-to-three-lane formula and found that they improved both mobility and safety. In 1999, Welch conducted a before-and-after study of one Minnesota road diet and nine Seattle road diet corridors. He found that the Minnesota road diet reduced collisions by 28%, and the Seattle road diets reduced collisions by 34%. Although he found that some road diets increased traffic delays, he concluded that road diets were beneficial overall ( 14 ). Since the first characterization and studies of road diets in the 1990s, their implementation and prevalence has expanded substantially.
Mechanics of a Road Diet
FHWA recognizes road diets as a proven safety countermeasure. According to FHWA’s Proven Safety Countermeasures web page, classic road diets reduce collisions by between 19% and 47%, reduce vehicle speeding, improve mobility and access for all road users, and increase quality of life through the better integration of roadways into their surrounding uses. The wide range in the estimated reduction in collisions cited by FHWA comes from a 2008 synthesis report by Harkey et al. ( 15 ) That 2008 report concludes that collisions are reduced in road diet corridors primarily by replacing a travel lane with a center turn lane that mostly eliminates the conflict created by cars changing lanes to avoid queueing behind vehicles waiting to turn left into driveways and at intersections. Welch echoes the Harkey et al. findings, saying that replacing travel lanes with a center turn lane simplifies driving by reducing the number of decisions people have to make ( 14 ). The simplified street layout, shown in Figure 4, is also viewed as more user-friendly for elderly drivers ( 14 ).
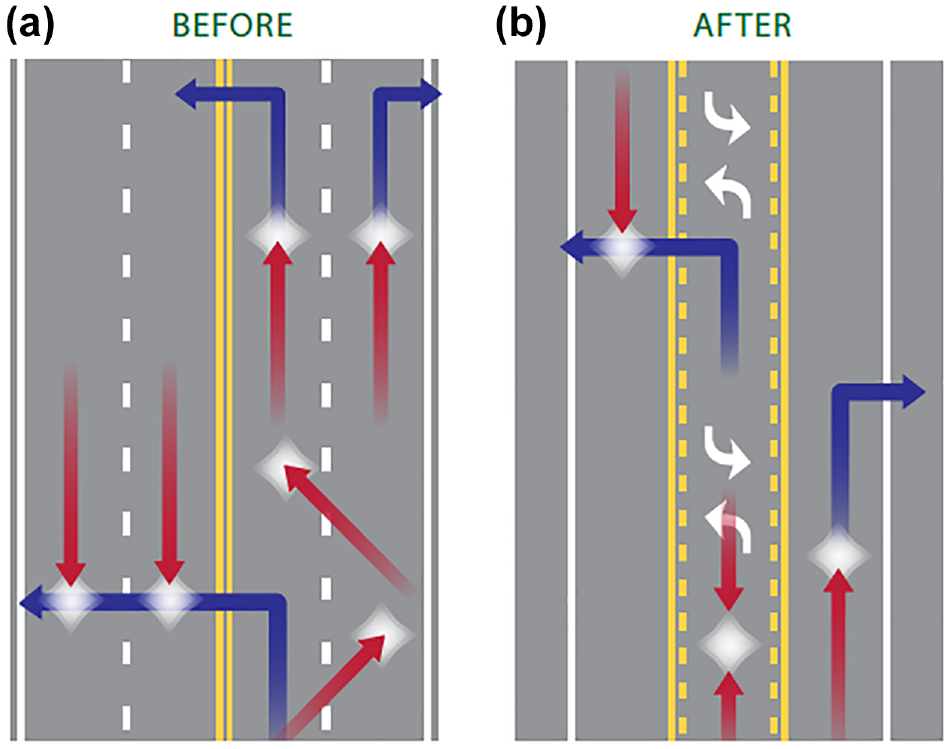
Comparison of possible collisions between (a) a four-lane undivided facility and (b) a road diet.
There is little research on how much classic road diets improve safety for cyclists and pedestrians, because there is generally less data available on bicycle- and pedestrian-involved collisions, as noted by Gudz et al. ( 16 ). Their study of Davis, CA showed that a road diet conversion that added 5- to 7-ft bike lanes in each direction increased the number cyclists present on the road by 243%. Gudz et al. conclude that people most likely feel safer riding a bicycle on streets where road diets give them access to bicycle-only infrastructure ( 15 ). Taylor-Gratzer analyzed the safety of bike lanes created by road diets by looking at the change in crashes after accounting for increased bike volumes. Having controlled for changes in bicycle ridership, he found that the rate of cycling collisions fell by 44% ( 17 ). Thus, although not conclusive, the research available strongly suggests that the classic road diet may, in addition to reducing vehicle collisions, improve safety for people walking and bicycling.
Conventional Road Diet Wisdom
Although evidence on the safety benefits of road diets is generally consistent and increasingly compelling, popular objections to them tend to center on their presumed effects on increasing traffic delays. Such objections can often take the form of angry motorists assuming that a reduction in traffic lanes must necessarily substantially increase traffic delays. However, according to FHWA, a three-lane road-dieted street can carry as much traffic as a four-lane roadway lacking center turn lanes, without increasing travel times or diverting traffic to other streets, so long as the ADT counts do not exceed 20,000 ( 18 ). Several studies of classic road diets with ADT counts below 20,000 have found that little effect on level of service (LOS). Welch references a 1998 study by Preston that found that some three-lane roadways with ADT “as high as 20,000” still functioned effectively ( 14 ). A 2015 study of a road diet conversion of Livingston Avenue in New Brunswick, NJ found that the project, which included signal timing changes to improve traffic flow, entailed little or no change in LOS ( 19 ). A 2018 before-and-after study by Jouliot of four road diet corridors in Los Angeles found no evidence of increased traffic delays on either the road diet streets or nearby parallel streets ( 12 ) .
Welch’s 1999 study found that four-lane roads without a designated turn lane hosted most peak traffic on the outer (closer to the curb) travel lanes because drivers sought to avoid getting stuck behind vehicles waiting to turn left in the inner (closer to the center) travel lanes. When classic road diets remove a travel lane and replace it with a center turn lane, they manage to reduce such conflicts and balance out any throughput capacity lost from removing the lane ( 14 ).
The 2003 study by Russell and Mandavilli examined the intersection of a classic road diet and found no significant increase in traffic delay or change in the average intersection delay for the three- versus the four-lane configuration. The study did find a significant decrease in the proportion of vehicles stopped and the average queue of cars on the roadway. Thus, the authors concluded that the classic road diet maintained a nearly equal operational performance as the previous four-lane, undivided roadway configuration ( 11 ).
Finally, Gudz et al. also found that the travel times on the classic road diet they examined did not increase and perhaps even decreased. However, the study results were ultimately inconclusive because they did not control for the possibility of automobile traffic diverting from the road diet corridor to other nearby parallel roads ( 16 ).
Previous Research on the Road Diet ADT Threshold
There is gradually increasing pushback on the 20,000-ADT threshold in the literature. In their analysis of over 20 four-to-three-lane road diet conversions, Burden and Lagerwey report that, “the upper comfort range for arterial conversions appears to be between 20 and 25,000 ADT” ( 13 ). They conclude that, “Researchers do not have enough knowledge to say where and how peaks are reached, but many feel comfortable with 20 to 23,000 ADT. Each community must set its own upper limits” ( 13 ).
Although a 2006 study by Gates et al. concludes that four-to-three-lane road diets are most effective when ADT does not exceed 17,500 ( 20 ), several four-to-three-lane road diets have been implemented on roads with ADT higher than 20,000, including in Los Angeles, and on at least two roads with an ADT over 30,000 either before or after implementation ( 21 ). A 2011 study by Stamatiadis et al. concludes that ADT can be as high as 23,000 for classic road diet conversions ( 22 ). Thomas found that road diets with an ADT of up to 23,000 can effectively reduce collisions ( 23 ); he concludes by calling for case-by-case evaluations of potential road diet projects based on crash patterns and operations.
In 2014, FHWA published the Road Diet Informational Guide that compiled guidelines from local agencies that provided information on the specific ADT thresholds they used to determine roadway suitability for four-to-three-lane road diet conversions. The upper ADT limit ranged from 18,000 to 25,000. High Street in Oakland, CA had an ADT ranging from 22,000 to 24,000 and experienced a 17% reduction in collisions after a conventional four-to-three-lane road diet ( 3 ).
Foster Road in Portland, OR carries as many as 30,000 vpd, yet it received a four-to-three-lane road diet conversion ( 24 ). The project was subject to considerable backlash from a few business owners and commuters who worried that the loss of the travel lanes would increase traffic delays. In this and other cases of road diet implementations, the backlash can be heated, often before a project is even constructed or evaluated, based on assumptions or anecdotal experiences from elsewhere.
Williams studied a road diet on La Jolla Boulevard in San Diego, CA, which had a 25,000 ADT before the road diet. A four-lane road was converted to a two-lane road with roundabouts, and was shown to reduce speeding and maintained a similar vehicle capacity as the original design ( 25 ).
Therefore, despite FHWA guidance on the 20,000-ADT ceiling for road diets, several case studies in the literature have found that classic road diets may operate successfully at traffic levels above 20,000 ADT. However, this research is typically on individual road diets and falls short of conclusive. This may, in part, be because FHWA guidance has discouraged local jurisdictions from implementing road diets on higher-volume corridors, limiting the number of possible study sites. Accordingly, our analysis presented below attempts to fill this gap in the literature by conducting a more systematic evaluation of multiple high-ADT road diets in Los Angeles.
Data and Methods
FHWA recommends that road diet evaluations should ideally be before-and-after analyses of changes in the collision rates of road diet corridors and untreated comparison corridors to account for broader changes in collision rates across the road network that may have occurred for reasons unrelated to a road diet. However, the California Statewide Integrated Traffic Records System (SWITRS) only has collision data from 2011 through (at the time of this study) 2022. Unfortunately, most of the high-traffic-volume road diets in Los Angeles are older than that. This is because some were not originally implemented as a high-traffic-volume road diet, but rather evolved into becoming one over time. Although others have been implemented on streets with ADT greater than 20,000, in all cases there were unique circumstances (e.g., a high-profile pedestrian death that prompted city council action, local merchants insisting that both left-turn lanes be implemented and curb parking retained) that led to a case-specific override of the local 20,000-ADT threshold policy.
Although the empirical Bayes method of before-and-after analysis is preferable because it accounts for reversion-to-mean bias, we lacked sufficient before data for three of the five high-volume road diets in Los Angeles to conduct such an analysis. A 2010 study comparing full and empirical Bayesian methods in Iowa found a crash modification factor (CMF) of 0.53, whereas a 2022 study of CMFs and safety performance functions (SPFs) calibrated to conditions in Virginia found CMFs of 0.62 and 0.65 for total crashes and 0.36 and 0.54 for fatal and injury crashes on roadway segments and signalized intersections, respectively ( 26 ). However, although Local Roadway Safety, A Manual for California's Local Road Owners (27) assigns road diets (that reduce travel lanes from four to three and add a two-way left-turn and bike lanes) a CMF of 0.7, we lacked sufficient data to calibrate context-specific coefficients using the Highway Safety Manual Part C Predictive Method (28). Although SPFs for freeways in California are currently being developed and tested, we are aware of no similar calibration effort for local streets in Los Angeles or Southern California more broadly.
Lacking both sufficient before data as well as context-specific SPFs, we elected instead to use a cross-sectional treatment/control group approach for our analysis. Because this approach does not account for reversion-to-mean bias, we sought throughout to interpret our findings with some caution and advise readers to do the same. It is worth noting, however, that reversion-to-mean error is likely to be less of an issue in this study, because the road diets studied had been operating for between 8 and 23 years before this analysis.
To conduct our analyses, we selected what turned out to be five high-ADT road diet corridors to serve as the treatment group, as well as a second, larger group of 16 otherwise similar nearby non–road diet corridors to serve as the control group. We then examined traffic volume and collision data between 2017 and 2019 for all of the treatment and control group corridors.
The first step in our selection process was to determine a minimum ADT threshold for the high-traffic-volume road diets. We settled on a floor of 23,000 ADT to ensure that all of the corridors analyzed had substantially and consistently higher traffic volumes than the 20,000-ADT threshold recommended by FHWA. This also ensured that the ADT floor was greater than the maximum ADT threshold of 23,000 previously identified separately by Stamatiadis et al. ( 22 ) and Thomas ( 23 ).
The traffic data were drawn from StreetLight Data, a commercial web platform that estimates traffic data by aggregating mobile device data, in this case for the city of Los Angeles. Because StreetLight’s data do not reflect actual vehicle counts, we compared their ADT estimates with automated, directly collected 24-h counts that LADOT has on file for the corridors studied and found them to be substantially and consistently similar.
With these criteria and data, we then
Reviewed the full list of known road diets implemented in Los Angeles since 1979;
Filtered the list to limit it to streets that (1) operate with a single lane of through-traffic in each direction, post–road diet implementation and that (2) had repurposed traffic lanes into bike lanes;
Assessed StreetLight’s traffic data to determine which corridors qualified as “high volume,” or above 23,000 ADT; and
Eliminated corridors that were too new (two were implemented in 2020) or too short (one was just two-blocks long) to have sufficient data for the analysis.
What remained were the five road diet corridors included in the study, all of which have parking or dedicated out-of-traffic lane bus stops at the curb, so that traffic should not typically be impeded while passengers are boarding or alighting buses. Many of the high-volume road diet segments analyzed were relatively short because of various site-specific factors, such as direction from city council members to implement relatively short road diets in particular locations. Given these five treatment segments, we selected a group of nearby comparison corridors based on their similarity in road configuration and ADT count to the five streets before their road diet conversions.
We then selected the following array of safety metrics for each of the treatment and control corridors from the SWITRS data:
Overall crashes,
Fatal and severe injuries,
Collisions with other vehicles,
Collisions with fixed objects (such as parked cars, buildings, or streetlights),
Collisions with pedestrians,
Collisions with bicyclists, and
Sideswipe collisions (collision type generally associated with roadways lacking protected left-turn lanes).
We obtained these traffic safety data for the most recent prepandemic year, 2019, using the Transportation Injury Mapping System created by the Safe Transportation Research and Education Center at UC Berkeley. Since the corridors were different lengths, we normalized all of the incidents on a per vehicle mile basis. Although, ideally, we would have normalized pedestrian and bicycle collisions by pedestrian and cycling miles of travel, such data were not available. Once the incident rates were normalized, we then calculated them to determine the percent difference between road diet corridor collisions and control group corridor collisions.
Traffic speed data were also obtained from StreetLight for all times of the day and all days of the week between January 1, 2019 and December 31, 2019. These data were used to calculate
Travel time: The time it takes to traverse the corridor from end to end;
85th-percentile speed: A baseline that has historically informed how speed limits are set in Los Angeles;
Average speed: Overall mean speed in the corridors;
Peak hour average speed: Mean speed during the morning and afternoon weekday peak hours; and
Off-peak hour average speed: Mean speed outside of the peak hours.
Each of the road diets shown in Table 1 were matched with at least four times their length in otherwise similar untreated corridors in the same general geographic region. The comparison corridors we selected for the road diets can be found in Table 2, and the location of both the high-ADT road diets and the comparison corridors are displayed in Figure 5.
Overview of Road Diets
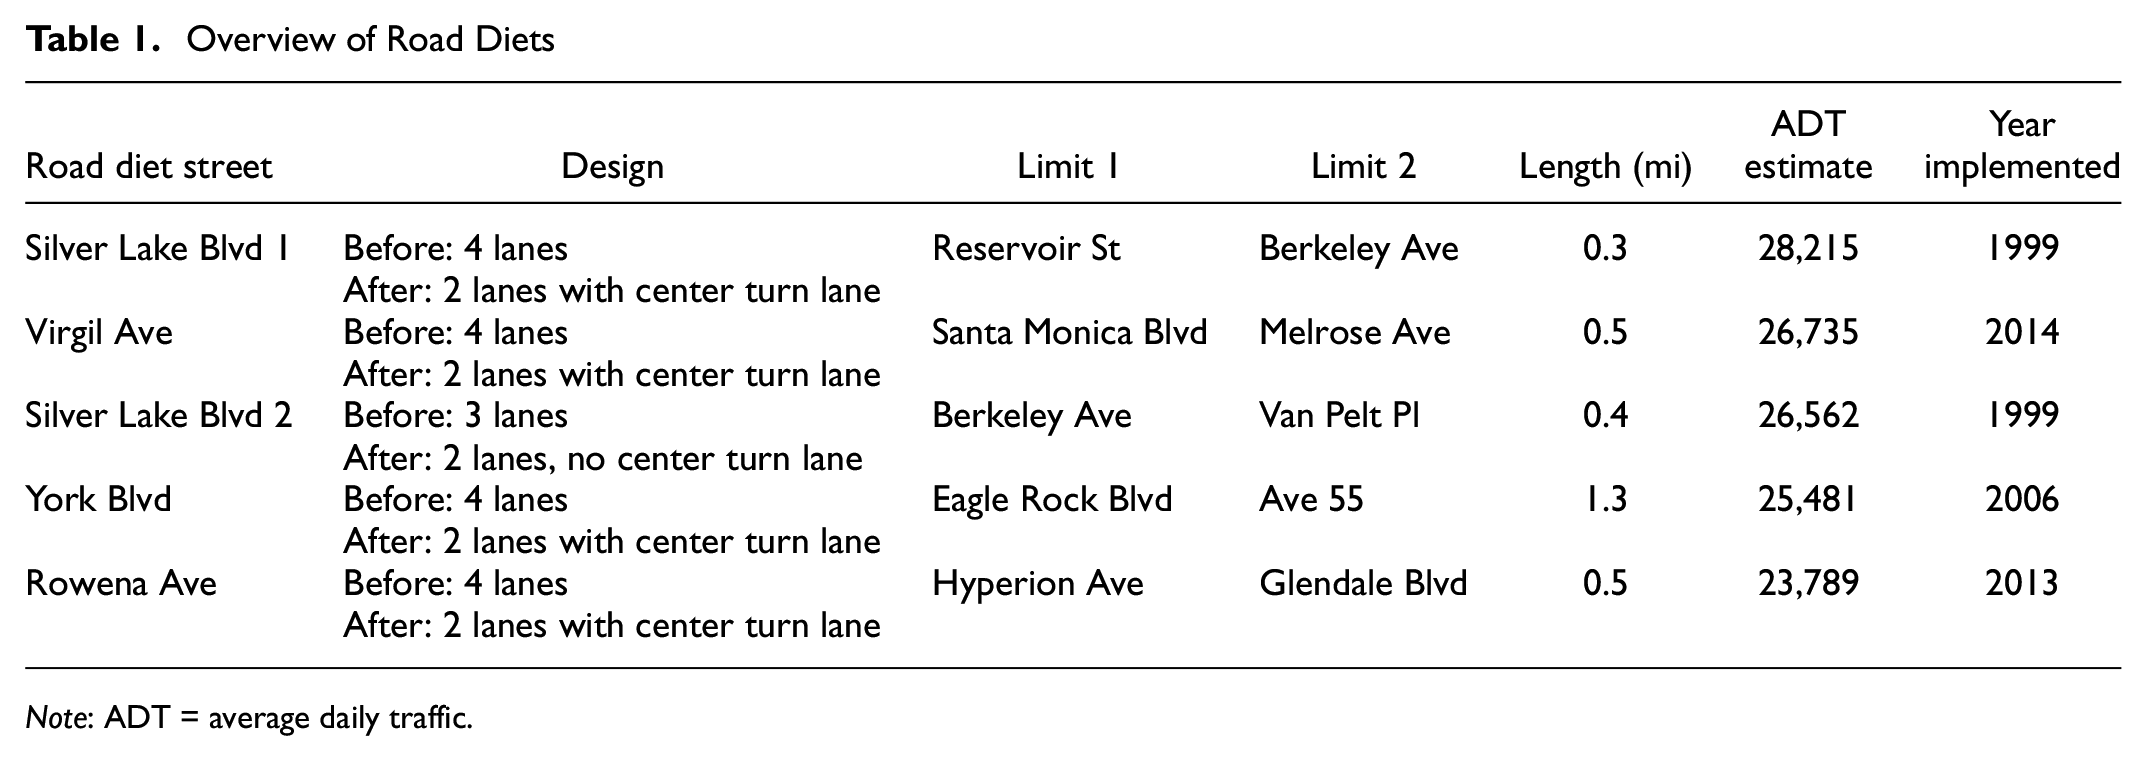
Note: ADT = average daily traffic.
Comparison Corridors
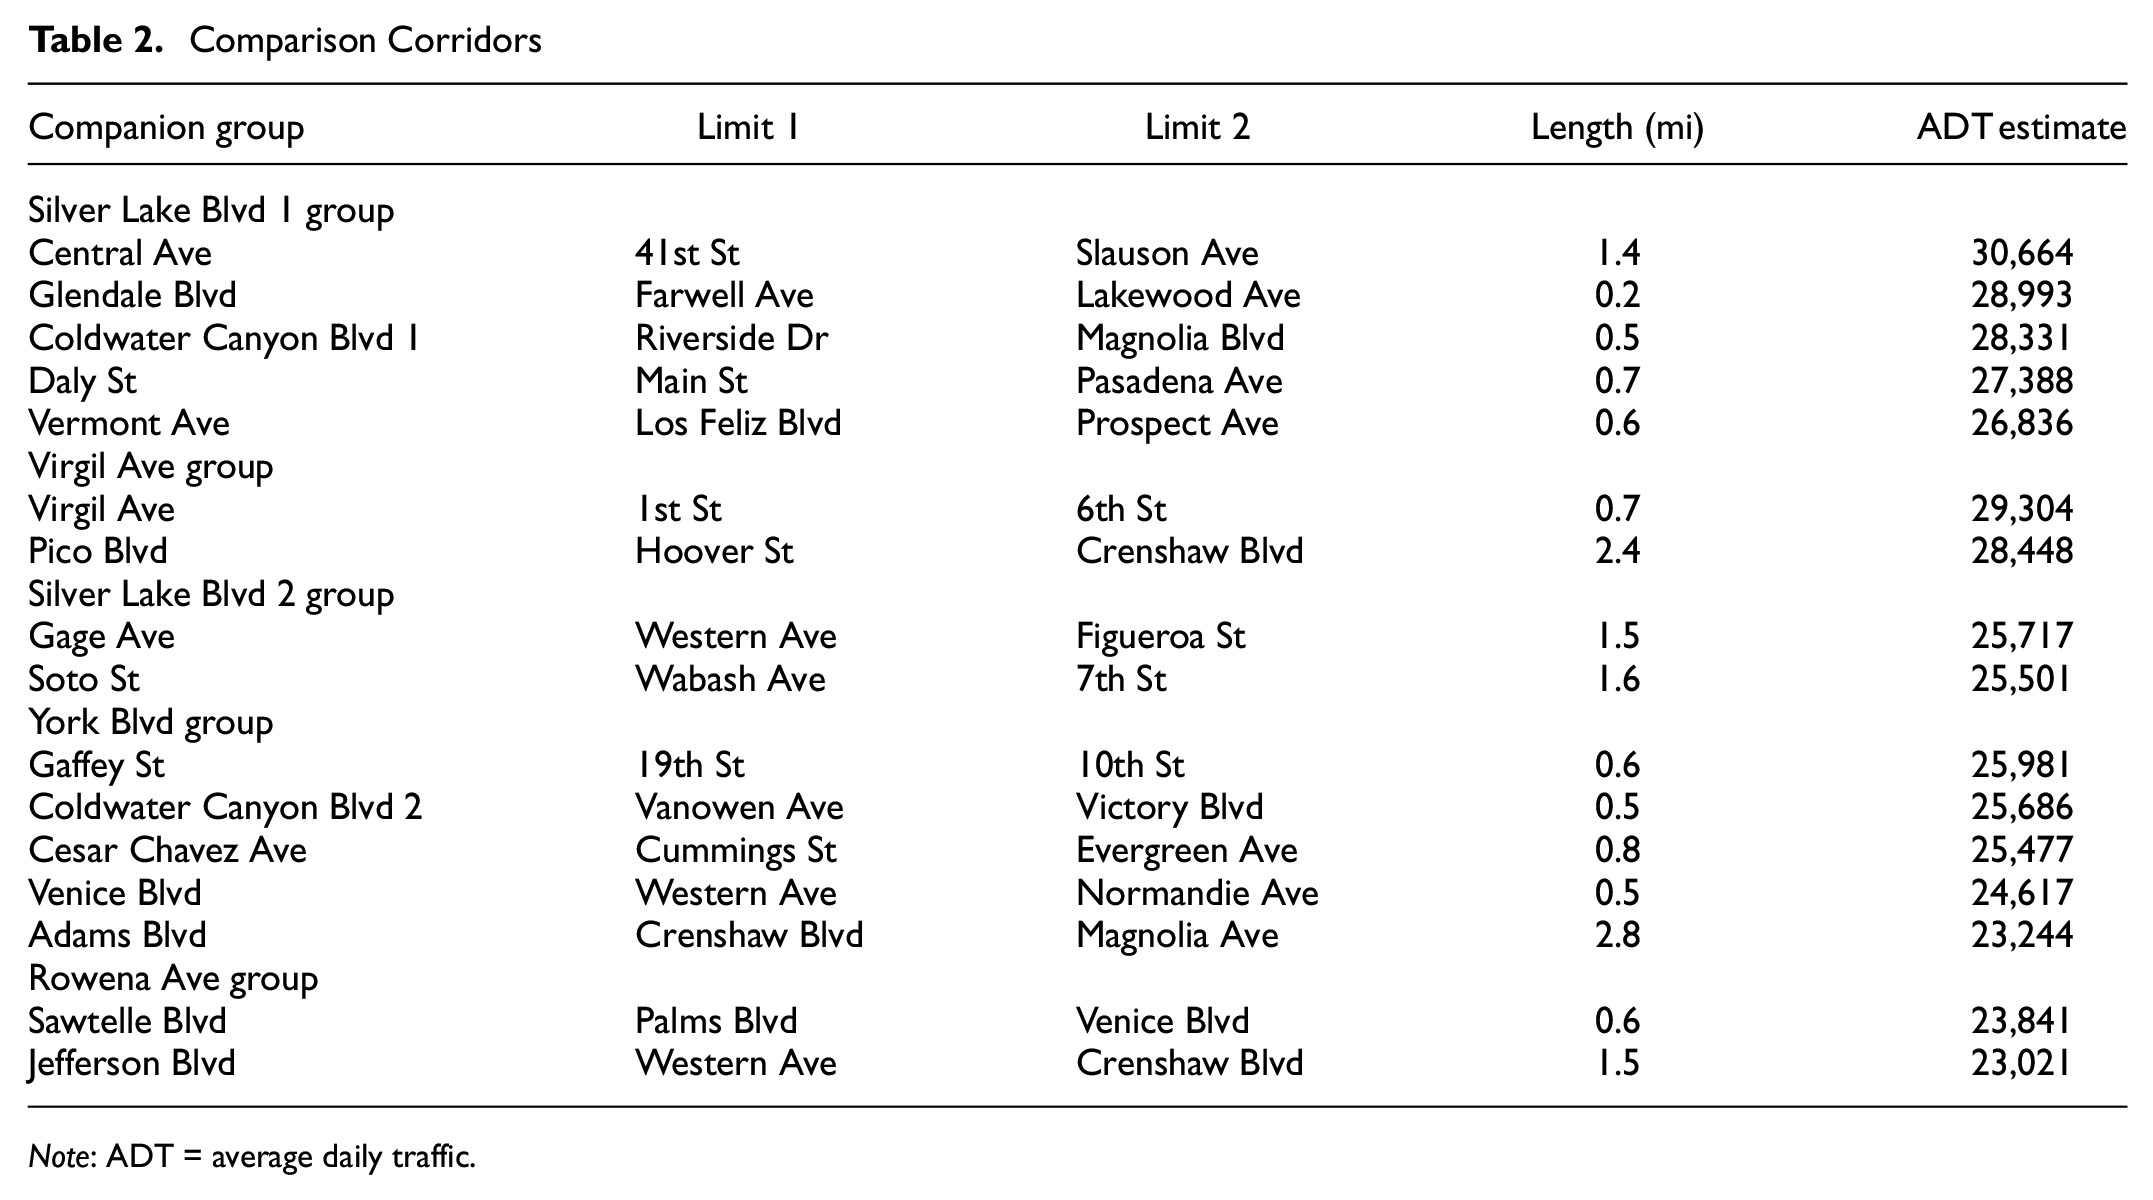
Note: ADT = average daily traffic.
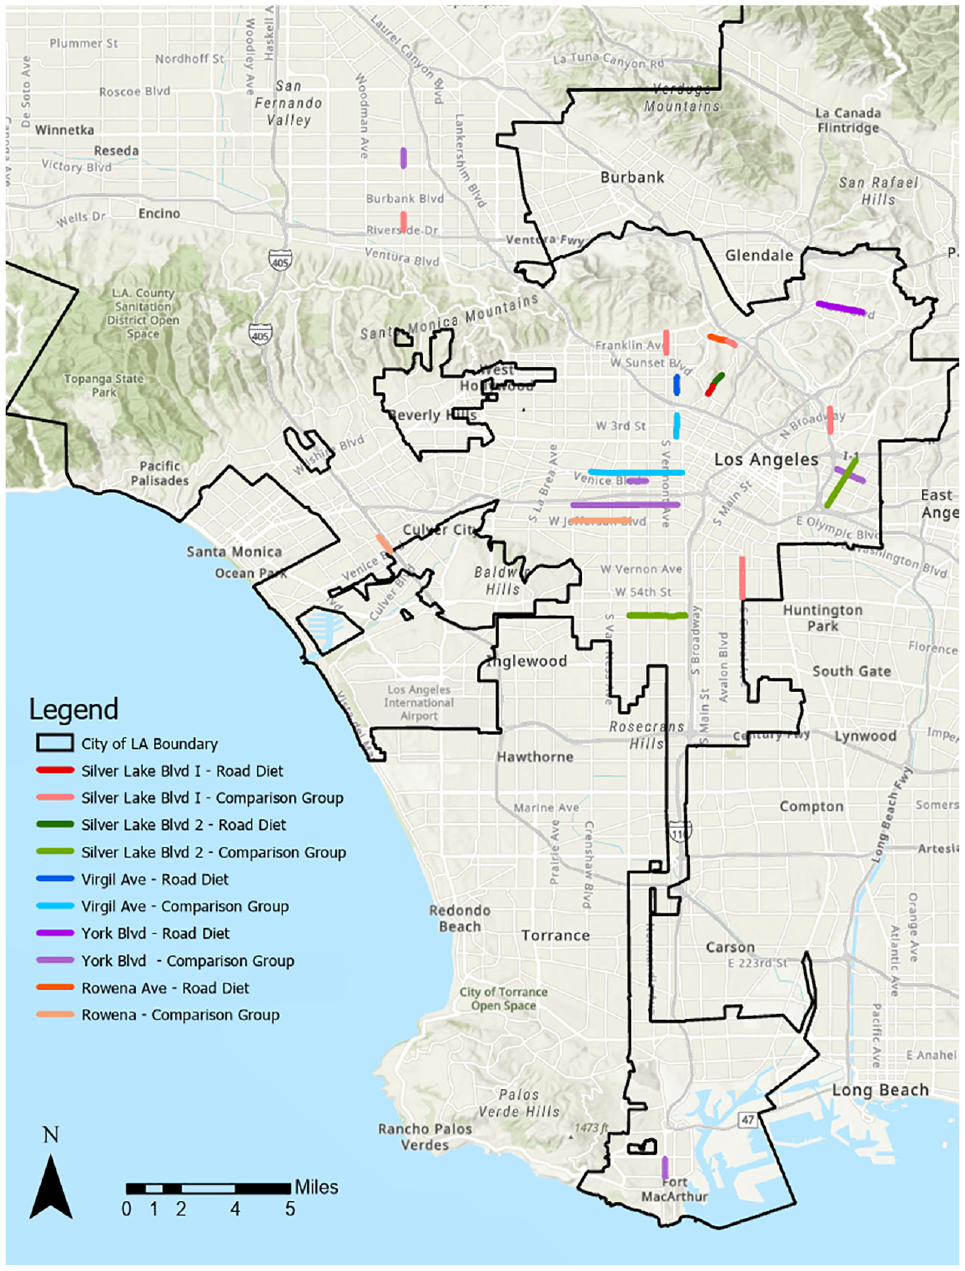
Map of the road diets and comparison corridors.
Findings
Collisions
The five high-volume road diet corridors performed better than their comparison group corridors with respect to vehicle collisions across all metrics studied (see Table 3 and Figure 6). Overall, high-volume road diet collisions were 35.7% lower than the otherwise similar comparison corridors. This was consistent with, although even better than, the findings reported by FHWA indicating that road diets can generally be expected to reduce crashes by about 29%, on average ( 3 ). The lower rates of crashes in the road diet versus the control corridors were statistically significant in our sample at the 90% confidence level (p < 0.10, two-tailed test). Collisions that resulted in fatal and severe injuries were also lower than the comparison corridors by 100% and 31.2%, respectively. Despite these substantial differences, they were not statistically significant, most likely owing to both the rarity of fatal and severe injuries and the relatively small number of cases examined here. Thus, these findings are indicative, not conclusive. In addition, there were 33.3% fewer collisions with other vehicles (statistically significant at the 95% confidence level, p < 0.05, two-tailed test), 100% fewer crashes involving fixed objects (90% significance level, p < 0.10), and 48.3% fewer sideswipe collisions (90%, p < 0.10). There were also 31.4% fewer pedestrian collisions and 34.6% fewer bicycle collisions. Whereas these latter two differences were not statistically significant, because the data were normalized based on vehicle miles and not pedestrian or bicycle counts, it is possible that these measured percentage differences may have underestimated the improvements in pedestrian and cycling safety rates, assuming that bicycle and pedestrian activity increased with the addition of the road diets, which is suggested by the literature ( 15 , 16 ).
Comparison of Collisions Between the Comparison and Road Diet Corridors
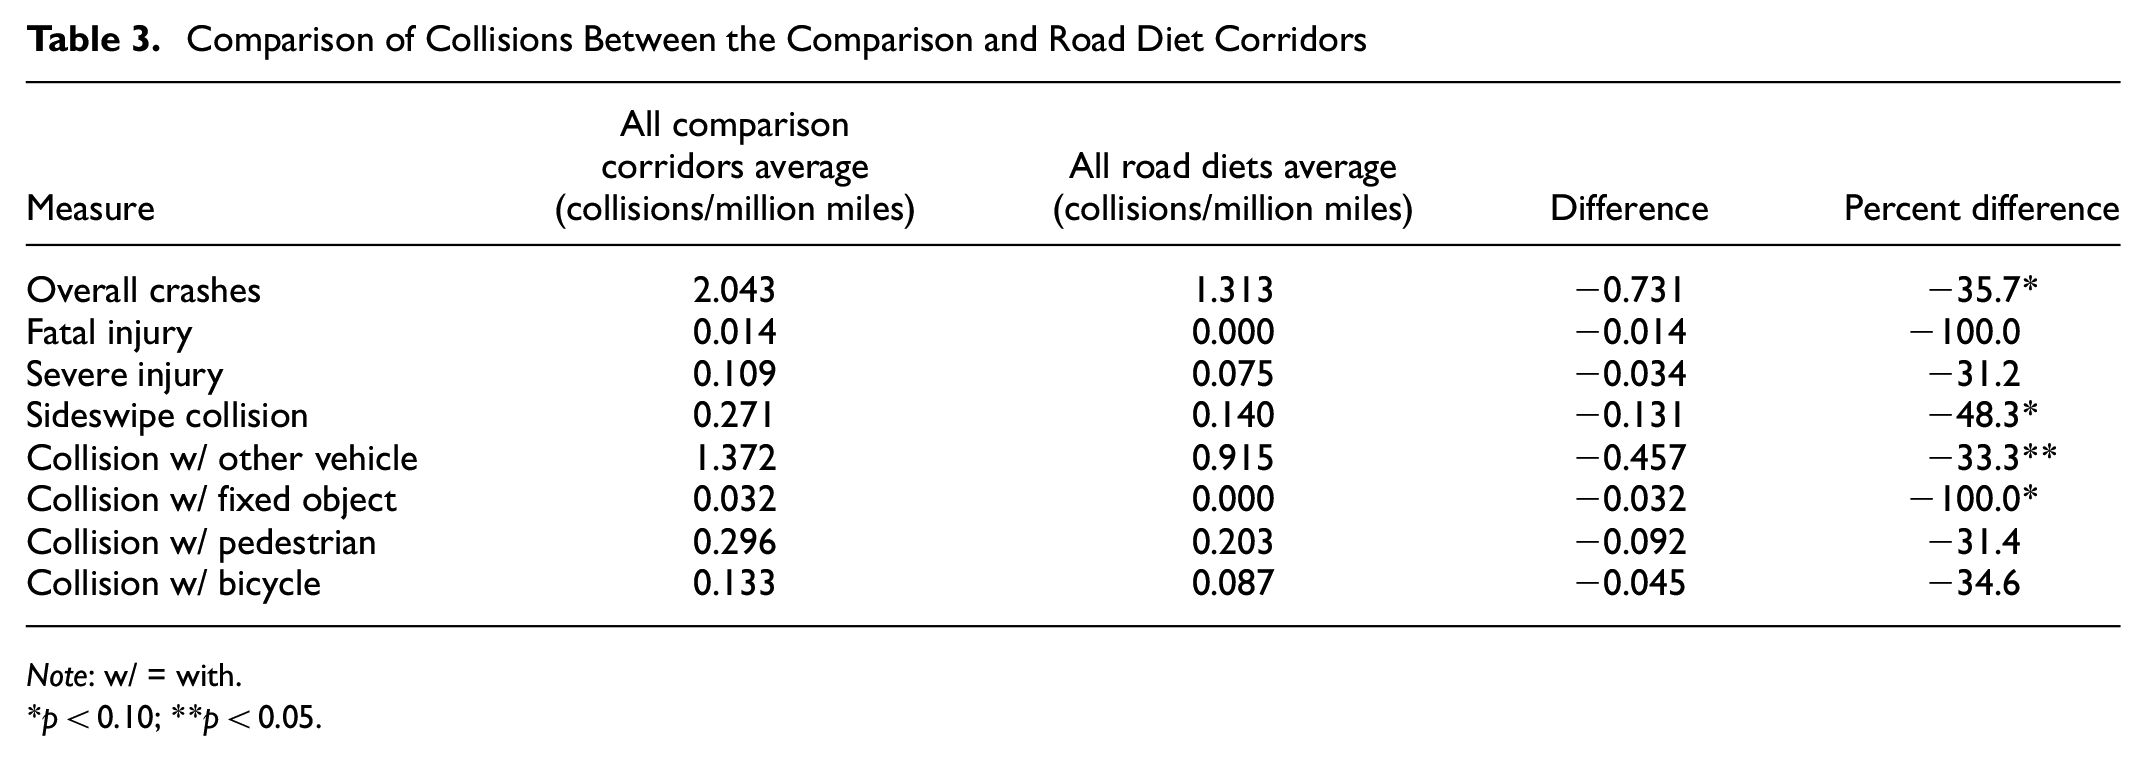
Note: w/ = with.
p < 0.10; **p < 0.05.
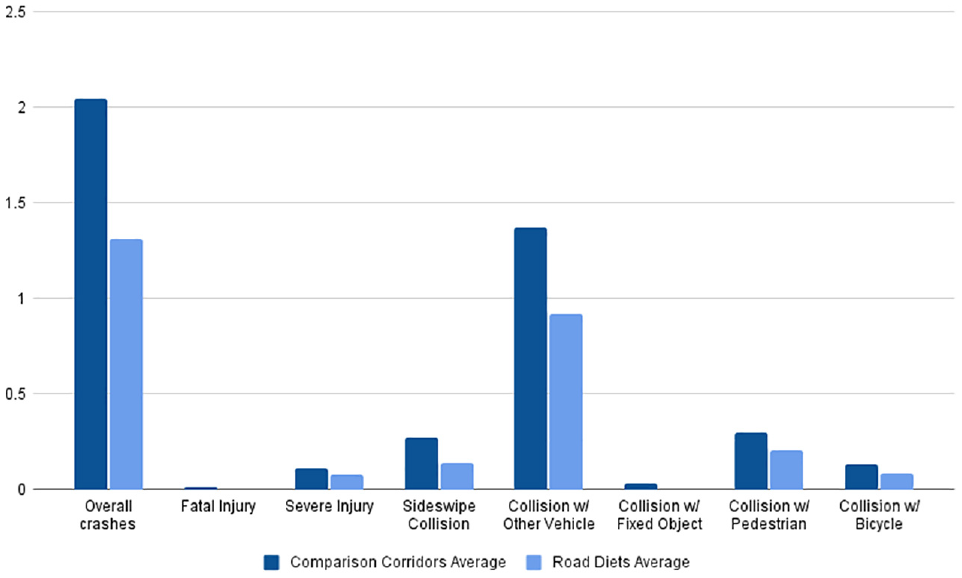
A comparison of average collision rates between the comparison and road diet corridors shows that the road diets performed better in every case.
None of the vehicle collisions we studied were disproportionately concentrated at the corridor limits and were instead dispersed throughout the road diet corridors, with no obvious geographic patterns. The individual crash rates for each road diet corridor were generally consistent with the averages presented here, with few exceptions.
Speeds
One of the major concerns that drivers often express about road diets is that they will substantially increase vehicle travel times. Such travel delay concerns are echoed in road diet guidance and literature, though, of course, reducing vehicle speeds is one of the safety goals of road diets. We found that our sample of high-ADT road diets were associated with slightly lower average vehicle speeds than the comparison corridors. The average travel time per mile was 9.3% greater in the treatment than the control corridors, a difference that was statistically significant at the 99% confidence level (p < 0.01, two-tailed test). In none of the corridors we examined were the number of signals or the phasing or timing of them altered with the implementation of the road diet.
Although the observed differences in travel speeds were relatively minor, they were associated with dramatic safety improvements, as described above. Research indicates that even modest changes in travel speeds can yield big differences in safety outcomes, as shown in Figure 7. This is because even slightly lower speeds can substantially reduce the consequences of drivers’ reaction times and whether a collision occurs at all ( 29 ).
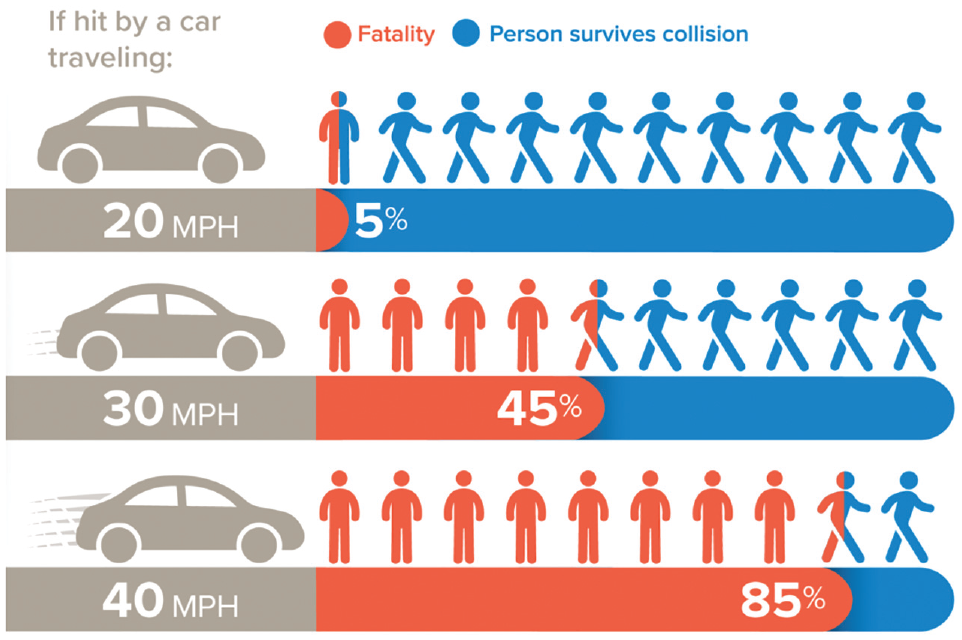
A comparison of the likelihood a pedestrian will survive being hit by a car based on the vehicle’s speed.
Table 4 and Figure 8 show that the observed travel times were statistically significantly longer in the road diet vis-a-vis comparison corridors, although the difference averaged just 16 s per mile across the five road diets examined. Thus, the percentage differences in speed in our sample were considerably lower than the percentage differences in collision, injury, and death rates described above. Put another way, a vehicle traveling 25 mph in a road diet corridor would, on average, travel just over 27 mph in a similar non–road diet corridor. It should be noted that, sometimes, a single wider lane may be able to offer effective capacity and accommodate speeds approaching those of two narrower lanes, but the road diet corridors studied here generally maintained lane widths consistent with their multilane, prelane reduction conditions.
Comparison of Vehicle Speeds Between the Comparison and Road Diet Corridors
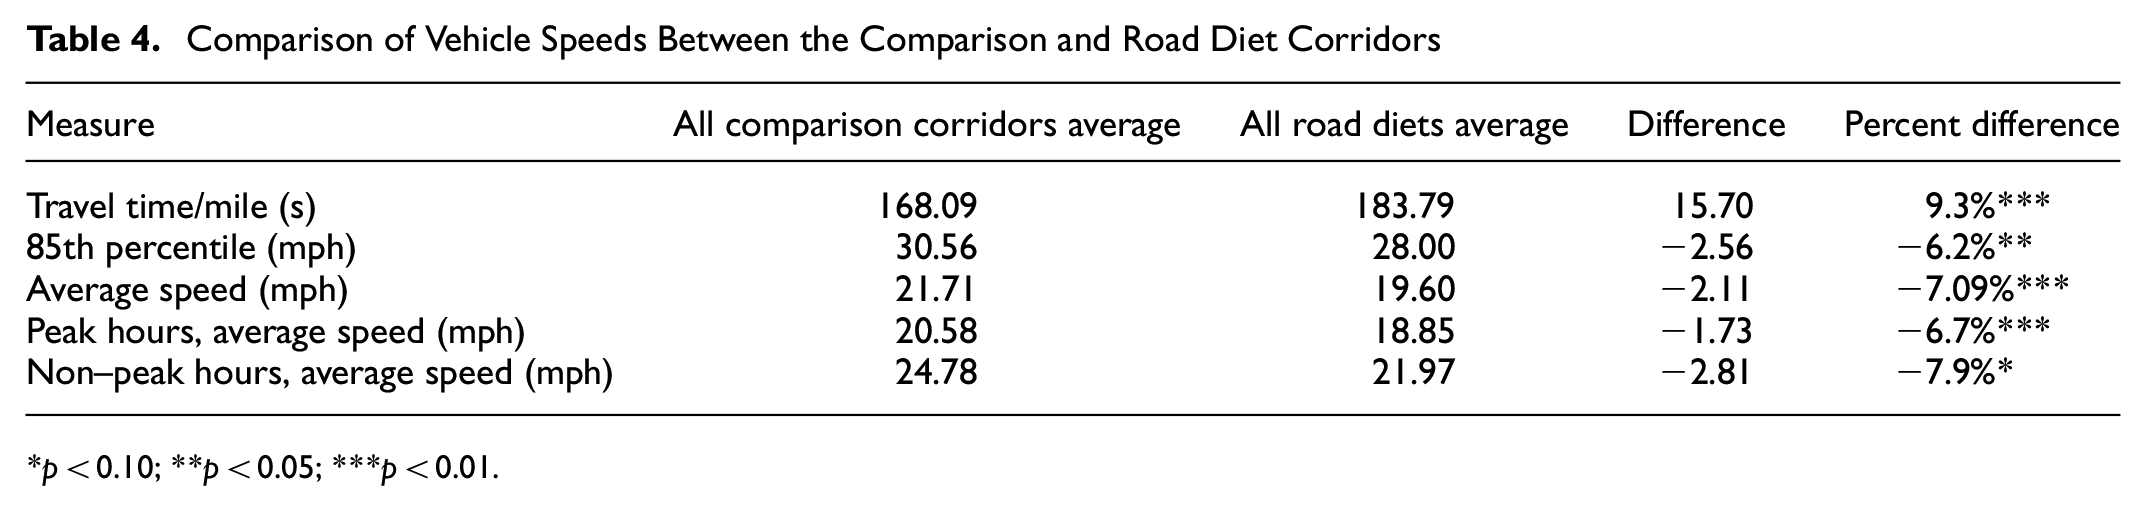
p < 0.10; **p < 0.05; ***p < 0.01.
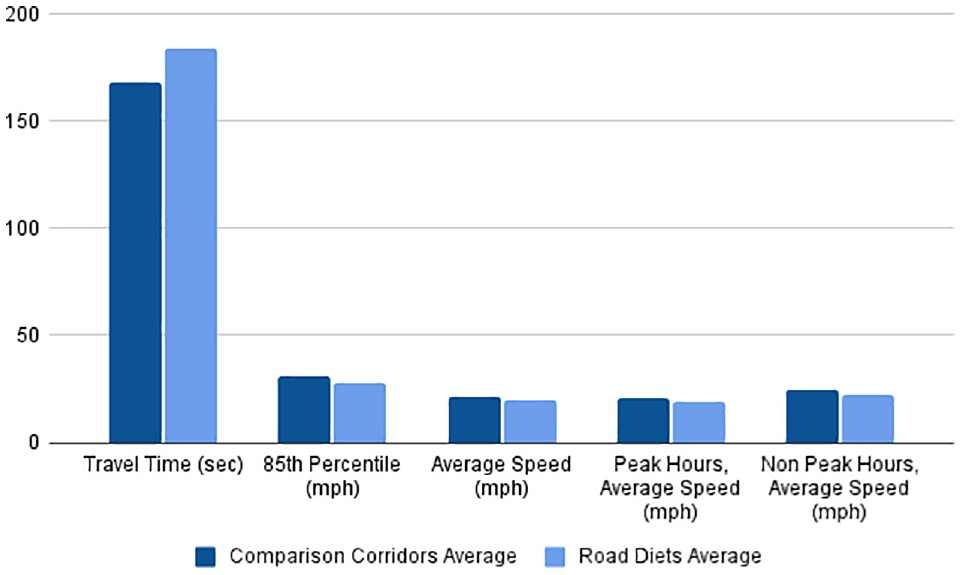
Comparison of speeds between the comparison and road diet corridors shows that the road diets had slightly slower speeds in every category.
The 85th percentile speed indicates the average speed at which about 15% of the vehicles in an uncongested traffic stream travel faster and 85% travel slower. This speed has been commonly used to set speed limits, rounded to the nearest 5 mph. Although Assembly Bill 43, passed in 2021 and signed by California Governor Gavin Newsom, largely repealed the so-called 85th-percentile rule in the Golden State, it is still a commonly used metric in traffic engineering. Accordingly, the data analyzed here indicated that the comparison corridors had an 85th percentile speed that was 6.2% greater, on average, than the five high-volume road diet corridors. In addition, we examined differences in average speeds during peak and off-peak periods. Contrary to the fears expressed by some critics that road diets will lead to intolerable peak-period delays, we found that the observed speed differences between road diet- and comparison corridors during the peak hours (6.7%) were actually smaller than during off-peak hours (7.9%).
Next Steps on this Topic
This research addresses a gap in the road diet literature by investigating whether conventional road diets work in higher-volume settings across multiple cases. To conduct this investigation, we analyzed collision rates and travel speeds in the city of Los Angeles on otherwise similar road diets and comparison streets—all with ADT exceeding 23,000. However, limited data availability and resources available to conduct this analysis meant that not all potentially relevant variables could be addressed here.
First, road diets can have varying impacts on different types of crashes. We explicitly analyzed sideswipe crashes because they are associated with roadways lacking dedicated left-turn lanes; comparing sideswipe collisions on road diet and non–road diet corridors focuses on a specific hypothesized effect of road diets on crashes. However, research analyzing how road diets may change the proportion of crash types is lacking. Although a 2002 report found that “road diet conversions did not result in a significant change” on the proportion of crash types ( 31 ), this two-decade-old finding would benefit from additional investigation into the effects of road diets on crash types. Lyles et al. conducted an observational study of road diets in Michigan and calculated the average CMFs across 24 sites, adjusted for citywide trends. They estimated an overall naïve (unadjusted) CMF as 0.63, which increased to 0.91 after adjustment. When accounting for only the crash types expected to be affected by the road diet (not necessarily only reduced), the CMF was 0.90. The adjusted CMF was 0.59 for the crash types expected to be reduced by a road diet. None of the comparisons gave statistically significant results since the calculated crash-type-specific CMFs for specific sites were not statistically different from 1.0 ( 32 ). However, analyzing other types of crashes in more detail would increase our understanding of the effects of high-traffic-volume road diets on safety.
Whereas our discussion of road diet vehicle capacities centered on ADT, traffic delays and incidents can be affected significantly by the diurnal timing and direction of traffic, neither of which are captured by ADT. Accordingly, we recommend that future research focuses on peak-hour traffic volumes (i.e., the busiest times of the day when traffic is densest and delays are greatest) to determine whether and to what extent peak volumes vary vis-a-vis ADT in high-volume road diet corridors. Relatedly, questions about diversion of traffic from high-volume road diets to nearby corridors should also be studied in more detail, along with whether traffic tends to queue at the entry points to the road diet corridors. In our sample, three of the five segments studied did not have clear, viable, alternative routes to the road diet corridors owing to both the topography and street grid particulars of the immediate area, so diversion is not likely to be a problem in those areas. But such conditions are certainly not always the case. In addition to studying traffic volumes, it may be useful to investigate whether collisions tend to shift onto (or away from) parallel corridors or at the transition points where road diets begin and end—in our study, crashes along the road diets were dispersed and not concentrated at the peripheries of the corridors.
In addition to the question of spillover effects, other potential confounding factors could be studied. Road diets are premised on using protected left- (and often right-)turn lanes and pockets to keep the single lane of through-traffic flowing as smoothly as possible. However, factors other than turning vehicles can impede traffic flow. For example, the road diets we studied in Los Angeles all have bus stops that occupy curbside space that would otherwise be occupied by parking, which requires buses to leave and reenter the traffic stream to allow passengers to board and alight. But this may not be the case for all high-volume road diets in other places. Other factors such as lane widths, the density of traffic signals and driveways along a corridor, adjacent land-uses, and presence of midblock landscaped medians could all influence the capacity and success of road diets, and not just in higher-volume settings. Learning more about the effects of high-volume road diets on specific users, such as cyclists and bus riders, could also be instructive. Further, railroad crossings along a corridor could also affect the function of potential roads and should be studied where applicable.
However, because current federal guidance discourages (though by no means prohibits) high-volume road diets, they are limited in number. For context, our study combed through more than 230 unique road diet segments installed over a 40-year period that cumulatively make up more than 160 miles of road diets in the city of Los Angeles. Among these 230+ road diets, only five segments that cumulatively amounted to just 3 centerline miles were suitable for this analysis. The paucity of high-volume road diets makes them difficult to study, and even more difficult to generalize about. Nonetheless, knowing the practical upper-volume and capacity limits for road diets will require there being enough high-volume road diets to evaluate to properly account for varying contexts and conditions.
Conclusion
Although street design is viewed by some as the product of objective standards and evidence-based guidelines, it is ultimately a reflection of values and the balancing of competing needs. A street’s design and the allocation of space to different purposes are not sacrosanct and can change in response to shifting priorities, such as valuing safety over maximizing vehicle flows. In other words, some increase in vehicle delays may be an acceptable tradeoff to secure fewer collisions, injuries, and deaths.
With respect to safety, we found that the five Los Angeles high-ADT road diet corridors examined here had lower average incident rates across multiple measures compared with otherwise similar untreated corridors. The lower rates of collisions with other vehicles were statistically significant at the 95% confidence level (p < 0.05, two-tailed test), whereas the lower rates of overall crashes, sideswipe collisions, and collisions with fixed objects were all modestly statistically significant at the 90% confidence level (p < 0.10, two-tailed test). The measured rates of severe and fatal crashes between the treatment and comparison groups were substantial as well, but were not statistically significant in this sample, probably because of their infrequency. These measured reductions in collisions, injuries, and fatalities were actually greater than (though consistent with) the average estimates compiled by FHWA, which suggests that high-traffic-volume road diets may, if anything, experience even greater safety improvements than on lower traffic volume road diet corridors, all things being equal ( 3 )—at least in our Los Angeles sample. However, a larger sample of high-volume road diet corridors across a wider geography will be required to more conclusively confirm these indicative results. However, because higher-volume road diets are implicitly discouraged by current FHWA guidance and, in turn, by many local policies, such corridors remain comparatively rare. This, perhaps ironically, limits our ability to analyze them.
With respect to vehicle speeds, we consistently observed modest statistically significant differences in speed between the high-ADT road diet- and (the higher speed) control corridors. Whereas the average speeds in the road diet corridors examined were lower than the comparison corridors, they were only modestly lower and might be viewed as a feature and not a “bug” of high-volume road diets, as one of the aims of road diets is to increase safety by moderating vehicle speeds. The proportionally small change in speeds and proportionately large change in collisions observed in our data may seem counterintuitive, but past research has found that seemingly minor changes in speed can have a big impact on collision severity; they affect driver reaction times as well and, thus, whether a collision occurs at all. Further, the 6.7% (peak period) to 7.9% (off-peak) average reductions in vehicle speeds observed in our data were not the substantially slower speeds that many road diet critics claim, and many drivers fear.
Overall, road diets appear to be effective in achieving better safety outcomes with minimal travel delays, and our analysis of Los Angeles data presented here suggests that such benefits may hold even in corridors with traffic volumes that substantially exceed the 20,000-ADT threshold in FHWA guidance. Of the road diet corridors studied in Los Angeles, our sample peaked at approximately 28,000 ADT for a corridor on Silver Lake Boulevard and that street continues to function without significant reductions in vehicle speeds, based on our analysis.
Safety improvements are the primary goals of road diets, but they are not the only ones. We acknowledge that our analysis does not account for other potential benefits of road diets, such as increasing the number of people walking and bicycling along the now-safer streets, promoting outdoor sidewalk dining, or making space for landscaping ( 3 ). Although strongly indicative, our analysis of five high-ADT road diets in Los Angeles was not conclusive. What we can conclude with certainty, however, is that our findings suggest that the 20,000-ADT threshold for road diets recommended by FHWA warrants considerably more scrutiny.
Footnotes
Author Contributions
The authors confirm contribution to the paper as follows: study conception and design: K. Venegas, B. Taylor, S. Martinez; data collection: K. Venegas, S. Martinez; analysis and interpretation of results: K. Venegas, B. Taylor, S. Martinez; Y. Hwang; draft manuscript preparation: K. Venegas, B. Taylor. All authors reviewed the results and approved the final version of the manuscript.
Declaration of Conflicting Interests
The authors declared no potential conflicts of interest with respect to the research, authorship, and/or publication of this article.
Funding
The authors received no financial support for the research, authorship, and/or publication of this article.