
Abstract
Predicting flow in taxi systems can improve taxi operations and reduce passengers’ waiting time. With the increasing availability of taxi mobility data sets, more studies have tried to analyze and model taxi demand. However, most existing works merely attempt to predict the number of pick-ups and drop-offs by using local observations. Nevertheless, predicting the passengers’ pair-wise flow specifically through simultaneous consideration of local variations and network communities in the taxi systems has been neglected. In this paper, we introduce a globally consistent periodic flow prediction for taxi systems that integrates communities in the matrix factorization model. We apply non-negative tensor factorization to capture the periodic variations in the passenger flow in different areas and predict the flow (and pick-ups and drop-offs) in the next periods by integrating the most recent observation with detected patterns from historical data. The results show an improvement in the prediction accuracy from some baselines and a state-of-the-art method. We also propose a method for visualizing flow that potentially improves taxi operations by assisting drivers with selecting passengers.
Keywords
Developments in positioning systems and communication technologies have improved our understanding of mobility in urban areas. Specifically, the availability of large taxi-trip data sets has provided an opportunity to deploy more efficient transportation services. In this regard, analyzing the taxi passenger flow and taxi demand in a spatio-temporal context can improve taxi operations and reduce passenger waiting time.
In recent years, scholars have studied graph structures known as “communities” to reveal major mobility patterns and divide transportation systems into multiple areas with different operational and functional characteristics ( 1 , 2 ). It seems that cluster/community detection is an ever-present part of most demand prediction methods. However, in the existing works, the application of community detection is limited to an early stage of modeling where smaller regions represented by network nodes are grouped into larger areas or meta-nodes that indicate the major demand areas (or major origins and destinations in general) in a transportation system.
While existing methods for demand prediction in taxi systems rely on revealing temporal patterns in local observations, considering communities as an integrated part of the prediction model has been ignored. Similar to modeling local variations, which is a key component in most state-of-the-art taxi demand prediction methods, considering communities can potentially lead to more-accurate predictions. In fact, we believe that communities should be leveraged beyond a (sometimes unnecessary) aggregation step and can be incorporated as a constraint in modeling the flow in taxi systems. It has been shown that communities are stable in taxi systems ( 1 ). Therefore, considering this property, known as “global consistency,” can potentially improve the predictions, especially when local spatio-temporal patterns are violated because of the abrupt changes in the taxi demand.
In this paper, we propose a matrix factorization model for globally consistent periodic flow prediction (GCPFP). GCPFP predicts real-time taxi demand and passenger flow in urban areas by using historical and most recent observations from the taxi system. The study area is divided into a grid, and multiple origin-destination passenger flow matrices (simply called flow matrices in this paper) are formed that describe the trips between all cells in past time intervals (e.g., every hour). The flow matrix is decomposed into three temporal factor matrices that encode the evolution and periodic variations in the flow. We use the concept of community belongingness to preserve the community structures in the predictions. By incorporating the community structures and capturing the periodic and most recent variations, the model is used to carry out real-time predictions. In comparison with existing methods that predict the demand or flow at the community level, the proposed method allows for denser spatial granularity and enables computing flow between arbitrary divisions (e.g., traffic analysis zones) by performing simple post-process aggregations. Passenger trips are the basis of analysis in the proposed method, which means that pick-ups and drop-offs and the intrinsic relationships between them are modeled simultaneously.
Some important related works are presented in the next section. This is followed by the problem definition and methodology section, where the definitions, notations, and proposed method are presented in detail. Finally, an extended discussion of results and conclusions is presented.
Related Work
Using trip generation models to predict taxi demand is a common approach in studies of taxi systems. Accordingly, the number of pick-ups/drop-offs in each region is predicted based on explanatory variables such as population, demographics, socioeconomic variables (e.g., income and education), and land use. Different regression models have been used for this purpose ( 3 , 4 ). Such prediction models can help forecast taxi demand in longer periods (i.e., future years and decades). However, they fail to model the short-term variations, as the used explanatory variables are relatively steady in shorter periods.
Time series forecasting techniques have been widely employed to forecast time-varying traffic-related variables such as vehicle counts and the number of pick-ups/drop-offs in different regions. Separate time series (e.g., number of drop-offs) are formed in different regions and the variable of interest is forecast using times series analysis techniques ( 5 , 6 ). Although using independent times series for each region enjoys simplicity in the modeling, such models fail to capture the relations between the regions.
Incorporating spatio-temporal relations in taxi demand prediction has been the focus of some recent studies. Faghih et al. compared the performance of vector autoregressive and spatial-temporal autoregressive models and showed the effectiveness of considering spatial closeness in taxi demand prediction ( 7 ). Using convolutional and graph neural networks is another emerging approach for incorporating spatial relations, where each region is modeled by a cell (or a node) and the spatial relations between the neighbor cells are captured by applying a neural-network-based model on the data set ( 8 , 9 ). Although these works model the relations on a local scale, they do not consider the relations on a global scale in their predictions. Most works in this category model the pick-ups and drop-offs separately. In other words, the impact of “pick-ups at origins” on the “drop-offs at destinations” (and the opposite) is not taken into account. The latter shortcoming can also be seen in the previously mentioned approaches.
Communities in a taxi system have been studied in multiple works where an itinerary network generated from the mobility data (e.g., taxi trajectories) is divided into multiple regions with stronger intra-relationships. Detected communities are used as the basis of mobility analysis. Davis et al. used a multi-level clustering algorithm along with time series modeling to forecast taxi travel demand ( 10 ). The clustering algorithm groups the demand using the correlation between the neighbor cells, and a linear time series analysis is performed to forecast the demand at each cell in the future days. Tang et al. applied the Louvain algorithm on taxi trip data sets to divide the urban areas into multiple communities with the same functional properties ( 11 ). Detected communities are then used for forecasting the demand, based on a graph convolutional network.
Matrix factorization has been applied to time-varying data sets including mobile phone networks and shared mobility data such as taxi and shared bicycle trips ( 12 – 15 ). There is also a close relationship between the concepts involved in network community detection and matrix factorization ( 16 ). Matrix factorization has been widely used for analyzing large-scale and sparse data sets, as it effectively reduces the dimensionality of high-dimensional data sets and alleviates data noise and volatility.
Problem Definition
In this research we use the following definitions:
Taxi users are picked up at their origin and dropped off at their destination. The flow between different origins and destinations varies during the day because of various factors that affect the demand. For example, time of day has been shown to be closely related to taxi ridership. We also know that there are relationships between taxi demand at different locations on local and global scales that can affect taxi passenger flow. The core problem is to forecast the flow, pick-ups, and drop-offs for the next time periods(s) (e.g., next hours) given past and most recent data on the taxi passenger trips by considering the communities and periodic variations in the taxi system.
Methodology
Modeling Assumptions and Annotations
The study area is divided into a grid of rectangular
Modeling Periodic Variations
Flow modeling in a taxi system can be leveraged by matrix factorization through representing the taxi flows as a time-varying adjacency matrix and learning a low-rank approximation that characterizes the underlying features of flow generation at different locations. Taxi activity has been shown to exhibit periodic variations. For example, we expect to observe relatively similar taxi usage in similar periods of the day (e.g., in the mornings). To capture these periodic (seasonal) patterns, we apply a modified version of the technique introduced by Hooi et al. for detecting seasonal patterns (
17
). Accordingly, a dynamic flow matrix

where
Here
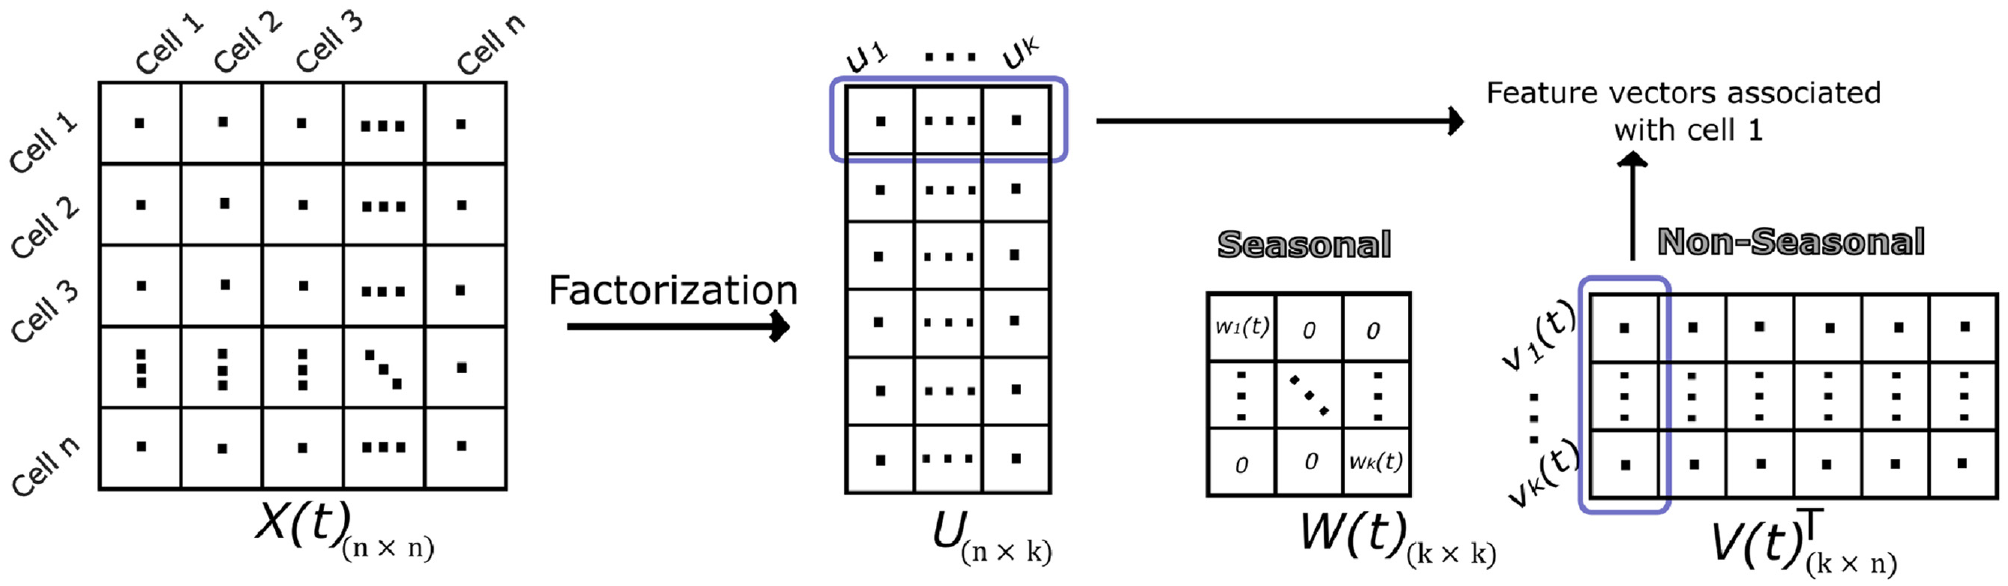
An illustration of the proposed matrix factorization model.
The model includes two major units: initialization and online updating. Initialization is an offline process through which the factor matrices including the seasonal weights are calculated. It starts with stacking up a sequence of adjacency matrices in a few seasons of data
Non-negative CP decomposition is then applied on
The updating algorithm is explained in the Optimization and Prediction section.
Network Communities with Matrix Factorization
Communities in a taxi system represent the areas with similar characteristics. For example, trips that originate from different cells in the same community may tend to have similar destinations. Therefore, if we represent each cell by a vector of latent features (i.e., feature vectors), the degree to which two vectors are similar indicates the tendency of their corresponding cells to have similar characteristics, or, in other words, it indicates their tendency to belong to the same community. On the contrary, cells with perpendicular feature vectors are less likely to be in the same community. Accordingly, detected communities reflect the relationship between the cells on a global scale.
Matrix factorization has been used for community detection (
16
,
19
,
20
). Specifically, communities can be determined by computing the similarities of connected objects (e.g., network nodes) using dot products of feature vectors (
16
). By computing the similarities for all pairs of objects, a similarity matrix is achieved that represents the tendency of all objects to be in the same community. This similarity measure is also known as “community belongingness.” By denoting the factor matrix of a rectangular adjacency matrix
Proposed Flow Prediction Model
Flow prediction starts with calculating the time-varying factor matrix

As

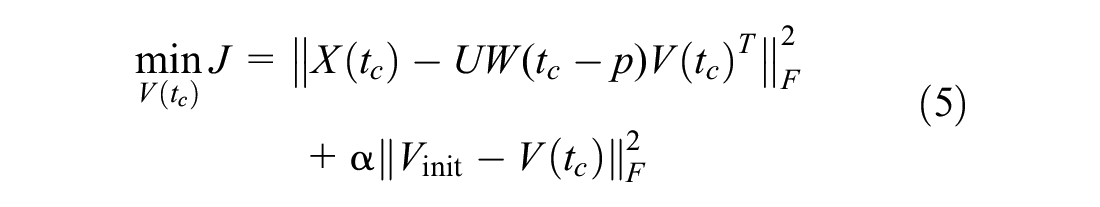
where
We also include a term as
As a reminder, the dot products of feature vectors associated with two objects (i.e., cells in our case) reveal the tendency of those objects to belong to the same community. As in our model
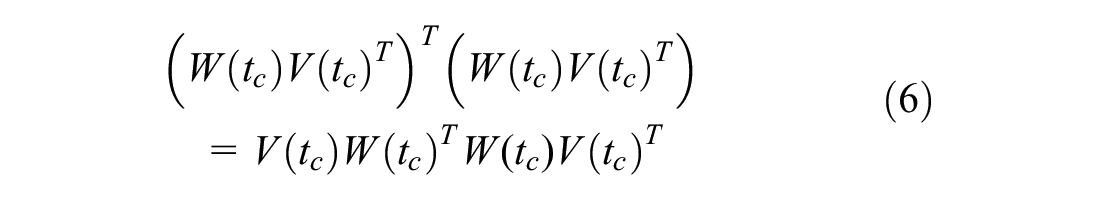
For our model to be globally consistent, we expect the communities in the next steps
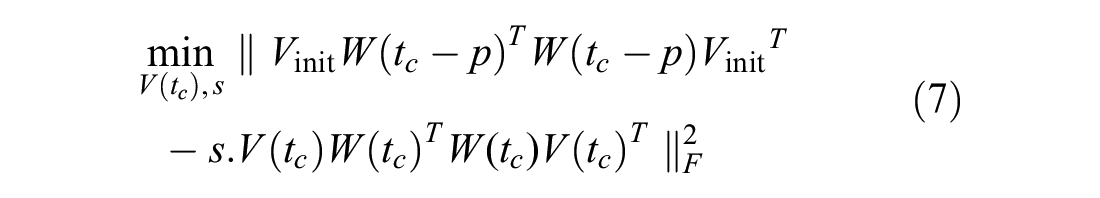
where
Equation 7 can be presented as

where

Thus, the objective function of the factorization model can be written as
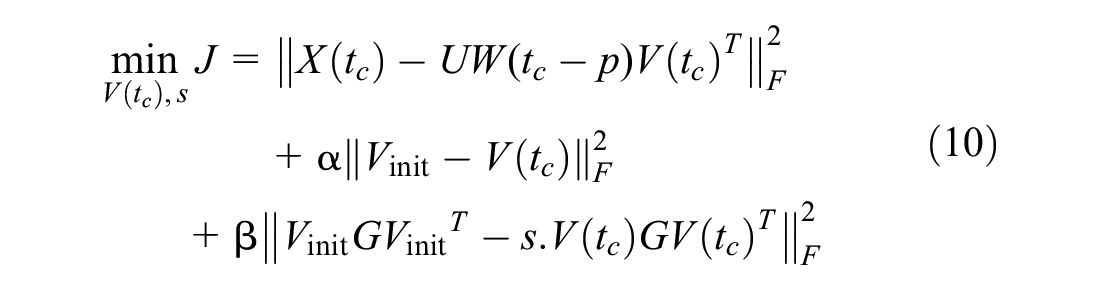
where
Figure 9 indicates a set of parameters that have been used in the proposed model. A detailed description of the grid search algorithm can be found in Kelleher et al. ( 21 ).
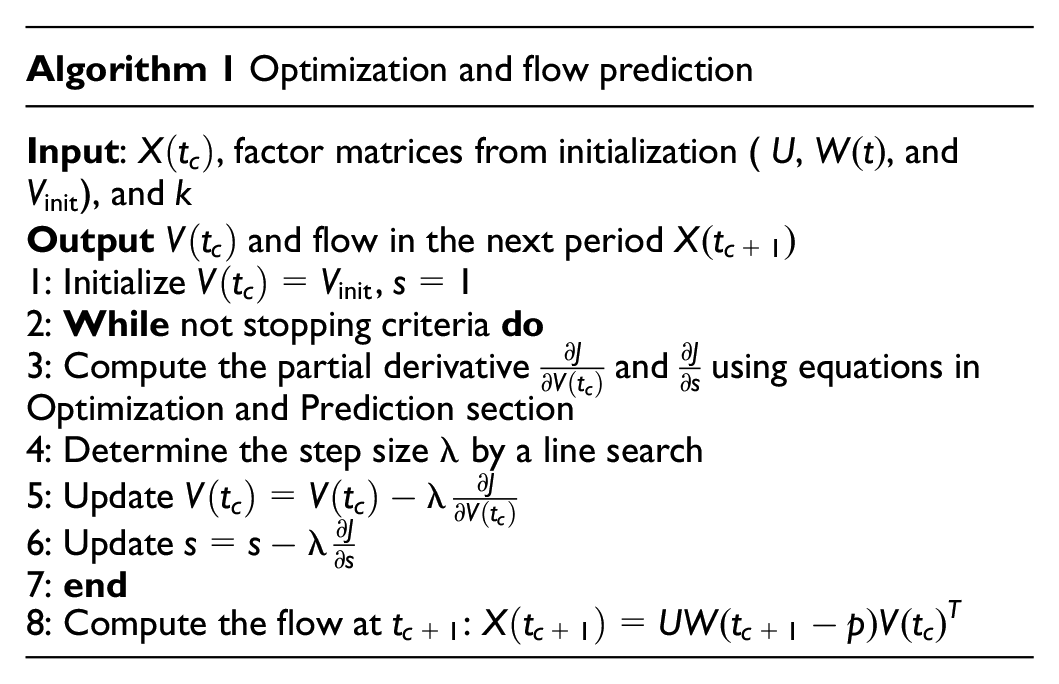
Optimization and Prediction
We use a gradient descent algorithm to solve the optimization problem in Equation 10. By utilizing
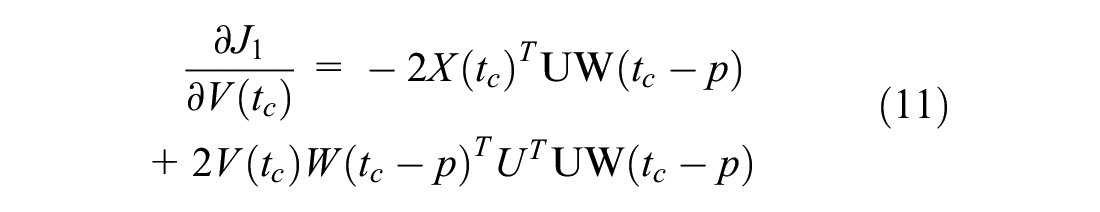
For the second term

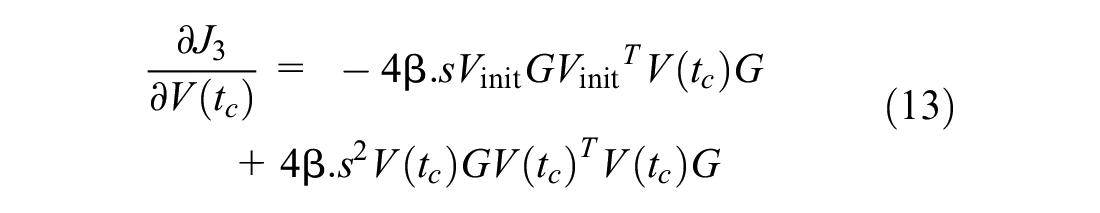
In the third term
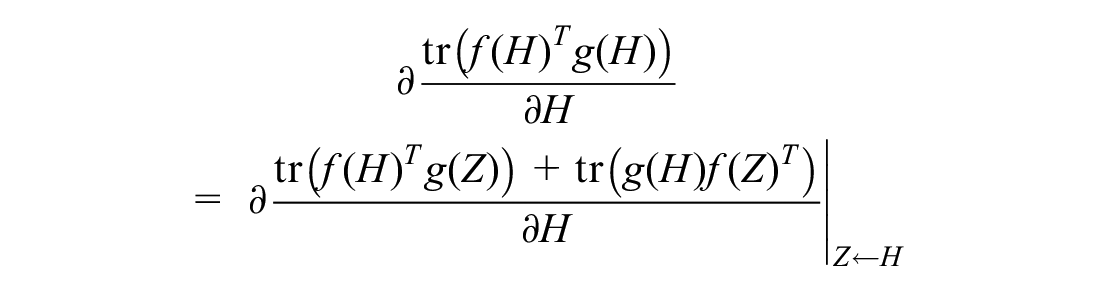
After simplification we have
The derivative of
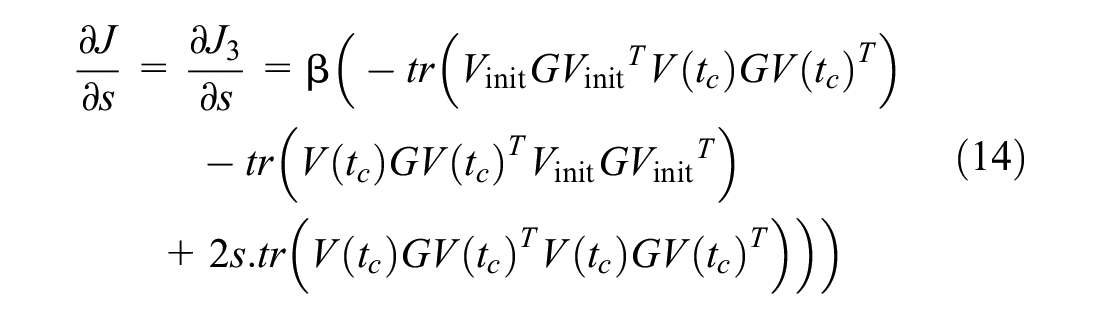
The derivative of
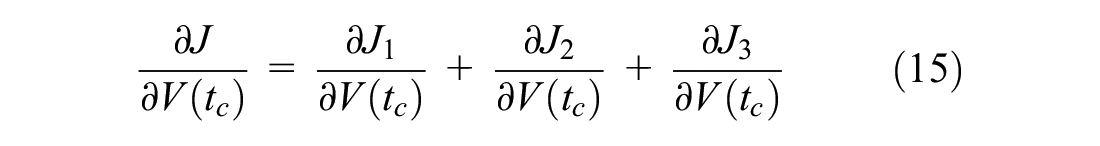
By updating
Experiments
Data and Initial Analysis
We have used a data set from yellow taxis in New York City, U.S., to demonstrate the efficiency of the proposed method. The data set contains around 89 million records of taxi trips from January to June 2013 and includes information on the start and end time of the trips, geographical position of the passenger pick-ups and drop-offs, and the number of passengers. The majority of trips were made inside or between the four boroughs of New York City: Bronx, Brooklyn, Queens, and Manhattan. We explored the periodicity in the data to define the seasons in the model. Figure 2 shows the hourly total number of trips on different days of the same week and on the same day (Thursday) of four consequent weeks. Both Figure 2a and b show a daily periodicity in the number of trips, as this number seems to be repeated every day at the same time. However, it seems that a weekly season (Figure 2b) represents the periodicity in the data more accurately. To investigate this, we calculated the standard deviation (SD) of the hourly total number of trips, and the average is significantly smaller in the weekly scenario (SD = 2,026 for weekly and SD = 2,482 for daily). Accordingly, we adopt a weekly seasonality for our model with a period p = 7 × 24 = 168. This specifically is helpful, since the significant difference between the taxi usage during weekdays and weekends can be handled naturally in this way. There are also longer seasons (e.g., yearly periods) about which we are not interested in this research, as we look for short-term patterns in the data.
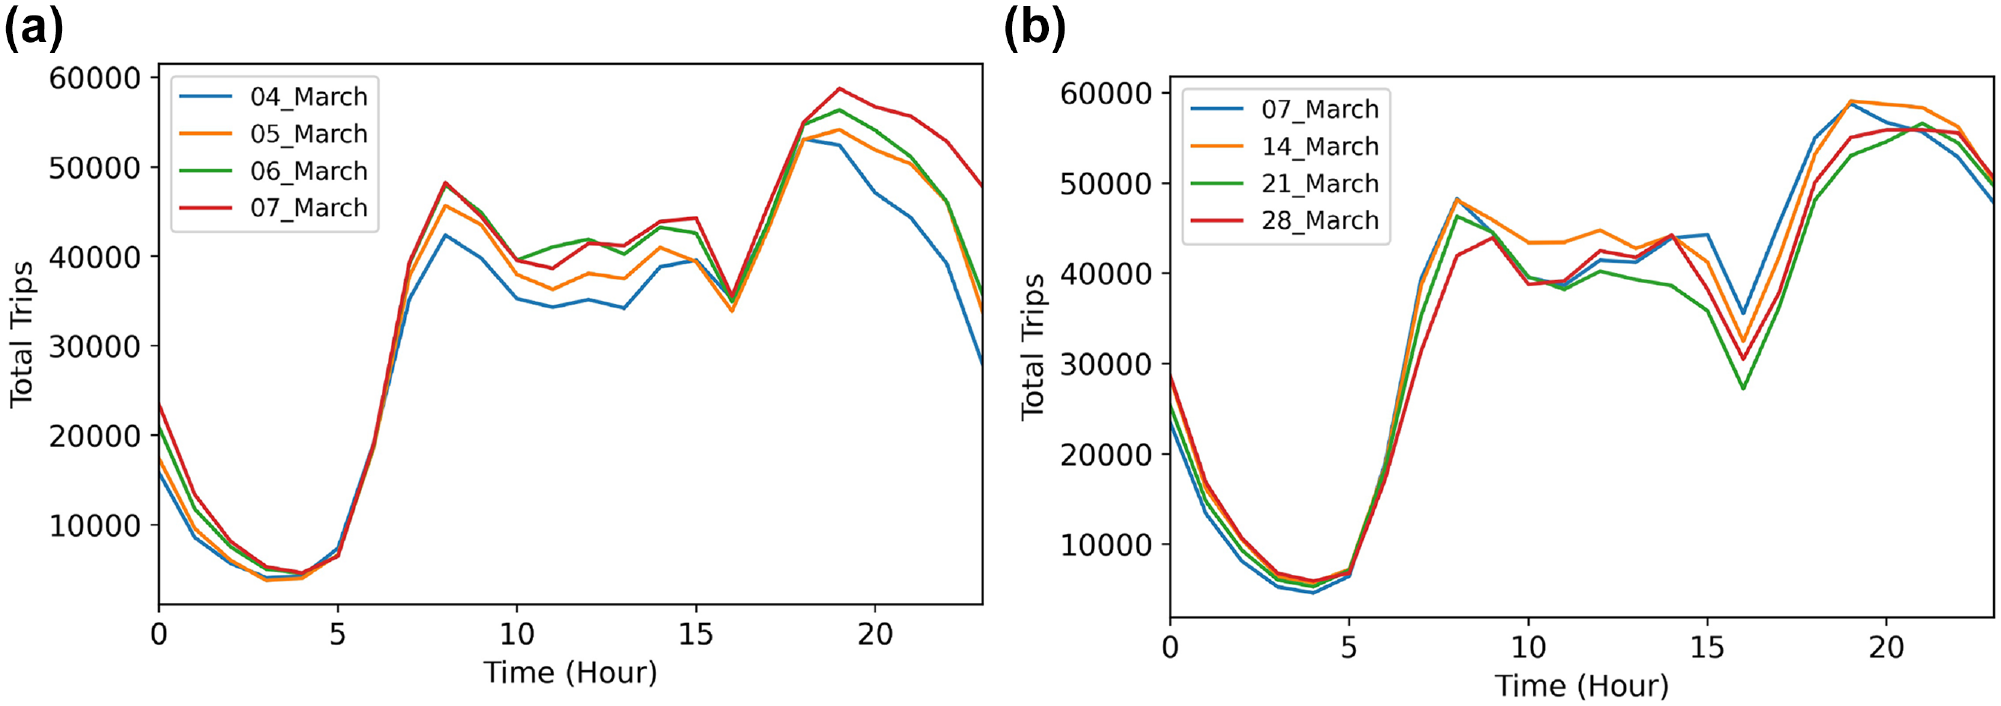
Daily and weekly variations in the total number of taxi trips: (a) on different days of the same week and (b) on the same day (Thursday) of four consequent weeks.
We also investigated the communities that can be detected at different times of the week. Figures 3 and 4 show the communities detected using the flow matrix generated from the trips taken from 7:00 to 8:00 a.m. (morning traffic peak) on two consecutive Tuesdays. We have used the Louvain algorithm to detect the communities, but any community detection algorithm can be used as we merely intend to demonstrate the periodicity of the communities at this stage ( 23 ). Detected communities reflect the relationship between the cells on a global scale. As a reminder, community detection is not the output of our proposed method, and instead we try to capture and preserve the tendency of the cells to belong to the same community. Therefore, interpretation of the number and extent of the communities is not in the scope of this paper. However, Figures 3 and 4 present examples of the existence of communities in the taxi trip data set and the periodic variations in the detected communities. There are four major communities in Figure 3 each representing an area with stronger relationships between their cells. It seems that the communities in the mornings of March 12 and March 19 (Tuesday) are fairly similar both in number and geographical extent. This especially becomes more evident when the detected communities on Tuesday morning are compared with the ones on Wednesday evening where there are three major communities (community 4 is merged with community 3) and the geographical extent of the communities are different from the ones on Tuesday morning. This example and similar experiments carried out by the authors, and also the evidence found in the literature, are the basis of considering communities in the flow prediction model in the proposed method.
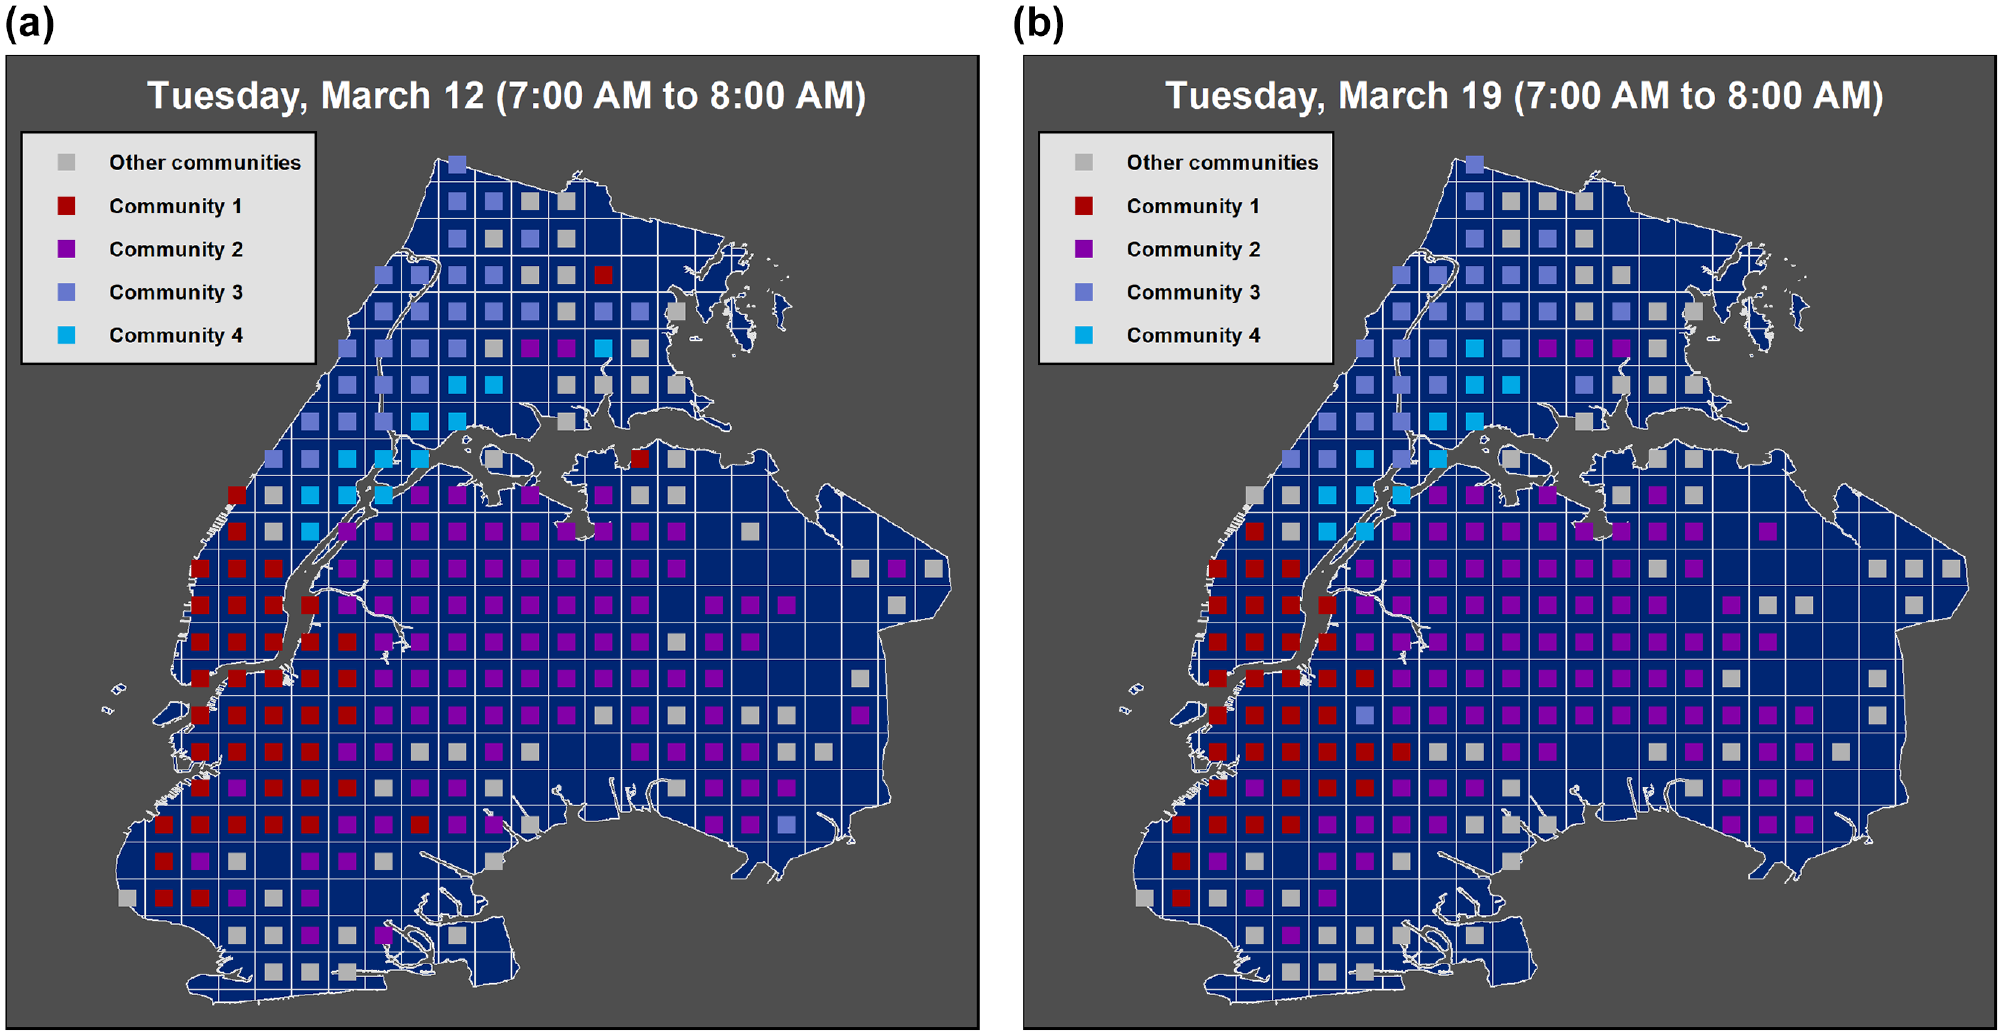
Communities on Tuesday morning 7:00–8:00 a.m: (a) March 12 and (b) March 19.
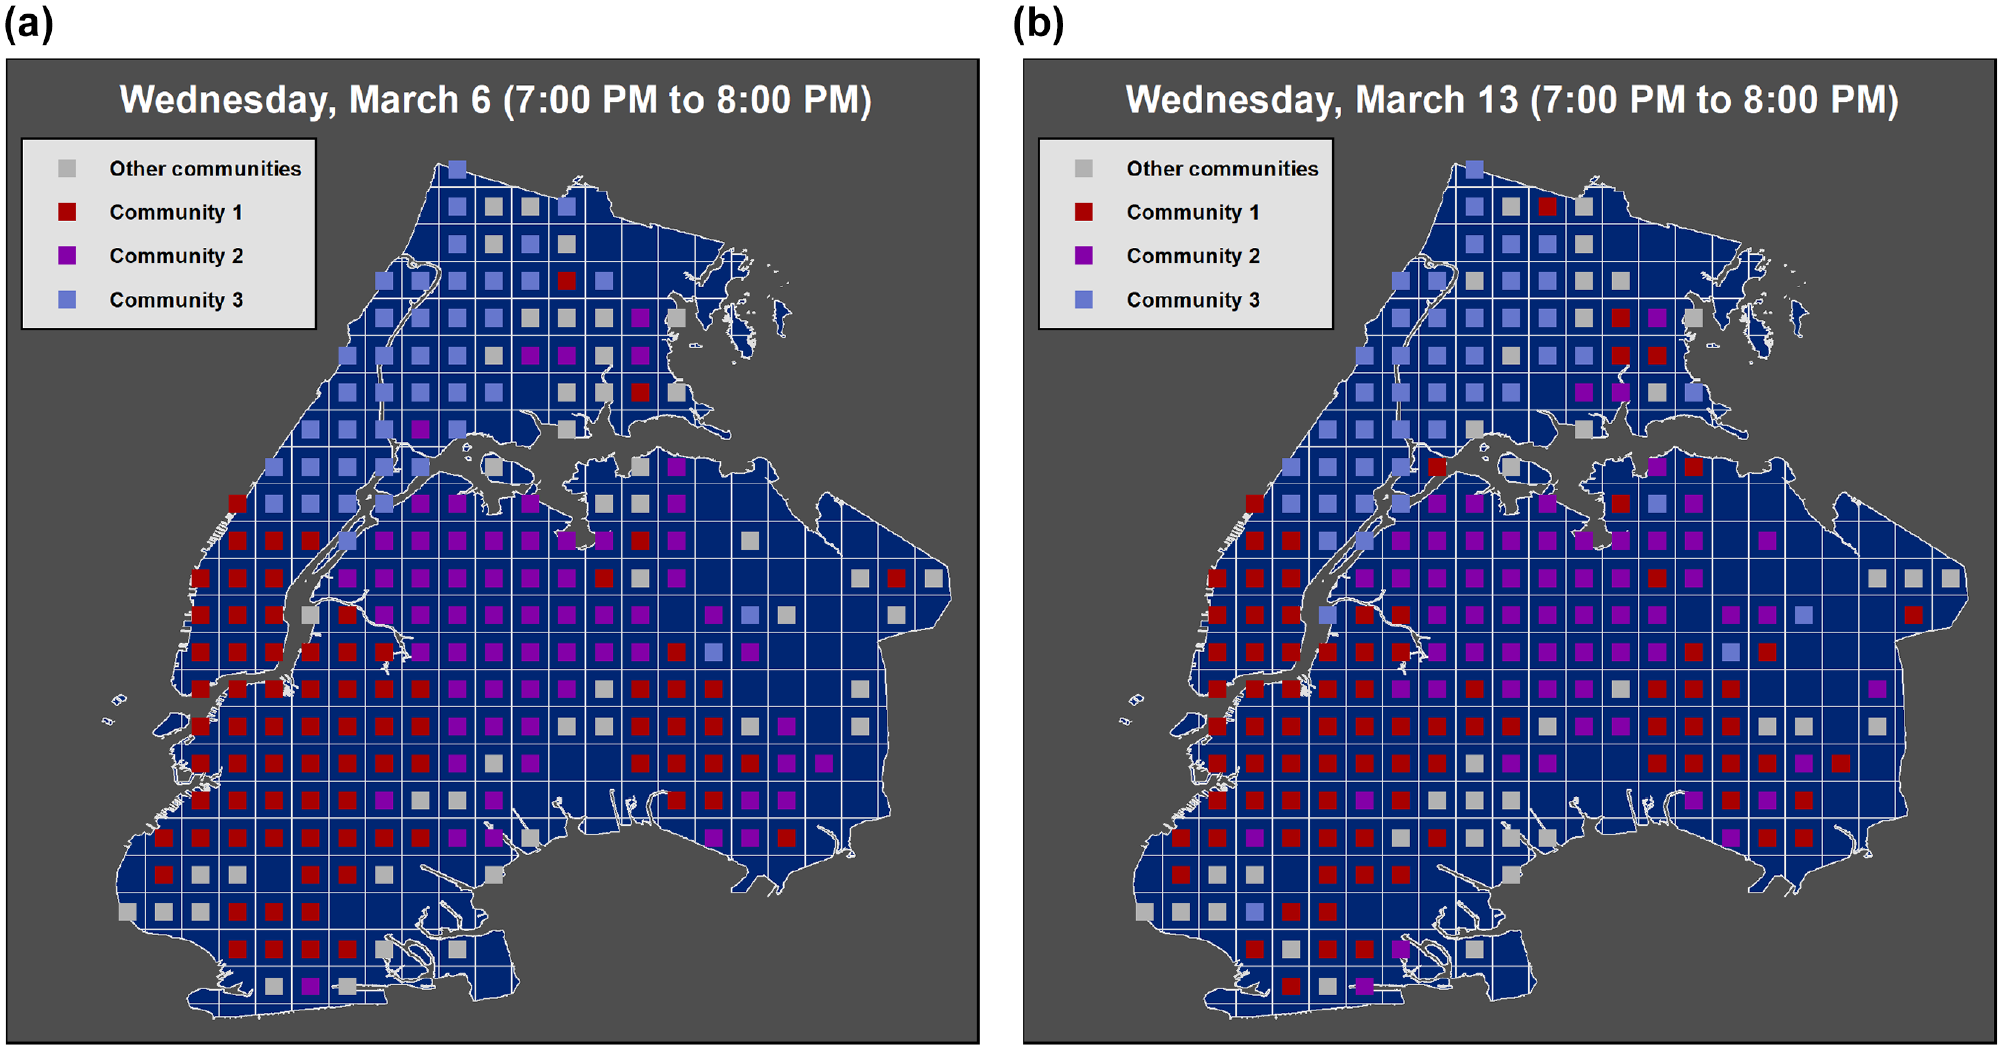
Communities on Wednesday evening 7:00–8:00 a.m: (a) March 6 and (b) March 13.
Visualization and Results
In this section, we report the accuracy and some examples of the output of the proposed method. We present an example of flow between an origin and a destination (Figure 5) and examples of pick-ups and drop-offs prediction in some random cells (Figures 7 and 8). We also illustrate an example of predicted flows in a map and show how predicted flows can potentially help drivers in making operational decisions. This is followed by an accuracy assessment of the proposed model and a comparison of the results with some baseline and state-of-the-art methods for flow prediction. Figure 5 shows predicted, observed, and seasonal historical average (SH-A) flows between two pairs of cells during a whole week. The predicted flows are the flows in the next time interval (i.e., next hour) estimated by the proposed method. S-HA estimates the flow in the next time interval by averaging the flows in similar time intervals in the last n seasons (in this experiment n = 3). Observed flows are simply the ground truth information we use to evaluate the predictions made by the proposed method. As can be seen from both Figure 5a and b , predictions using the proposed method follow the observations more accurately compared with S-HA. Especially in Figure 5a, where the flow values are larger, the predicted and observed values stay close during the week. However, Figure 4b presents the flow between a less busy corridor (Mill Pond Park to Harlem) which shows noisy fluctuations. This can be explained by two interpretations. First, the flow values between these areas are small (usually less than 5) and random which causes accurate predictions to be challenging and even sometimes impossible. Second, the model is mostly trained based on the larger values, and smaller values are partially ignored so that the objective function can be optimized. We can specifically see the latter idea by looking at the flow values during the weekends (Figure 5b day 31) where the predictions deviate from the observations and the historical average presents better predictions. Nevertheless, our accuracy assessment for the proposed method shows a significant improvement from the S-HA (Tables 1 and 2).
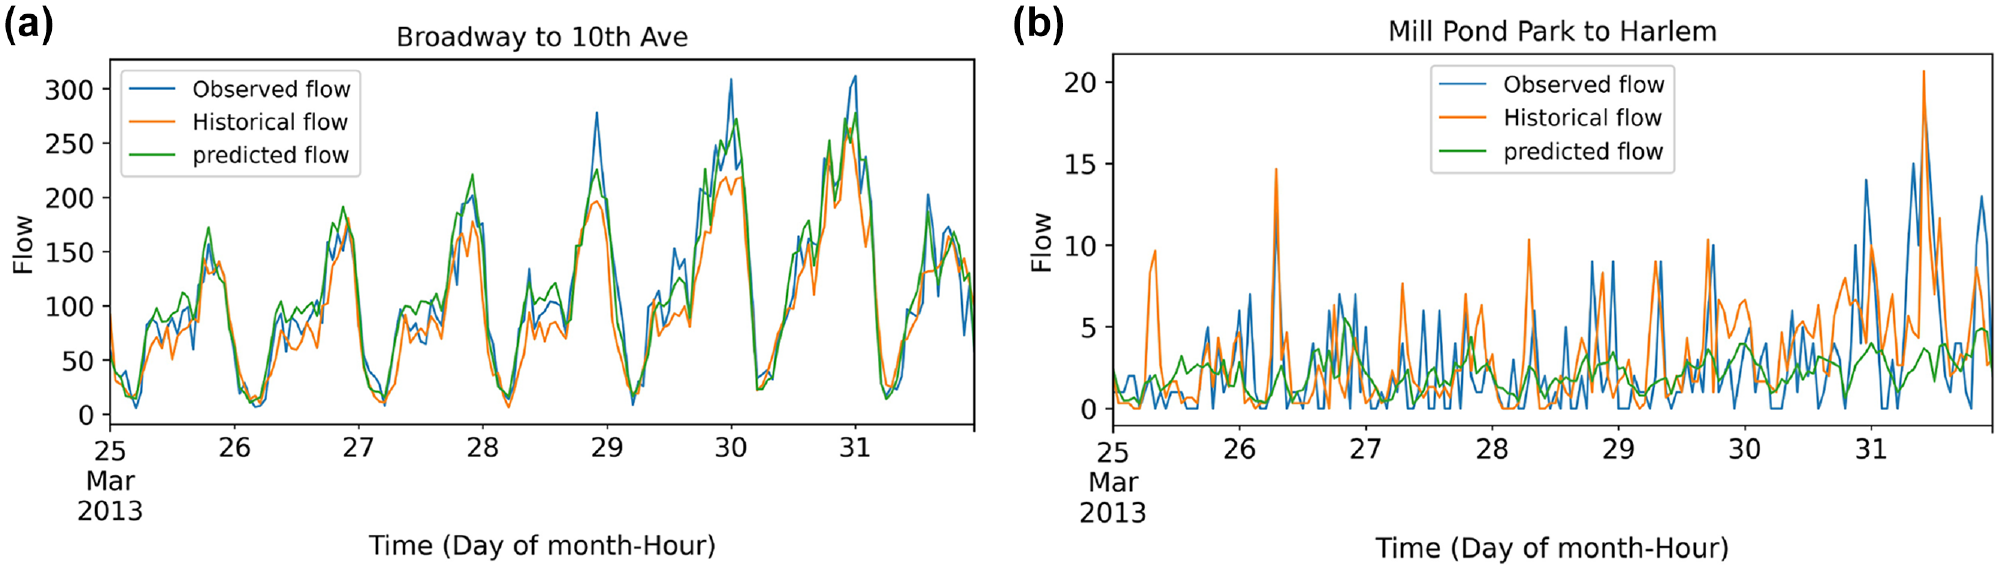
Predicted, observed, and seasonal historical average hourly flow between pairs of cells: (a) Broadway to 10th Avenue and (b) Mill Pond Park to Harlem.
Mean Absolute Error (MAE) and Root Mean Squared Error (RMSE) of Predictions for 7:00–8:00 a.m.
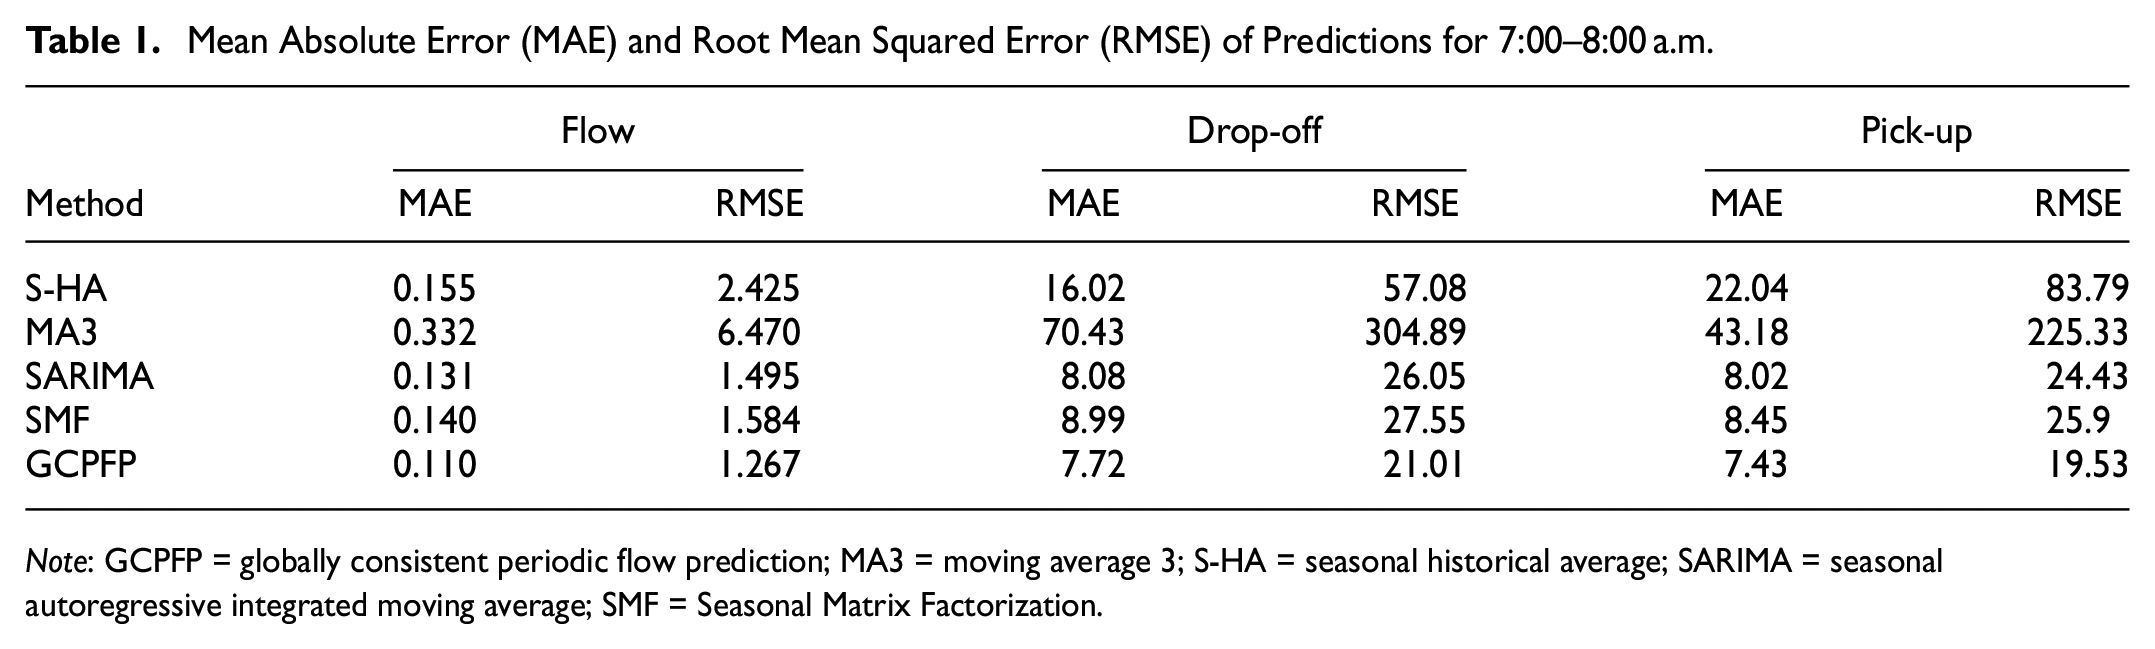
Note: GCPFP = globally consistent periodic flow prediction; MA3 = moving average 3; S-HA = seasonal historical average; SARIMA = seasonal autoregressive integrated moving average; SMF = Seasonal Matrix Factorization.
Mean Absolute Error (MAE) and Root Mean Squared Error (RMSE) of Predictions for 7:00–8:00 p.m.
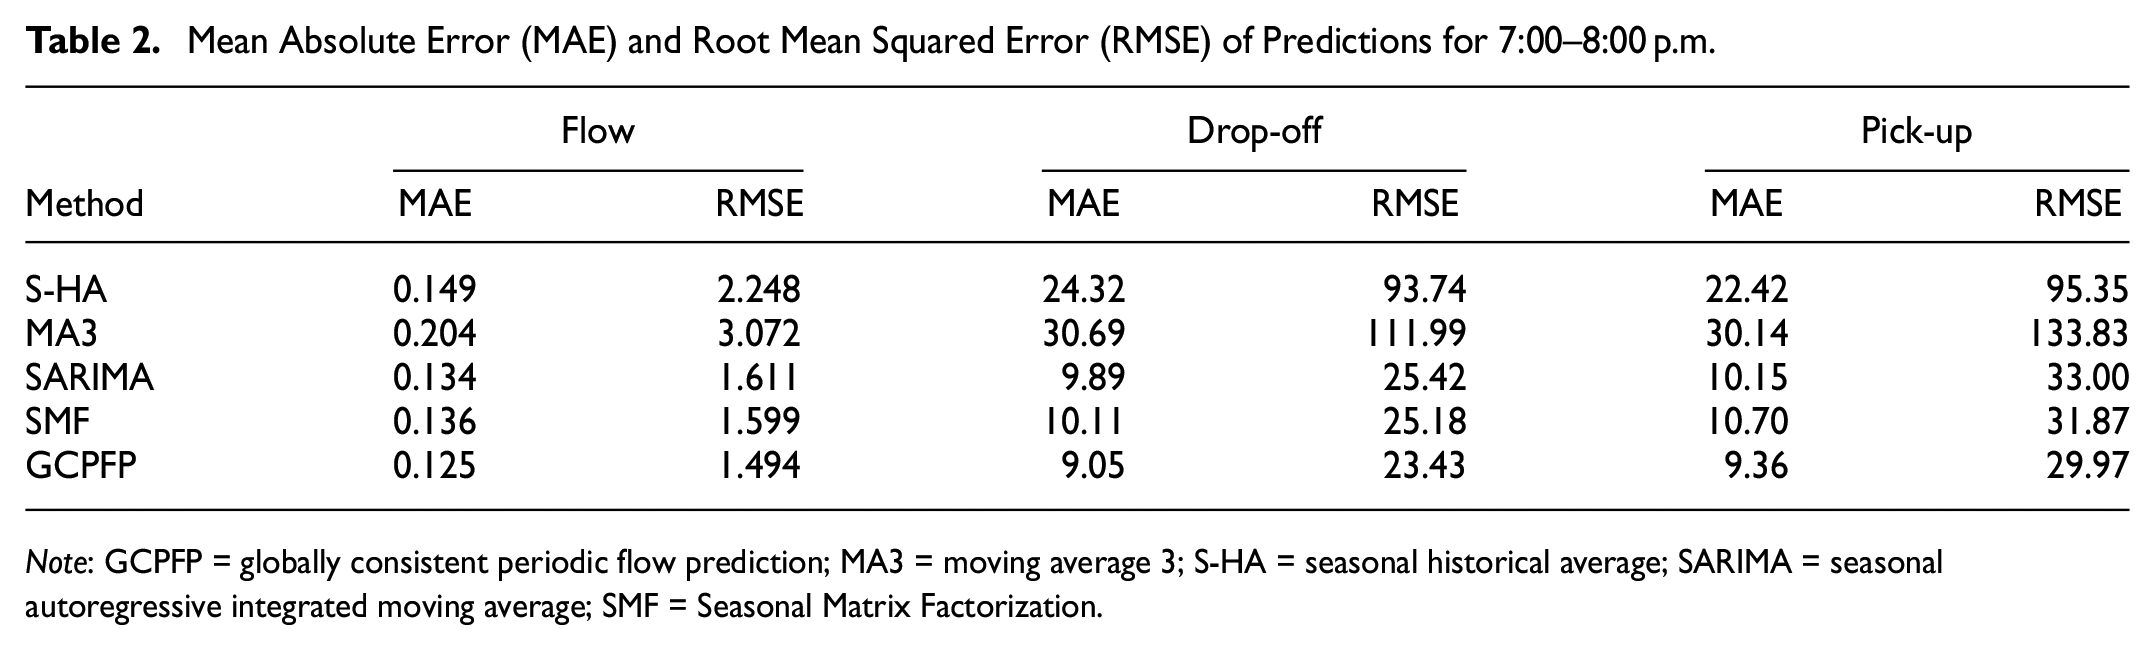
Note: GCPFP = globally consistent periodic flow prediction; MA3 = moving average 3; S-HA = seasonal historical average; SARIMA = seasonal autoregressive integrated moving average; SMF = Seasonal Matrix Factorization.
Figure 6 shows the most significant flows from Broadway to other cells. The labels and width of the arrows indicate the magnitude of the flows. As can be seen from the observed (Figure 6b) and predicted (Figure 6c) arrows, the model has successfully predicted the cells to which the 10 most significant flows are ended. The color indicates the hotness of the destination from the taxi driver’s point of view, where red arrows are pointing to the areas with higher pick-ups than drop-offs (i.e., higher demand with reference to supply or hot areas), and blue arrows are pointed to the areas with higher drop-offs compared with taxi pick-ups (i.e., higher supply with reference to demand). The red arrows indicate the hot areas from a taxi driver’s point of view, as drivers are interested in less competitive areas where there is a relatively higher demand for taxi cabs. Therefore, by driving a passenger who travels to a hot area, the taxi driver has a higher chance of finding new passengers after dropping off their current passengers. We believe that this combination of visualizing flow and hotness can provide taxi drivers with the information that is required to pick the right passengers. Especially these days, when e-hailing and internet taxis have given the choice to drivers to select their passengers based on their destination, informing taxi drivers of the expected destinations and their hotness enables them to make better decisions.
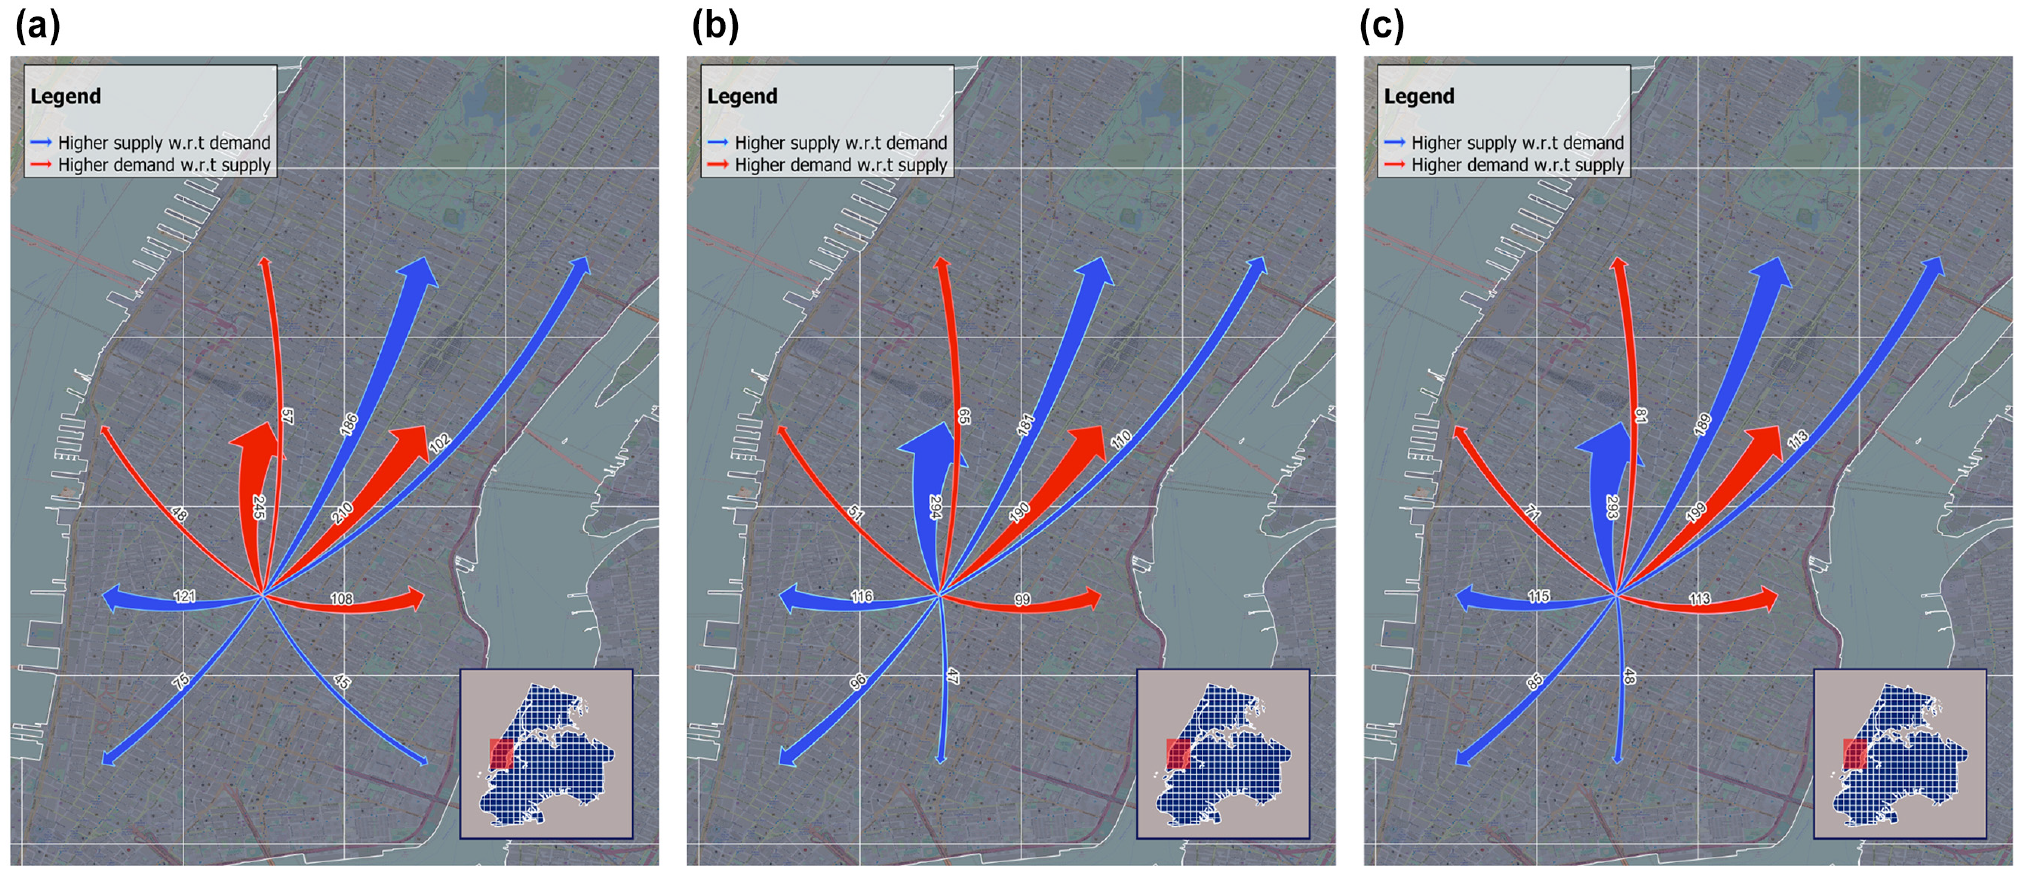
The width of the arrows represents the magnitude of the flow, and the color indicates the hotness of the destination from the taxi driver's point of view. (c) shows that the proposed model has predicted the most significant (top 10 in this example) flows and their hotness correctly. Estimation based on historical average (a) deviates from the observations (b).
Figures 7 and 8 show the hourly predicted, observed, and SH-A drop-offs and pick-ups during the week in two cells: Broadway and South Brooklyn. As a reminder, S-HA estimates the pick-ups and drop-offs in the next time interval by averaging the values in similar time intervals in the last n seasons (in this experiment n = 3). Similar to predicted flows, the plots indicate that pick-up/drop-offs predictions are accurate both in regions with heavy and light traffic on weekdays and weekends.
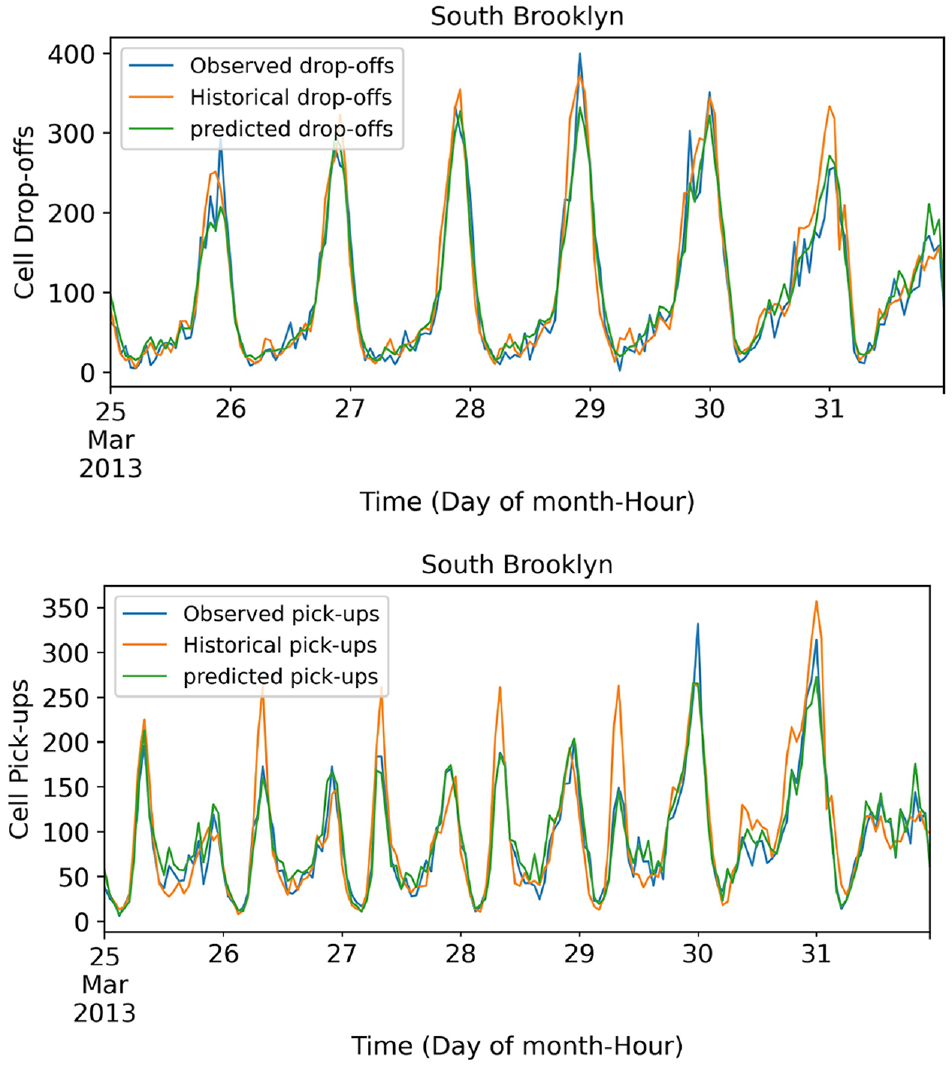
Hourly drop-offs (top) and pick-ups (bottom) during the week in South Brooklyn.
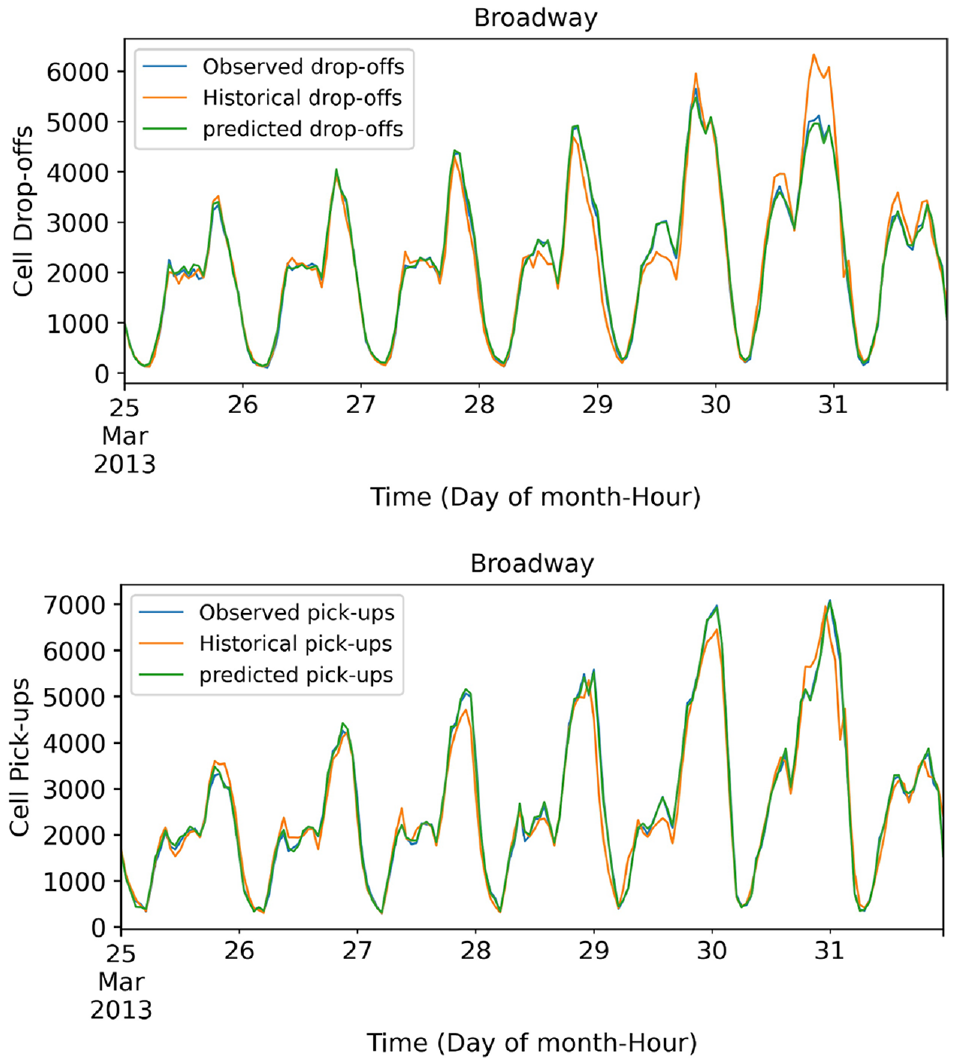
Hourly drop-offs (top) and pick-ups (bottom) during the week in Broadway.
Finally, we compared the results from the proposed method (GCPFP) with some baseline and state-of-the-art techniques. We have used the following methods and settings:
The improved root mean squared error (RMSE) and mean absolute error (MAE) resulting from the GCPFP can be observed in Tables 1 and 2 when compared with the baseline methods. S-HA and MA3 show the lowest level of accuracy in their predictions among the baseline methods, which can be associated with their over-simplified modeling assumptions. The SARIMA model, on the other hand, can produce more accurate predictions (compared with S-HA and MA3) by considering auto-regressive terms and modeling periodicity in the data. The improvement of the proposed model over SMF can be associated with the incorporation of global consistency in the model. This can also be seen in Figure 9 which presents the MAE of the predicted drop-offs using different
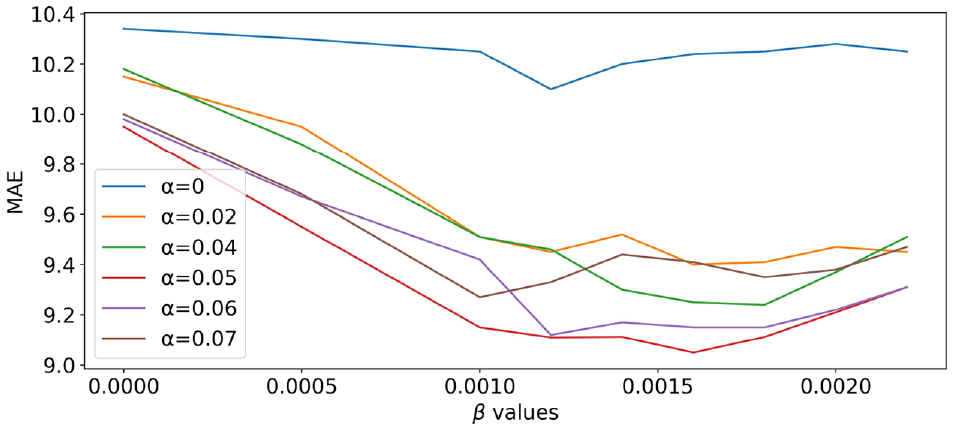
Mean absolute error (MAE) of predicted drop-offs 7:00–8:00 p.m. using different
Conclusions
In this paper, we proposed and tested a matrix factorization model for periodic flow prediction in taxi systems. We analyzed the taxi trips data set and presented examples of the periodic variations in the total number of trips and communities which was the foundation of basic assumptions in the proposed model. By retaining the community belongingness in the predicted flow matrix, we preserved the global consistency in the model. Comparing the results from the proposed method with some baselines shows promising improvements that can be generally associated with the successful design of the model. We also employed the proposed model to produce flow maps that can assist taxi drivers in making operational decisions.
As the proposed model provides prediction using historical data, future work can study the feasibility of using the model for traffic anomaly detection. Employing or extending the proposed matrix factorization model for other applications, including other mobility systems and recommender systems, and also exploring the robustness of the model by having different spatial and temporal granularity, are also potential future works.
Footnotes
Author Contributions
The authors confirm contribution to the paper as follows: study conception and design: R. Forouzandeh Jonaghani, M. Wachowicz, T. Hanson; data collection: R. Forouzandeh Jonaghani; analysis and interpretation of results: R. Forouzandeh Jonaghani, M. Wachowicz, T. Hanson; draft manuscript preparation: R. Forouzandeh Jonaghani. All authors reviewed the results and approved the final version of the manuscript.
Declaration of Conflicting Interests
The author(s) declared no potential conflicts of interest with respect to the research, authorship, and/or publication of this article.
Funding
The author(s) disclosed receipt of the following financial support for the research, authorship, and/or publication of this article: This work was supported by the NSERC/Cisco Industrial Research Chair, Grant IRCPJ 488403-1.