
Abstract
Electric vehicles (EVs) promise a sustainable solution to mitigating negative emission externalities of transportation systems caused by fossil-fueled conventional vehicles (CVs). While recent developments in battery technology and charging infrastructure can help evolve the niche market of EVs into the mass market, EVs are yet to be widely adopted by the public. This calls for an in-depth understanding of public adoption behavior of EVs as one dimension of vehicle decision making, which itself may be intertwined with other vehicle decision-making dimensions, especially vehicle transaction. This study presents an integrated choice model with latent variables (ICLV) to investigate households’—as a decision-making unit—decisions on vehicle transaction type (i.e., no transaction, sell, add, and trade) and vehicle fuel type (i.e., CVs and all EV types, including hybrid EV, plug-in hybrid EV, and battery EV) choice. To analyze the ICLV model empirically, one of the first revealed preferences national vehicle survey involving CVs and all EV types was conducted, which retrospectively inquired about 1,691 American households’ dynamics of vehicle decision making and demographic attributes over a 10-year period as well as their attitudes/preferences. The model estimation results highlight that EV adoption and vehicle transaction choice is influenced mainly by (1) the dynamics of household demographic attributes and (2) four latent constructs explaining attentiveness to vehicle attributes, social influence, environmental consciousness, and technology savviness. Notably, EV adoption promotion policies are found to be likely most effective on socially influenced individuals, who tend to consider advertisement and social trend more when making vehicle decisions.
Keywords
Car-oriented societies face various negative externalities such as traffic congestion, transportation infrastructure inequity, noise pollution, and air pollution ( 1 – 3 ). Particularly in the United States, light-duty vehicles contribute to nearly 15% of greenhouse gas emissions ( 4 ) and an annual congestion cost of $101 billion for delay time and wasted fuel estimated in almost 500 urban areas ( 5 ). A sustainable solution to diminishing these negative externalities can be the substitution of conventional gasoline and diesel vehicles (CVs) with electric vehicles (EVs), which include hybrid EV (HEV), plug-in HEV (PHEV), and battery EV (BEV). The major barriers to the large-scale adoption of EV, especially plug-in EV (PEV) that collectively refers to both PHEV and BEV, are found to be the limited electric driving range, long charging time, and the poor provision of charging infrastructure ( 6 , 7 ). These barriers are rapidly overcome by technological enhancements, such as in battery technology ( 8 ), leading to the recent introduction of affordable long range (200+ miles) BEV ( 9 ), as well as policy decisions on charging infrastructure deployment ( 9 ).
Despite its growing uptake ( 9 , 10 ), the low market share of EV in the United States and globally may, however, postpone achieving the sustainability goal through large-scale EV adoption. This calls for research on EV adoption behavior at the disaggregate level (e.g., the household as the unit of decision making), which is also suggested by a relevant review study ( 11 ). One approach to such disaggregate-level models looks at the problem through the lens of psychology, which indeed relies merely on unobserved (latent) subjective factors—such as attitudes, perceptions, emotions, and symbolism—to assess intention to adopt and use EV (see Rezvani et al. [ 12 ] for a review). The second approach is based on economics through estimating discrete choice models to investigate EV adoption behavior in a comparative setting with CVs, which provides a suitable framework to evaluate policy effectiveness ( 11 ). The latter approach is further capable of complementing the former by incorporating the latent subjective attitudes and preferences into the choice model, thus explicitly accounting for taste heterogeneity through the underlying observed indicators. This model is called “integrated choice with latent variables” (ICLV) and was originally introduced by Ben-Akiva and Boccara ( 13 ) and Ben-Akiva et al. ( 14 ). The other choice models implicitly treating taste heterogeneity are mixed logit, which allows parameters to have a continuous random distribution over the sample ( 15 , 16 ), and latent class, which approximates the underlying continuous random distribution of the parameters with a discrete one ( 17 ). The application examples of the former and latter in the context of EV adoption behavior, respectively, are Jia and Chen ( 18 ) and Qian et al. ( 19 ), and Khan et al. ( 20 ).
In the context of EV adoption behavior, the studies implementing the ICLV model mostly use stated preferences (SP) datasets to explore how latent attitudes, perceptions, and preferences shape an individual’s interest in various EV types. Ghasri et al. ( 21 ) considered three latent constructs capturing perception of BEV design with respect to performance, reliability, and aesthetic, environmental impacts, and safety. The findings highlight that a higher perception of BEV design leads to a higher probability of BEV adoption. Moreover, more attention to environmental aspects of BEV makes individuals more sensitive to electric driving range. Also, people who believe in greater safety of EV are more inclined toward large vehicle body types. Liao et al. ( 22 ) defined three latent constructs explaining pro-convenience, pro-ownership, and pro-EV leasing. The results highlight that those who are interested in BEV prefer vehicle leasing the most and battery leasing the least. In contrast, purchasing the vehicle is favorable to people interested in CV and PHEV.
Bansal et al. ( 23 ) defined three latent constructs characterizing attitudes toward climate doubt (i.e., not believing in the climate impacts of EV and human behavior), EV tech belief (i.e., trusting EV technology), and early adoption (i.e., adopting EV at low market penetration). Estimated on a SP dataset collected in India, the study findings reveal that the climate doubters are negatively affected by BEV price being higher than CV price. Moreover, the early adopters are influenced by operating cost and driving range of BEV, although they are willing to pay more for BEV than CV. The results also reveal that the inclination of EV tech believers toward BEV is affected by electric driving range and BEV price relative to those of CVs. In a recent research, Li et al. ( 24 ) defined three latent psychological factors on environmental awareness, perceived environmental benefits, and subjective norms. They found that interest in EV adoption decision is influenced by market-oriented incentives—particularly policies on personal carbon trading and tradable driving credit—through economic motivations rather than latent factors. Nazari et al. ( 25 ) defined a latent construct on green travel pattern. Their empirical study using a revealed preferences (RP) dataset revealed the elasticity of only those who are attracted to PHEV with respect to the latent green travel pattern.
The studies reviewed above verify the explanatory power of the ICLV model in the context of EV adoption behavior, which is beyond the typical choice alternative attributes and demographic factors, through incorporating the decision makers’ latent subjective attitudes and preferences into the choice process (see Singh et al. [ 7 ] for a review study on factors affecting EV adoption behavior). Thus, the present study adopts the ICLV method to explore EV adoption behavior by investigating vehicle fuel type choice with a comprehensive choice set, including CV, HEV, PHEV, and BEV. Vehicle fuel type choice is one dimension of vehicle decision making that might be made simultaneously with other dimensions of vehicle decision making, especially vehicle transaction choice (for a review study on vehicle decision modeling, see Anowar et al. [ 26 ]). For instance, a household’s decision on EV adoption may be affected by whether an EV will be traded for an existing household vehicle or added to the household vehicle inventory. The answer might also have implications on the vehicle ownership level, in addition to the consequent short-term travel/activity pattern and long-term residential location choice ( 27 , 28 ). The scarcity of the relevant literature, according to the summary of the recent studies using discrete choice models presented in Table 1, confirms the need for research on the joint decisions on vehicle fuel and transaction type.
Recent Studies (2017–2022) Applying Discrete Choice Models to Investigate EV Adoption Behavior
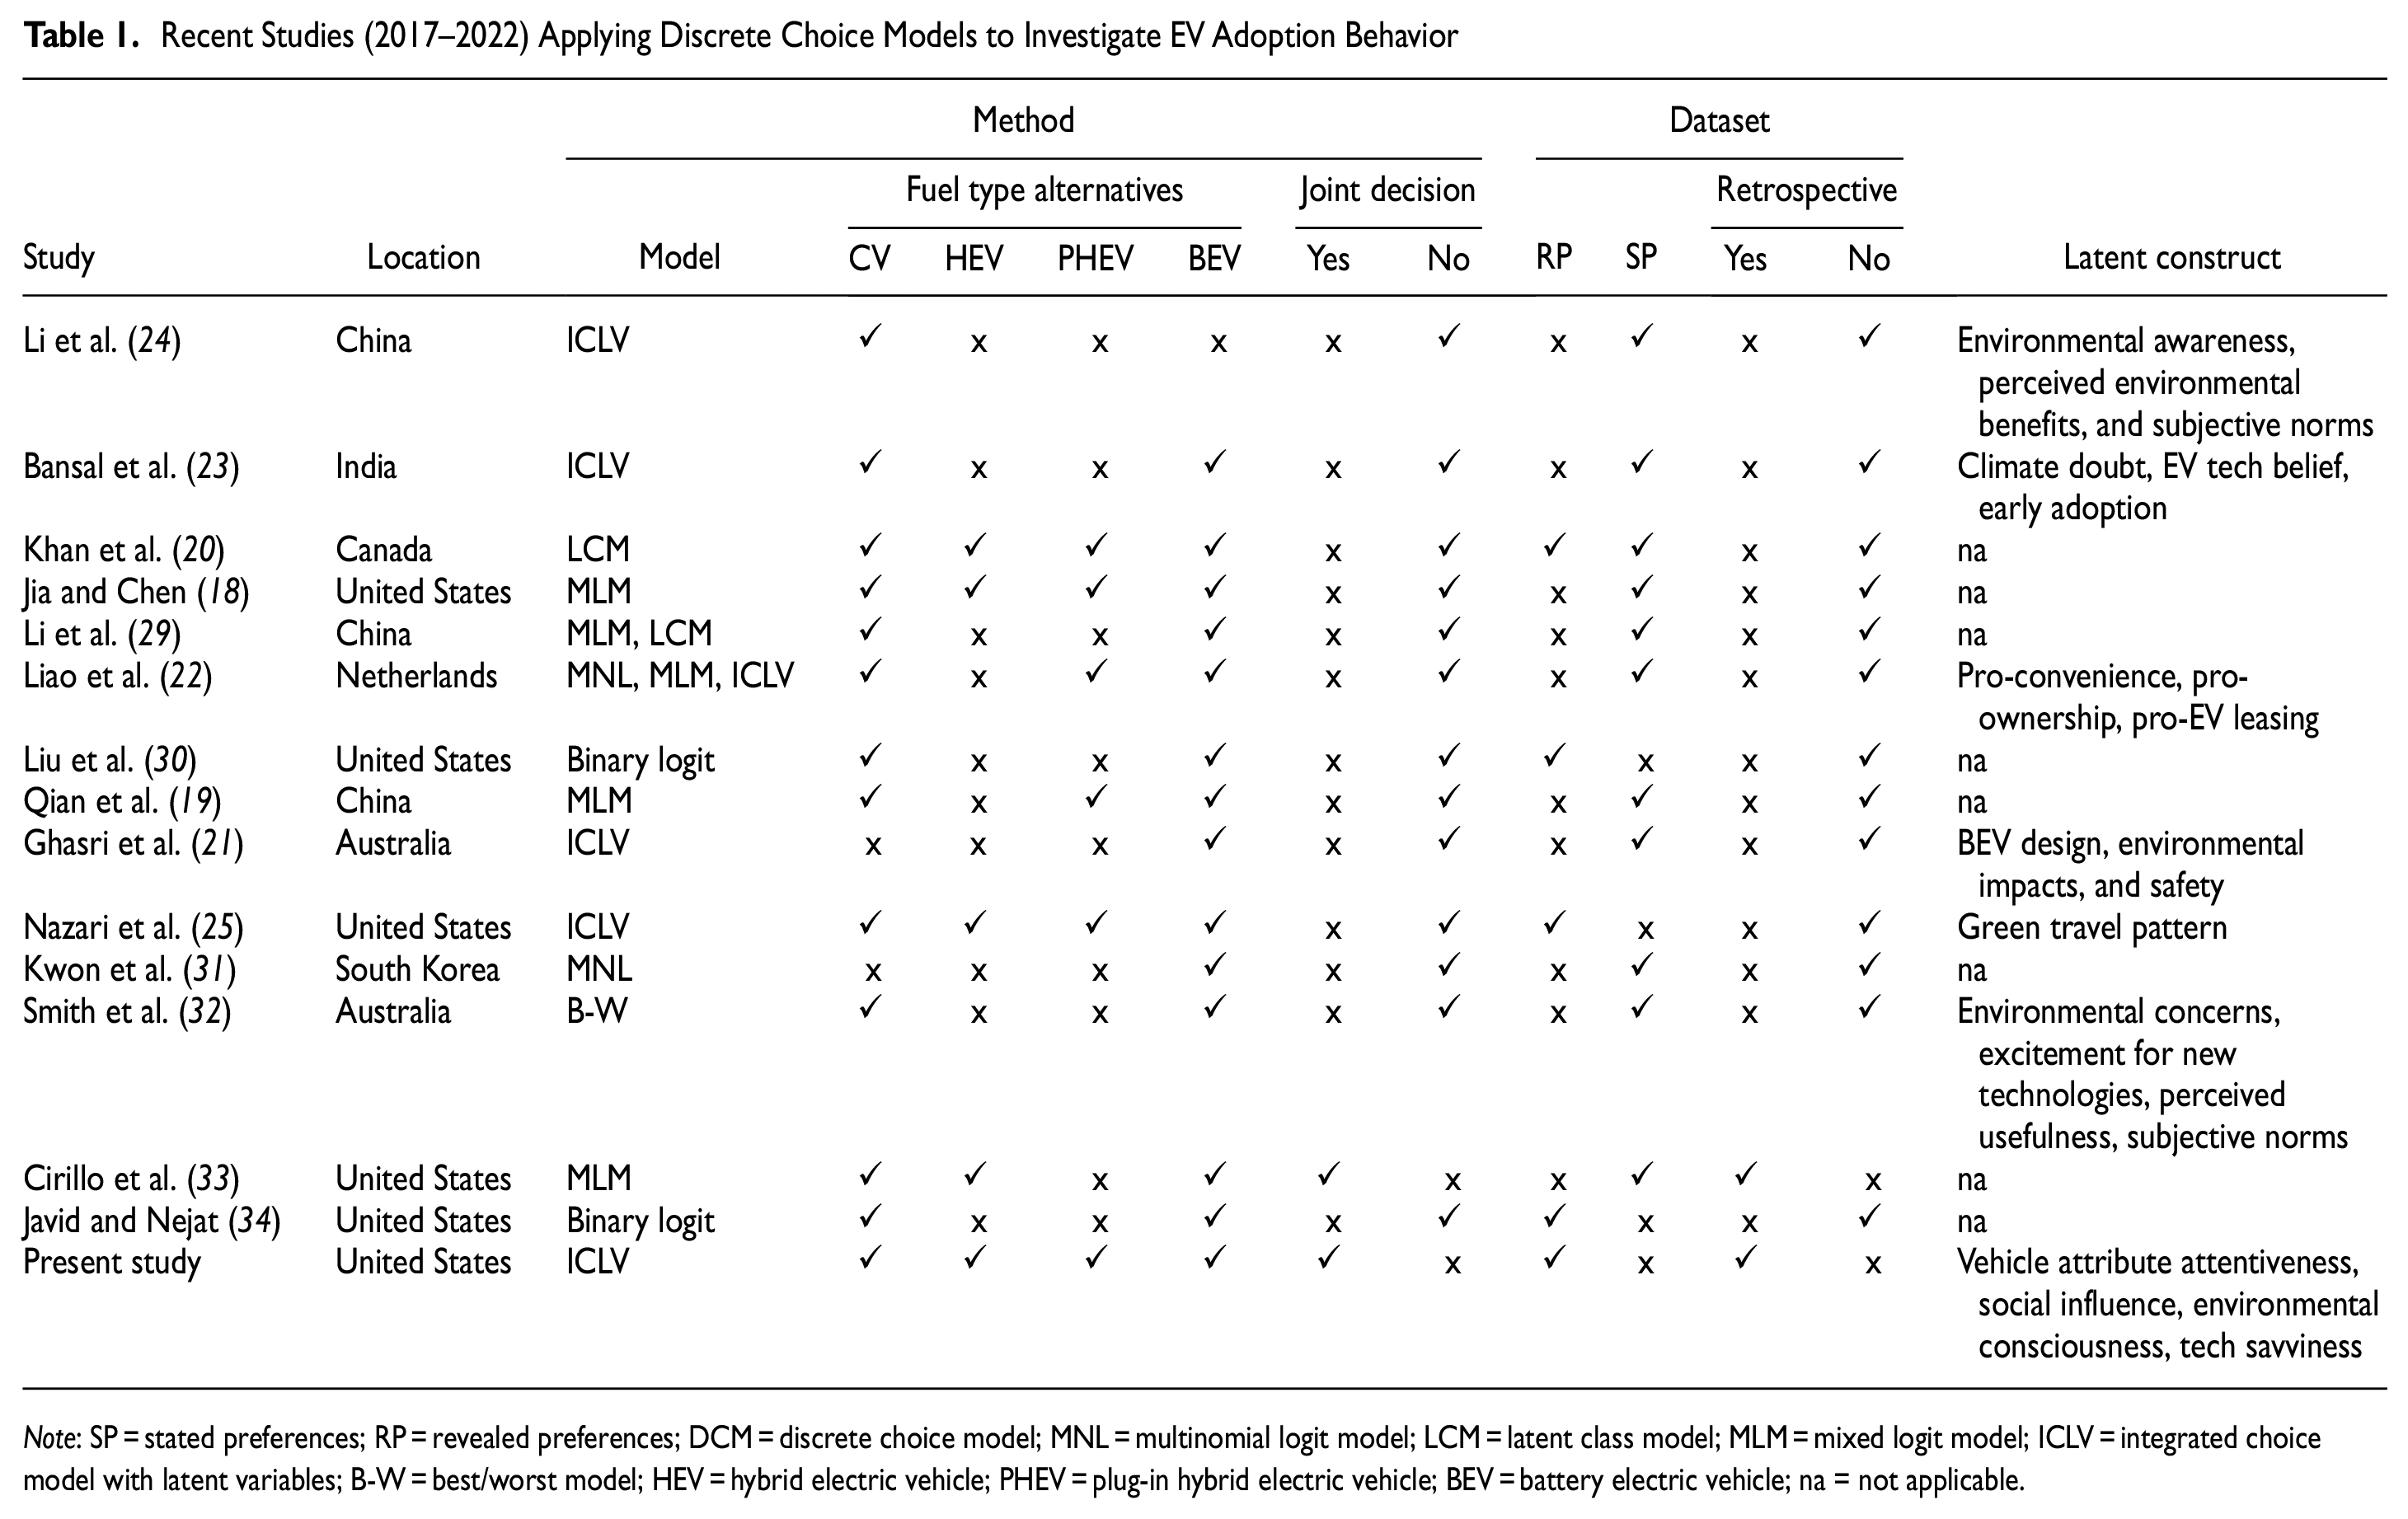
Note: SP = stated preferences; RP = revealed preferences; DCM = discrete choice model; MNL = multinomial logit model; LCM = latent class model; MLM = mixed logit model; ICLV = integrated choice model with latent variables; B-W = best/worst model; HEV = hybrid electric vehicle; PHEV = plug-in hybrid electric vehicle; BEV = battery electric vehicle; na = not applicable.
In view of this, the first contribution of the present study is analyzing the simultaneous decision of households—as the unit of decision making—on vehicle fuel type (including CV and a comprehensive set of EV types comprising HEV, PHEV, and BEV) and vehicle transaction type (including no transaction, sell, add, and trade). To our knowledge and as evidenced in Table 1, the simultaneous modeling of vehicle fuel type and vehicle transaction type, while also considering comprehensive choice sets for fuel and transaction types, has not been addressed in prior work. This has important policy implications, since most existing EV adoption policies launched globally are generally based on a one-size-fits-all approach, which may not be equally effective to promote EV adoption across distinct vehicle fuel types, distinct vehicle transaction types leading to EV adoption, and distinct consumers with heterogenous socioeconomic and latent attitudinal profiles. To accomplish the first contribution, one integrated component of the proposed ICLV model is a structural equation model (SEM) with latent variables, which explains attitudes toward vehicle decision making and lifestyle preferences through the underlying measurement indicators as well as socioeconomic characteristics. The second integrated component is a vehicle fuel type and transaction choice model explaining the decision process as a function of the latent attitudes and preferences along with vehicle attributes and dynamics of demographic attributes.
The second contribution of this study relates to the dataset used for the empirical analysis. The majority of the relevant studies using discrete choice models for understanding EV adoption behavior resort to SP datasets, according to the summary of the literature presented in Table 1. However, estimating a choice model on a RP dataset yields more realistic results than a SP dataset by describing EV adoption behavior (e.g., Javid and Nejat [ 34 ], Nazari et al. [ 25 , 35 ], and Liu et al. [ 30 ]) rather than intention to adopt EV (e.g., Liao et al. [ 22 ], Nazari et al. [ 36 ], Li et al. [ 29 ], Jia and Chen [ 18 ], Bansal et al. [ 23 ], and Li et al. [ 24 ]). The latter group using SP datasets might cause hypothetical bias, referring to discrepancies between choices determined by the data and people’s actual choice in the market ( 37 ). Therefore, the present study empirically analyzed the ICLV model using a RP national vehicle survey conducted in 2018, which retrospectively inquired about 1,691 U.S. households’ vehicle decision making and dynamics of their demographic attributes over a 10-year period. To the best of the authors’ knowledge, the retrospective feature of the dataset is also rarely observed in the relevant literature (Table 1).
The paper is organized as follows. The next section presents the methodology of ICLV, followed by a section on the statistical analysis of the nationwide retrospective vehicle survey (RVS) collected in this study. The empirical model estimation results and policy implications are discussed next. The paper concludes with a summary of the research.
Methodology
Figure 1 shows the overarching modeling framework of the ICLV model, which includes two integrated components estimated simultaneously. The first component is a SEM with latent variables determining four latent constructs, which are built on the underlying observed indicators via the measurement equations (shown by the dashed arrows in the upper section of Figure 1), as well as the explanatory variables through the structural equations (shown by the solid arrows in the upper section of Figure 1). The second component is a multinomial logit (MNL) model, which explains the decision process on vehicle transaction and fuel type with the choice set of 10 alternatives (shown in the lower section of Figure 5). The rest of this section presents the formulation of the ICLV model (
13
,
14
). For brevity, the index
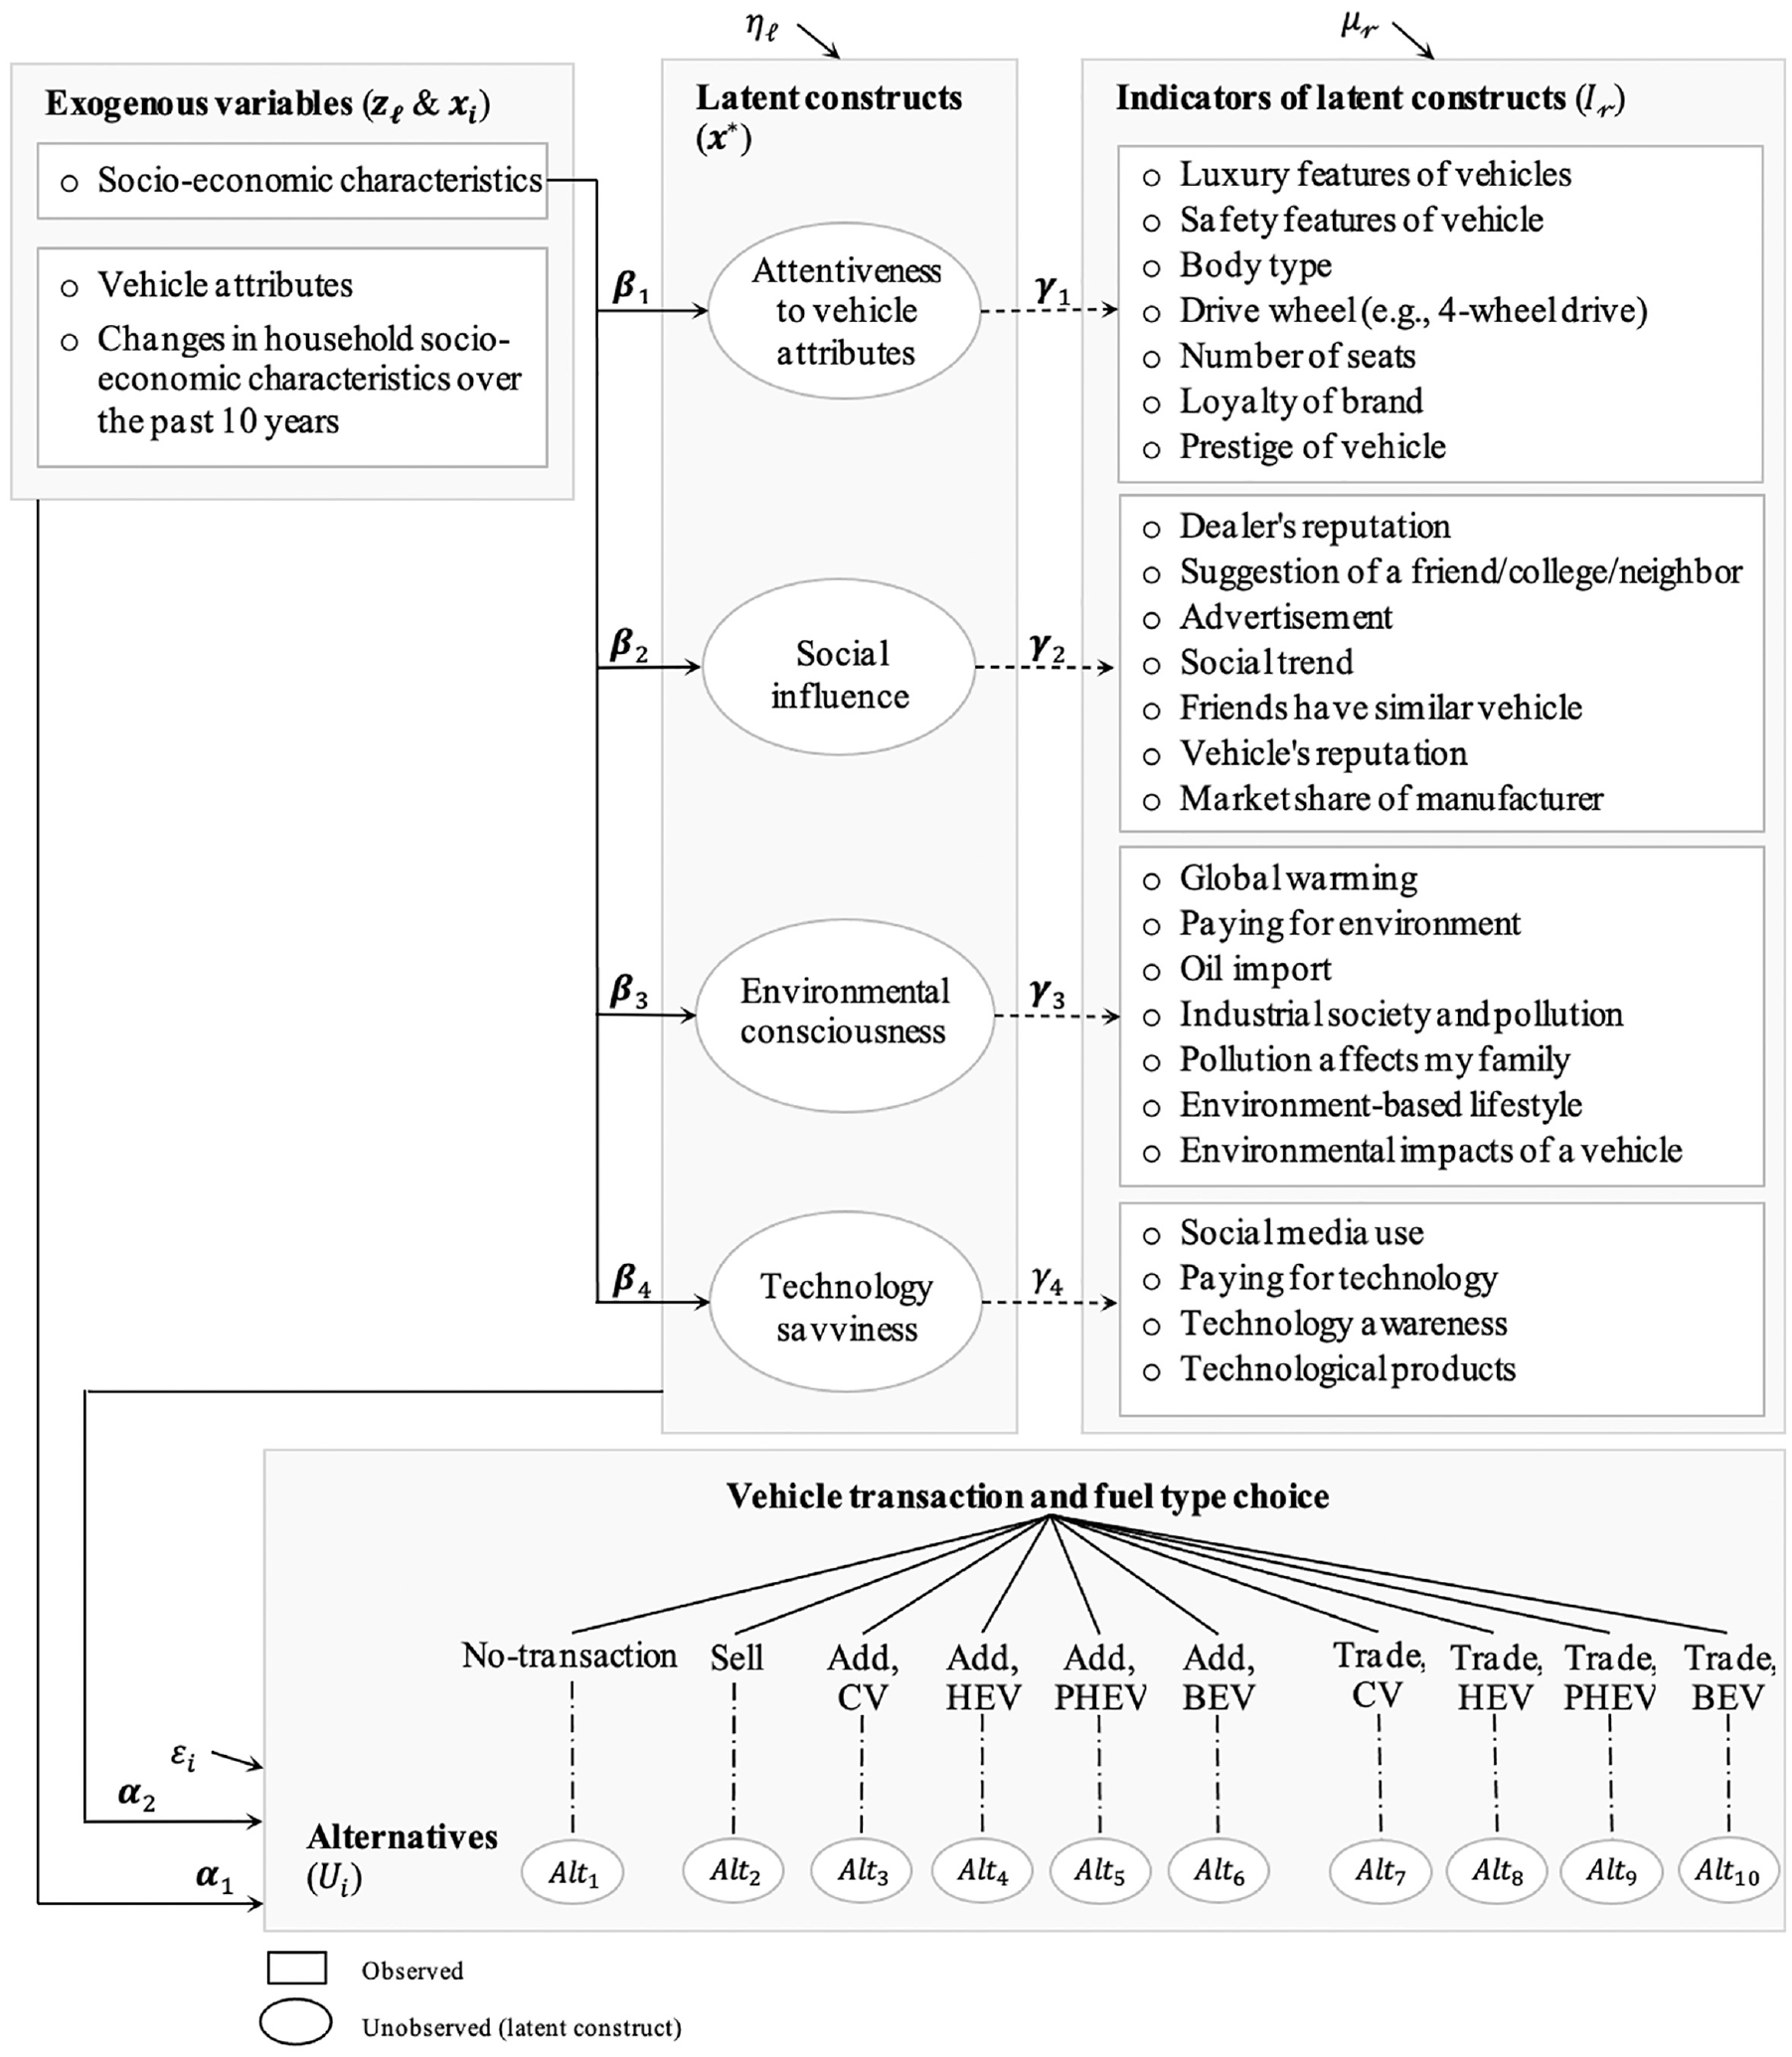
Framework of the integrated choice with latent variables (ICLV) model for vehicle fuel type and transaction decisions.
The structural equations connect the vector of the latent constructs


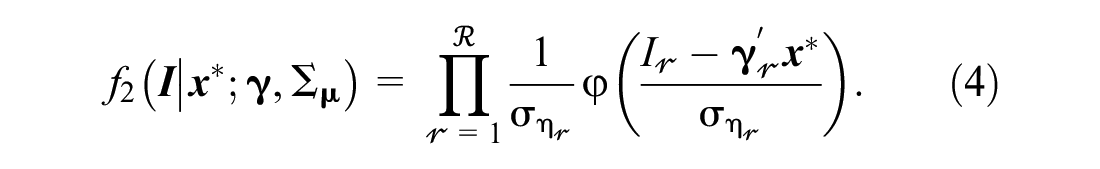
The measurement equations are formulated as Equation 3, where

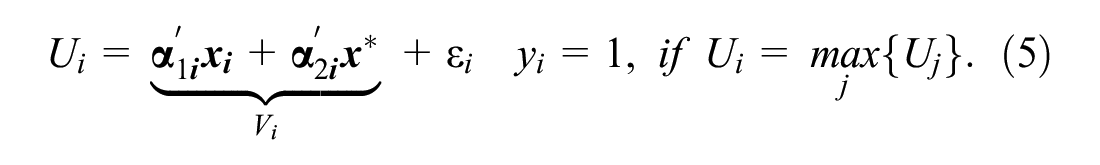
In the MNL model, the utility of alternative
The model estimation yields the

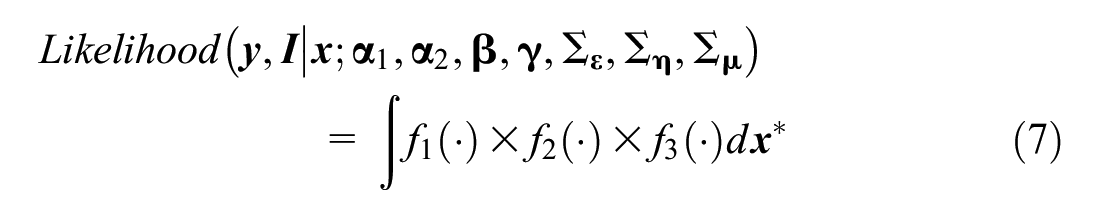
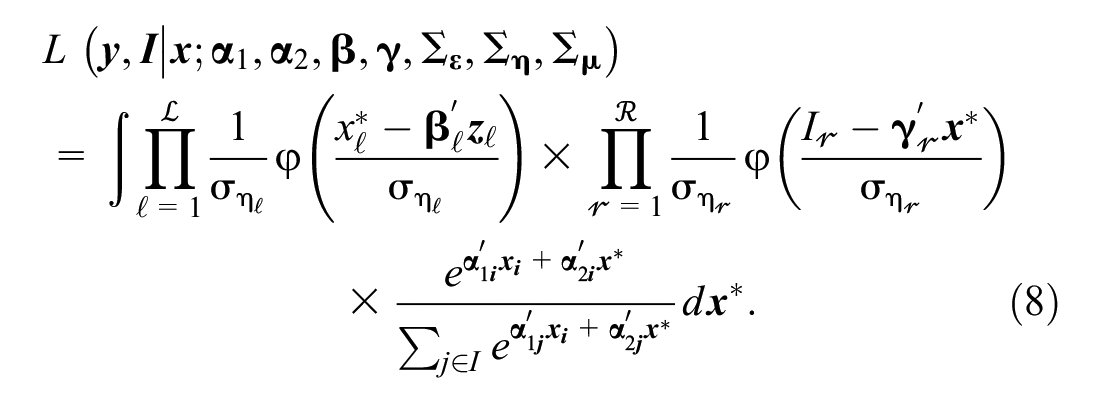
The ICLV likelihood Equation 8 is the joint probability of the MNL model and the structural and measurement equations, as in Equation 7:
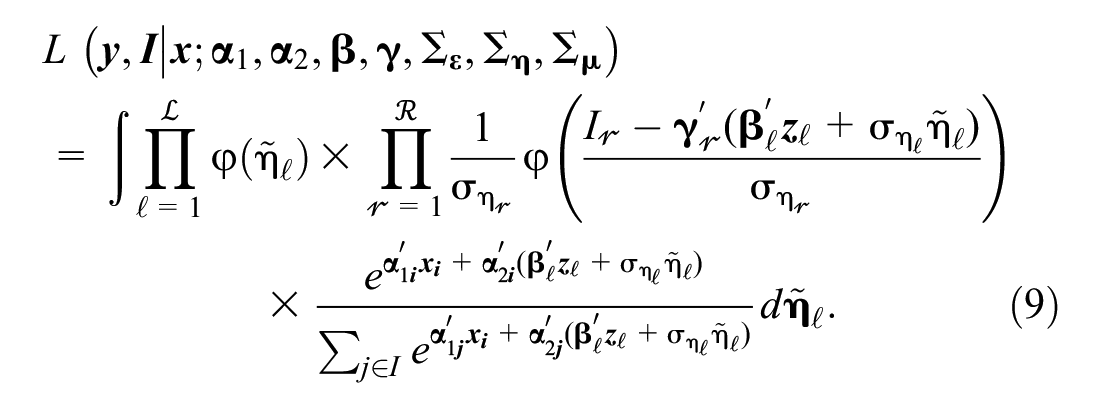
The assumption of standard normal distribution for the error term of the structural equation gives
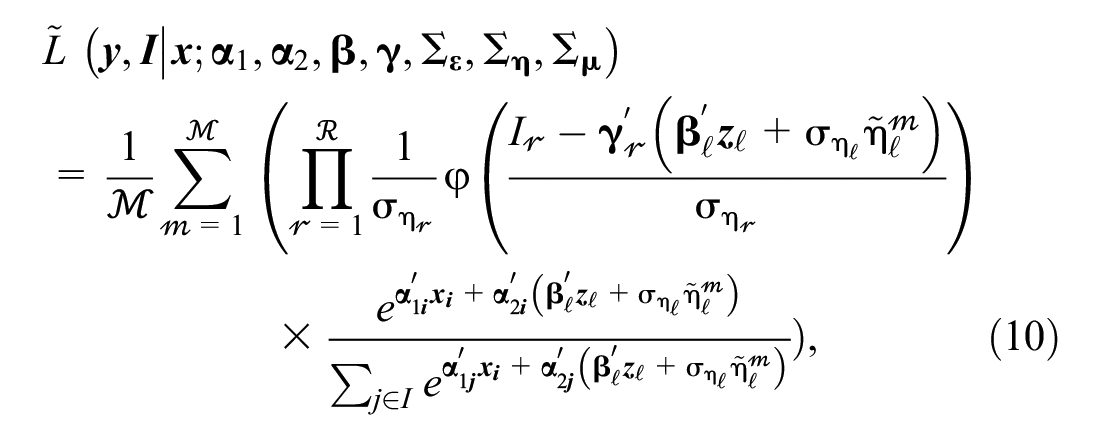
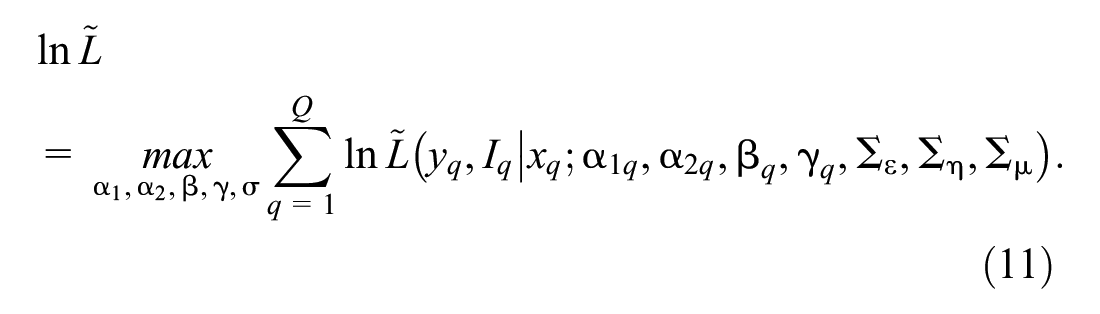
By applying simulated maximum likelihood, the likelihood Equation 9 converts to Equation 10:
where
Data: RVS
The RVS is an online survey collected on 1,691 Americans by Qualtrics from March to June 2018. Figure 2 visualizes the locations of the individual respondents, most of whom live in the states of California, Illinois, Texas, New York, and New Jersey. The respondents, who represent their households, are asked four types of questions, including their socioeconomic characteristics, attributes of their households’ existing vehicle(s), their attitudes and preferences, and dynamics of their households’ characteristics and vehicle decision making over the past 10 years from 2008 to 2017. This section presents a statistical analysis of the sample dataset.
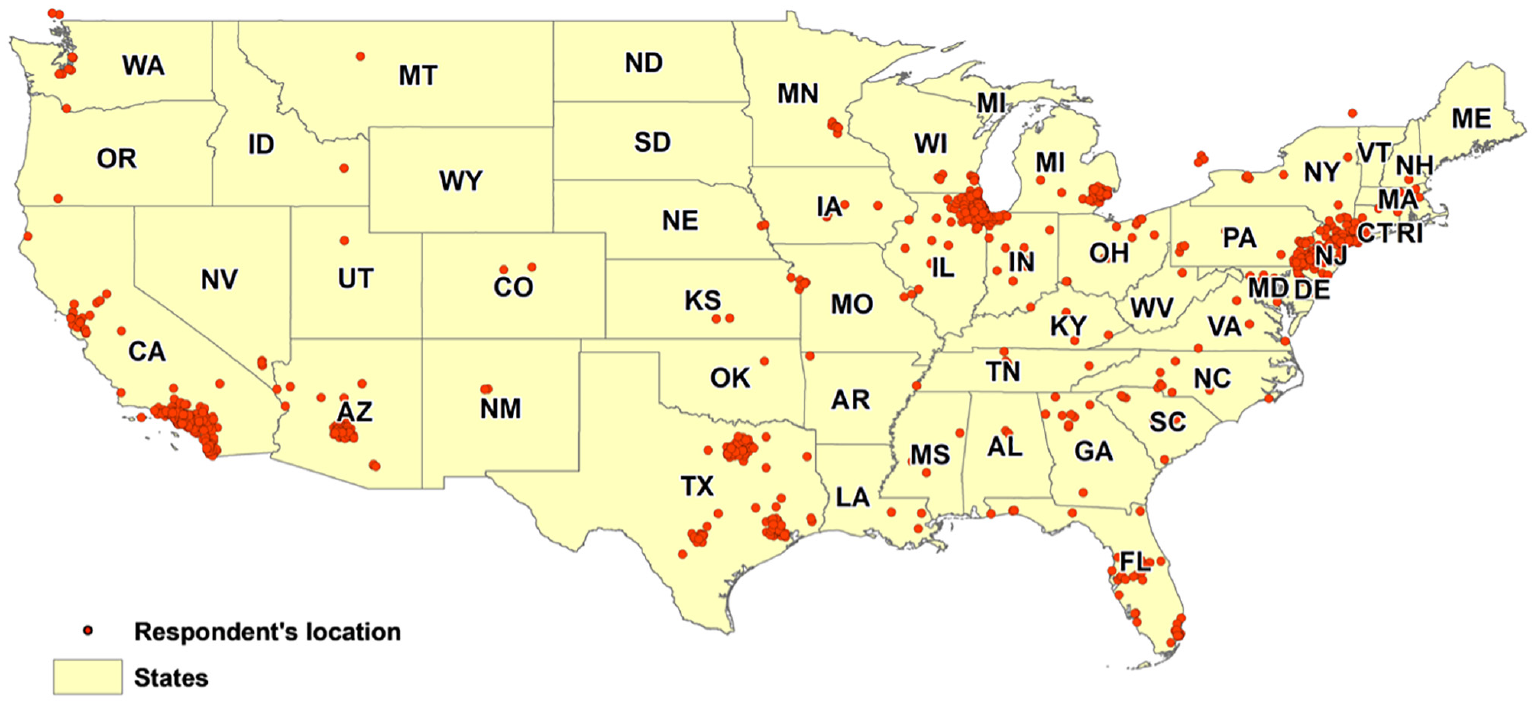
Locations of respondents to retrospective vehicle survey in the United States.
Socioeconomic Characteristics
A comparison between the statistical distribution of the dataset with the national values revealed that the dataset is twofold biased toward non-Hispanic two-member households living in urban areas without children, as well as individuals who are fully employed with higher education levels and who are middle-aged. To avoid biases associated with sampling and to have a robust database, the sample distribution was aligned with the population distribution at both household and individual levels (see Yeager et al. [ 38 ] for comparing weighted and unweighted estimates and Stuart [ 39 ] for a review on methods for matching sample and population). To do so, the method of ranking adjustment was applied to calculate the weight of each household and each individual using the American Community Survey 2013–2017 5-year data release ( 40 ). The weights were then used for model estimation.
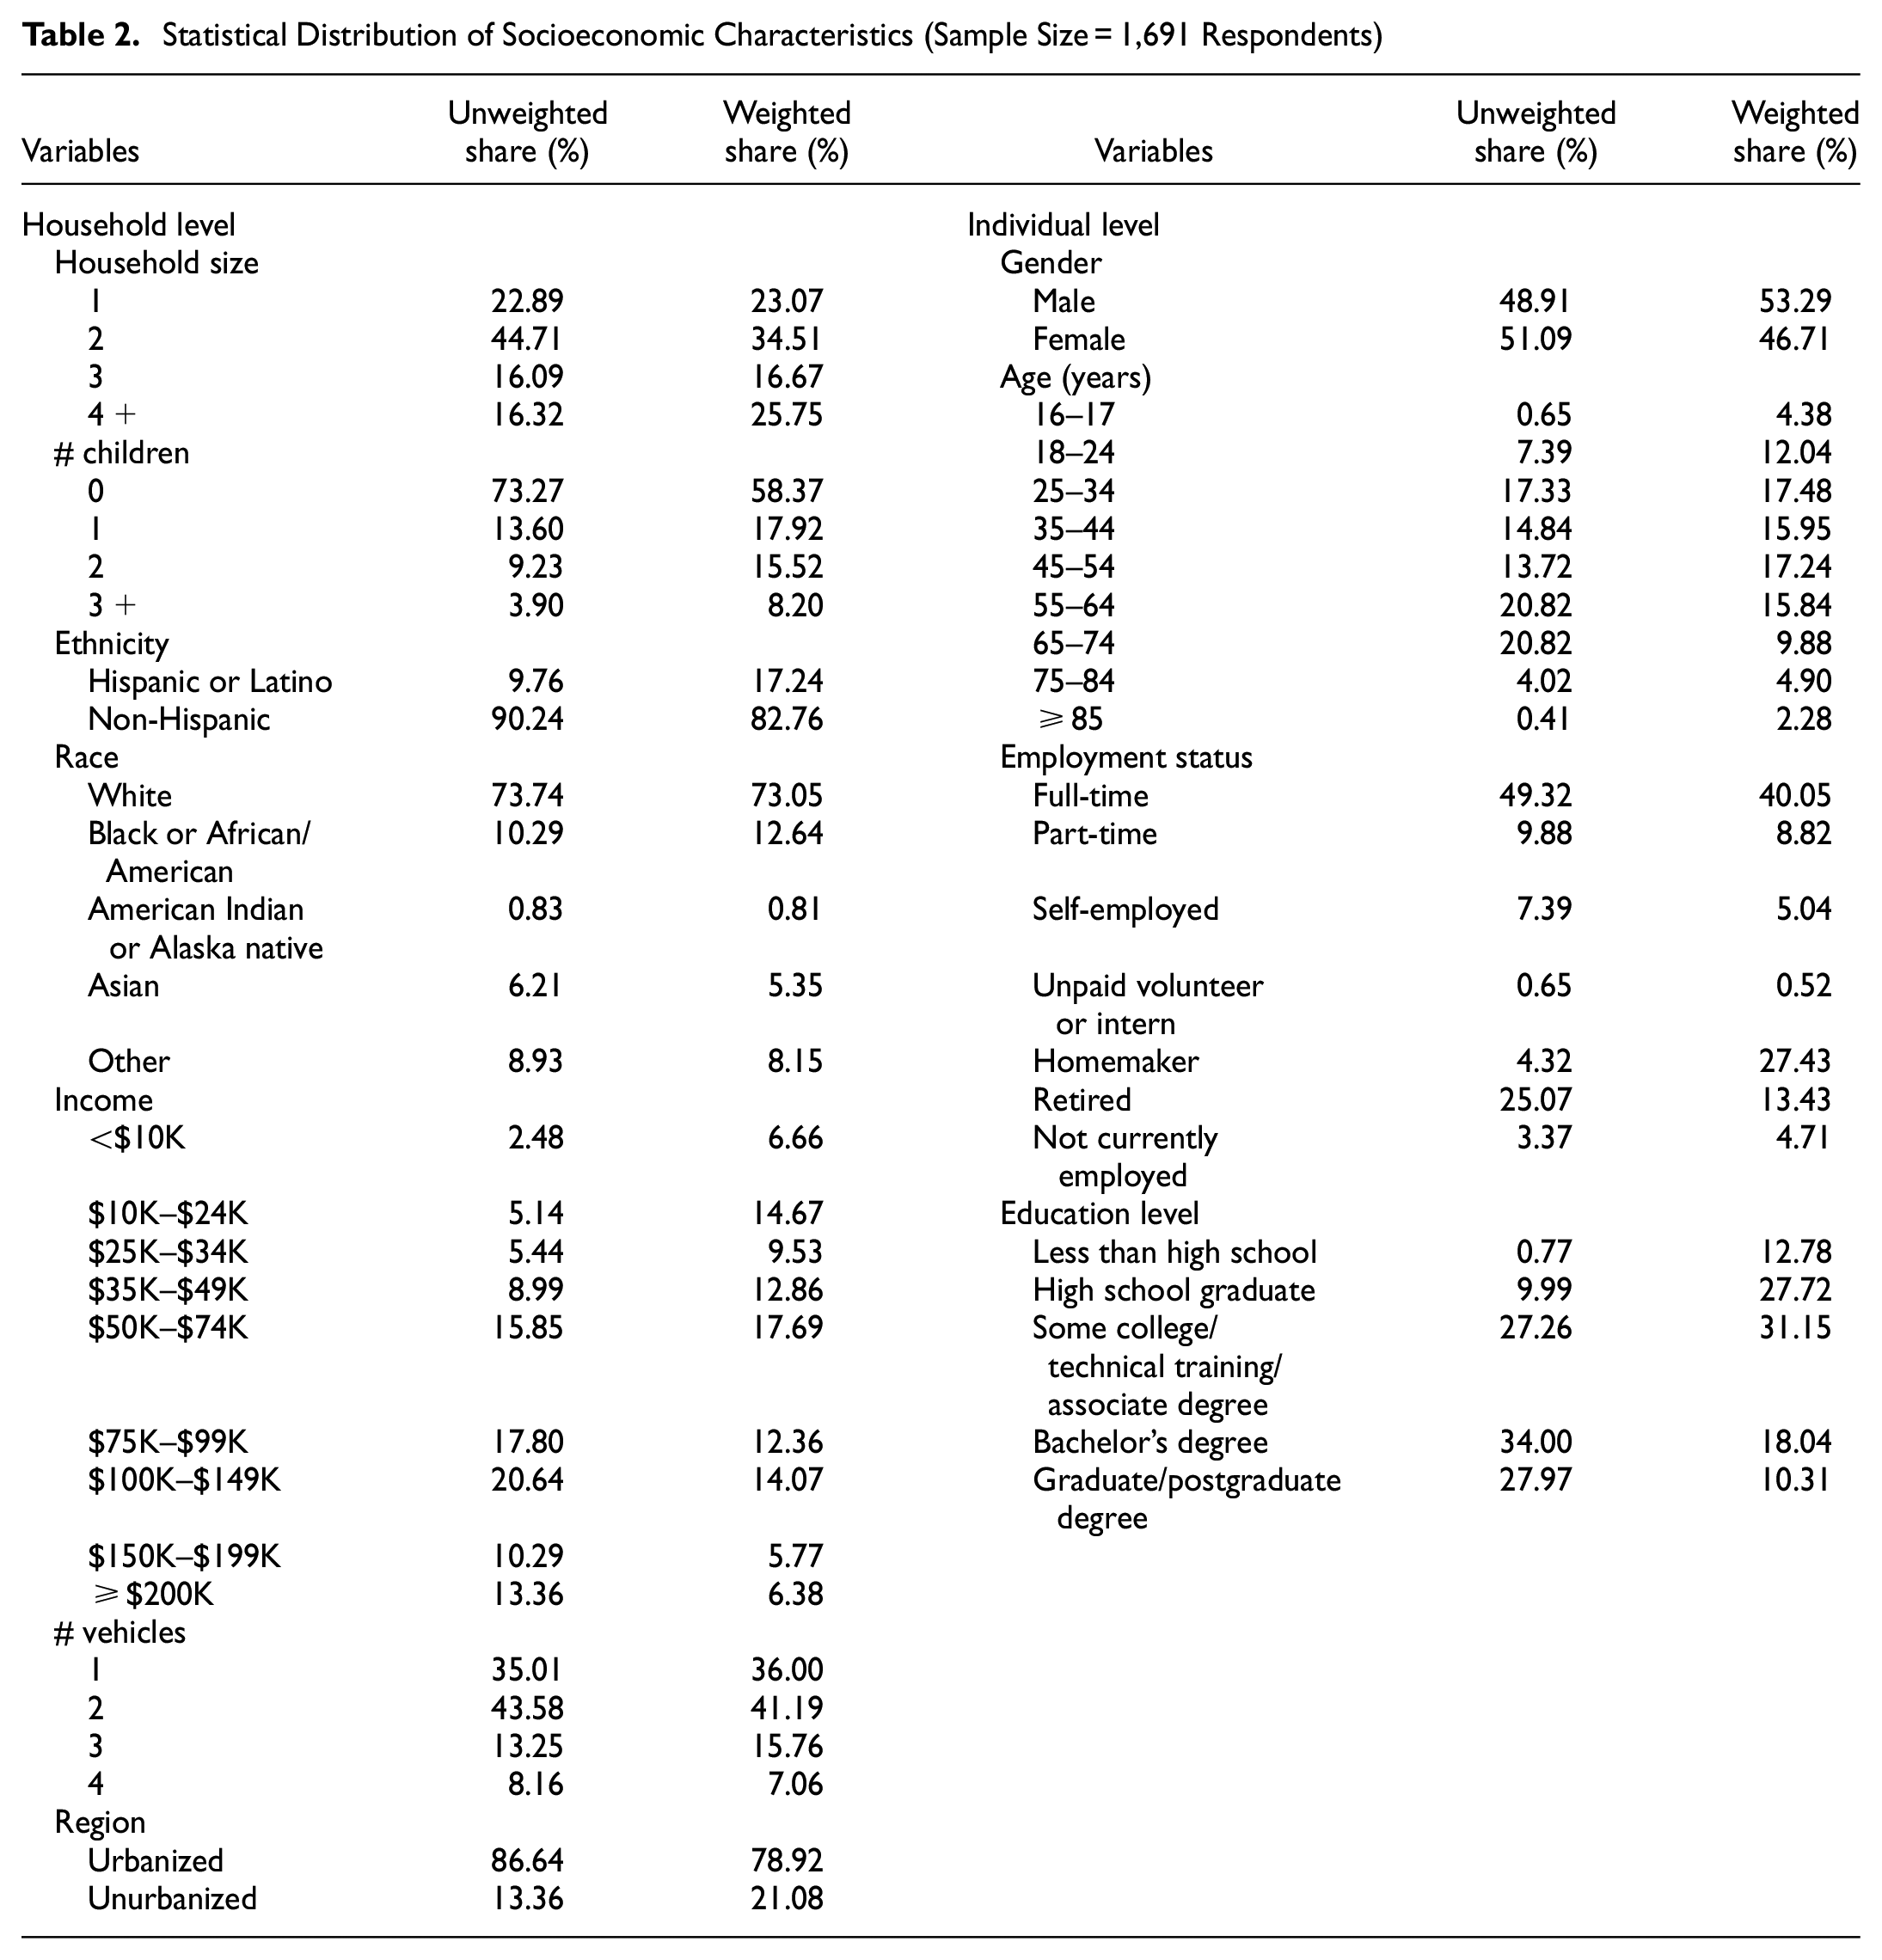
At the household level, the weights were calculated for four household structure types (household sizes of one, two, three, and four or more), four child-based groups of households (no children, one child, two children, and three or more children), two ethnicity types (Hispanic and non-Hispanic), five race groups (White, Black or African/American, American Indian or Alaska native, Asian, and other), nine income levels, four groups of workers (zero, one worker, two workers, and three or more workers), four vehicle ownership levels (one vehicle, two vehicles, three vehicles, and four or more vehicles), and two residential regions (urbanized and unurbanized residence). At the individual level, the weights were calculated for two gender types (males and females), nine age categories, seven employment types, and five education levels. The unweighted and weighted socioeconomic characteristics are presented in Table 2.
Statistical Distribution of Socioeconomic Characteristics (Sample Size = 1,691 Respondents)
Attitudes and Preferences
The survey collects respondents’ attitudes and preferences by asking their opinions about seven groups of statements. Four of these groups, which represent four attitudinal factors, ask about the individuals’ attitudes toward vehicle decision making measured by a five-point Likert scale, ranging from 1 (“not at all important”) to 5 (“very important”). These four attitudinal factors are labeled as attentiveness to vehicle cost, quality, and attributes, and social influence in vehicle decision making. Figure 3 shows the statistical distribution of the measurement indicators of the four attitudes, where each indicator represents one statement in the survey.
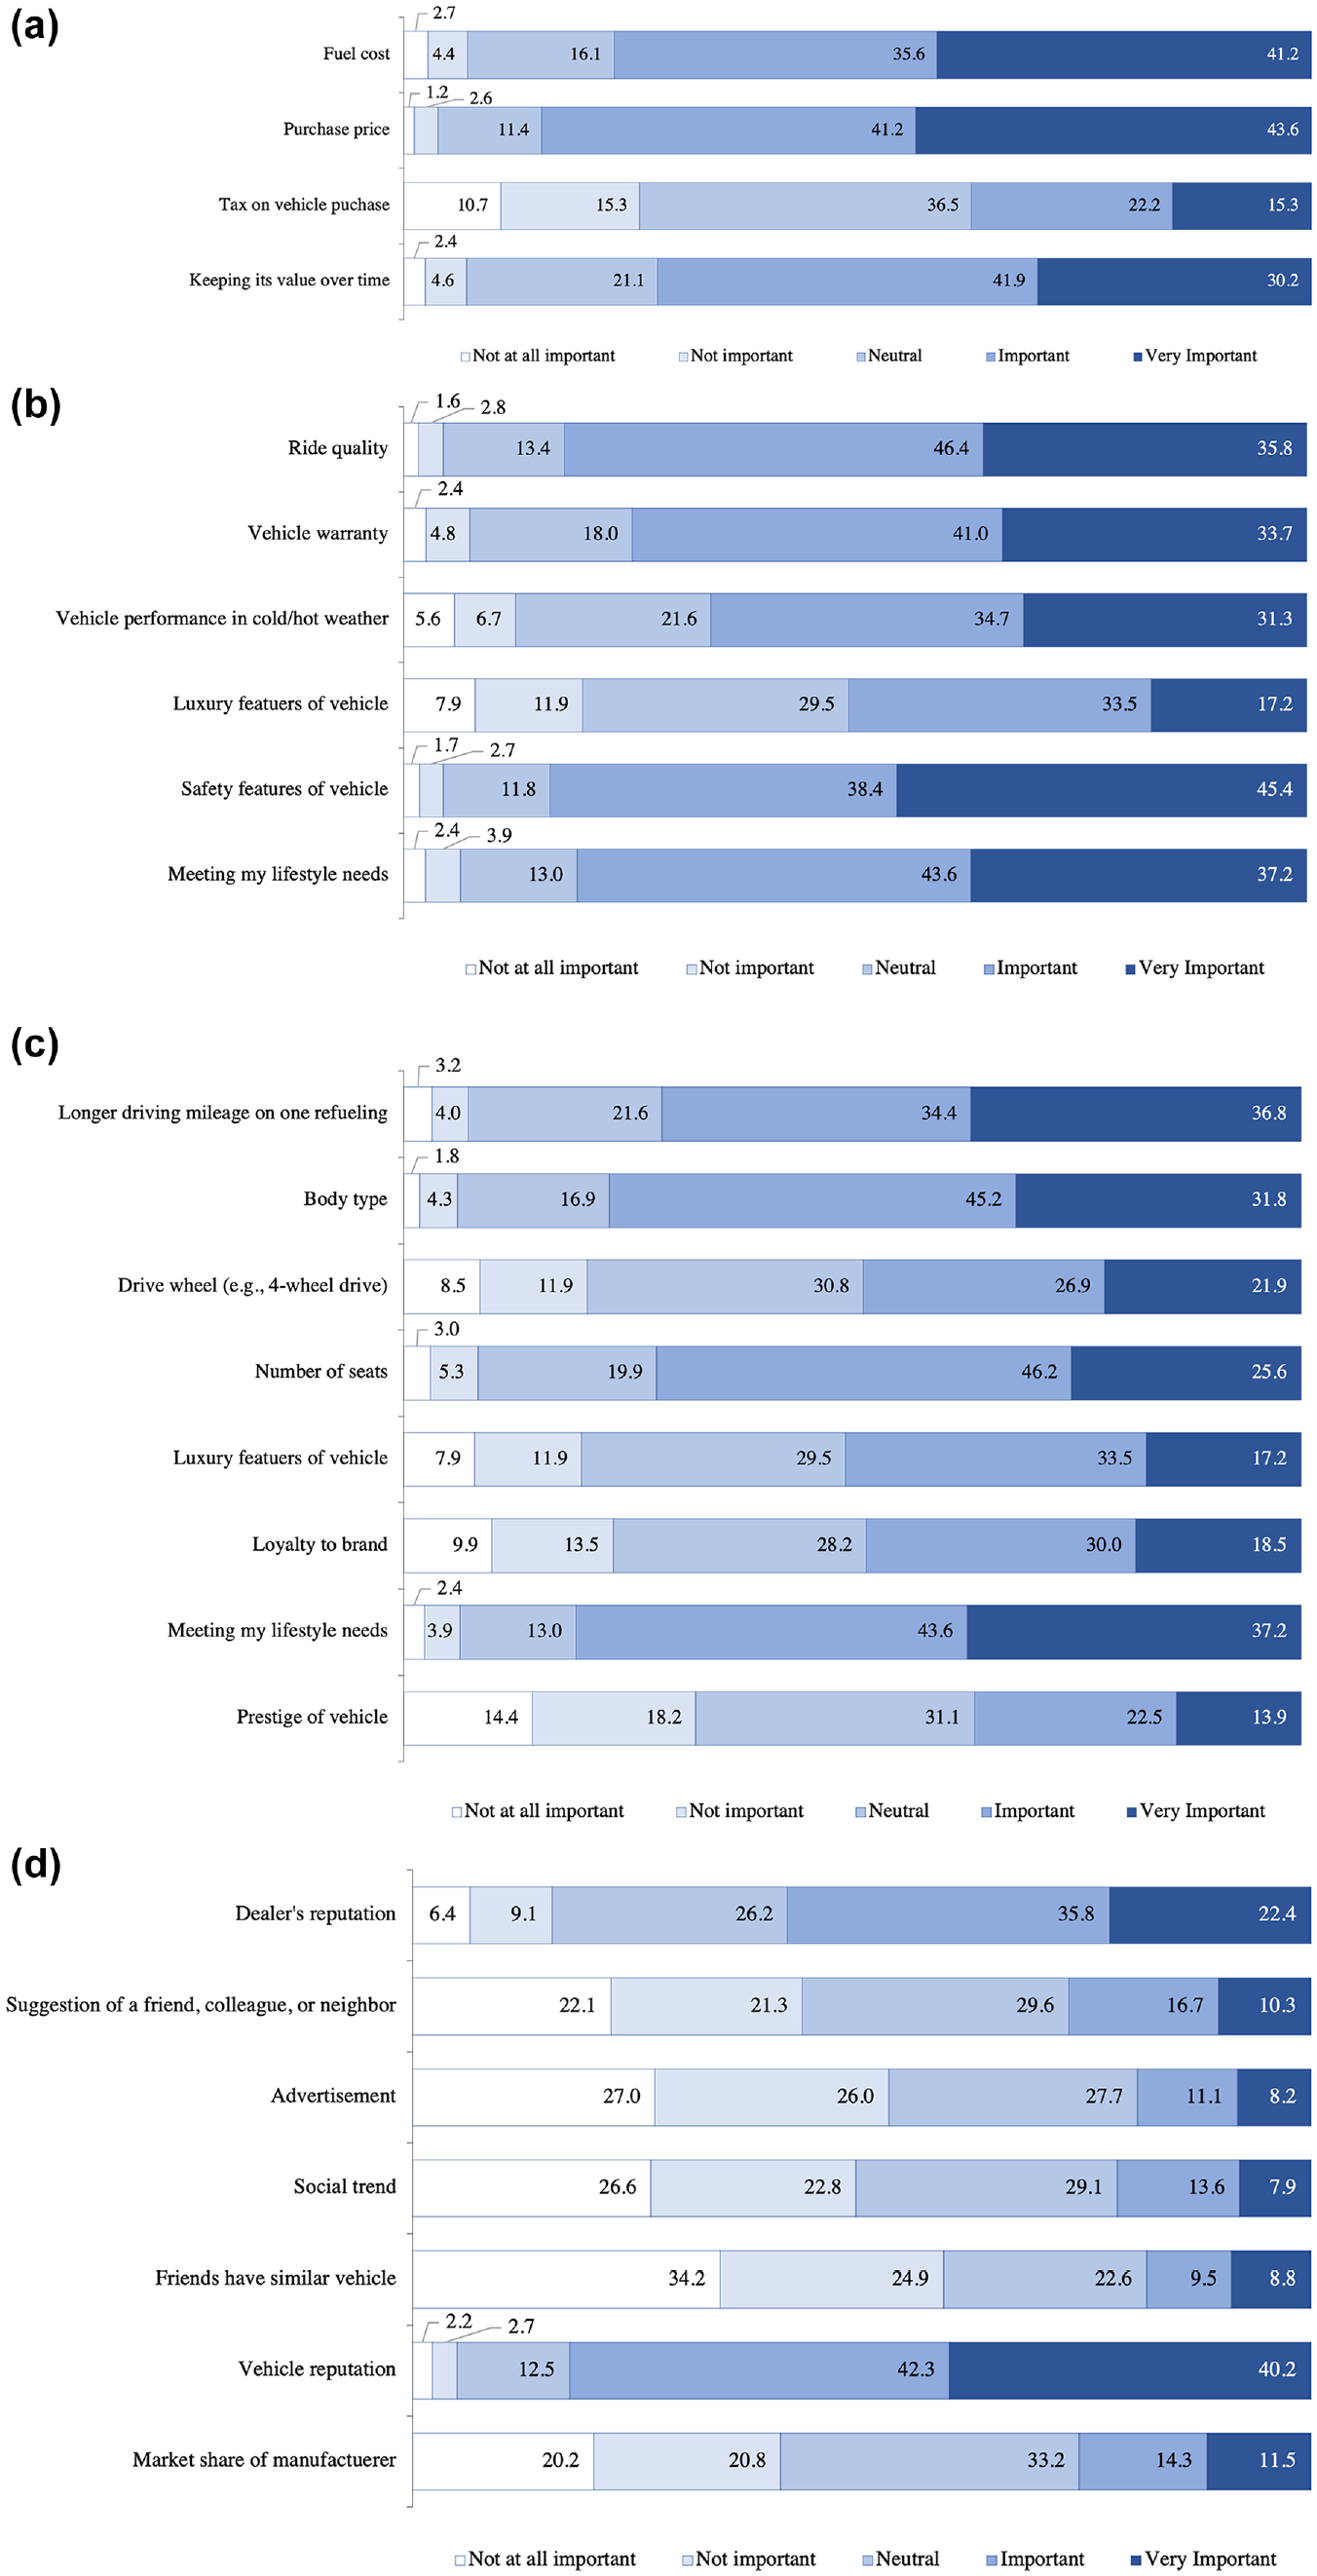
Average values of statements measuring attitudes toward vehicle decision making, including: (a) vehicle cost attentiveness, (b) vehicle quality attentiveness, (c) vehicle attributes attentiveness, and (d) social influence in vehicle decision making in percentage (sample size = 1,691 respondents).
Three groups of statements in the survey determine the respondents’ lifestyle preferences, which are measured by a five-point Likert scale, ranging from 1 (“strongly disagree”) to 5 (“strongly agree”). These preferential factors are labeled as environmental consciousness, technology savviness, and pro-driving. Figure 4 shows the average values of the measurement indicators of these three preferential factors over the individual respondents, where each indicator represents one statement of the survey.
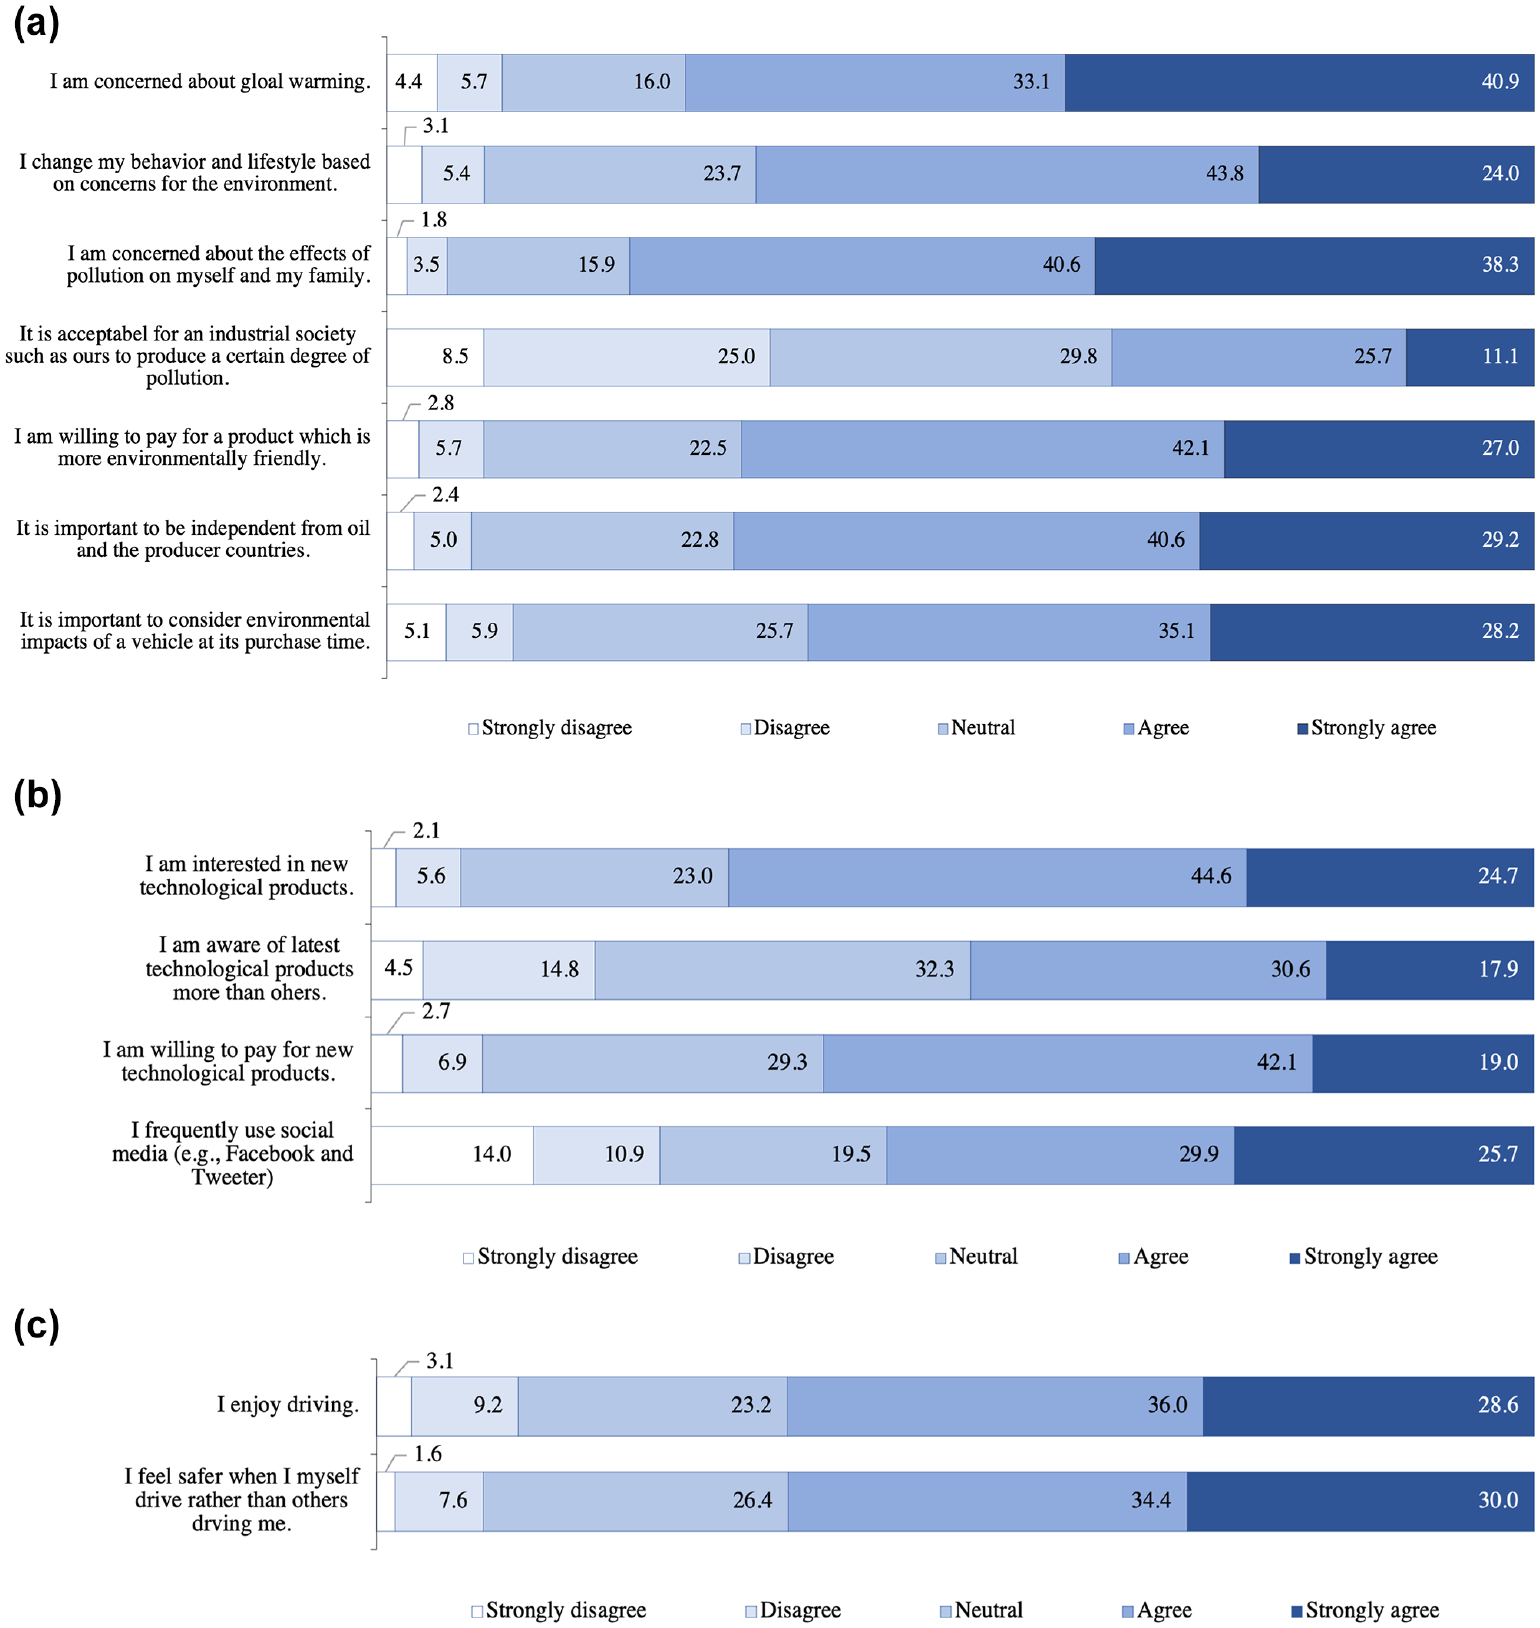
Average values of statements measuring lifestyle preference, including: (a) environmental consciousness, (b) technology savviness, and (c) pro-driving in percentage (sample size = 1,691 respondents).
Dynamics of Household Attributes and Vehicle Decision Making
The survey asks respondents about two sets of retrospective questions spanning a 10-year course of their household decisions from 2008 to 2017. One set determines the number of changes in three types of socioeconomic attributes that households have experienced: household structure, income level, and residential status. Figure 5 shows the values of these changes averaged over the sample of 1,691 respondents.
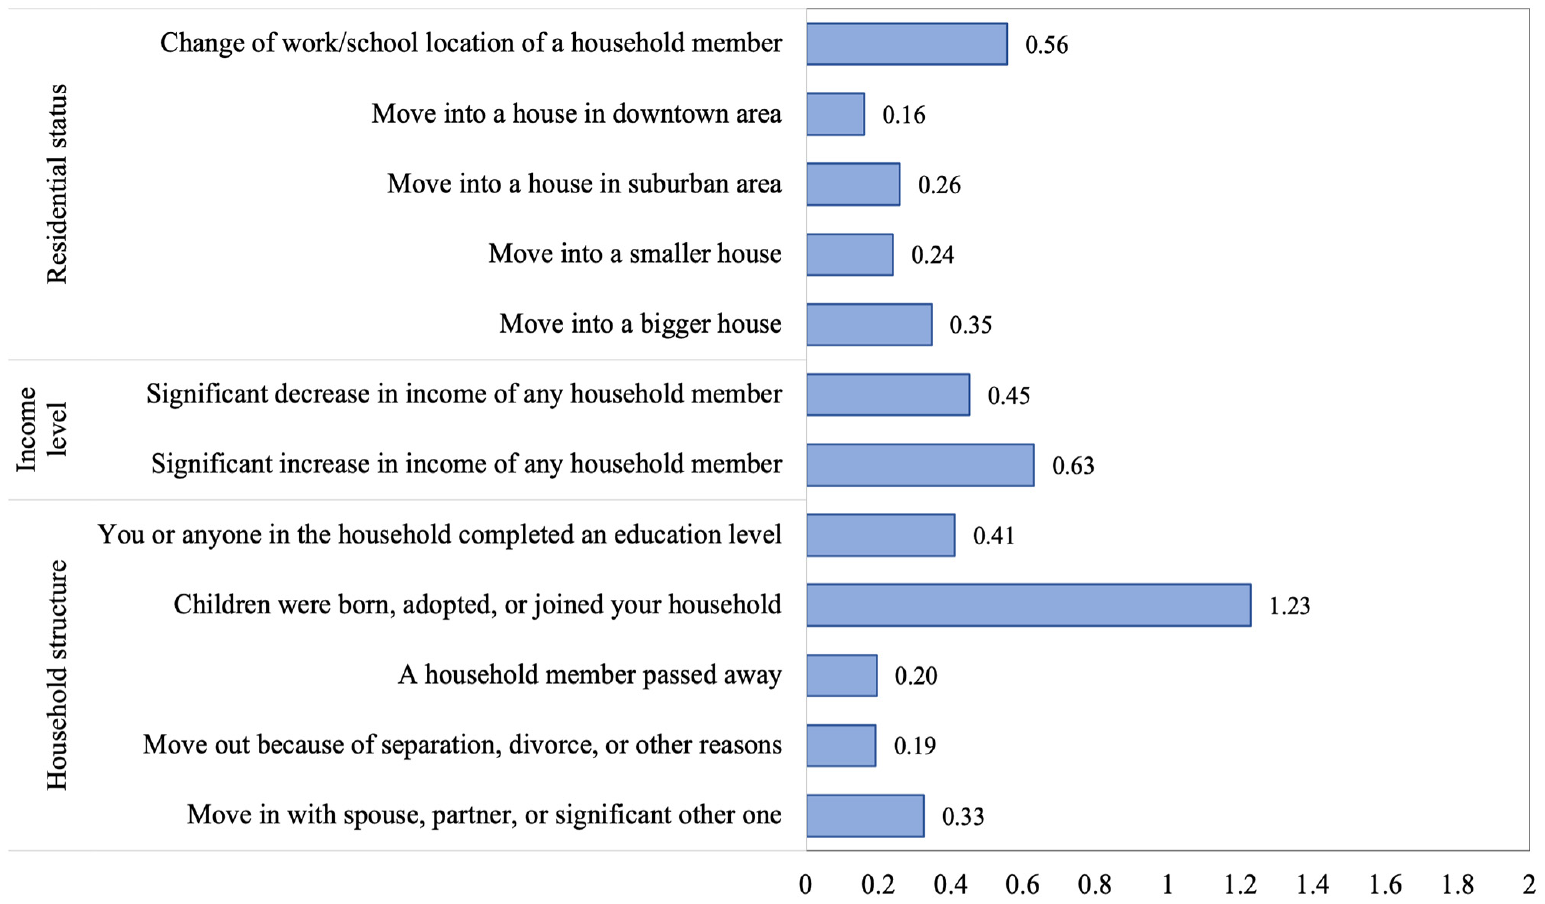
History of household socioeconomic attributes over the past 10 years (average values on the sample dataset with size 1,691 respondents).
The second set of retrospective questions determines two vehicle decisions that households have made: vehicle transaction and fuel types. It was observed that 1,691 households have made 5,224 vehicle transaction and fuel type choices over the 10-year course. Clearly, this indicates that some households have had more than one vehicle transaction during this period. Figure 6 presents the timeline of these decisions and the associated share of each decision. These decisions are considered as the outcome variables of the ICLV model.
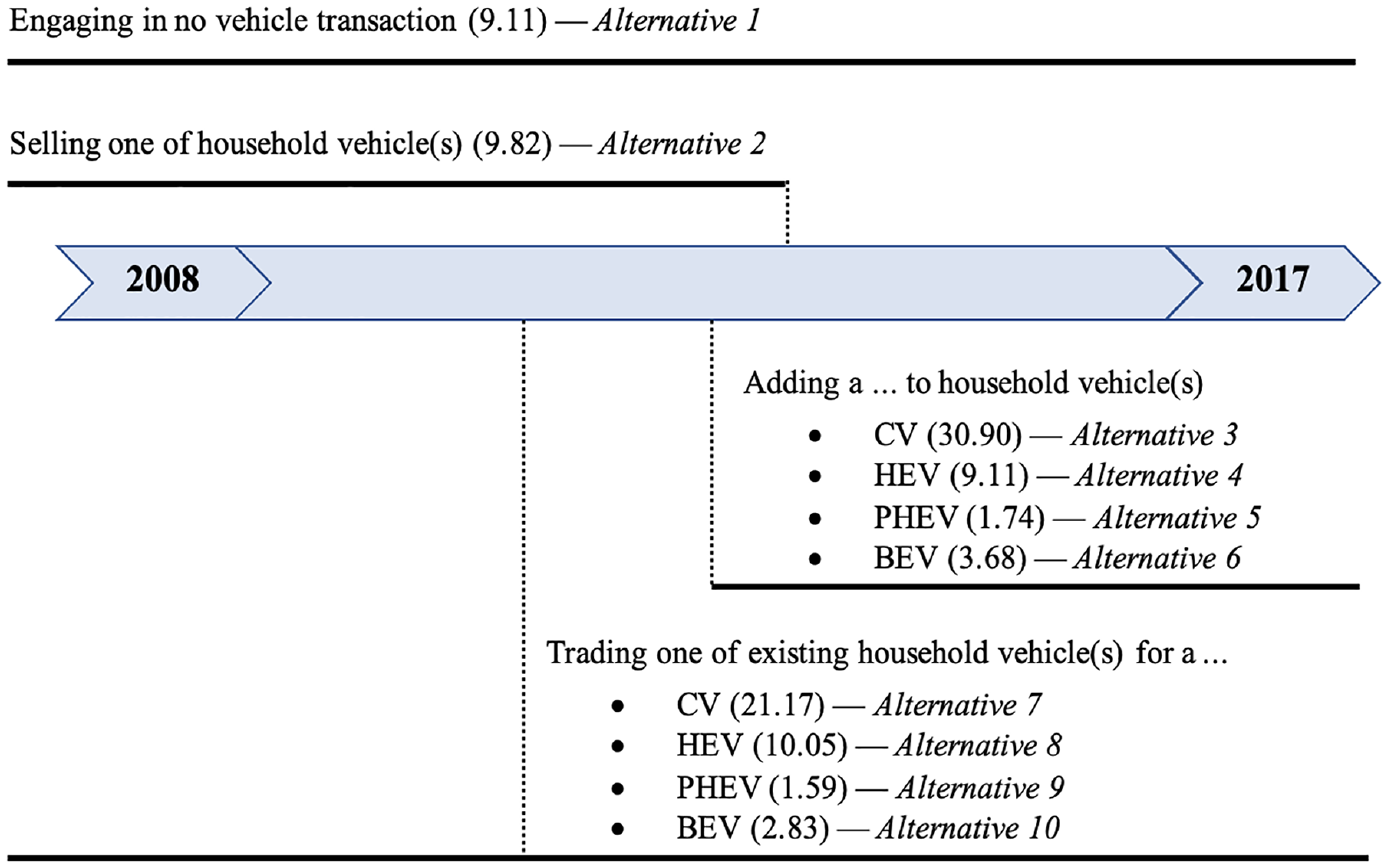
History of household fuel type and vehicle transaction decisions (note: numbers in parentheses show shares of each decision considering the total 5,224 decisions, and endpoints of solid line segments show vehicle transaction events).
Results
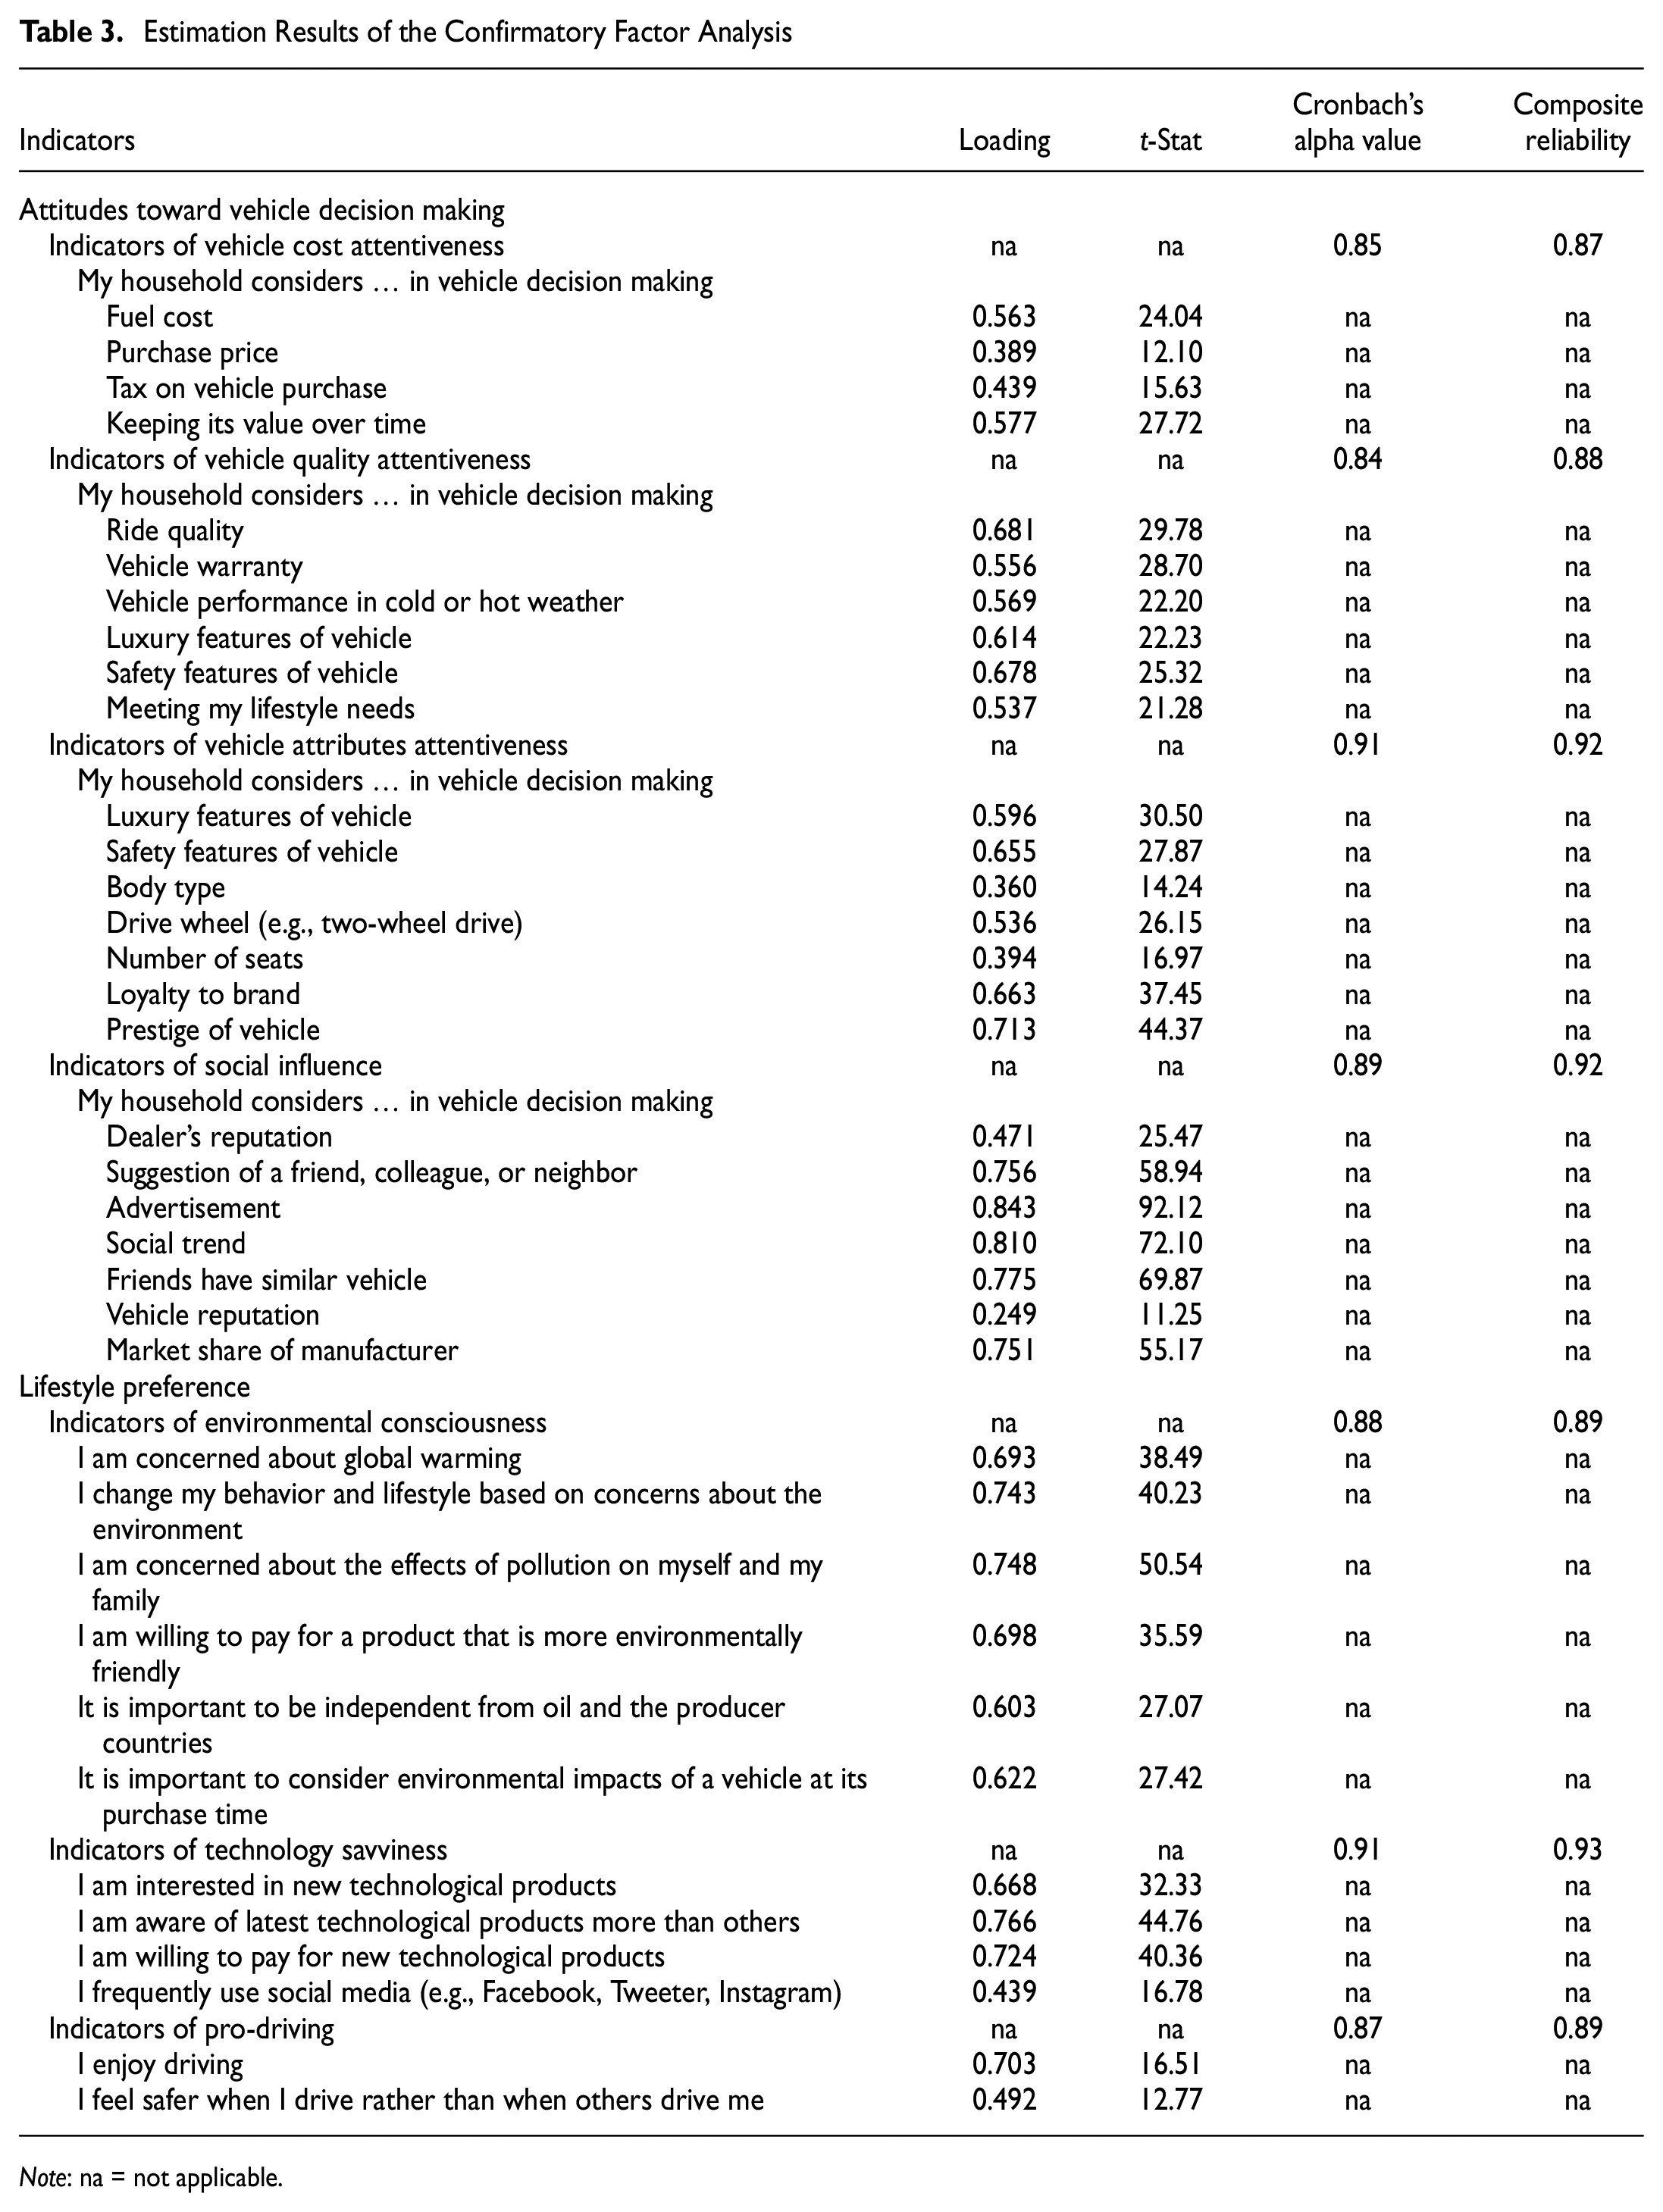
All seven latent constructs described in the previous section on data cannot enter the ICLV model to avoid possible correlations among the constructs. To select the constructs for the ICLV model estimation, we used confirmatory factor analysis, which connects the latent constructs to the corresponding indicators. According to the results presented in Table 3, Cronbach’s alpha values and composite reliability coefficients of all seven constructs are above the threshold value of 0.7, which indicates the reliability of the constructs ( 41 ). The constructs with the larger shares of explained variance are then selected to enter the ICLV model, which include social influence in vehicle decision making, environmental consciousness, attentiveness to vehicle attributes, and technology savviness, with the explained variance values equal to 18.27%, 15.26%, 10.67%, and 9.44%, respectively.
Estimation Results of the Confirmatory Factor Analysis
Note: na = not applicable.
The ICLV model is then estimated, given these four latent constructs and the set of exogenous variables. The estimation results are discussed in the three subsections below, including measurement equations, structural equations, and the choice model, followed by the sensitivity analysis of the results. Almost all model parameters are statistically significant at a 95% confidence interval, and the model has an overall acceptable goodness of fit.
Measurement Equations
The estimation results of the measurement equations are presented in Table 4, which delineates the weights of the latent constructs on the measurement indicators. The latent construct on vehicle attribute attentiveness measures the individuals’ and their households’ attention to various vehicle attributes at the time they make vehicle decisions. The estimated coefficients indicate that this latent construct contributes more to the weights on indicators related to nonoperational attributes (i.e., prestige of vehicle, loyalty to brand, and luxury features of vehicle in descending order) than operational/physical attributes (i.e., drive wheel, number of seats, body type, and safety features of a vehicle in descending order). Turning to the latent variable on social influence, it explains how the individuals’ and their households’ vehicle decision making is influenced by their social environment, such as friends, colleagues, neighbors, and advertisements. As per the results, this latent construct has greater impacts in descending order on the indictors measuring advertisements, social trend, and friends having a similar vehicle.
Estimation Results of the Measurement Equations
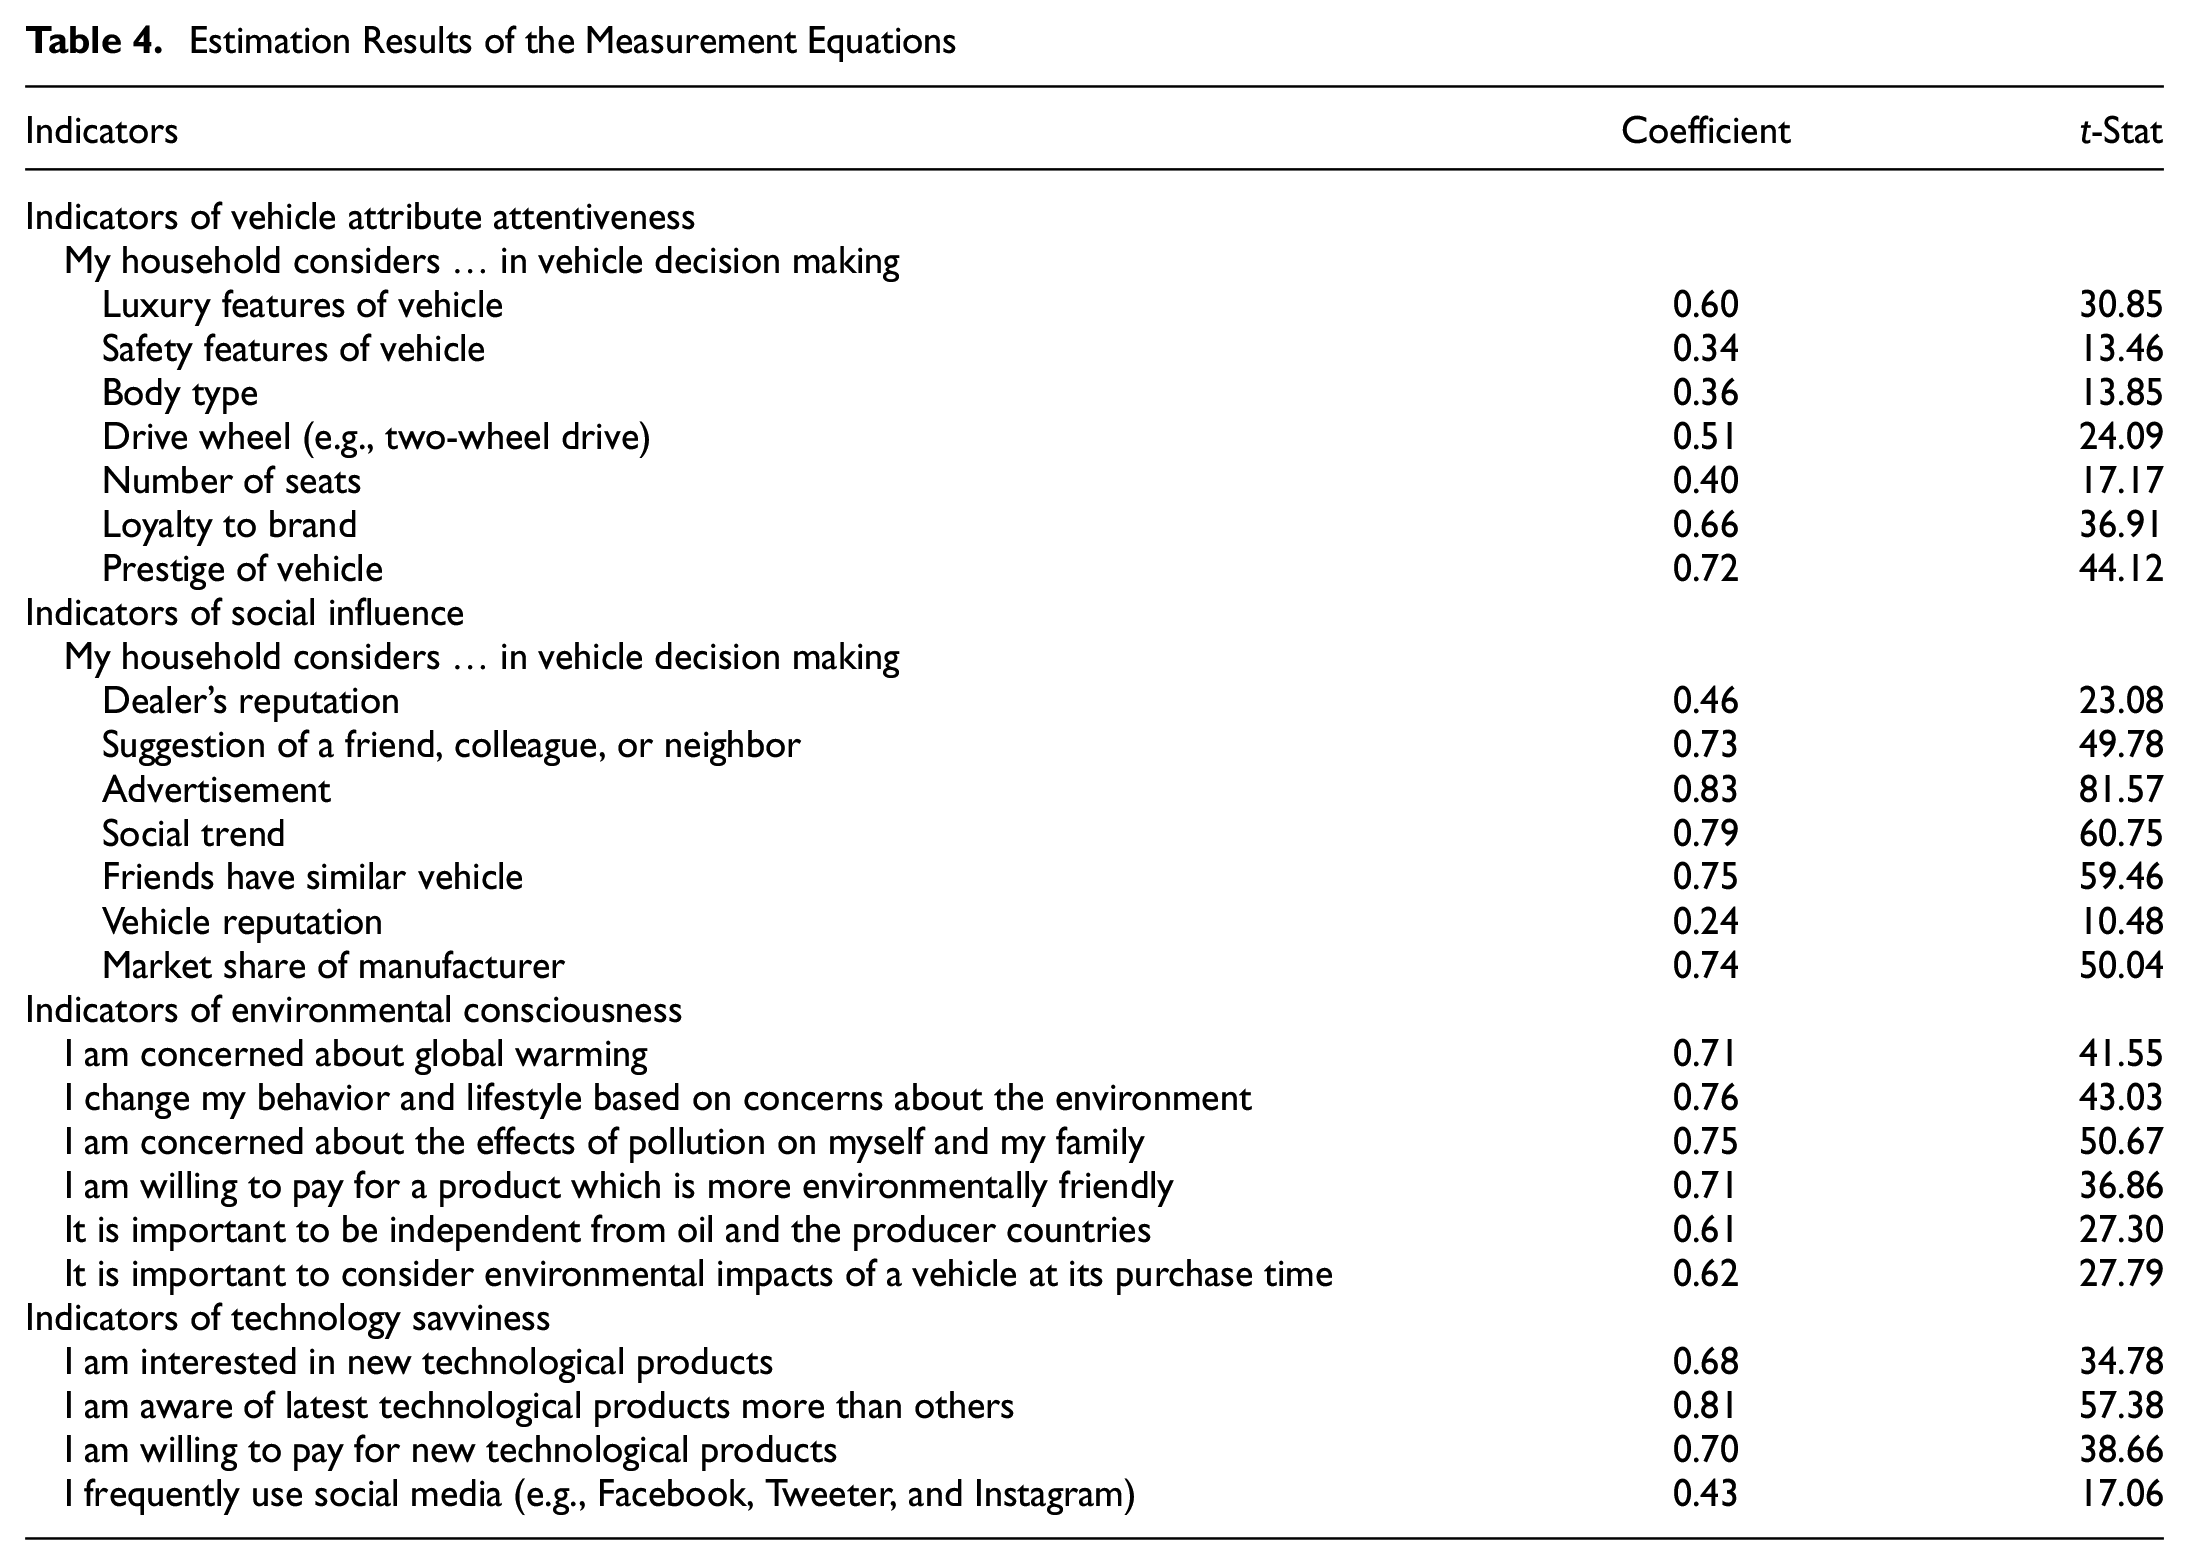
The latent construct on environmental consciousness is found mostly to influence the individuals’ opinions on changing behavior and lifestyle and being concerned about the effects of pollution, as indicated by their slightly larger coefficients compared with other indicators. Finally, the latent construct explaining individuals’ technology savviness has a more tangible influence in descending order on their awareness of technological products, willingness to pay for technological products, and interest in new technological products than on their social media usage frequency.
Structural Equations
The estimation results of the structural equations signify a set of five socioeconomic characteristics (Table 5). Gender appears as a dummy variable, taking 1 for females. The negative signs of this variable in the equations of the four latent constructs mean that, compared with males, females are likely less vehicle attribute attentive, socially influenced, environmentally conscious, and technology savvy. Age appears as two dummy variables, revealing the nonlinear aging effect. One variable takes 1 for young individuals and 0 otherwise. The other variable takes 1 for the elderly and 0 otherwise. The results reveal that young individuals, in contrast to the elderly, likely pay more attention to vehicle attributes, are influenced by social factors, and are technology savvy. Moreover, young individuals are probably more conscious of environmental issues than other age groups.
Estimation Results of the Structural Equations
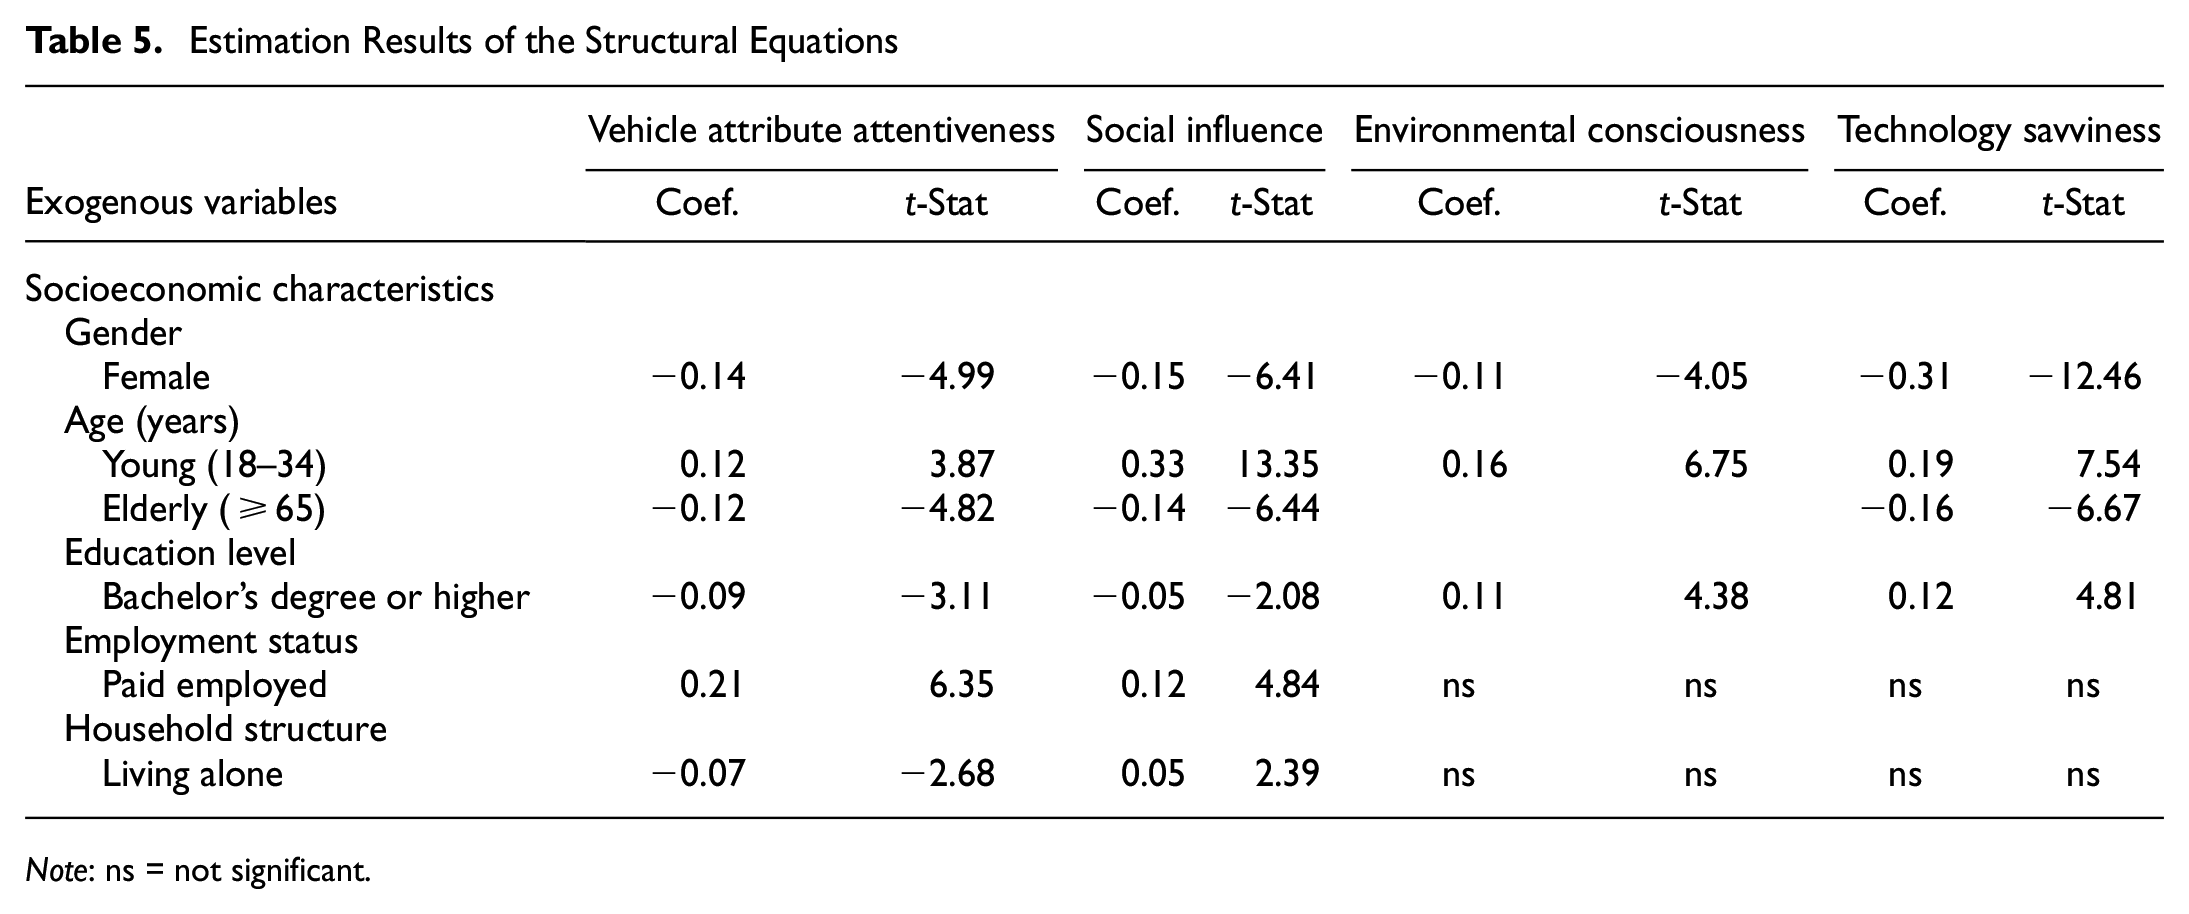
Note: ns = not significant.
Education is statistically significant as a dummy variable, taking 1 for those who are highly educated, namely, with a bachelor’s degree or higher. The highly educated individuals are likely more conscious of environmental issues and technology savvy than others, whereas they are less attentive to vehicle attributes and less socially influenced. Employment status is found to be significant as a dummy variable, taking 1 for those who are paid employees and 0 otherwise. The results show that paid employees pay more attention to vehicle attributes and are more influenced by social factors than others.
Household structure appears in the model by a dummy variable, taking 1 for those who live alone and 0 otherwise. People who live alone, rather than with others, are likely less attentive to vehicle attributes, while they are positively affected by their social environment.
Choice Model
The estimation results of the MNL choice model are presented in Table 6. It is worth noting that in the sample dataset used for the model estimation, the summation of observations across vehicle transaction types, except for the sell alternative, yields the number of existing household vehicles. Across the existing vehicle sample, the distribution of four vehicle fuel types, including CV, HEV, PHEV, and BEV, are, respectively, 66.38%, 22.71%, 3.69%, and 7.22%. A comparison of these values with the existing market shares of vehicle fuel types ( 10 , 42 , 43 ) reveals that the three EV types (i.e., HEV, PHEV, and BEV) are oversampled. To avoid biases, we applied the method suggested by Cherchi and de Dios Ortúzar ( 44 ) by adjusting the constant terms so that the model with only constant terms gives the market share. The rest of the section discusses the estimation results.
Estimation Results of the Choice Model
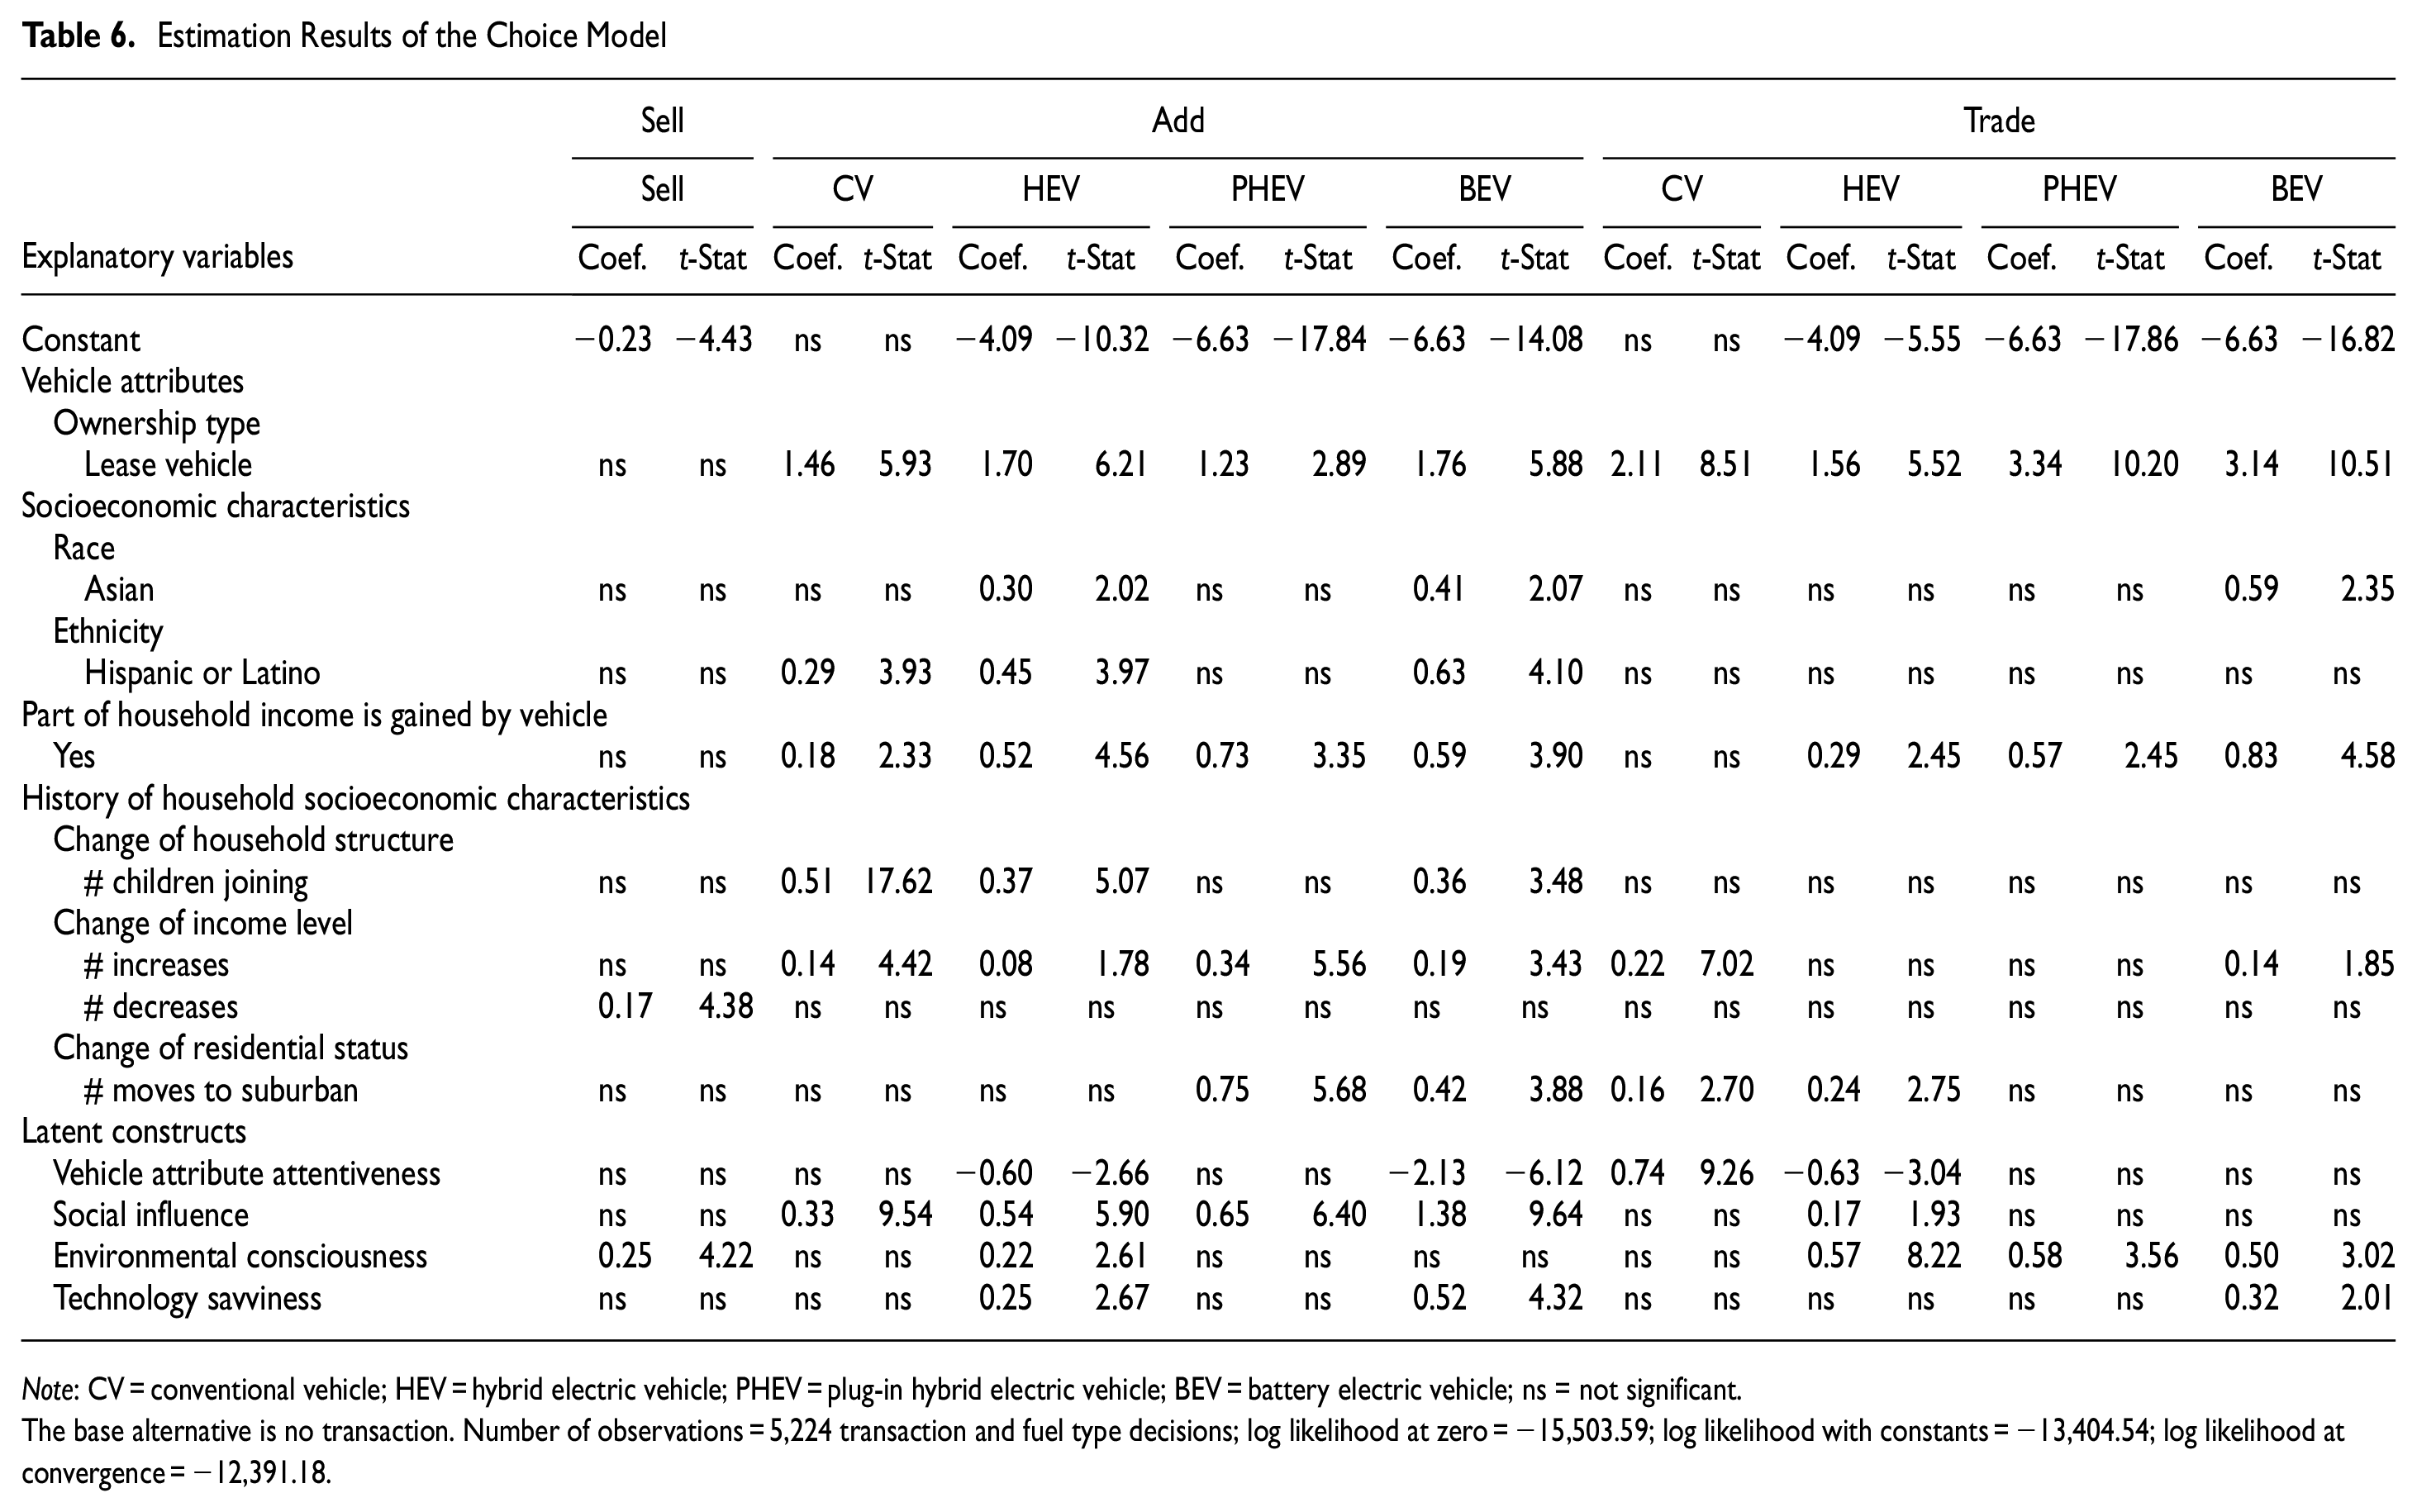
Note: CV = conventional vehicle; HEV = hybrid electric vehicle; PHEV = plug-in hybrid electric vehicle; BEV = battery electric vehicle; ns = not significant.
The base alternative is no transaction. Number of observations = 5,224 transaction and fuel type decisions; log likelihood at zero = −15,503.59; log likelihood with constants = −13,404.54; log likelihood at convergence = −12,391.18.
Vehicle Attributes
Vehicle ownership type is found to be statistically significant as a dummy variable, taking 1 for lease vehicles. The results show that the individuals are likely interested in trading an existing household vehicle for a lease vehicle and adding a lease vehicle to their households’ existing vehicle(s), with a higher tendency toward the former. In particular, the largest coefficients of this variable belong to traded-for PHEV and BEV, indicating the greater tendency of individuals toward trading their vehicle(s) for lease PEV, especially PHEV. Given the lower acquisition cost of lease vehicles versus the higher purchase price of PEV, it can be inferred that the high purchase price may impede the owned PEV adoption, which can be of interest to policy decision makers. This is generally consistent with the findings of the prior studies, which find vehicle leasing the most preferred option for BEV ( 22 ) and also the interest of lease vehicle users in BEV adoption ( 25 ).
Socioeconomic Characteristics
Race appears in the model as a dummy variable, taking 1 for Asians. The results reveal the positive signs of this variable in the utility equations of added and traded-for BEV as well as added HEV. This suggests the positive tendency of Asians toward BEV, especially as a traded-for vehicle, in addition to their interest in adding a HEV to their household vehicle(s). Ethnicity is also found to be significant in the model as a dummy variable, taking 1 for Hispanic or Latino individuals. The positive signs of this variable in the utility equations of added BEV, HEV, and CV in descending order of magnitude indicate the higher tendency of Hispanic or Latino individuals toward these alternatives than other ethnic groups.
The variable representing whether an individual’s household uses its vehicle to gain part of its income appears as a dummy variable, taking 1 for those who responded yes to this question. The results show that those with a positive answer to this question have a greater proclivity toward adding or trading in a vehicle. Moreover, their preferred fuel types for both added and traded-for vehicles are BEV and PHEV.
History of Household Socioeconomic Characteristics
The estimated model includes three groups of variables describing dynamics of the socioeconomic characteristics of the individuals’ households over the past 10 years from 2008 to 2017. The first group captures the change of household structure with regard to the number of children joining the households. The results indicate that more children joining a household translates intuitively into more inclination toward adding CV, HEV, and BEV in descending order, given the corresponding positive coefficients.
The second group captures the change of household income over the past 10 years by two variables measuring the number of times the households’ income increases or decreases. The results indicate that an increase in income level leads to higher interest in adding a vehicle, regardless of the fuel type, and trading in a vehicle, especially CV and BEV. In contrast, more instances of a drop in income level increase the probability of selling a vehicle compared with the other transaction types.
The last group describes the change of household residential status over the past 10 years through a variable measuring the number of times a household moves to suburban areas. This variable appears with positive signs in the utility equations of added PEV as well as traded-for HEV and CV. This suggests that moving to suburban areas increases the probability of acquiring PHEV and BEV, with a higher tendency toward PHEV. This might be because of the limitation of installing PEV charging infrastructure at residences in downtown compared with suburban areas. Therefore, it can be inferred that a major determinant of EV adoption behavior is provision of charging infrastructure, which is of note to policy decision makers, as also corroborated by similar findings of the previous studies reviewed in Li et al. ( 6 ), which detects charging infrastructure as a crucial barrier to PEV adoption. The results further show that relocating to suburban areas encourages trading an existing household vehicle for CV and HEV, although with less tendencies than those of acquiring PHEV and BEV.
Latent Constructs
The latent construct explaining vehicle attribute attentiveness appears with negative signs in the utility equations of added BEV as well as traded-for and added HEV in descending order. This signifies that people attentive to vehicle attributes less likely opt for acquiring BEV as an added vehicle to their household vehicle(s) and HEV. In contrast, they are likely attracted to traded-for CV more than other options, given the positive sign of its coefficient in the associated utility equation. This finding can be justified by noting that BEV and HEV have limited attributes compared with CV, which may negatively affect BEV and HEV attractiveness. However, BEV uptake can be expected to increase gradually as BEV attributes advance, particularly by the entrance of more prominent car manufacturers into the BEV market that could enhance nonoperational attributes (e.g., prestige of vehicle and luxury features of vehicle), which were found in the estimated measurement equations (Table 4) to be more noted by vehicle attribute attentive individuals than operational attributes of a vehicle (e.g., drive wheel and body type).
The latent factor reflecting the role of social influence on vehicle decision making appears in the utility equations of all types of added vehicles and traded-for HEV. In particular, those who are more influenced by their social environment are more likely to add a vehicle to their existing household vehicles, especially adding PEV, with more inclination toward BEV than PHEV. Socially influenced individuals are also interested in trading in a HEV, yet with a lower tendency than adding a vehicle to the existing household vehicles. This finding is consistent with previous studies. Kim et al. ( 45 ) found that EV adoption behavior is affected by positive public opinion about EVs, especially when the EV market share is almost half of friends in people’s social network. Bansal et al. ( 23 ) found that social influence likely affects EV early adopters, who believe in its positive environmental effects. To promote BEV uptake, incentivizing policies can thus focus on the cohort of socially influenced people, noting that such individuals tend more to consider advertisement and social trend when making a vehicle decision, as per the estimated measurement equations (Table 4).
When it comes to the latent environmental consciousness construct, it appears with positive signs in the utility equations of the three traded-for EV types (i.e., HEV, PHEV, and BEV), added HEV, and selling a vehicle in descending magnitudes. This suggests that environmentally conscious people are more interested in traded-for EV—rather than added EV—with close tendencies toward the three EV types, while their next preferred options are selling an existing household vehicle and acquiring HEV. This finding is in line with prior studies. For example, Jensen et al. ( 46 ) found that individuals’ interests in EVs are positively affected by higher environmental concern, where their concern does not change with EV experience. Kim et al. ( 45 ) also reported a similar positive effect of environmental concerns on EV adoption. These findings, as an expected behavior of environmentally conscious people, can be leveraged to devise policies for promoting EV adoption by trading an existing vehicle for an EV. Such policies can be geared toward drawing individuals’ and communities’ attention to the harmful consequences of CV to stimulate their environmental consciousness, which would likely translate into changing behavior and lifestyle, as suggested by the estimated measurement equations (Table 4).
The positive signs of the latent construct explaining technology savviness in the utility functions of BEV alternatives indicate the positive tendency of technology savvy persons toward BEV, especially as an added vehicle to the existing household vehicles. This cohort of individuals is also interested in adding HEV to their existing vehicles, yet to a lesser degree than adding BEV. Recalling from the estimation results of the measurement equations that technology savvy individuals have greater awareness about, interest in, and willingness to pay for technological products than others, the findings of the choice model reveal that concentrating policy recommendations on raising awareness about technological aspect of EVs can result in pursuance of BEV adoption. It should be noted, however, that those who are technology savvy are more inclined toward adding BEV to the existing household vehicles than trading an existing vehicle for BEV, which might have implications for vehicle use and road congestion. Similarly, Kim et al. ( 45 ) report the tendency of those who are tech savvy toward EVs.
Direct Elasticities
To analyze the estimated ICLV model further, we computed the direct elasticity of each choice alternative with respect to the explanatory variables (Equations 12 and 13), which is defined as the percentage change in the choice probability of the alternative caused by a percentage change in the desired explanatory variable while keeping all other explanatory variables constant ( 47 ):
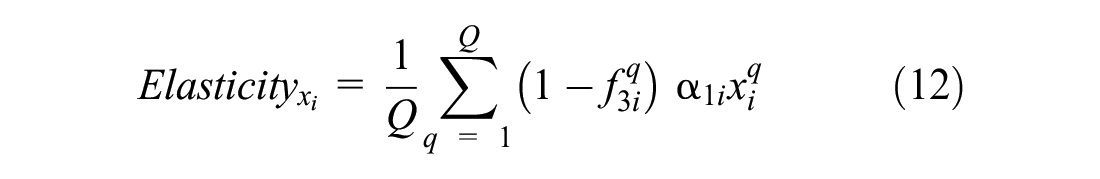

Table 7 presents the calculated direct elasticities, indicating the inelasticity of all alternatives with respect to the explanatory variables. The largest elasticities belong to added BEV with respect to two latent constructs. Specifically, a 1% increase in the latent constructs explaining vehicle attribute attentiveness and social influence would decrease and increase the probability of adding a BEV to the existing household vehicle(s) by 0.71% and 0.65%, respectively. From a policymaking perspective, these findings clearly suggest that the most effective factor to consider for devising policies aimed at promoting BEV adoption is the social influence latent construct.
Elasticity of Explanatory Variables of the ICLV Model
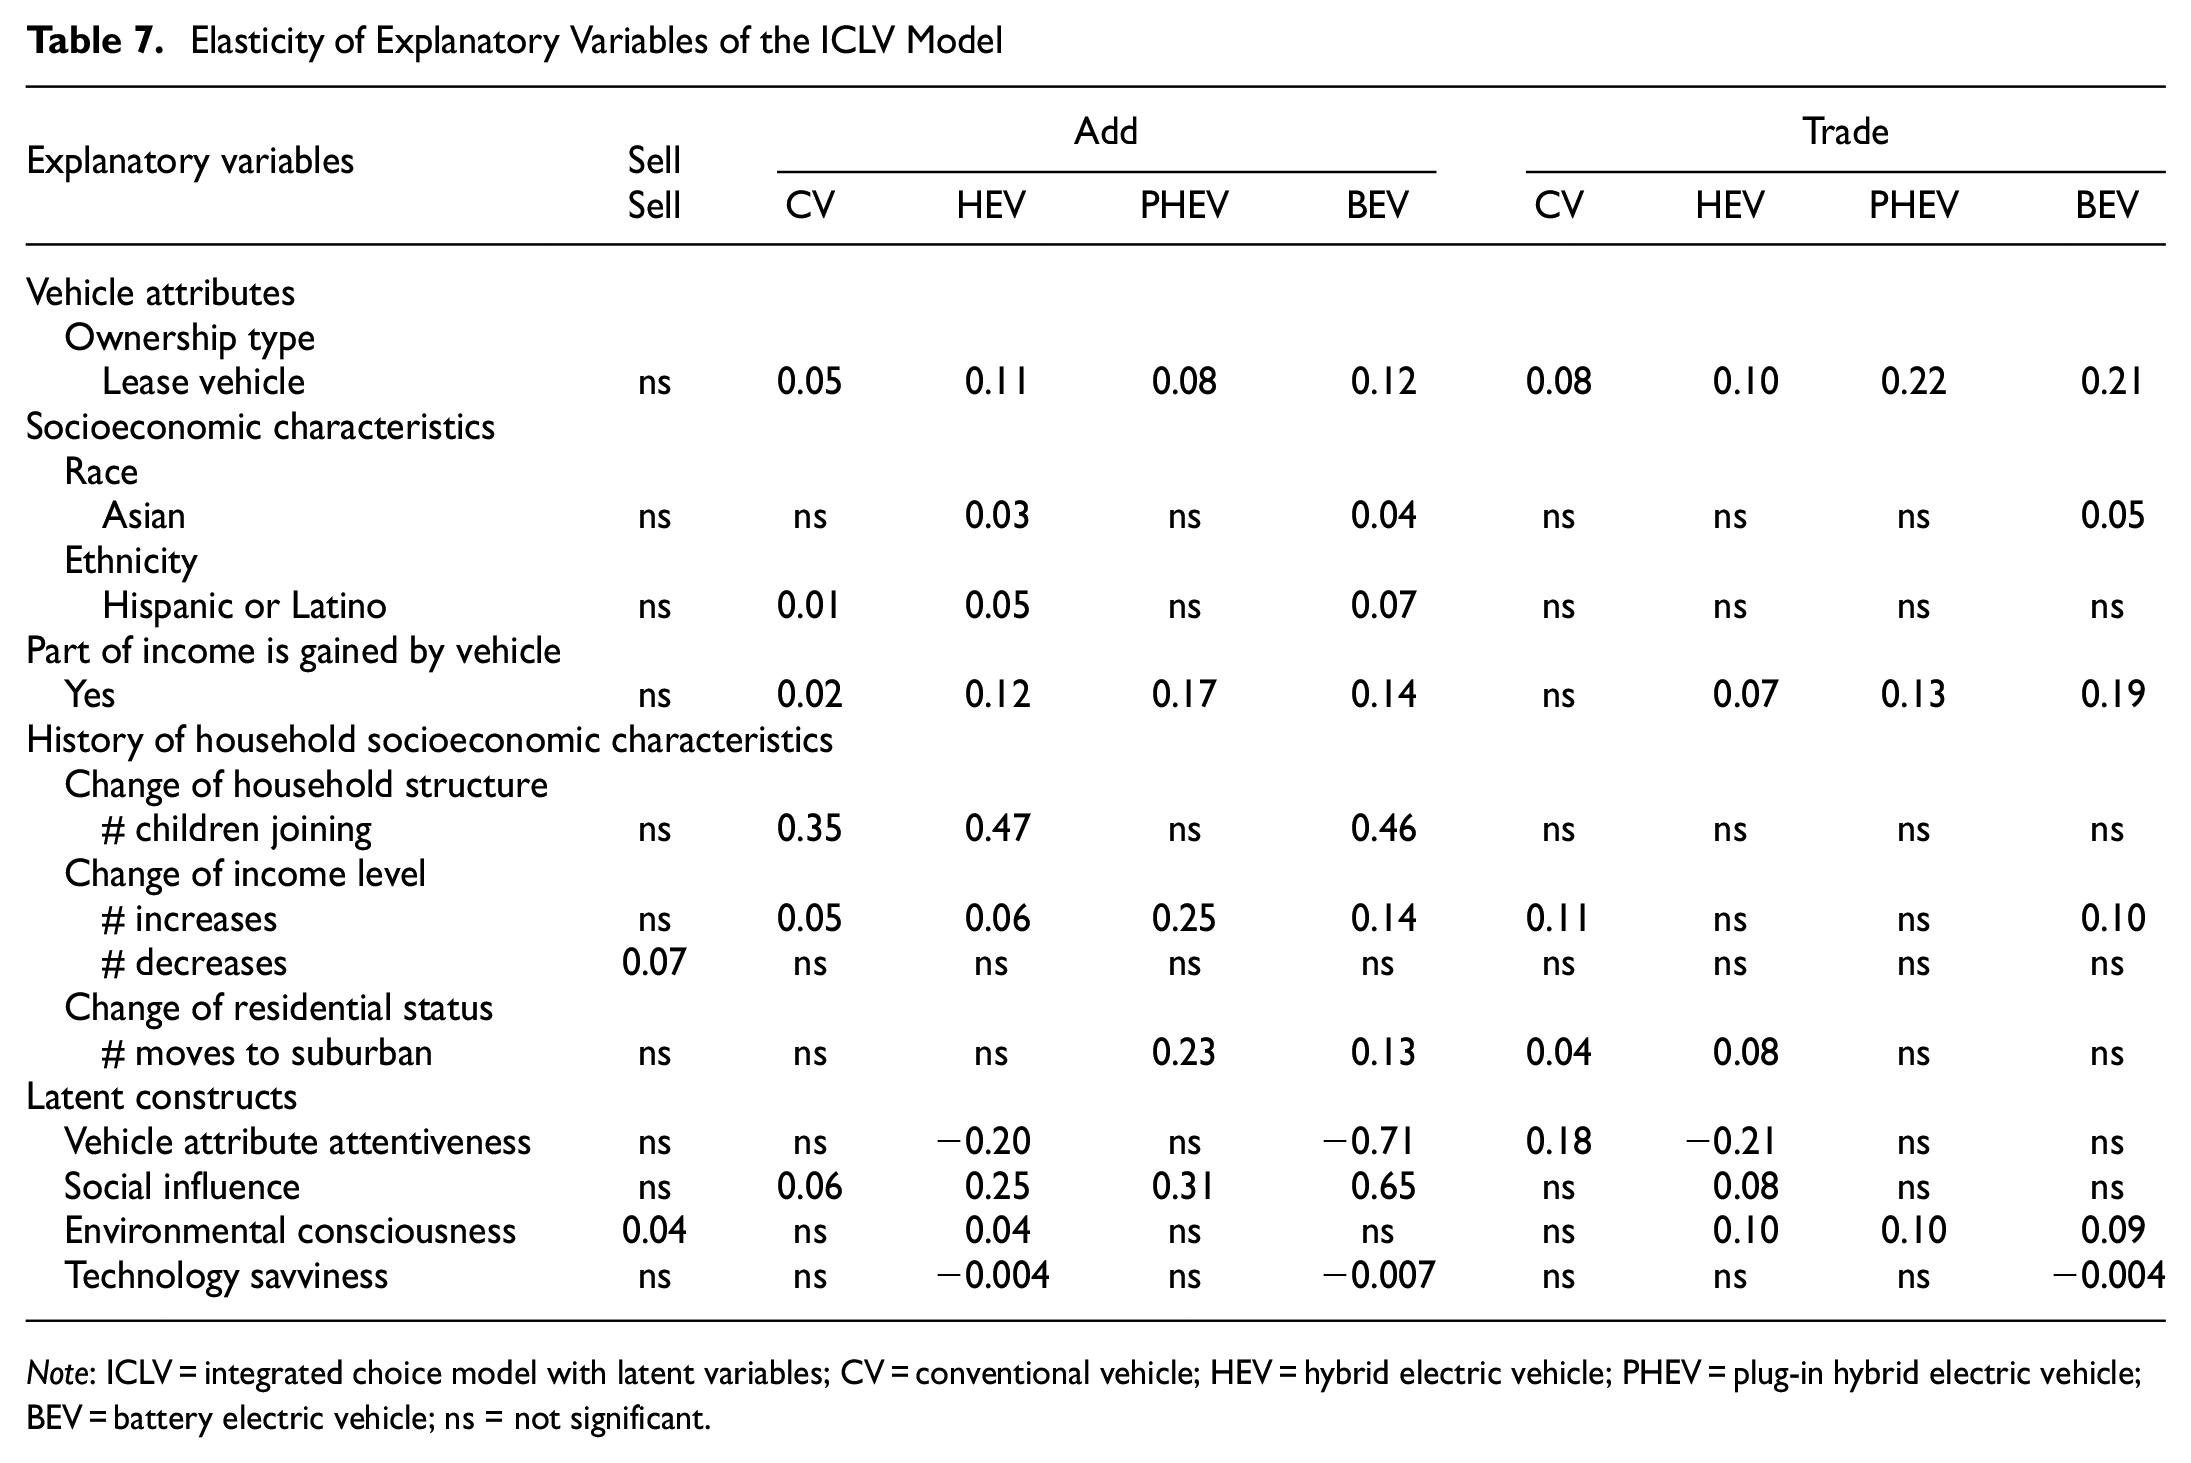
Note: ICLV = integrated choice model with latent variables; CV = conventional vehicle; HEV = hybrid electric vehicle; PHEV = plug-in hybrid electric vehicle; BEV = battery electric vehicle; ns = not significant.
Policy Implications
The findings from the estimated ICLV presented here could both support and complement the existing policies that aim to promote EV adoption. On the one hand, most existing policies launched globally provide financial incentives (e.g., EV purchase subsidies and tax exemptions) and nonfinancial incentives (e.g., charging infrastructure provision) ( 24 , 48 ). The effectiveness of these policies is implicitly corroborated by our findings related to explanatory variables representing the EV ownership type—which implies that higher purchase price hinders EV adoption—and the dynamics of households’ residential status—which suggests that access to charging infrastructure hampers EV adoption.
On the other hand, the findings could provide insights into further complementing the existing policies that incentivize EV adoption. Specifically, most existing policies launched globally are generally based on a one-size-fits-all approach, which may not be equally effective to promote EV adoption across (1) distinct EV types (i.e., HEV versus PHEV versus BEV), (2) distinct vehicle transaction types leading to EV adoption (e.g., trading an existing household vehicle for an EV versus adding an EV to existing vehicles which might increase vehicle use and road congestion), and (3) distinct consumers with heterogenous socioeconomic and latent attitudinal profiles. For instance, the highest return on incentivizing policy investments can be gained by specifically focusing on the socially influenced consumer profile (i.e., those who tend more to consider advertisement and social trend when making a vehicle decision) rather than other cohorts of consumers. However, such policies should be carefully devised, since they will more likely lead to adding an EV—with more tendency toward BEV than other EV types—to the existing household vehicles, which might translate into higher levels of car ownership, car use, and traffic congestion.
Conclusions
The present study contributes to the plethora of research on the consumer adoption behavior of EVs by modeling two intertwined dimensions of households’ (as the decision-making unit) vehicle decision making: (1) vehicle fuel type, including fossil- CVs, HEV, PHEV, and BEV, and (2) vehicle transaction type, including no transaction, sell, add, and trade. To this end, an ICLV is presented to model vehicle transaction and fuel type choice simultaneously from a 10 alternative set of (1) engaging in no vehicle transaction; (2) selling one of the existing household vehicle(s), (3–6) adding a CV, HEV, PHEV, or BEV to household vehicle(s); and (7–10) trading one of household vehicle(s) for a CV, HEV, PHEV, or BEV. To estimate the ICLV model, this study further contributes to the EV adoption behavior literature by collecting a one-of-a-kind RP RVS in the United States in 2018, which asked 1,691 American households about their vehicle decision making and historical changes of socioeconomic attributes over the past 10 years as well as their attitudes and preferences.
The model estimation results could help complement the existing globally launched EV adoption policies that are generally based on a one-size-fits-all approach, which may, however, not be equally effective in promoting EV adoption across distinct EV types (e.g., PHEV versus BEV), distinct vehicle transaction types leading to EV adoption (e.g., trading an existing household vehicle for an EV versus adding an EV to existing vehicles, which might increase vehicle use and road congestion), and distinct consumers with heterogenous socioeconomic and latent attitudinal profiles. For instance, the highest return on incentivizing policy investments can be gained by specifically focusing on the socially influenced consumer profile (i.e., those who tend more to consider advertisement and social trend when making a vehicle decision) rather than other cohorts of consumers. However, such policies should be carefully devised, since they will more likely lead to adding an EV—with more tendency toward BEV than other EV types—to the existing household vehicles, which might translate into higher levels of car ownership, car use, and traffic congestion.
This study uses a sample dataset collected in 2018, which might miss changes in EV consumer behavior since then. To fill this gap, we suggest a future study on developing household vehicle decision-making models by collecting more recent datasets. The comparative analysis of such future studies with the findings of the current study can highlight the possible changes of consumers’ behavior over time, which can also be noteworthy from a policymaking perspective.
Footnotes
Author Contributions
The authors confirm contribution to the paper as follows: study conception and design: Fatemeh Nazari and Abolfazl Mohammadian; data collection: Fatemeh Nazari and Abolfazl Mohammadian; analysis and interpretation of results: Fatemeh Nazari and Mohamadhossein Noruzoliaee; draft manuscript preparation: Fatemeh Nazari and Mohamadhossein Noruzoliaee. All authors reviewed the results and approved the final version of the manuscript.
Declaration of Conflicting Interests
The author(s) declared no potential conflicts of interest with respect to the research, authorship, and/or publication of this article.
Funding
The author(s) disclosed receipt of the following financial support for the research, authorship, and/or publication of this article: This research was funded in part by the U.S. National Science Foundation (NSF; award no. 2112650).
The opinions expressed are solely those of the authors, and do not necessarily represent those of the NSF.