
Abstract
The application of rail buckling models is often limited by uncertain information with respect to track properties, and many conventional models are poorly suited to network-wide or even regional application. Here, a methodology using fuzzy sets is presented that, when trained using buckling data can use inputs of track properties to predict the minimum buckling temperature increase for a particular track. An investigation of the impact of the size of training data and the influence of key track parameters on the minimum buckling temperature increase was conducted, and it was found that a high level of influence stems from the sleeper spacing and fastener torsional resistance parameters. The model was shown to give a low prediction error even for small dataset sizes of training data. The results of this work show the efficacy of a fuzzy sets based model when applied to track buckling prediction data, giving both a low error and rapid calculation times. The approach has potential for application for a wider array of variables, such as track geometry and vehicle dynamics, and is not limited to the study of track buckling owing to the flexibility of the fuzzy inference methodology.
Keywords
The buckling of railway tracks in hot weather presents a challenging problem, being both difficult to predict and severe in its consequences. In the U.K., buckles were reported as early as 1885 ( 1 ) and, despite improvements in the form of the track and efforts toward the characterization, prediction, and mitigation of buckling events, buckles still occur. Historically, buckles have resulted in the loss of life ( 2 ) and still pose a derailment threat ( 3 ), while the damage caused to the infrastructure and delays caused by speed restrictions incur significant costs ( 4 ). A recent total closure of U.K.’s East Coast Main Line on July 19, 2022, exemplifies this, enacted in part to prevent buckling incidents caused by extreme heat ( 5 ).
Buckles in tracks take the form of the track bending out, usually in the lateral direction, as a result of constrained thermal expansion stress in the rail, which occurs most often on hot summer days. The main parameter governing buckling risk is the temperature of the rail. A temperature increase above the stress free temperature of the rail can be reached such that a disturbance of sufficient magnitude causes the rail to buckle, called the minimum buckling temperature increase (
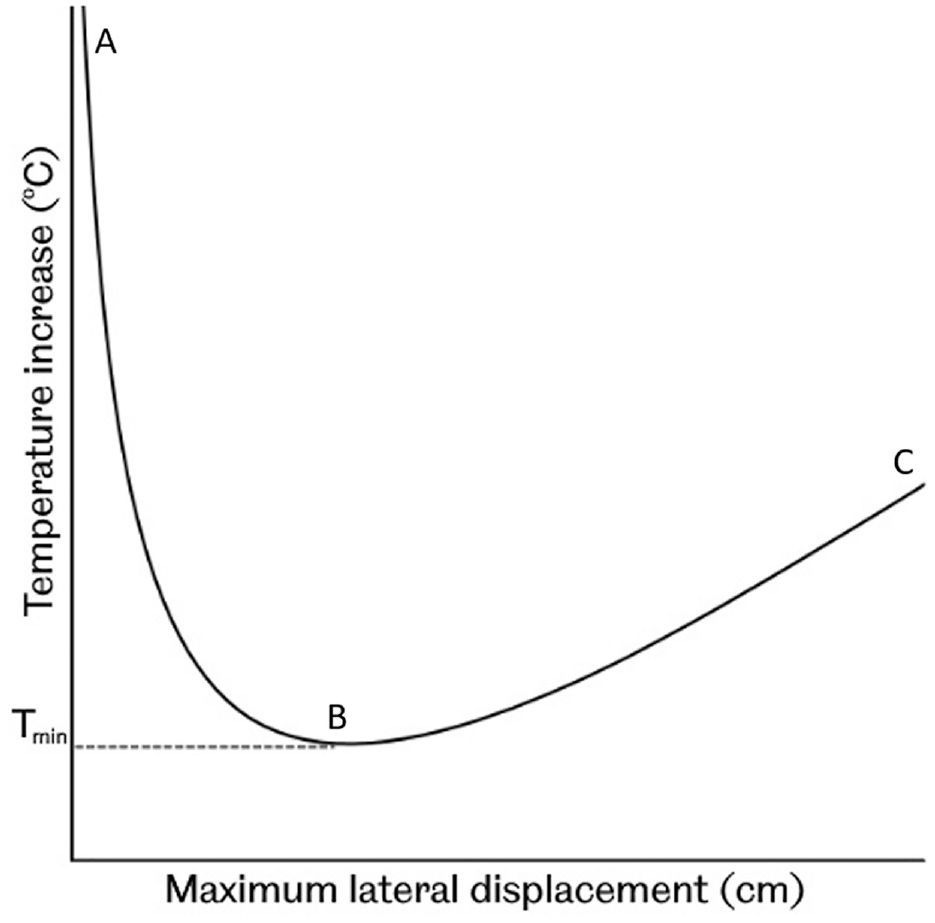
Diagram of a post buckling equilibrium curve.
Experimental approaches ( 6 ) and analytical ( 7 ) and numerical models ( 8 ) have been used to identify the key variables governing the risk of buckling for a particular section of track. Following the critical survey of previous work in the field ( 9 ), Kerr ( 10 ) developed an analysis of lateral track buckling, which was further expanded on in Kerr ( 11 ). The core concepts from these publications served to inform future analyses, which introduced new parameters such as vehicle loads and non-linear lateral resistance ( 12 ), and considered the track as a ladder-type structure ( 13 ).
Despite advances in identifying the main parameters influencing the minimum buckling temperature, significant challenges remain in implementing that knowledge. Complex interactions between the aforementioned parameters necessitate the use of intricate prediction models; however, these often require extensive computing power and are limited in their scope. Another limitation of traditional models is their reliance on experimentally obtained values (e.g., of the resistance of sleepers to lateral movement in the ballast), the determination of which in turn can also be challenging. Because of these factors, implementing accurate predictions of buckling risk either in the field or for an extensive network of railways remains difficult.
As such, there exists a need for a methodology that can offer predictions to the infrastructure manager based on easily accessible information. While knowledge of properties such as the sleeper type, sleeper spacing, or fastener type is easily obtainable, the condition of the sleepers or of the ballast is often more uncertain. Without experimental testing, such properties may in most cases only be described linguistically based on observation using qualitative terms such as “ballast is well consolidated”.
Field Data Interpretation
Table 1 shows typical data from buckling incidents, which is in significant contrast to the well quantified numerical representation of track conditions characteristic of conventional buckling models. A clear challenge exists in linking the uncertain and largely linguistic data on buckling with methods that have predictive capability that may prevent future buckling incidents, such as analytical buckling models.
Examples of Recorded Data from Three Track Buckling Events
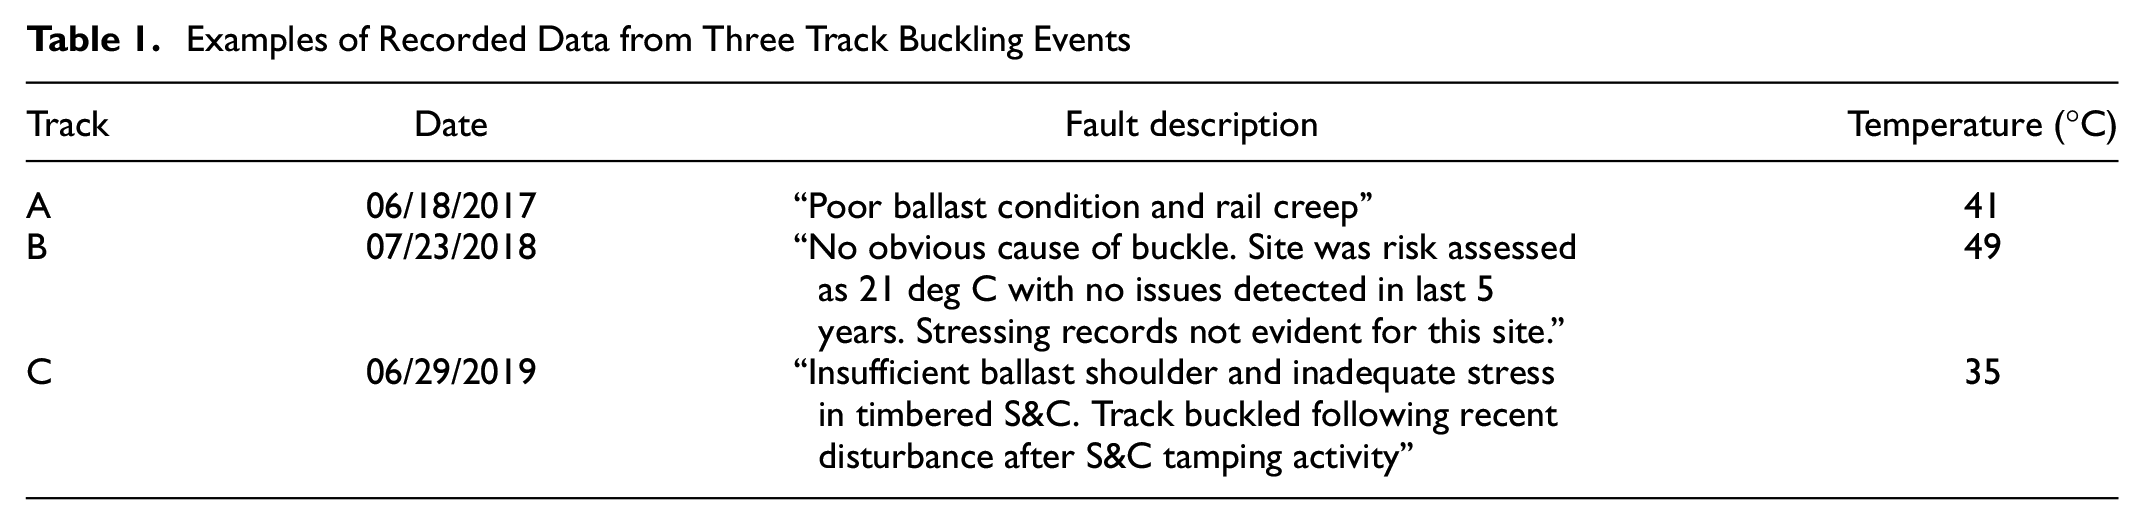
The challenge in using track descriptions as inputs for a prediction model is perhaps best demonstrated by considering the lateral resistance of sleepers in the ballast property of a track. Previous studies have shown that the temperature at which a track buckles is influenced greatly by the lateral resistance that, in turn, is affected by the ballast conditions, the influence of which can vary the lateral resistance by several kNs. Furthermore, while factors such as the consolidation of the ballast, the width of the shoulder, and the level of ballast relative to the sleeper influence the lateral resistance, each of these becomes uncertain after a buckling event, because of the destructive nature of the phenomenon. As such, directly applying recorded data of the type seen in Table 1 as training data for a machine learning approach would yield few insights beyond well-established knowledge. Meanwhile, while conventional buckling models can capture the detailed characteristics of the buckling mechanism, they have no capability to use linguistic data as inputs.
Development of a buckling prediction method that uses field data inputs requires a two-step approach. Firstly, the ability of the modeling technique must be validated for well understood conditions—this is the subject of the work reported in this paper. Secondly, to be reported separately, the model must be adapted to work with the scarce or uncertain data characteristics of field conditions.
Due to the challenges of using recorded buckling incident data as described above, the validation of the modeling technique in this paper has been approached by using training data generated by an analytical model. While such an approach is unconventional, with most machine learning models trained on and validated against experimental or field data, several authors have used analytical models ( 14 ) and finite element models ( 15 – 17 ) to provide training data for a machine learning approach.
Application of Fuzzy Logic
One approach with the capability to address this challenge is fuzzy logic, first developed in 1965 by Zadeh ( 18 ). Fuzzy logic allows for a framework within which non-numerical information (such as linguistic variables) can be linked to numerical values through the use of sets of ascribed “truth values,” known as membership. Unlike classical Boolean logic, which only accepts membership values of true (1) or false (0), fuzzy logic allows for a full range of membership values between 0 and 1. The merit of this methodology in buckling modeling is in using uncertain or vague information, such as linguistic descriptions of track properties ( 19 ), to arrive at a value for buckling temperature that is consistent with the mechanical knowledge or incident data used to train the model. Furthermore, the approach presented here is not computationally intensive, requiring neither significant processing power nor memory usage.
Recently, a fuzzy model was introduced by Gitman et al. ( 20 ), which makes use of experimental data as a base of knowledge, from which a set of rules is derived and serves to approximate the unknown function linking the input and output variables of interest. In the current paper, an expanded version of that approach is applied to the field of railway track buckling with the aim to approximate the minimum temperature increase above which buckling risk exists based on track parameters.
Methodology
The following describes the implementation of a fuzzy sets based model in a methodology predicting the buckling risk of a track. The steps taken by the model, from starting with an initial training dataset to calculating a prediction, are outlined and further supported by an example given in the Appendix.
Application of the Fuzzy Model to Calculate Buckling Temperatures
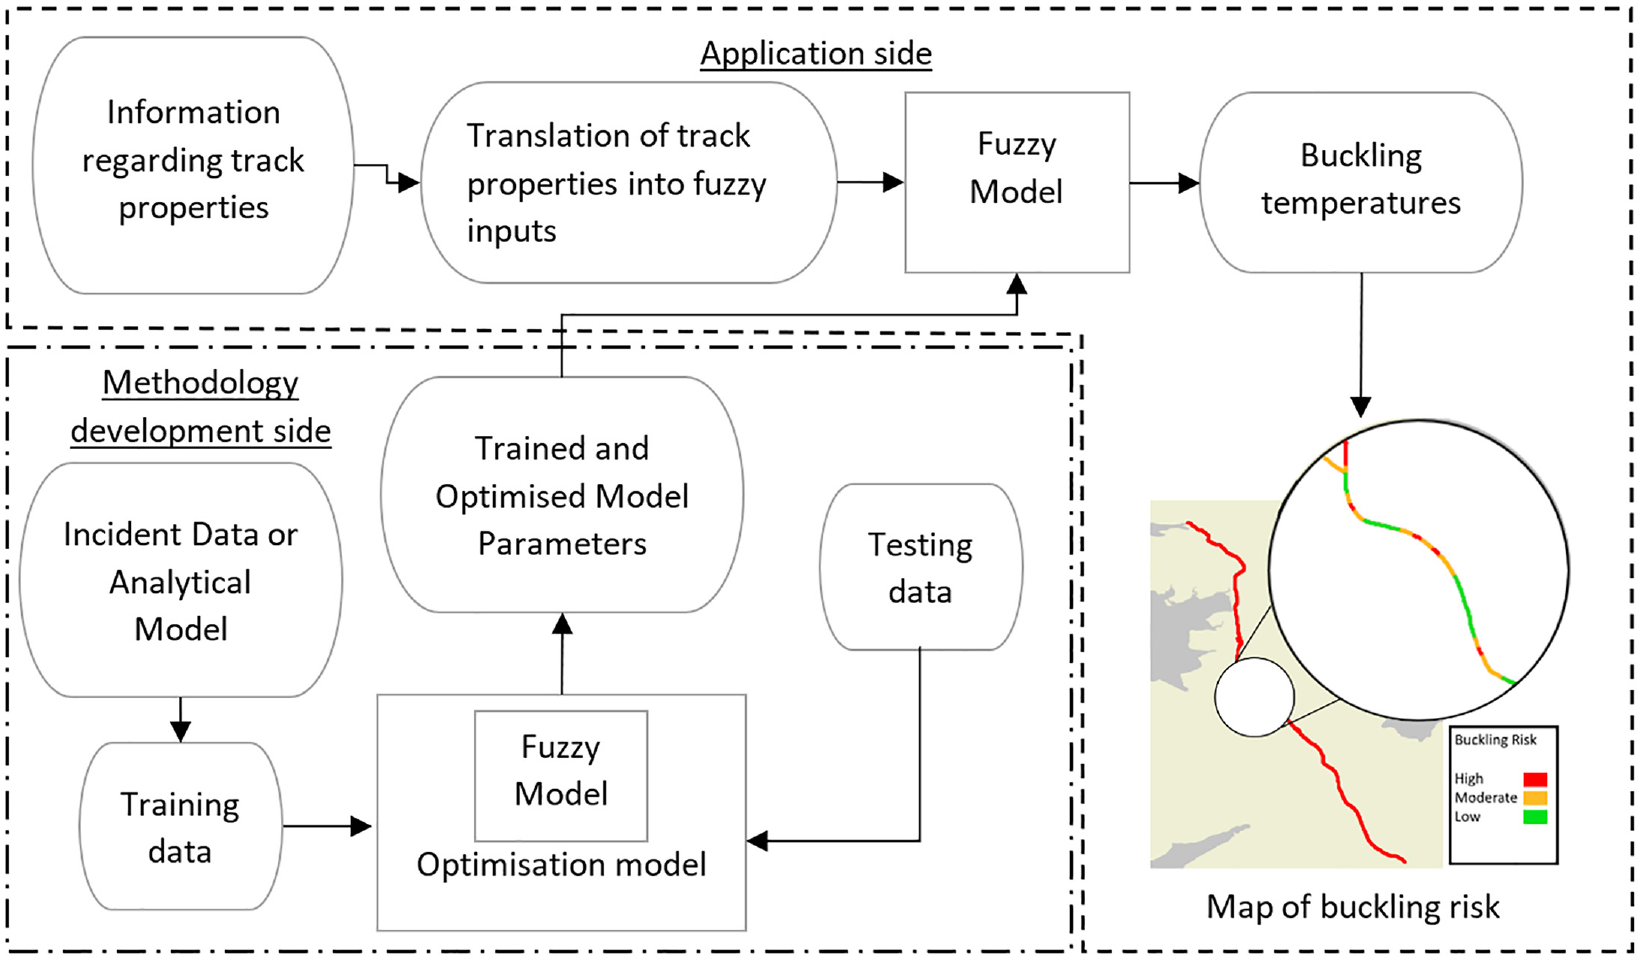
A flow of information describing the application of the methodology to determine buckling temperatures for a section of track is represented in Figure 2. It is an example of how the fuzzy inference model could potentially be integrated in a data acquisition, processing, and prediction framework. The diagram is split into two sections, the methodology development side and the application side. The methodology development section deals with the design of the inference model, sourcing and structure of the training data, and optimization of the prediction of the trained model and is the subject of this paper. Although not in itself part of the scope of this paper, the application side is given for completeness and deals with applying linguistic inputs to the trained fuzzy model, their translation into fuzzy sets, and validation of the generated predictions. Firstly, data comprising track parameters and corresponding buckling temperatures is collected using information from buckling incidents or is generated by an analytical or finite element model. For incident data, a suitable training set is selected from the available rows of data (observations), with each observation representing a track scenario consisting of values of track properties (such as the lateral resistance of sleepers in ballast for the section of track, called inputs) and a resulting buckling temperature for the track (outputs). The remaining observations not used to form the training set are collected in a testing set, used to evaluate the performance of the model. Using an analytical or finite element model to provide the observations limits the predictive capacity of the model to that of the analytical or finite element model used to train it; however, this approach is useful in cases where data of sufficient quality or quantity is not available and has the benefit of control over the input values, which can be selected to have a desired range and distribution. Such an approach was taken in this work (see the Development of Training Data section). Once the training and testing data have been selected, they are passed to the fuzzy model. The fuzzy model, a development on the model first introduced by Gitman et al. ( 20 ), uses the training data to formulate rules representing the function linking track parameters to minimum buckling temperatures. These rules are stored in a matrix of input–output relations and are used to calculate predicted output values for the inputs from the testing set, which are then evaluated against the testing set output values. The prediction error is used as the comparison metric in an optimization loop that modifies the fuzzy model parameters (hyperparameters) to reduce error.
The process and flow of information through the model when applied to an illustrative example location.
The trained and optimized fuzzy model can then be used to accept new input values from a railway operator to predict minimum buckling temperatures. To do this, track property information, both well-defined and uncertain, is collected at the site of investigation. The linguistic values are then replaced with previously defined fuzzy sets and passed to the fuzzy model for prediction. The map of buckling risk in Figure 2 is a hypothetical representation of how the rapid calculation of the fuzzy inference model has potential application at short intervals to produce a map of buckling hotspots that could be used to instruct maintenance work or speed restrictions.
Fuzzy Model Set-Up
The steps taken to create and train the model, comprising fuzzification, construction of relational matrices, and defuzzification, together with some main aspects of fuzzy sets theory, are outlined below. The concepts and equations described in this section are applied in an example in the Appendix, using parameters of sleeper-ballast lateral resistance and fastener torsional resistance.
Fuzzification
A core concept of fuzzy methodology involves blurred boundaries for the membership of variable values (elements) in collections of like values (sets). Contrary to a crisp set, where values are either a full member of the set or a full member of the complement of that set, in fuzzy sets elements may have partial membership in both the set itself and its complement. Consequently, in an “IF
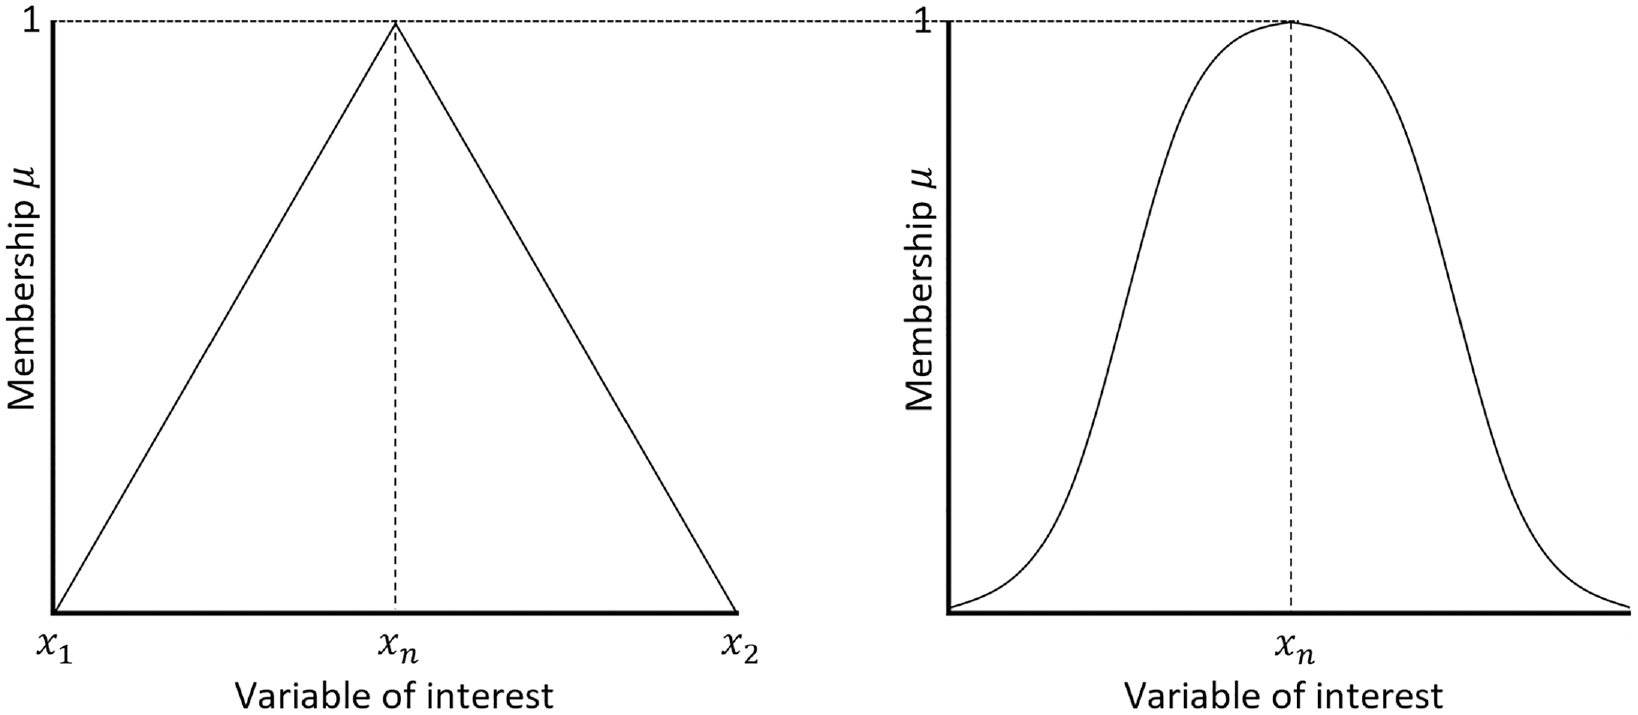
Fuzzy set formed using a triangular and Gaussian membership function.
For a value

where

and

where µ
i
is the value of membership for the
Many different fuzzification functions exist beyond just the triangular shape. For the purposes of this paper, the effect of two commonly used fuzzification shapes (FSs) has been considered, those of triangular and Gaussian shapes. As these concepts may at first appear quite abstract, readers unfamiliar with the approach will find a helpful numerical example in the Appendix.
Construction of Relational Matrices
Fuzzy relations are used to map elements of one set to that of another, such as, for example, lateral resistance values to buckling temperatures. One method of formulating a relational matrix is to employ the Cartesian product of two fuzzy sets, antecedent

where

where the

where
Defuzzification
While a fuzzy set can be a useful output in itself, a crisp value of buckling temperature is desirable to gauge the risk of track buckling. In Equation 5 above,
Many defuzzification methods (DMs) are available, two of the most common being the middle of maxima and centroid. For the middle of maxima method, the highest value of membership in the set is considered and, if it is unique, the corresponding buckling temperature value is taken as the crisp value of the set. If multiple positions of maximum membership are found, the average is taken as the output value ( 22 ).
The centroid method considers the whole fuzzy set and applies the following function:

where
Development of Training Data
Owing to the lack of availability of a large dataset of buckling incidents, in part because of the difficulty of being able to accurately know the track conditions before the buckle occurs, the set of data used here in training the fuzzy model has been created using an analytical model. While overcoming the limitations of a missing high-quality dataset of incidents, such an approach is not ideal, resulting in a fuzzy model that is constrained by the assumptions of the analytical model used to generate the training data.
The model developed by Grissom and Kerr ( 13 ) was implemented in MATLAB to generate a matrix of track properties and a vector of corresponding minimum temperature increases. The choice of model was based on its consideration of the sleeper lateral bending stiffness and the fastener rotational resistance, both of which are shown to have a significant impact on the minimum buckling temperature increase.
The five variables seen in Table 2 were chosen from the Grissom and Kerr model ( 13 ) based on their potential to vary between different tracks and affect the minimum buckling temperature increase. They form the training inputs and were split into fuzzy and crisp categories based on whether the variables are considered continuously distributed and significantly uncertain.
Crisp and Fuzzy Characterization of Variables
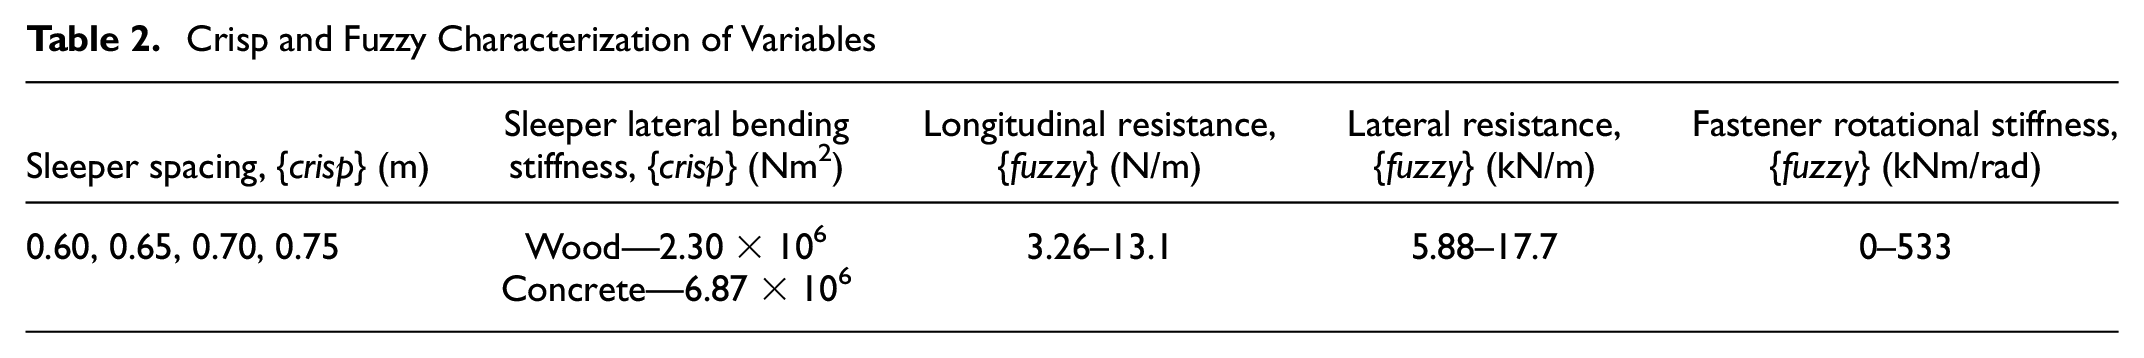
The training data provided by the analytical model consist of a matrix of input values of longitudinal resistance, lateral resistance, and fastener rotational stiffness (see Table 2) and a vector of corresponding
where

where
Testing Method
A testing set of 100 observations, generated by the analytical model, was used to test the predictive capabilities of the model, formed of a matrix of input track properties of the fuzzy variables described above and a vector of minimum buckling temperature increases. A set of 50
Optimization of Hyperparameters
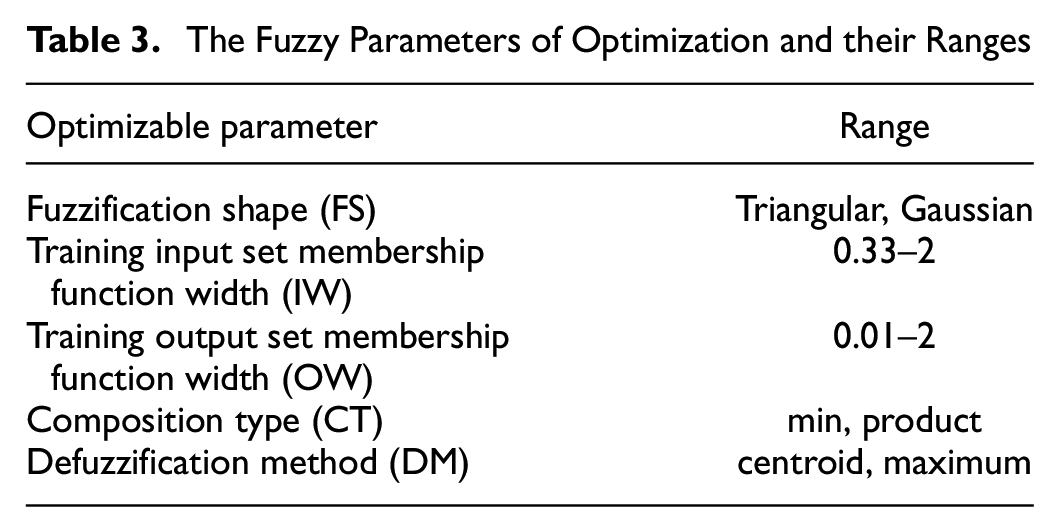
The choice of FS, composition type (CT), and DM options under investigation was based on standard fuzzy model parameters, commonly seen across fuzzy applications, although it should be noted that a wide array of options exists, especially for fuzzification and DMs. The range of IW and OW was based on a consideration of the training data. For the input width, a minimum width of one third of the range (practically
A Bayesian optimization algorithm, bayesopt in MATLAB, was used to explore the available combinations of the fuzzy hyperparameters in Table 3 that minimize the error, using the expected-improvement-plus acquisition method with an exploration ratio of 0.1, over 800 steps ( 23 ). The maximum prediction error was chosen as the objective function, being the largest value of error witnessed when providing predictions for the 100 points of the testing set. The maximum error was chosen as the performance metric to emphasize reducing the error of outlying predictions, by grading the predictive ability of the model on its worst prediction. The choice of Bayesian optimization was based on its favorable comparison with similar methods, such as the grid search method ( 24 ).
The Fuzzy Parameters of Optimization and their Ranges
Results and Discussion
The following section details a comparison of the minimum buckling temperature increase (
Initial Hyperparameter Choice
Figure 4 shows an initial prediction with hyperparameter values of triangular FS, minimum CT, centroid DM, IW of

resulting in
Prediction results offered by the model with initial hyperparameter choice.
Optimized Hyperparameter Results
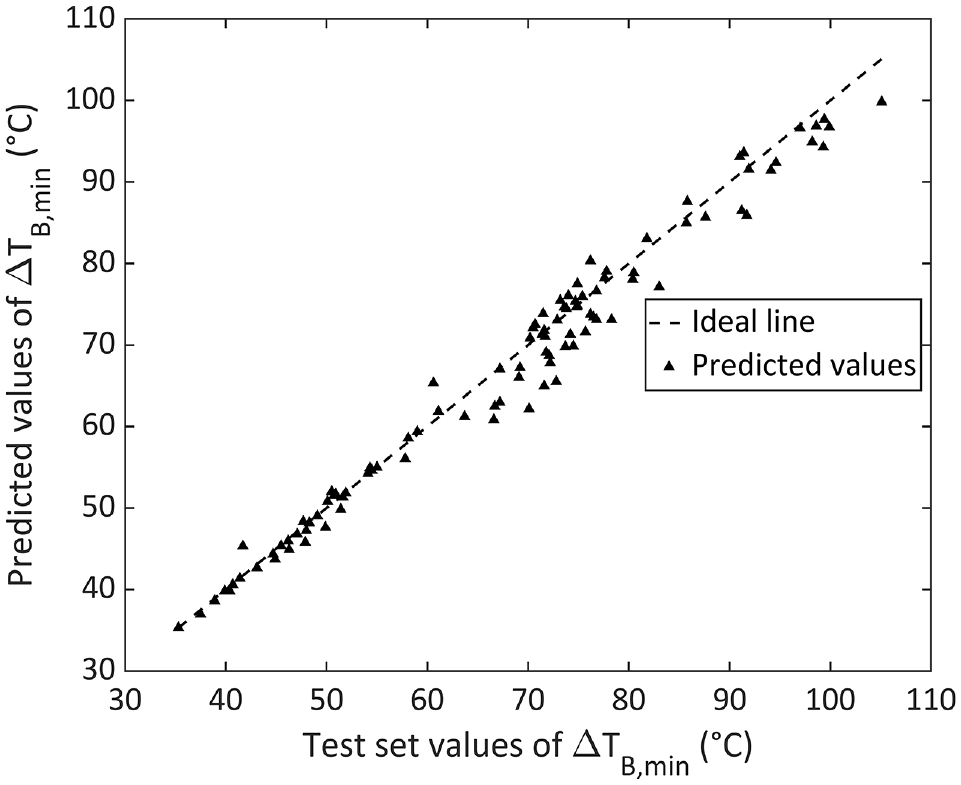
Following the initial results, the Bayesian optimization algorithm described in the Optimization of Hyperparameters section was employed to determine values of the fuzzy model hyperparameters that reduce the maximum error. Figure 5a shows the values predicted by the optimized model, using the hyperparameters of triangular FS, product CT, centroid DM, IW of
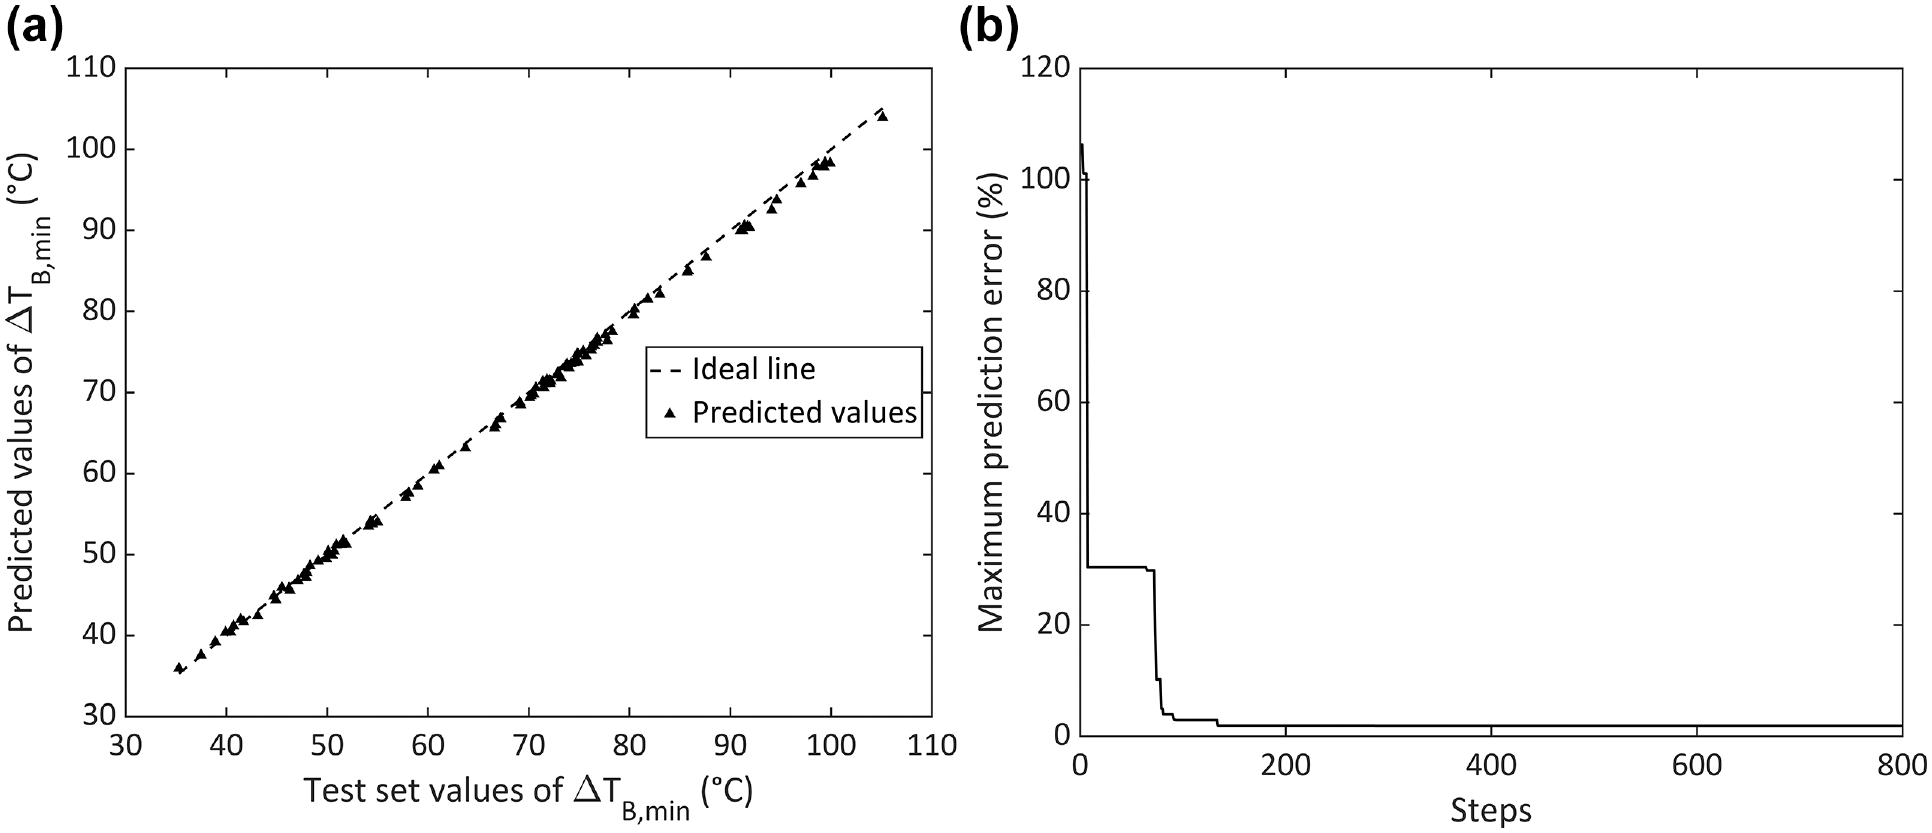
(a) Prediction results offered by the optimized model (top) and (b) convergence of the minimum error (bottom).
This choice of parameters leads to a reduction of error to just 1.90% maximum and 0.898% mean error. The excellent accuracy of these results shows the fuzzy model is capable of faithfully approximating the buckling model providing its training data. Furthermore, the time required for the model to be trained and calculate buckling temperatures for 100 scenarios was just 0.129 s, in contrast to the 30 s calculation time required by the analytical model to calculate a single buckling scenario.
It should be noted that the 0.129 s time is not the time required to optimize the model, which was of the order of magnitude of 60 min. Nonetheless, the rapid calculation time of the model is an important metric, as once the optimization of the model has been performed it does not need to be enacted each time the model is used to predict the buckling temperature for a section of track. Furthermore, the model does not need to be trained, or the relational matrix recalculated, each time it is used for prediction, further reducing the prediction time. Through both accurate results and rapid calculation times, a method such as this could be used to provide buckling risk prediction for a large array of sites, such as a network of tracks.
The convergence of the optimization algorithm, shown in Figure 5b, settles on the choice of hyperparameters before 200 iterations, significantly below the allowed 800 iterations. A rapid convergence is desirable, supporting the choice of values for hyperparameters as being close to optimal for the model.
Two possible methods of reducing the number of iterations taken to find an optimized solution would be to either reduce the number of hyperparameters considered or to reduce the range of hyperparameters under optimization. The second option would require foreknowledge of the range of hyperparameter values leading to more accurate results, which usually is specific to the training dataset and application of the model. As the method aims to be applicable to a wide range of buckling data and scenarios, the variable ranges seen in Table 3 should be used without reduction. The first option, of reducing the number of hyperparameters, offers more potential. The DM, with categorical options of either the centroid or middle of maxima, could be reduced to just the centroid option, thus removing the parameter from consideration by the optimization algorithm. While the middle of maxima method was included here for academic interest and its classical use, it has been seen to provide vastly inferior accuracy to the centroid method throughout testing the model.
Because of considering a lower amount of information (the location of the highest peak of a fuzzy set, rather than both the width and height of the whole set, as done by the centroid method), it is unlikely that middle of maxima defuzzification will offer superior accuracy in other applications of this model. Likewise, the composition of fuzzy sets can be established using either the minimum or the product operator, although the product option has seen consistently more accurate results during testing and is theorized to offer results of quality at least as good as, if not better, than the minimum method for applications of inputs featuring a degree of compensatability ( 26 ). The FS parameter is thought to be significantly dependent on the application of the model and so both options of triangular and Gaussian should be kept, with the potential to expand the pool of fuzzification methods in future iterations of the model, while the input and output widths of the fuzzy sets are dependent on the size and distribution of the training data and so remain free to be optimized.
Analysis of Training Data Size Impact
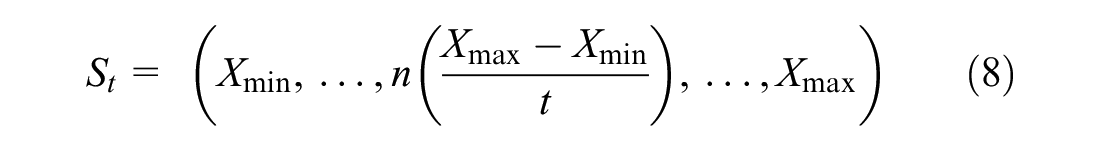
An investigation of the effect of the number of experiments used to train the model was conducted, with each fuzzy variable split into
Figure 6 shows the change in maximum and MAE for increasing numbers of observations, for equally spaced training inputs, when predicting values of the testing set. As can be seen, both types of error decrease consistently with increasing the amount of training data, showing the model is adept at predicting buckling temperatures beyond merely the case presented in the Optimized Hyperparameter Results section. The model has shown robust performance even for low numbers of datapoints, such as the eight observations case (the leftmost point in Figure 6), with the maximum error remaining below 8%. This agrees with the findings presented by Gitman et al. ( 27 ), which show that the fuzzy methodology does not need large sizes of data to obtain accurate results.
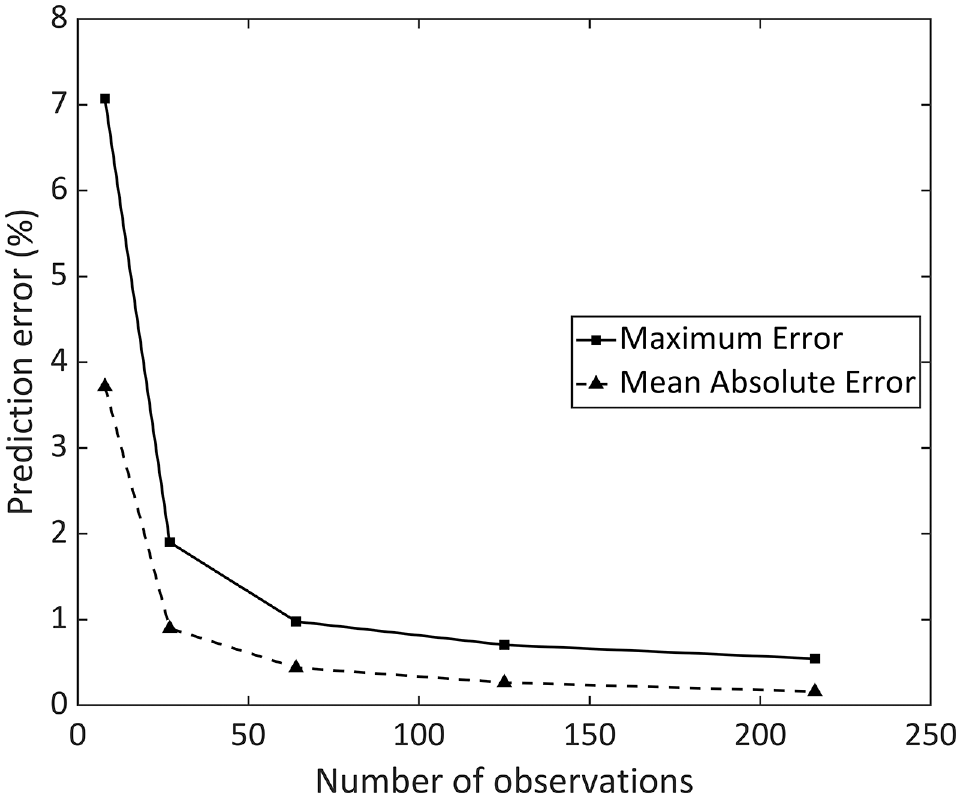
Impact of number of observations in the training set on the accuracy of prediction.
Having considered the accuracy of the inference results it is useful to explore the logistics of training and applying the model. Of particular importance is the prediction time, enacted each time the model is used to calculate an output given new inputs, which has significance for applications on a large scale. For example, for a network of tracks, the prediction time will have a direct impact on the discretization of the network, with long calculation times limiting the lengths of track under consideration. While the configuration of hyperparameters has little bearing on this time, the same is not the case for the size of the relational matrix, resulting from the number of observations and number of variables considered.
Table 4 shows the influence of dataset factors on the prediction time and accuracy of the fuzzy model. For the sake of brevity the opposite impact of the factors has been omitted; however, it should be noted that the opposite of each of the factors mentioned will likewise have a reversed effect on the prediction time and accuracy, for example, decreasing the number of divisions per variable will negatively affect the accuracy.
Impact of Training Data on the Prediction Time and Accuracy of the Fuzzy Model
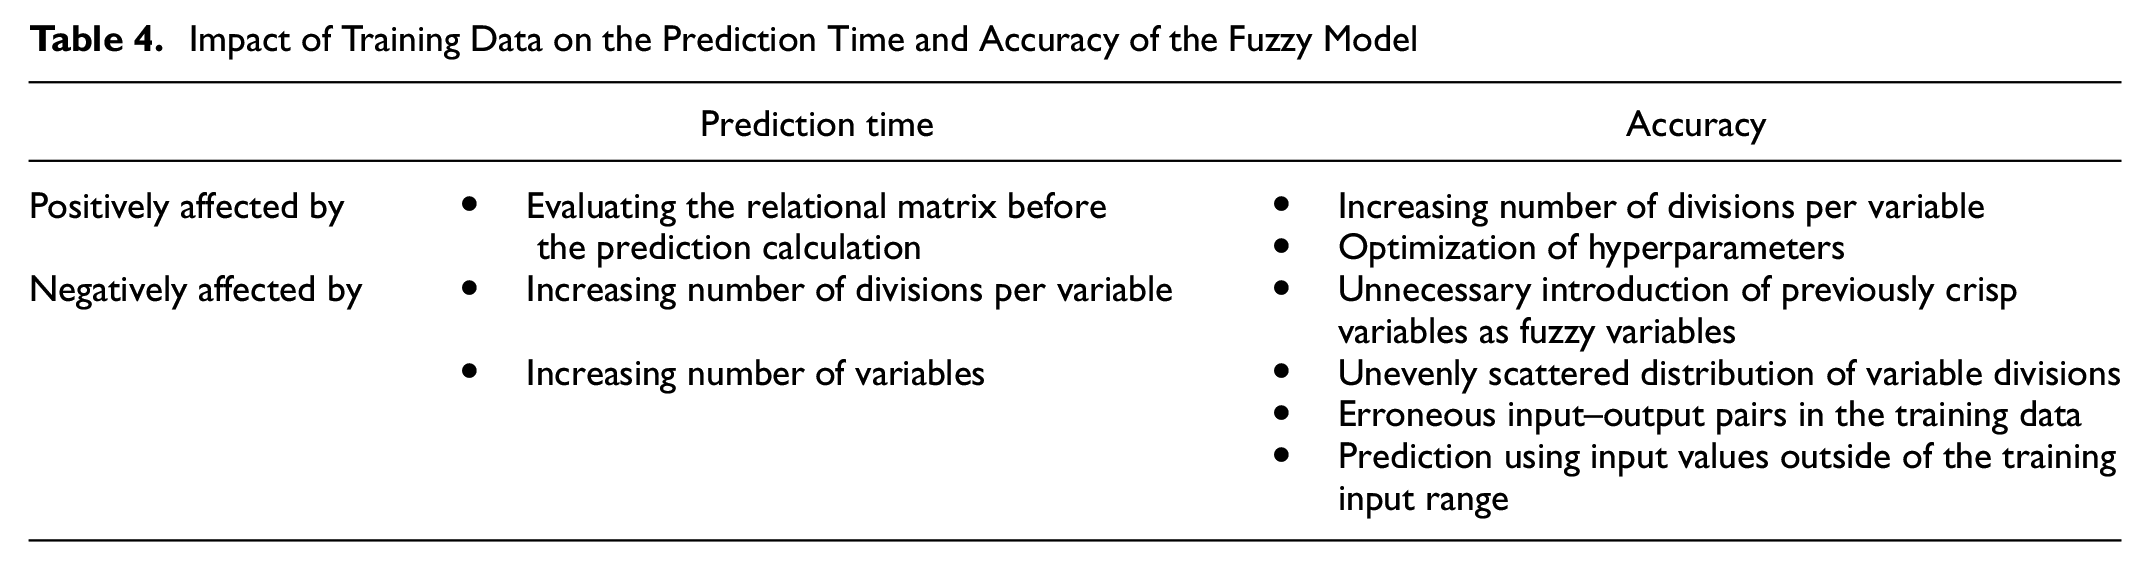
Firstly, based on the low improvement in accuracy from the four-division to the six-division model seen in Figure 6 coupled with the already good accuracy of the two-, three-, and four-division cases, an increase above four divisions offers little benefit while unnecessarily increasing the calculation time. The accuracy of the model is expected to vary across the applications and variables under consideration, and as such an analysis of the impact of data size on the prediction accuracy is an integral part of determining how much data is necessary for an accurate but quick calculation.
Secondly, care should be taken to declare variables as fuzzy only where there is need, where the variable may take any value across the range and may be uncertain. For example, while sleeper spacing can be considered a fuzzy variable (without greatly compromising the accuracy of the model, as seen in the Sensitivity Analysis of Track Parameters section), the spacing of sleepers in a track generally conforms to a standard spacing (for example, 60, 65, 70, or 75 cm) and is unlikely to take intermediary values (such as 67.5 cm) or be vague or uncertain to a significant degree. Therefore, sleeper spacing is a poor choice for a fuzzy variable, unlike parameters such as the lateral resistance, which can vary across a continuous range of values for various tracks and may be highly uncertain.
A further issue of a needlessly large set of training data is the time and resources necessary for its acquisition. Looking at Figure 6, the difference in accuracy between the penultimate (125 datapoints) and final (216 datapoints) instances is a mere 0.16% improvement in the maximum error despite an increase of 72.8% in the size of training data. In this paper a relatively lightweight analytical model was used to provide the training sets; however, for cases where a finite element model or experimental data are used, increasing the number of experiments carried out may be costly without significant benefit to the accuracy of the model while slowing down its calculation time. With this in mind, the influence of hyperparameters and their optimization should be considered first when aiming to improve the accuracy of the model, before looking to increase the size of the training data.
Finally, the choice of the source of training data whether from analytical and finite element models or from buckling incidents should be considered, as it affects both the accuracy and applicability of the prediction methodology. When using training data from a buckling incident on track section A, the application of the fuzzy model for track section B can only be conducted if data is available for all the variables in the training set. Furthermore, the range of the variables in the training set needs to encompass the new input values supplied for prediction, otherwise it will result in a loss of accuracy. A third consideration should be made for the distribution of the training data that, if the values are clustered around a few select points and lack information for a large section of the range for each track variable, will again lead to an increase in prediction error. Each of the three aforementioned conditions is relatively simple to fulfil for data from analytical and finite element models, while posing a challenge for data from incidents, which can be incomplete, limited in scope, low in number, and have erroneous values. Nevertheless, a significant advantage of using data from incidents is its ability to offer insights into the track buckling mechanism, which analytical or finite element models may not account for, being limited by their assumptions. As such, a set of information from buckling incidents that takes into account the considerations mentioned above would be of significant value to the method presented here.
Sensitivity Analysis of Track Parameters
Collecting a comprehensive description of track conditions at sites of buckling incidents is sometimes impossible, especially in the field of track buckling where the event of a buckle often makes it difficult to determine the conditions before the buckle. The following sensitivity study therefore considers the predictions of the fuzzy model as applied to the buckling data generated by the Grissom and Kerr ( 13 ) analytical model. The aim of this study is to investigate the agreement of the trends perceived through the parametric investigation against other publications, thus validating the applicability of the fuzzy inference model. To investigate the impact of missing variables on the quality of prediction of the model, a four-variable training dataset was constructed, with the sleeper spacing introduced as the additional variable. Each variable was split into five equally spaced values, for the ranges seen in Table 2, resulting in a training dataset of 625 theoretical track scenarios. The same optimization algorithm that was used in the Optimized Hyperparameter Results section was employed to determine the values of the hyperparameters and an accuracy of 2.5% maximum error and 1.28% MAE were achieved.
For each variable, the parameter in question was removed from the input training data of the main set, while keeping the values of the output unchanged. Then, inputs missing the parameter under investigation were used to calculate a prediction, which was compared against an unchanged value of the minimum buckling temperature increase of the testing set. The minimum and mean errors of these predictions were then reduced by the respective errors of the main set, resulting in the impact on error introduced to the prediction resulting from removal of the variable of interest, seen in Table 5.
Sensitivity of Prediction Error to Missing Variable Information
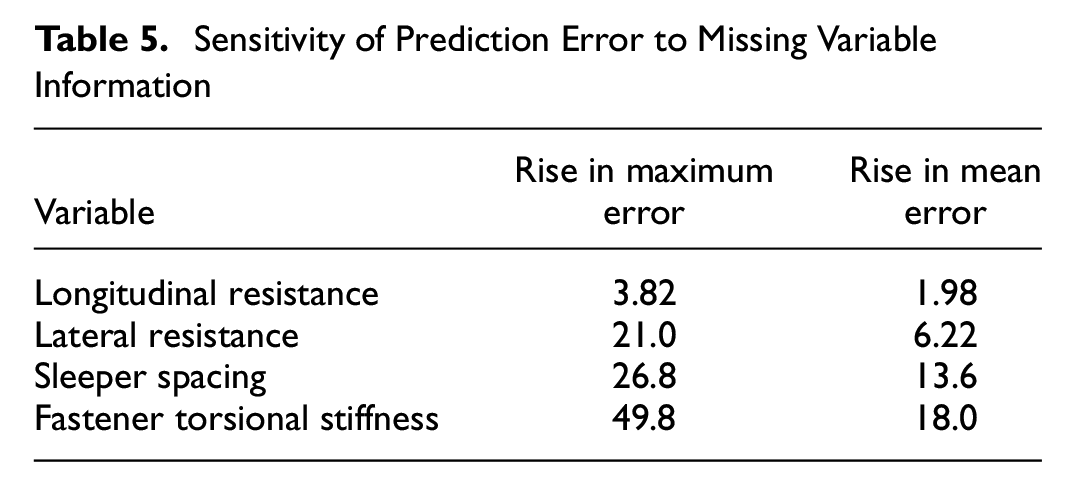
The least impact is seen for the longitudinal resistance variable that, when not considered, only increases the maximum error by 3.82%, thus still giving a reasonable prediction with 6.32% maximum error. This agrees with findings from other parametric analyses, which show that while the longitudinal resistance has an influence on the minimum buckling temperature increase, the effect is small ( 28 ).
The sleeper spacing is seen to have a larger effect than both longitudinal and lateral resistances, showing it is a key parameter when considering the buckling of track. Given that both the longitudinal and lateral resistances of the track rely on the number of sleepers, while the fastener torsional resistance is enacted at each sleeper, a change in sleeper spacing has an effect for multiple different mechanisms opposing the buckling phenomenon. The spacing of sleepers is of particular interest for the lateral resistance property, as the spacing not only influences the lateral resistance of the track as a whole but also affects the lateral resistance of individual sleepers, as seen in Koyama et al. ( 29 ).
The largest impact is seen to stem from the fastener rotational stiffness variable, with the maximum error rising by almost 50%. The MAE also increases by the significant amount of 18%, showing that the reduction in accuracy is not limited to a single difficult-to-predict scenario. Despite a relatively limited amount of research into the influence of this variable, the findings in Table 5 largely agree with Van ( 30 ), Grissom and Kerr ( 13 ), and Samavedam et al. ( 28 ), where high torsional resistance fasteners are seen to have a large impact on the minimum buckling temperature increase. The agreement of this sensitivity analysis with that of the aforementioned publications further supports the applicability of the fuzzy inference model to real-world buckling scenarios.
It should be noted that the analysis offered here only considers a small selection of track properties relevant to the study of buckling of tracks. This selection was made based on the impact of these variables on the safety criteria, that being the minimum buckling temperature increase of the track, which is influenced most by the variables mentioned above, as shown by Samavedam et al. ( 28 ). Other variables, such as track curvature, vehicle loads, and the size of rail imperfections, are considered secondary to the prediction of minimum buckling temperature increase, having been shown to have a greater impact on the maximum buckling temperature increase, and their impact in a fuzzy logic model approach is a matter of further research. Nevertheless, the data presented here allows for a rudimentary comparison between each variable and a ranking of their impact on the buckling risk based on the minimum buckling temperature safety criteria.
Following the success of the model based on its low error and agreement with previous authors’ studies of parameter influence, the future directions include validation against recorded field data and investigating the effect of using linguist descriptions of track, in the form of fuzzy sets, as inputs. The former will further confirm the validity of the modeling technique, while the latter opens up the applicability of the model to account for the uncertainty of track conditions.
Conclusions
In this work, a methodology using a fuzzy inference model for predicting the minimum buckling temperature increase based on track properties has been presented. A high degree of accuracy was achieved with maximum and MAE measures below 1% and rapid calculation times. The method does not rely on large sizes of training data and once trained can be used without the need for knowledge of fuzzy methodology by the operator. The inference method has been applied for training data generated by an analytical model, which offers the advantage over using field training data of calculating the minimum buckling temperature increase, an important concept for prediction of buckling events.
The model shows particularly good results when trained using a triangular membership function shape, product CT, and centroid DM. Increasing the data size has been shown to reduce error, with a significant improvement for increased number of observations at the low range of data size. To achieve a model with less than 1% maximum error, 125 datapoints are shown to be effective, although 64 or 27 points both feature less than 2% maximum error and offer shorter prediction times.
Following further investigation into the use of the methodology with the application of linguistic inputs of track conditions based on engineering experience rather than measured data on condition, the methodology presented here could prove to be an accurate, reliable, and fast method for predicting buckling temperatures for both well-known and uncertain track properties.
Supplemental Material
sj-docx-1-trr-10.1177_03611981231184245 – Supplemental material for Fuzzy Inference Model for Railway Track Buckling Prediction
Supplemental material, sj-docx-1-trr-10.1177_03611981231184245 for Fuzzy Inference Model for Railway Track Buckling Prediction by Iwo Słodczyk, David Fletcher, Inna Gitman and Brian Whitney in Transportation Research Record
Footnotes
Author Contributions
The authors confirm contribution to the paper as follows: study conception and design: I. Słodczyk, D. Fletcher, I. Gitman, B. Whitney; data collection: I. Słodczyk, B. Whitney; analysis and interpretation of results: I. Słodczyk, D. Fletcher, I. Gitman, B. Whitney; draft manuscript preparation: I. Słodczyk, D. Fletcher, I. Gitman All authors reviewed the results and approved the final version of the manuscript.
Declaration of Conflicting Interests
The author(s) declared no potential conflicts of interest with respect to the research, authorship, and/or publication of this article.
Funding
The author(s) disclosed receipt of the following financial support for the research, authorship, and/or publication of this article: The authors acknowledge that this work was completed at the University of Sheffield and are grateful to the Engineering and Physical Sciences Research Council (EPSRC) grant number: EP/T517835/1 as well as Network Rail for funding this work.
Supplemental Material
Supplemental material for this article is available online.
References
Supplementary Material
Please find the following supplemental material available below.
For Open Access articles published under a Creative Commons License, all supplemental material carries the same license as the article it is associated with.
For non-Open Access articles published, all supplemental material carries a non-exclusive license, and permission requests for re-use of supplemental material or any part of supplemental material shall be sent directly to the copyright owner as specified in the copyright notice associated with the article.