
Abstract
The COVID-19 pandemic upended transit use, finance, and management. To investigate these effects two years into the pandemic, we conducted 21 semi-structured interviews with senior managers at transit agencies in the most populous U.S. state, California. We found that the pandemic generated many operational and managerial challenges for transit agencies. Ridership plummeted, then slowly recovered, but is still well below pre-pandemic levels at most agencies. Commuter trips to and from major job centers were especially slow to return. In response to decreased demand, public health concerns, and uncertain finances, many agencies cut services and spending early on. As a result, fare revenues declined, in some cases precipitously. However, federal pandemic relief funds proved essential in filling budgetary gaps, stabilizing finances, preventing layoffs, and maintaining services. Other transit subsidies mostly bounced back robustly. Our interviews suggest that, though California transit agencies experimented with free fares, few fareless programs were made permanent. Their challenges include considerable uncertainty associated with future travel demand, looming financial shortfalls at systems that formerly had high farebox recovery and are still drawing on federal pandemic funds to backfill their fare revenue losses, and protracted labor shortages of drivers and mechanics that are preventing many systems from providing desired levels of service.
Keywords
The pandemic brought on by the Coronavirus Disease 2019 (COVID-19) in 2020 upended mobility around the world, particularly on public transit. The operational and ridership effects of the pandemic—from masking and social-distancing requirements to service cuts to rising fear of crime—were highly visible and have been widely discussed ( 1 , 2 ). Transit finance has received less attention of late, though at points in 2020 it was not at all certain whether many transit agencies would even survive their dramatic fare income and subsidy losses. But following the first tumultuous months of the outbreak and three federal pandemic rescue bills, the financial consequences of the pandemic for transit have garnered far less public scrutiny, though they remain critical to the future of the industry.
How did transit systems perform operationally and financially during the economic and social turbulence characterizing the first year of the pandemic? How have they adjusted financially to a new normal where riders have been slow to return to many systems? To understand and interpret this unsettled time for transit systems and their finances, we present and discuss findings and lessons learned from interviews with 32 staff members at 21 California transit agencies. Gathering feedback from transit agency staff with firsthand experience operating and managing transit in the age of COVID-19 provides a unique perspective on transit operations not available from administrative data sources. We draw on these interviews to consider the opportunities and threats facing current and future transit operations. We highlight major implications of our analysis for transit ridership, labor, finance, and equity.
We begin by describing the trends in transit ridership and fare revenues both before and since the emergence of COVID-19. We then summarize major findings from our interviews and consider the ramifications of these findings for current and future transit operations. We conclude with policy implications for transit operators, funding agencies, policymakers, and others concerned with the future of this venerable travel mode.
Context
Transit Use
Transit systems and their use are asymmetric: systems are unevenly distributed across space, and their use is unevenly distributed across the population. The oldest, largest cities—in California, the U.S., and around the globe—have the largest transit systems and by far the most transit riders, while newer, smaller, suburban, and rural places have relatively small systems and comparatively few transit riders. Travelers of different income levels use different transit modes at different rates. In general, bus riders have lower incomes than other transit users, while commuter rail riders tend to have the highest average incomes and typically use transit to commute into densely developed job centers ( 3 – 5 ) (Figure 1). Local-serving rail modes fall somewhere between. Because most transit ridership is generated by lower-income travelers riding on buses and local rail modes, transit riders as a whole tend to be lower-income ( 4 , 5 ).
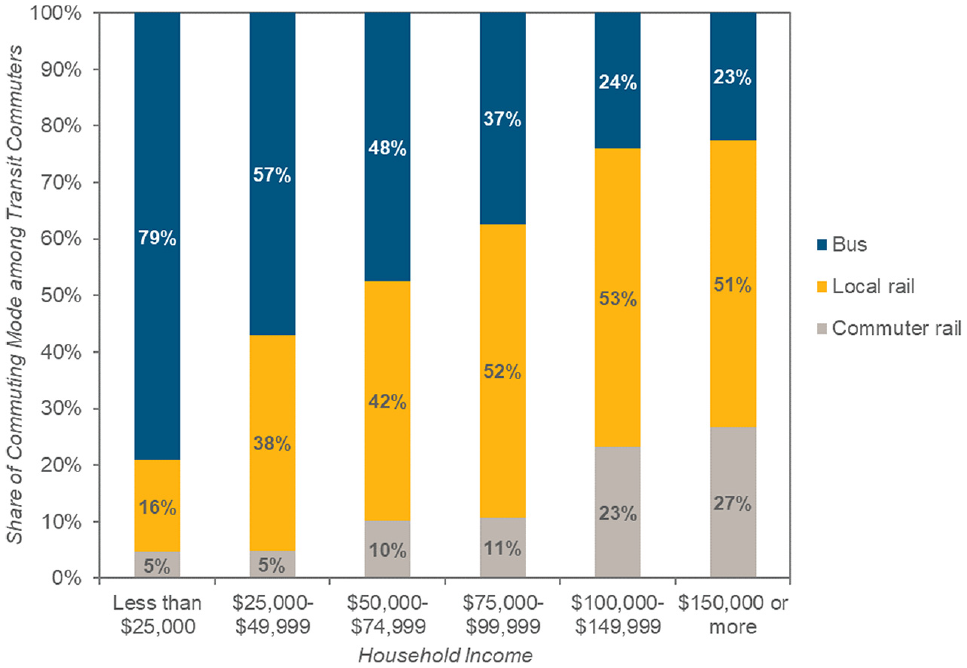
U.S. Transit Commuters’ Annual Household Income by Mode
Total and per-capita transit ridership in California (Figure 2) and in the U.S. has bounced up and down over the past three decades ( 6 ). Ridership peaked just before the Great Recession of 2007–2009 and mostly fell in the half-decade before the COVID-19 pandemic despite a healthy economy. This trend was mostly (in California at least) caused by increased automobile access and use ( 7 , 8 ). For this reason, a return to a pre-pandemic “normal” would not put the industry on solid ground.
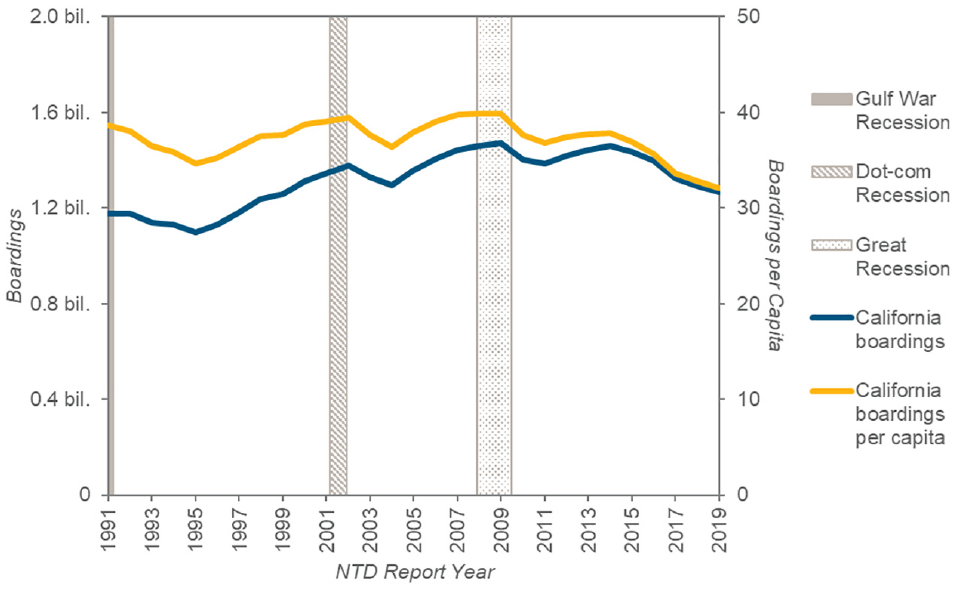
Transit Ridership in California
More so than other means of travel, transit ridership declined precipitously at the start of the COVID-19 pandemic and has been slow to recover since then. Ridership in both the U.S. as a whole and in California (where we conducted our interviews) fell sharply in response to travel and employment restrictions, as well as traveler concerns about contracting COVID-19 while riding transit. Despite public health restrictions being gradually lifted and vaccines and treatments becoming widely available, ridership in 2022 remained well below pre-pandemic levels ( 6 ) (Figure 3).
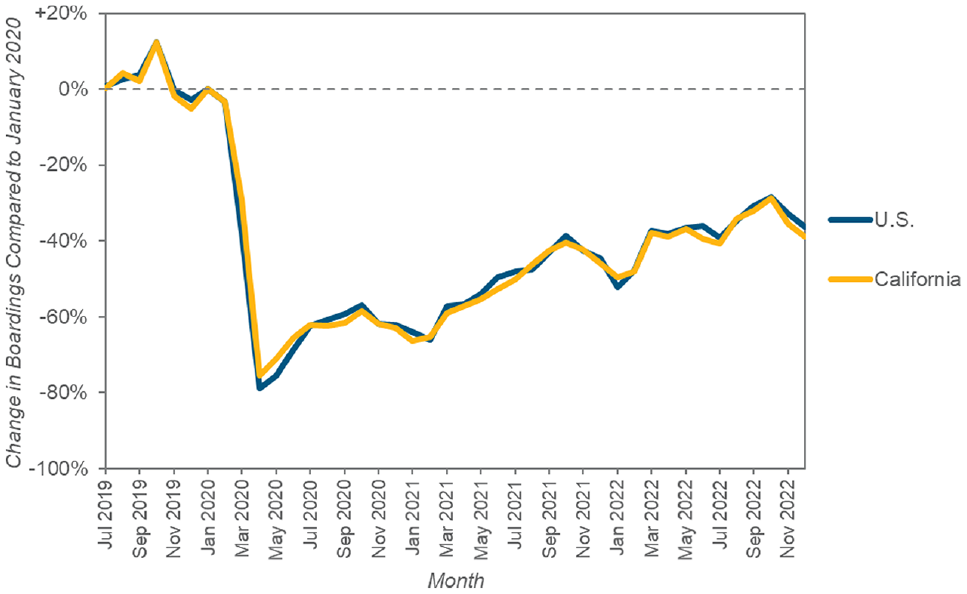
Change in Transit Use during the COVID-19 Pandemic
Transit Finance
Fare revenues largely reflect ridership, although this relationship is imperfect because not all transit users pay the same effective fare per trip. Figure 4 shows that inflation-adjusted fare revenues grew steadily from 2002 to 2016 and then fell just as steadily leading up to the pandemic. During the early months of the pandemic, fare revenues dropped significantly because of both the collapse in ridership and the temporary suspension of fare collection on many systems ( 6 , 12 ).
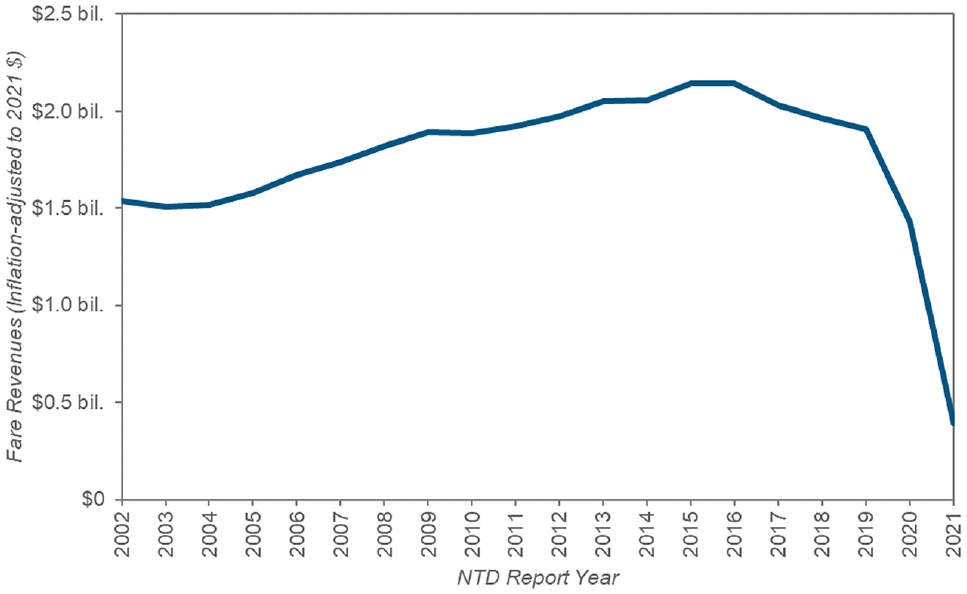
Fare Revenues on Public Transit in California
Significantly depressed fare revenues during the uncertainty and volatility of the COVID-19 pandemic were and remain critical issues for transit agencies. Figure 5 shows that for all of the nearly three decades leading up to the pandemic, fares and other income (such as advertising and charter service revenues) were the second largest source of operating income, after local taxpayer subsidies ( 6 , 12 ). In National Transit Database (NTD) Report Year 2019, the year before the pandemic, fares and other income accounted for more than a third (34%) of all transit operating revenues ( 13 ). However, for smaller agencies and agencies in lower-income metropolitan areas, this share was much lower ( 6 , 12 ).
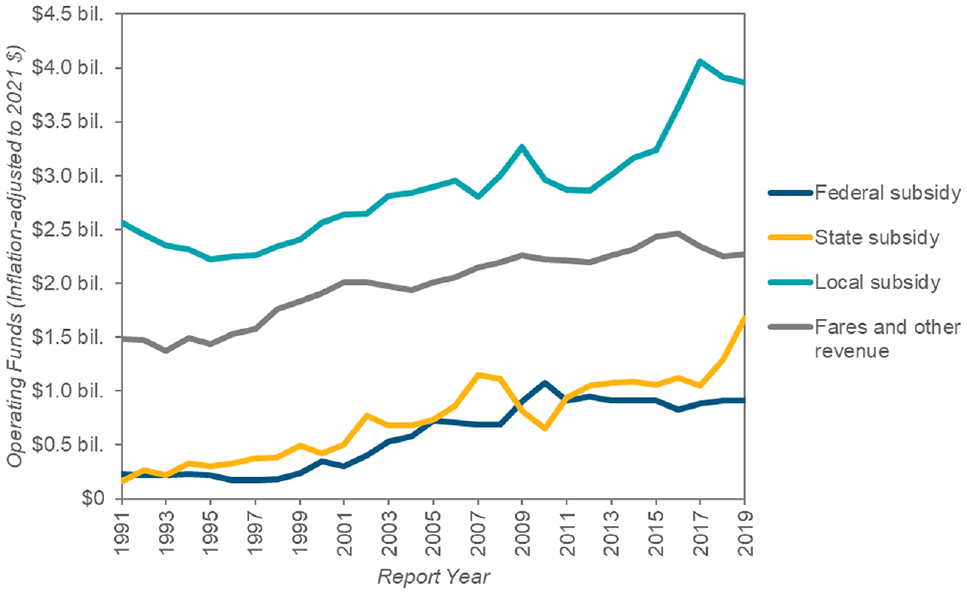
Operating Funds for Transit in California by Level of Government
Given the precarious financial state of transit during the pandemic, the federal government allocated $70 billion in emergency operating support for U.S. transit systems in three pandemic relief bills between March 2020 and March 2021: the Coronavirus Aid, Relief, and Economic Security (CARES) Act, the Coronavirus Response and Relief Supplemental Appropriations (CRRSA) Act, and the American Rescue Plan (ARP) Act. In contrast to established federal subsidy programs that are mostly limited to matching grants for capital expenditures, transit managers were granted significant flexibility in their use of emergency funds (which, depending on the bill, do not expire until 2029 or later) ( 14 , 15 ). We discuss below the importance of these funds.
Yet even as federal funds filled financial holes and other revenue sources such as sales taxes rebounded strongly ( 14 – 17 ), intertwined issues of labor and finance have come to the fore. Even before the pandemic, a tight labor market in public transit was hampering the smooth operation of service throughout the U.S. Drivers had been shying away from the industry because of the often arduous nature of the job; sometimes low wages, limited benefits, or both (though these vary significantly from system to system); fear of assault and confrontations; having to address mental health crises, homelessness, and harassment; growth of competing delivery and shipping jobs that do not require direct customer interaction; and long-term concerns over the prospect of eventual vehicle automation. The COVID-19 pandemic exacerbated many of these concerns and has led to deeper and occasionally crisis-level labor shortages. Transit systems around the country report that they are struggling to retain and hire bus and train drivers ( 18 – 21 ).
With this as context, we set out to explore several, related questions: How did transit financial managers navigate the enormous challenges at the start of the pandemic, and did they adjust their plans and expectations in the two years thereafter? What were the biggest financial and operational challenges early on and since? How does the fiscal state of transit vary across different types of systems? What do interviewees see as the future for their transit system, and what financial challenges lie ahead?
Our analysis builds on the growing literature examining the ridership and fiscal effects of COVID-19 on transit. We add to that literature of falling demand and shifting service ( 22 – 24 ) by gathering and presenting information on how transit agencies have responded to the fiscal challenges presented by the first two years of the pandemic. Specifically, our interviews highlight how COVID-19 increased costs, severely reduced fare revenues, and increased the volatility of other funding sources. We expand on much of the extant literature on the pandemic by using interviews with transit agency personnel to dig deeper than is possible from more aggregate data sources to understand both the specifics of the financial challenges faced by different types of operators and their implications for the longer-term financial viability of public transit.
Methods
We conducted semi-structured interviews focusing on transit operations and finance with 32 staff members at 21 transit agencies large and small across California. Semi-structured interviews have previously been used in transportation research to gather qualitative, affective, and experiential data that offers depth, nuance, and a more open-ended exploration of ideas not possible in most quantitative research. Our sample, although small in absolute size, is larger than other analyses of transit agency finances that also employed semi-structured interviews ( 25 – 27 ). We used a variable-oriented cross-case approach ( 28 ) in which we structured our interviews specifically to elicit information about factors that affected our main variable of interest (transit operations and finance during and coming out of the COVID-19 pandemic) and then used the results to compare and contrast factors reported by interviewees at different agencies.
Our sample consisted of 40 transit agencies in California. While this may limit the generalizability of our findings to other places, California is enormous and remarkably diverse, as are its transit operators. Its 39.5 million residents account for 12% of the U.S. population, and two of the five U.S. urbanized areas with the most transit riders (Los Angeles and San Francisco) are in the Golden State ( 6 , 9 , 29 ). If California were a nation, it would rank 60th in area (between Iraq and Paraguay) ( 9 , 30 ) and 38th in population (about the same as Canada) ( 9 , 31 ), and its economy would rank fifth globally (just behind Germany and ahead of India) ( 32 , 33 ).
Using the NTD ( 6 ), we selected the 20 largest agencies in the state by ridership in the last full year before the pandemic (Report Year 2019). We also randomly selected another 20 smaller California transit agencies that report to the NTD. This sampling strategy ensured that both large and small transit agencies were represented. Both the sample and the 21 agencies that ultimately participated in the interviews covered all major regions of the state. While the financial circumstances facing transit operators outside of California may differ systematically from those examined here, the range of agencies’ sizes, modes operated, operating environments, and revenue sources varied significantly across our sample and thus may offer insights on the fiscal state of transit systems more broadly, particularly in the U.S.
After we selected agencies to contact, we invited at minimum both the general manager/chief executive officer and the chief financial officer/head of finance at each agency to an interview. We gathered contact information for agency staff from Internet searches, California Transit Association contact lists, American Public Transit Association contact lists, and past UCLA Institute of Transportation Studies research projects, as well as from professional contacts of members of the project team. Interviews ranged in number of attendees, from one to five at each interview. At minimum, the general-manager-equivalent or a staffer in financial leadership for each agency was present to represent each agency. One to three members of the research team attended each interview. From the sample of 40, we interviewed 32 staff at 21 agencies (including one that submitted a written response) between December 2021 and May 2022, for a response rate of 53%. We began each interview by inquiring about the state of each agency’s finances and operations at the start of the COVID-19 pandemic, and from there each interview touched on topics that emerged organically from the discussion to encourage conversation and elaboration among those interviewed. These topics included ridership changes related to the pandemic, each agency’s experience with federal COVID-19 stimulus funds, and each agency’s experimentation with fare policies in recent years. We found, for the most part, remarkable similarities in responses across agencies, though with a few notable differences; we highlight both in this analysis.
The project team conducted all the interviews via Zoom videoconferencing software, enabling the team to customize interview questions as necessary and helpful but also providing a degree of consistency across interviews. While we worked from an interview guide to cover a fixed set of topics (including, among others, the immediate effects of the pandemic in spring 2020; the stimulus bills; budgetary, workforce, and service responses as the pandemic continued; capital projects; and fare policies), the semi-structured nature of the interviews allowed the interviews to be flexible in allowing follow-up questions about topics or issues raised in a particular interview.
While we have every reason to believe that the 32 staff who took the time to speak with us were candid in their responses and assessments, it is possible that some may have been inclined to cast their agency in the best possible light. Conversely, those interviewed might have told us what they thought we may have wanted to hear, though we were careful to present our interviews as information gathering not driven by particular hypotheses or a priori positions. Finally, we note that we spoke with senior agency staff in leadership positions, particularly as they relate to agency finances. Thus, our characterization of their views in this paper reflects those of agency leaders, not governing board members, rank-and-file workers, nor transit riders, and our findings should be interpreted in this light.
Findings
Rather than report on the results from each of the 21 interviews separately, we have organized our results around five principal findings that collectively emerged from our interviews. Most of these findings were consistent across our interviews, although we note the few instances where responses from different agencies substantially diverged. We refer to specific interviews from which different claims and quotations are drawn as numbered in parentheses with a prefix of “I-.”
Federal Stimulus Funding for Transit Operations
Emergency federal assistance was vital and successful in addressing many of the immediate operational challenges facing transit agencies at the height of the COVID-19 pandemic, but this three-time funding is not a long-term panacea.
As with most of U.S. society, the pandemic largely caught transit agencies unawares. None of the transit managers with whom we spoke reported anticipating or having contingency plans for rider and fare revenue losses of the magnitude caused by the pandemic (I-14). Many systems cut or adjusted service. And although the staff at many agencies expected some form of emergency federal support to be provided, before Congress passed the stimulus bills, that support was by no means guaranteed (especially the second and third bills). The potential impacts of the pandemic on local non-fare sources of revenue were also uncertain. Early in the pandemic, the high level of uncertainty over fare revenues, local sources of operating funds, and federal assistance was a serious issue for most agencies (I-20). The uncertainty contributed to what one interviewee described as an “existential crisis” (I-5), and most found themselves in crisis response mode early on. Even after the formal approval of the CARES Act in the first month of the pandemic, many transit managers remained concerned with and took steps to maintain sufficient liquidity to fund ongoing operational needs, as relief funds were not immediately available to agencies on passage of the act (I-8). For many agencies, this included dipping into operating reserves (I-19).
The pandemic not only affected ridership and revenues but agency costs as well. On the cost side, service cuts in response to falling ridership and public health demands in turn reduced operating costs. In some cases, reductions in traffic levels allowed agencies to accelerate capital projects, which lowered overall project costs. On the other hand, many interviewees told us that various costs increased during the pandemic. For example, pandemic-related infrastructure, such as plastic barriers to shield vehicle operators and heightened cleaning and other sanitation measures added to costs. Many interviewees also reported seeing cost increases related to the purchase of personal protective equipment and, in at least one case, providing breakfast and lunch for on-site employees in an effort to prevent the spread of COVID-19 among agency staff who might otherwise eat at restaurants (I-3). Finally, some capital projects faced delays and cost increases, from supply chain issues or because some projects required multiple people to work close together at a time when COVID-19-related work restrictions did not permit it (I-4).
In the face of this upending of transit operations and finance, the federal stimulus funds provided much-needed support and stability. Federal operating funds were essential to the financial health of transit agencies during the pandemic by helping them, according to one interviewee, “ameliorate the damage” wrought by COVID-19 (I-8). Many of the interviewees were explicit in calling out the pivotal role played by these federal pandemic relief funds. Looking back, if the bills had not passed, interviewees told us that their agencies would have taken drastic actions, to the detriment of their service, their employees, and ultimately their riders. The most common responses were that agencies would have cut service (in many cases, quite severely), laid off staff, or both. At agencies that did make service or labor cuts, interviewees asserted that those reductions would have been even worse. As one interviewee told us, “Without federal stimulus funds, [our agency] would have had to cut routes.” Federal funds in this way allowed agencies to avoid what that interviewee described as a “death spiral” of reduced service leading to declining riders and fare revenues leading to more reductions in service (I-7). Descriptions of the importance of the federal funding ranged from helping agencies avoid “real difficulty” (I-12) to the claim by a senior-level staff member at a large transit agency that they simply “couldn’t have survived” without the federal pandemic relief funds (I-8). In short, federal emergency funds allowed transit agencies to keep operating through the worst of the pandemic (I-4).
The amount of stimulus funds allocated to each urbanized area was set by formulas in each bill, though the formula in each one differed. However, within a few parameters, the federal government generally left the division of funds between agencies within an urbanized area to metropolitan planning organizations (MPOs), the bodies ordinarily tasked with long-range regional planning and distributing federal transportation capital funds. This meant that there was competition within MPO regions for a limited pool of federal funds (I-5). In larger regions with many overlapping transit systems, agencies had to compete with one another, while in smaller urbanized areas, a single operator was the only eligible recipient and did not have to compete for the funds at all (I-3). Different MPOs established different allocation rules; at least one divided funds among county transportation commissions within their jurisdiction, which each in turn came up with their own distribution formulas. Some allocated funds based on pre-pandemic allocation rules established for federal capital funding (I-10); others divided stimulus dollars proportionate to pre-pandemic operating expenses; still others based allocations at least partially on real or anticipated ridership/revenue losses and/or on demonstrable need (I-20). At least one MPO incorporated an “equity adjustment” that increased the relative share of funding allocated to agencies serving vulnerable populations (I-4, I-20). In many cases, these rules shifted over the course of the three stimulus bills. Interviewees at smaller agencies tended to report a greater share of their needs met by federal stimulus dollars, though this experience varied, sometimes substantially, across agencies. But in some cases, larger “legacy” operators were entitled to greater shares of federal dollars, per their MPO’s pre-pandemic rules, and to other specially earmarked sources of funds, leaving out smaller operators (I-18). In at least one region of the state, the fairness of the allocation formula used by the MPO to divide up federal stimulus funds became a major policy issue (I-4, I-20).
Despite (or perhaps because of) this competition among some agencies for federal relief funds, regional coordination among agencies and with MPOs on service and finances deepened during the pandemic (I-1, I-10). In some cases, this coordination literally paid off: agencies cooperated to increase their collective leverage during negotiations with federal authorities over pots of discretionary stimulus funds (I-5), and some agencies not entitled to federal funding before the pandemic were able to work together to successfully negotiate with their MPO for additional funds from non-federal sources (I-1). Looking to the future, this collaboration has led transit agencies in at least one large region to discuss proposals for generating new regional sources of transit funding (I-4).
In sum, the federal pandemic relief funds for public transit proved to be a critical component of transit finance during the pandemic. For the most part, operators spent stimulus dollars on operational costs of service—primarily labor (including for higher-than-normal sick leave use and overtime for remaining operators to cover shifts missed by others) but also maintenance and overhead. The funds covered many expenses specific to COVID-19 as well or were even used for capital projects. Further, increased capital funding for transit allocated in the 2021 infrastructure bill allowed flexible federal pandemic funds to last even longer than they would have otherwise.
But such emergency funds were three-time and not ongoing allocations. As a result, many of the agencies interviewed had already expended or would soon expend all their federal funds as of the winter of 2022. Even those agencies with substantial reserves of funding expect them to be expended in the next two or three fiscal years (I-3). Indeed, as noted by a few of those interviewed, the federal pandemic relief finding did not address longer-term issues related to labor availability, supply chain issues, or the generalized cost of transit service increasing faster than the inflation rate.
Strong Rebounds of Non-Fare Transit Funding Sources
Funding sources other than fare revenues and federal pandemic funding largely returned to normal for most transit operators.
Revenues from sources other than fares, including local, regional, state, and federal subsidies, have proved much more resilient since 2020 than fare revenues. These come from a wide variety of sources, including local option sales taxes for transportation and dedicated local parking fees.
During the earliest months of the COVID-19 pandemic, most non-fare revenue sources dropped as well and were backfilled by federal pandemic relief funding. This allowed transit agencies to “hunker down” and “watch what was happening over time” rather than respond hastily to conditions that were likely to change soon regardless (I-21). But despite often dire warnings about collapsing tax revenues early in the pandemic, most non-fare sources of transit revenues began to bounce back after a sharp dip in the spring of 2020, as the partially-closed economy roared back to life. The exact amount of funds agencies would receive from these other revenue sources was, however, an additional source of uncertainty in the 2020–2021 fiscal year but less so thereafter (I-1). Sales tax revenues for transportation rebounded particularly strongly (I-5). In some cases, the early loss of sales tax revenues affected agencies more than fare revenue losses, as sales taxes constituted such a large percentage of transit funding for many California agencies. But by late 2021 and early 2022, sales tax receipts proved “outstanding” for many agencies (I-13) and exceeded the financially “conservative” projections for them developed before the pandemic (I-8). With some federal stimulus dollars still left on hand, some agencies put significant shares of sales tax revenue into reserves to allow pre-pandemic levels of service to continue even if fares and ridership remain sluggish for several years to come (I-13, I-14).
Fare Policies
Fare policies for many operators changed during the early stages of the COVID-19 pandemic, although this dramatic shift has largely been reversed.
Many agencies eliminated fares or at least fare enforcement as a public health strategy early in the pandemic (I-1, I-8, I-13, I-14). Eliminating fare payment both benefited the lowest-income riders and reduced physical contact among riders, payment equipment, and transit agency personnel. It also allowed for rear-door boarding on some systems, which increased the spacing of riders and drivers. Despite increasing calls for fare-free transit from riders’ groups and advocates on equity grounds, however, nearly all agencies that eliminated fares during the pandemic restored them as restrictions on travel were lifted and vaccines became available.
Interviewees highlighted two reasons why their agencies are not planning to eliminate fares permanently. First is the cost of eliminating fares. This includes foregone fare revenues and opportunity costs of those fare revenues, although these are at least partially offset by savings in fare collection and enforcement. As one interviewee surmised, eliminating fares or at least fare enforcement would not necessarily lead to significant reductions in labor costs related to fare sales, use, and enforcement, if labor is then reallocated to other functions rather than reduced (I-19). In addition to reducing fare revenues, fare-free policies may increase ridership—a benefit for transit’s climate and mobility goals, to be sure, but one that could increase costs of service provision.
For paratransit, interviewees generally expressed the view that demand would increase substantially should fares be dropped. Paratransit tends to have very high per-passenger operating costs because of high labor costs that are spread across a small rider population ( 34 ). In addition, rules surrounding unionized transit labor limit the extent to which transit agencies can flexibly deploy labor to match patterns of rider demand ( 35 ). For these reasons, many of those with whom we spoke told us that they expect that increased demand in response to free fares would increase costs for their systems substantially and unsustainably.
For this reason, going completely fare-free is simply “not on the table” for many agencies (I-15). Regardless of the benefits, costs, and tradeoffs of general fare-free transit, few are even considering it, largely because of the cost. Several interviewees argued that agencies would need a “sustainable” revenue source for fare-free transit to be a viable policy option (I-3), and systems by and large do not currently have such a revenue source. Federal emergency funds allowed many agencies to eliminate fares during the worst stages of the pandemic, but moving forward, agencies would either need increased subsidies to replace fare revenue losses, to pare down service to reduce costs, or some combination of the two, which is likely to be politically fraught (I-12). Arguments by advocates about the social equity of fare structures complicated conversations about eliminating fares (I-20) but ultimately did not sway them. Of current attempts to expand fare-free transit, many are funded by a third party, such as a school system or college/university (I-8). Indeed, education-related programs were also one of the more common types of targeted free-fare programs in place before the pandemic (I-10), and one that interviewees commonly mentioned expanding or considering expanding.
Second, some interviewees cited operational benefits of charging fares and expressed a desire to maintain them. Some staff mentioned an observed rise in homelessness on fare-free vehicles, especially given increases in homelessness during the pandemic. In the view of several interviewees, many housed travelers stopped riding transit, decided not to start riding, or felt unsafe when they did ride, because of the behaviors of some unhoused riders (or those perceived to be unhoused). Many of these staff acknowledged that unhoused people had fewer or no other places to shelter but also described a lack of capacity in the transit agency to assist unhoused riders without diverging from transit’s core mission. Interviewees also suggested that increased drug use, crime, and mental health episodes on vehicles were consequences of fareless transit, and safety came up as a common response. These tied in, too, to labor issues: according to driver surveys cited by interviewees in agency leadership, bus operators reported feeling unsafe during fareless periods and ill-equipped to address behavioral issues onboard that interviewees attributed to fare suspensions. This issue also demonstrates the way in which gaps in the social safety net related to housing, healthcare, and jobs, some of which were laid bare by the pandemic, can spill over onto public transit ( 36 – 41 ).
Agencies are nonetheless reexamining their fare policies more broadly, with some expanding existing targeted discounted or free passes or adding new ones for groups such as youth, students, and low-income travelers. But full fare-free transit is not part of medium-term agency plans, despite—or perhaps because of—the pandemic experiment. With regard to the reported social problems on vehicles that arose from fare-free transit related by many of our interviewees, we lack the data to evaluate to what degree these consequences actually flow from suspending fares. But—importantly for the future of transit finance—many staff with influence on fare policy believe they do, especially after the pandemic. By contrast, interviewees generally did not bring up benefits of fareless transit, such as increased ridership, reduced vehicles miles traveled in cars, and decreased citations of and violence toward riders of color ( 42 , 43 ).
For better or worse, fare changes related to the pandemic represent a period of substantial experimentation ( 42 ). Before the pandemic, fare policy changes were typically incremental, entailing mostly small increases to keep up with rising costs. In addition to fare-free trials, other fare experimentation in the pandemic has included new forms of payment media, such as by enabling riders to pay through virtual tickets stored on their smartphones as well as regional integration of fare payment across different agencies (I-14).
Labor and Equipment Shortages
An industry-wide shortage of bus drivers, train operators, mechanics, and equipment in 2021 and 2022 was a far bigger constraint on transit service supply than financial shortfalls.
As noted above, federal funds were particularly important in mitigating layoffs, furloughs, and service cuts early in the pandemic. For agencies, the federal pandemic relief funds came with requirements and expectations by federal authorities that preventing layoffs was a high priority. Given that labor constitutes the majority of operating costs for most transit agencies (I-1) ( 13 ), “the first thing” the federal funds were used for at most agencies was preventing layoffs (I-20). In addition to genuine need, agencies were encouraged by federal or regional officials to spend funds quickly because considerable political capital had been expended in assembling and delivering emergency funds for transit. Transit managers perceived a need for haste in part because delays in spending funds would potentially increase perceptions among voters and politicians that those funds were not necessary (I-10). Though federal funds prevented layoffs, many front-line staff still left during the pandemic for reasons other than fiscal shortfalls. Some workers voluntarily retired or went on furlough because of health concerns, and some agencies implemented salary freezes or hiring freezes and offered early retirement options and buyouts that pushed or pulled workers out and depressed new hiring (I-4). In addition, the pandemic’s effect on transit systems may also have contributed to job losses in private-sector transport when contracted services, particularly for paratransit, were cut back because of depressed demand during earlier stages of the pandemic (I-18).
Since the start of the COVID-19 pandemic, agencies have had significantly increased difficulty in attracting and retaining labor, particularly bus drivers, train operators, and mechanics. Nearly every agency staffer with whom we spoke told us that labor issues have “absolutely” affected service (I-9). This includes both ad hoc cancellation of vehicle runs and formal cuts to routes and service or delays in restoring them (I-20). During the height of the pandemic lockdowns when demand was at its nadir, agencies needed fewer personnel because of reduced service, so the challenge was to avoid laying off workers. Because of this, hiring slowed. However, some interviewees told us that slow or delayed hiring in earlier months of the pandemic meant that when labor needs increased as businesses reopened and riders began to return, agencies fell behind in hiring (I-1). As a result, many transit agencies reported competing for front-line staff with other transit agencies, as well as with trucking companies. While this issue existed before the pandemic, it has been significantly exacerbated since (I-20) ( 20 ). Labor shortages have resulted in agencies needing to pay drivers more overtime, to offer signing bonuses, and to increase wage rates during contract negotiations or even mid-contract. Even so, with current levels of inflation, scheduled increases in wage rates are likely to be insufficient to compensate for rising costs (I-4), posing further challenges to recruiting and retaining labor.
Competitive pay and benefits are likely to remain an issue moving forward, in large part because some agencies, in the view of senior staff, offer wages that are “on the lower side,” making those driver positions less competitive with comparable positions in the private sector, such as with trucking firms (I-15). The very high costs of housing in many California cities compound this recruiting and retention problem (I-10). Some of those interviewed suggested that, in the long term, vehicle automation may reduce the demand for vehicle operators and in this way lower labor costs for agencies. The extent to which this occurs in practice will of course depend on many factors, including the development of autonomous vehicle technology, the extent to which labor is reduced rather than reallocated by agencies in response to vehicle technology, and how transit agencies’ use of vehicle automation is influenced by labor rules negotiated with transit labor unions.
In addition to affecting the cost of living for transit workers, pandemic economic conditions affected transit finance and operations through material and equipment shortages and cost increases. Supply chain issues led to delays in new vehicle deliveries and shortages in fare collection equipment, tires, and other vehicle parts and equipment (I-10). Overall rises in prices, including for fuel, also contributed to rising operating costs (I-9), which combined to increase project expenses and lengthen project delivery timelines (I-1).
These factors also contributed to concerns among our interviewees about meeting California’s state-mandated transition to zero-emission fuel vehicle fleets (though this state-specific requirement does not apply to paratransit services, which are frequently contracted out in any case) (I-12). Several of those interviewed reported that they were having financial or other difficulties in developing the facilities infrastructure needed to electrify their fleets (I-1). One respondent told us that their agency had struggled with decisions about the costs of vehicles operating using different alternative fuels. Over the long run, the agency must transition to hydrogen fuel cell vehicles to meet its emissions targets, but the costs of hydrogen fuel cell vehicles are currently very high. Hydrogen fuel cell vehicles are also much less readily available than battery electric vehicles. The interviewee’s agency will be unable to pilot alternative fuel vehicles until the fuel source issue is resolved (I-13).
The Outlook for Transit
Transit’s future remains very uncertain, as future demand, the service needed to meet that demand, and revenues from fares all remain very much in doubt.
As the COVID-19 pandemic progressed, related decreases in transit demand led to service reductions on many systems. Thus, reduced fare revenues were at least partially matched with reduced operating costs. As noted above, however, labor, equipment, and fuel unit costs eroded those savings, sometimes considerably, and many costs of service delivery remained fixed. Some service cuts focused on coverage, and others on frequencies (I-17, I-20). Some agencies eliminated service entirely for some period, such as on Sundays; many others reduced service on Saturdays and/or Sundays (I-3, I-10). Other agencies focused reductions on particular types of services, such as commuter-focused routes or on regional-serving (rather than local-serving) services (I-5). For demand-responsive paratransit services, service changes frequently meant shifting from shared rides to single rides for public health reasons. This simultaneously increased already high operating costs while reducing capacity (I-1). Many of these service reductions were implemented almost “overnight” in response to changing conditions (I-4).
Yet some agencies did not respond to decreased demand with reduced service. In at least one case, a regional commuter-focused rail service experienced significant reductions in demand but did not cut service because of its prior obligations to cities and counties (I-5). Still other agencies sought to keep service as intact as possible. We also heard from our interviewees that transit agencies that were successful early on at avoiding layoffs or furloughs and that avoided significant freezes on hiring have been better able to weather the subsequent labor shortages (I-1).
Service reductions in response to declining demand typically focused on fixed-route, fixed-schedule services rather than paratransit. Commuter services were a particularly common target for service reductions during the height of the pandemic, and, according to several of those interviewed, many commuter services are still operating at reduced service levels or have been eliminated entirely (I-9, I-13, I-14, I-15, I-21). Agencies were more limited in their ability to reduce paratransit services in response to declining revenues because transit agencies are mandated under the Americans with Disabilities Act to provide paratransit service within three-quarters of a mile of fixed-route transit lines (I-8).
Transit ridership has recovered since the dark, early days of the pandemic, but patronage remained well below pre-pandemic levels on most systems, at the time of writing (Figure 3). Given this, many agencies fully restored service (and increased associated costs) to better serve their current riders and lure back more. But others still operated at reduced levels, particularly agencies that previously served many commuters. Most of the agency staff with whom we spoke reported having restored service at least partially in anticipation of ridership returning, although we did speak with staff at one agency who reported largely restoring service in response to increased ridership (I-19). Agencies have timed service restorations to coincide with the operations of major businesses and other activity generators. For example, the Anaheim Transportation Network timed its service restorations to coincide with the reopening of Disneyland, a major trip generator for the agency. Other agencies added back service to coincide with school reopenings (I-15).
Disadvantaged travelers were among the last to leave and first to return to transit. “Choice” commuter riders, by contrast, have been slow to return, both because of health concerns and because of substantially increased levels of telecommuting. Higher-income riders have more travel alternatives than those dependent on transit and are also more likely to be employed in jobs that allow them to work from home. For many agencies, “once [commuter demand] dropped, it never came back” (I-7). Several agency staff also reported that weekend and leisure transit trips have returned faster than commute trips, particularly to office centers (I-4).
At some agencies, loss of commute trips had a disproportionate effect on transit fare revenues because commuters tend to pay higher-than-average fares (I-3). Some agencies also experienced decreases in corporate subscription fare passes bought by firms for their workforce. (One agency reported that companies that (generously) did not ask for refunds for unused passes in 2020 or donated their passes to community organizations provided substantial revenue at the worst of the pandemic.) (I-5). Because of this lagging commuter demand, systems previously shuttling many commuters to and from higher-wage downtown jobs had higher farebox recovery rates before COVID-19 but are now struggling more (I-4, I-5, I-12). Conversely, agencies generating lower levels of farebox recovery pre-pandemic both had less to lose and tended to recover riders more than high-farebox-recovery systems.
Uncertainty about future transit demand makes proactive service planning difficult (I-4, I-9). There is considerable uncertainty as agencies proceed with decisions about the sizes of vehicles to purchase (I-20), routing and scheduling of lines, and longer-term agency goals. Future ridership demand will be strongly related to the extent that the impacts of the pandemic represent fundamental changes or temporary blips. How current ridership patterns (and therefore costs) will continue to evolve is an open question, according to many with whom we spoke. If changes in demand are related to pandemic-related factors that resolve over time, a return to pre-pandemic demand and operations is possible. For example, student ridership declined as schools closed early on and largely returned as schools reopened (I-17). However, even a return of pre-pandemic demand levels would not address longer-term structural issues causing ridership to erode in the years leading up to the pandemic, as discussed above.
If the pandemic-related depression in rider demand proves enduring, both transit service and finance will need to be rethought. This may mean investing in different modes, vehicle types, or routes; it may also mean accepting lower baseline levels of farebox recovery. Given the large amount of uncertainty in 2022, as interviewees relayed that usual models and expertise in demand modeling are not sufficient, some agencies reported engaging in scenario planning that considers a variety of different futures, though most have not (I-4, I-5, I-12, I-15). It may well be that the very process of considering different transit futures will increase agencies’ capacities to adapt quickly to continued uncertainty in the years ahead.
Discussion and Conclusion
Our interviews with 32 staff at 21 California transit agencies highlighted the most important factors affecting transit operations and finance during the pandemic. One positive takeaway from this dark time is that a major federal public policy intervention worked; in California, the stimulus bills largely kept public transit financially afloat and able to serve many of the state’s most disadvantaged travelers through an enormously challenging time. However, no federal supplements to these operating funds are planned.
During this turbulent time, transit agencies have had to navigate a veritable sea of uncertainty in managing the exigencies of the pandemic. Transit agencies continue to deal with unstable fare revenues and in a few cases volatile changes in other revenue sources. While conditions had stabilized considerably by early 2022 when we conducted our interviews, the future of transit demand, service to meet that demand, and funding to pay for it all remain very uncertain. On top of this, transit managers must contend with structural issues that in many cases originated before the pandemic and have continued in it: rising automobile use from both the rise of ridehail and increasing vehicle ownership, particularly among former frequent transit riders; the continued suburbanization of the population to car-friendly, transit-hostile environments ( 7 ); rider perceptions about the safety and quality of transit service; and persistent issues of labor availability and compensation.
The transit systems with highest farebox recovery before the pandemic tended to be larger systems that carried many downtown commuters, in addition to serving the general mobility needs of those without access to cars. These systems tended to recover fewer of their riders as the pandemic progressed and incurred the proportionally greatest losses in fare revenues as a result. Such systems are most likely to face fiscal crises in the years ahead. In addition, the continued shrinkage in the role of fare revenues in transit agency finances points to a future where notions of user-fee finance are increasingly antiquated. Our interviews collectively suggest that one area ripe for innovation is fare policy. The pandemic demonstrated en masse that transit users and systems can adapt to different fare policies. In several ways, the pandemic demonstrated the value of technology-enabled fare media that simultaneously make transit use easier, eliminate the costs of managing physical fare media, and reduce the potential for fare collection to serve as a disease vector. It was also a demonstration of how free- and reduced-fares are viable and frequently popular (among riders more than transit agency personnel, apparently) if fare revenue losses can be backfilled by tax subsidies from other sources. Technological innovation will only continue to make innovation in fare policy and payment even easier, in no small part by increasing the availability of real-time ridership data ( 44 ). Given these many changes, more research is needed on how fares and fare payments might be shifted or eliminated to attract riders to transit post-pandemic.
Even so, one of the institutional outcomes of the pandemic over the long term may be an increased awareness of the necessity and desirability of experimentation and flexibility in transit service provision. More generally, the COVID-19 pandemic has demonstrated that transit service “provides a need, not a want” (I-3) by highlighting the reliance of low-income riders on transit service. The critical importance of serving the needs of those who remained riding buses and trains in the pandemic, who depend on public transit for basic mobility, and who are more likely poor, immigrants, and/or people of color, was cast in the sharpest possible relief. The early public health travel restrictions underscored both the importance of transit in transporting essential workers and the significant social costs incurred by the most vulnerable among us when quality transit service is less available. This argues for minimum levels of transit service quality to ensure that the most vulnerable travelers can reach needed destinations in the months and years ahead.
Footnotes
Acknowledgements
This research was generously funded by California Statewide Transportation Research Program. The authors are grateful for this support. We also thank the 32 transit professionals who sat for interviews and patiently answered our many questions. Without their time, this paper would not have been possible. Finally, we thank John Gahbauer for his help with the larger project of which this research is a part.
Author Contributions
The authors confirm contribution to the paper as follows: study conception and design: J. Wasserman and B. Taylor; data collection: H. King and J. Wasserman; analysis and interpretation of results: H. King, J. Wasserman, and B. Taylor; draft manuscript preparation: H. King, J. Wasserman, and B. Taylor. All authors reviewed the results and approved the final version of the manuscript.
Declaration of Conflicting Interests
The author(s) declared no potential conflicts of interest with respect to the research, authorship, and/or publication of this article.
Funding
The author(s) disclosed receipt of the following financial support for the research, authorship, and/or publication of this article: This research was made possible through funding received by the University of California Institute of Transportation Studies from the State of California through the Public Transportation Account and the Road Repair and Accountability Act of 2017 (Senate Bill 1), as part of the California Statewide Transportation Research Program (grant number UC-ITS-2022-15).
The authors are responsible for any errors or omissions. The opinions expressed in this paper are those of the authors and not those of the University of California Institute of Transportation Studies or the government of the State of California.