
Abstract
A significant percentage of pedestrians walk in social groups (friends, families, or acquaintances who walk together). Although patterns generated by social interactions among group members have been shown to affect crowd dynamics, studies on the effect of social interactions at different crossing phases under low pedestrian density are limited. This study aims to comprehensively examine the influence of size and sex composition on pedestrians’ behaviors when walking alone and with friends in different phases before, during, and after the road crossing. For this, experiences were carried out with controlled small groups of friends (varying size and sex composition) at three unsignalized crosswalks with low pedestrian density. The average speed and distance between the young pedestrians in six segments of the trajectories (two in each phase), extracted from video recordings, were analyzed with linear mixed models. Results show that pedestrians reduce their speed when approaching the curb, they accelerate while on the crosswalk, and reduce again when they reach the other side. In all phases, the average speed of the groups was lower than the single pedestrians, and the females’ groups walked slower than the males, except during the crossing, where no sex-related differences were found. On the contrary, before the crossing, the distance increased and decreased from the second segment in the crosswalk. The smallest distance was observed between the female groups and dyads. These findings have relevant implications for research on pedestrian behavior, helping to better understand the complexity of pedestrian dynamics and improve pedestrian safety.
Social interaction plays a significant role in shaping the walking behavior of pedestrians, particularly on crosswalks or on sidewalks where they frequently have to adjust their path to accommodate others. Furthermore, pedestrians often walk in small social groups, comprising individuals with some kind of social connection, such as couples, friends, or families ( 1 – 4 ). The coherent movement of these groups is influenced by social rules that impact their walking dynamics. They share the same destiny and intentionally walk together, avoiding splitting ( 5 , 6 ). Social groups within a pedestrian flow can range from two to six individuals, but most frequently have only two or three. Groups with more than four members have a tendency to split into single individuals, dyads, and triads ( 7 – 9 ). A possible reason for this is that in big groups, people tend, for the sake of efficiency, to focus communication only on the surrounding elements ( 3 ). It has been reported that the formations they adopt and their walking speeds facilitate communication, even though this may hinder the task of moving through a flow of pedestrians ( 3 , 10 , 11 ).
The behavior of social groups has been mainly analyzed in two scenarios: (i) in normal conditions (i.e., non-emergency and non-mass events), such as crowded commercial walkways or corridors connecting a train station with a shopping center ( 3 , 6 , 9 , 12 ), and (ii) more complex scenarios, such as during evacuation processes or mass events ( 13 – 16 ). In most of these studies, the observed difference between individuals and groups was related to the need of the latter ones to maintain cohesion, to facilitate social interactions and communication ( 3 , 17 ). Notably, the majority of them were conducted under medium to high population densities, and thus tthe results obtained could have been explained mostly by the effort required for the groups to stay together. Most importantly, to our knowledge, no study has ever addressed crossing behavior. This is an important gap in pedestrian behavior research, considering the prevalence of group walking and noting that road crossing remains one of the most safety-critical moments in everyday urban walking.
Pedestrian behavior during interaction with vehicles is critical because it directly affects the likelihood and severity of accidents. The high number of pedestrian crashes at unsignalized intersections and the likelihood of severe injury or death owing to pedestrian vulnerability have led to extensive research aimed at understanding how pedestrian–vehicle interactions occur at such crosswalk locations ( 18 ). For example, different behavioral factors that could lead to pedestrian–vehicle collisions have been investigated, including drivers’ compliance with pedestrians’ right of way on zebra crossing and age-driven pedestrian crossing behavior, focusing on motor skills (speeds and trajectories) and decision-making (accepted time gap to cross) ( 19 ). Factors affecting pedestrians’ crosswalk decisions have been investigated such as position and speed of the approaching vehicle ( 20 , 21 ) or the influence of the built environment (perception of comfort and safety) ( 22 ). Quite strikingly, the behavior of social groups when approaching road crossings remains largely unexplored. The goal of this research is thus to explore walking and road crossing behavior of social groups of different sizes and sex compositions. The study is focused on urban contexts in streets with low pedestrian density and in normal conditions.
Pedestrian group walking behavior can be categorized according to walking speed and spatial organization. To interpret these variables correctly, three interrelated levels of analysis must be considered: the individual level (personal factors), the external level (environmental factors), and the group level (social factors) ( 1 , 23 , 24 ).
Concerning personal factors, some studies have related demographic characteristics, such as age and sex, to variations in walking speeds. For example, several studies have shown that walking speed declines, on average, with increasing age ( 25 – 28 ). Moreover, on average, men walked faster than women ( 8 , 27 ).
Beyond personal dimensions, external factors associated with the environment where pedestrians walk, can also influence walking behavior. These include the geographic locations, cultural and traffic regulations, infrastructure characteristics, the presence of obstacles, and traffic conditions ( 23 , 27 , 29 ). As regards social factors, there is substantial evidence that variables such as group size and sex composition influence the walking speed of groups of pedestrians. Social groups are on average slower than isolated individuals and speed decreases as the group size increases ( 27 , 30 , 31 ). This may happen because individuals in social groups become distracted while talking to each other, or they may adjust their speed to the slowest member ( 3 ). Nessler and Gilliland ( 32 ) suggest that people with similar leg lengths, when walking side by side tend to unconsciously synchronize their stepping, which can, in turn, affect their walking speed. There is also evidence that the speed of pedestrians’ groups significantly depends on the surrounding pedestrian density level, with people in groups walking faster at lower densities ( 6 ). Concerning sex, there seems to be a tendency for male groups to walk more “scattered” than female or mixed groups, and walking speed was highest for male triads compared with mixed and all-female triads ( 7 , 27 ).
Researching pedestrian crossing behavior can be challenging owing to the multitude of factors that influence it and that are difficult to control. Many studies found in the literature use field observations as a data collection method. These provide the most naturalistic results about the movement and behavior of street users. However, crossing situations in realistic settings are highly variable. Many observations are necessary to obtain statistically significant conclusions, making data collection and analysis time-consuming. Additionally, individual characteristics of pedestrians are difficult to capture with this method ( 23 ). Contrarily, the effect of particular factors can be easily observed and analyzed using controlled experiments. These are predominantly used to study the operational movement behavior of pedestrians. However, it is often challenging to ensure that data collected in a laboratory can represent real-life pedestrian behavior or be transferable to different situations ( 23 ). Semi-controlled studies may be a valid compromise between controlled and naturalistic approaches. These experiments take place in real settings, but the researchers can assign participants to groups, select the route, and define the tasks, while participants have freedom to decide if, when, where, and how to perform them ( 33 ).
The complexity of pedestrian behavior also poses challenges for data analysis. To address potential unobserved heterogeneity across different study sites and individual pedestrians, several pedestrian behavior studies have employed multilevel or hierarchical statistical models in field observations or controlled experiments with repeated observations from each participant. These models include frequentist or Bayesian frameworks such as linear mixed models (LMM), generalized linear mixed models (GLMM), and Bayesian multilevel models (BMM) ( 34 , 35 ). The choice of statistical framework depends on various factors, such as the research question, data, model complexity, and researcher familiarity with each framework ( 36 ). Frequentist frameworks are suited for scenarios where computational efficiency is relevant, simpler models are appropriate, well-established normal distributions exist, or when researchers are more familiar with these methods. Bayesian frameworks are preferable when modeling complex relationships and temporal dependencies, incorporating prior knowledge, non-normal distributions, or complex random effects structures ( 35 – 37 ). In this study, we selected a frequentist approach, specifically LMMs, as they are aligned with the data characteristics and research question and have proven effective in modeling multilevel data on pedestrians' crossing behaviors ( 34 ).
In this sense, this work intends to study the influence of size and sex composition on pedestrian behavior when walking in a group in urban areas in normal conditions with low pedestrian density and the difference in the pedestrian behaviors of the groups in three phases: before, during and after crossing the road. For this, semi-controlled experiences were carried out in three urban sites in Guimarães, with small groups of young pedestrians (1, 2, and 3) who had a defined path to walk, varying group size and sex composition.
The work contributes to an improved understanding of how speed and distance between pedestrians vary at different phases of street crossings, when walking in social groups. The resulting insights are relevant to improve simulation techniques, optimize pedestrian facilities, and assign more realistic values in modeling the operational behavior of pedestrians to develop effective strategies for reducing accidents and improving safety for road users.
Method
The experimental approach used in this study is divided into three steps: (1) parameter definition; (2) data collection; and (3) data analysis (see Figure 1). These steps are described below.
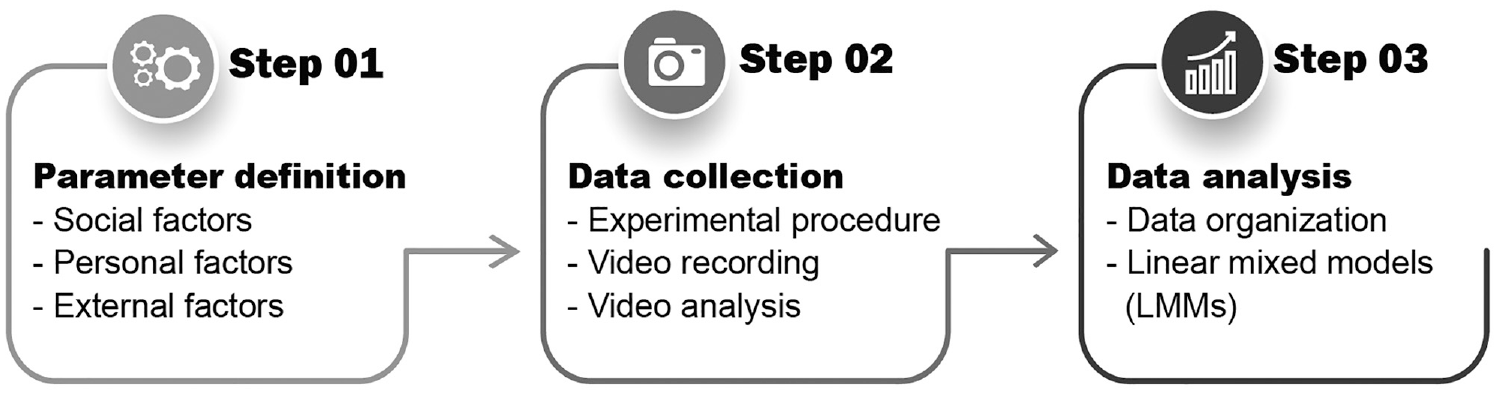
Methodology process steps.
Parameter Definition
To define the variables analyzed in this study, the selection of social, personal, and external factors is presented below.
Social Factors
Previous studies have identified that group sizes ranging from two to four people are the most common. However, they can be affected by the pedestrian density and population of the study location. To determine the most common group sizes in Guimarães, preliminary counts of pedestrian groups were conducted at two sites—Londres and São Gonçalo Avenues. Videos were recorded for a duration of one hour at each location. These streets are characterized by mixed land use and are located close to the city center.
The number of pedestrians per group was counted (a) on the sidewalks and (b) on the crosswalks. The results are presented in Figure 2. As one can see, at least 40% of pedestrians walk in groups, with the most common sizes being 1, 2, and 3 people, while groups of more than three people only represent 4% of the total. Therefore, this study focused on analyzing the behavior of groups of pedestrians consisting of 1, 2, and 3 people (group size). Female, male, and mixed groups were considered based on the participants’ personal characteristics. The measurement of the participants' leg length was also considered, as there are indications that it may influence behavioral coordination.
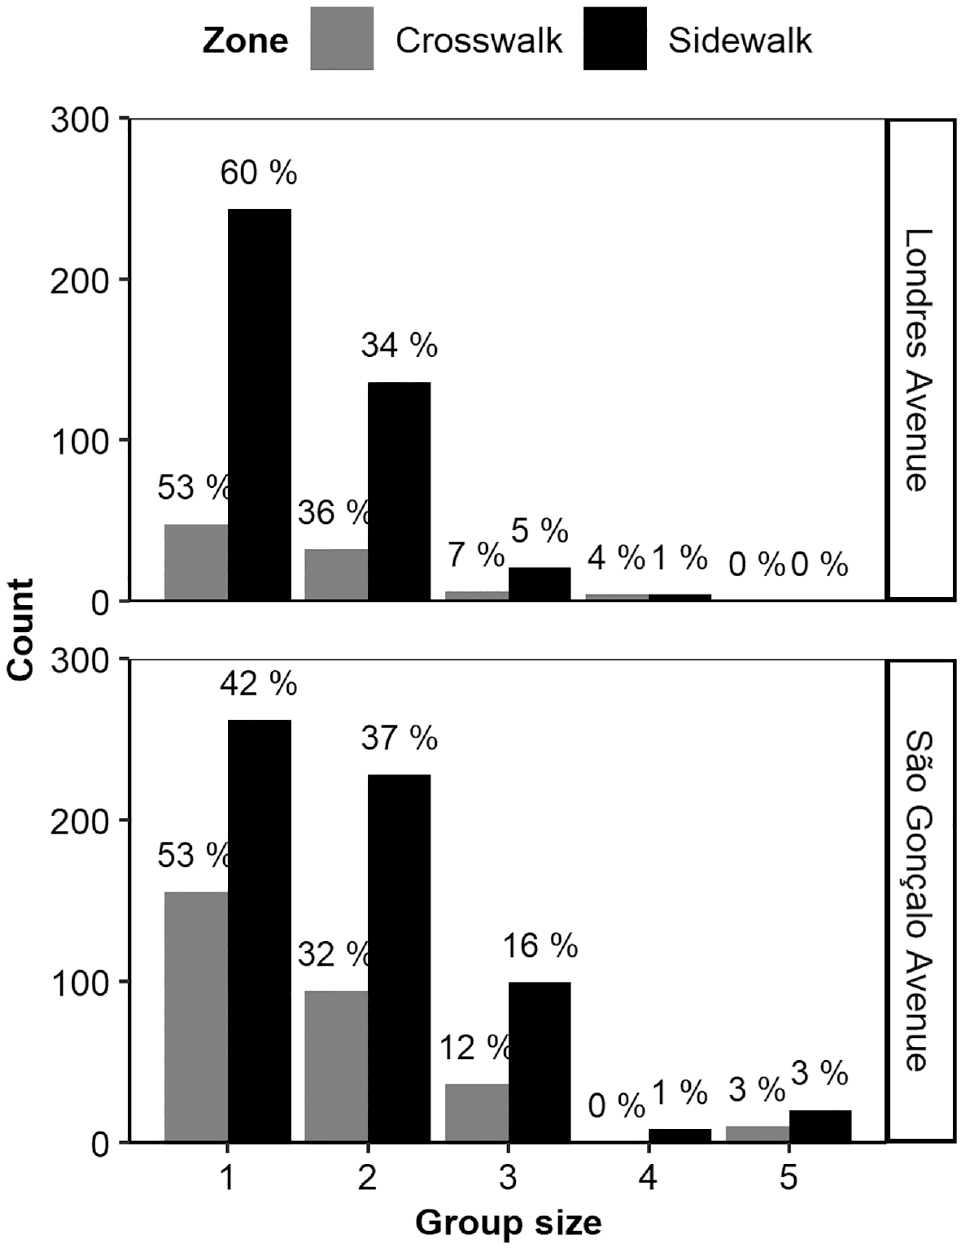
Pedestrians group walk on the crosswalks and sidewalks of Londres and São Gonçalo avenue.
Personal Factors
In this study, participants were recruited from the University of Minho community in Portugal. The study consisted of 90 adults, including 45 females and 45 males, with ages ranging from 23 to 43 years old (mean = 27.8 years old; standard deviation = 3.9 years old). All participants provided informed consent before participating in the experiments. Demographic information, such as sex and age, was recorded for each participant, and leg length was also measured before the experiments began (minimum = 0.82 m, maximum = 1.20 m, mean = 0.95 m, standard deviation = 0.078 m). Since all participants were young adults within the same age range, this factor was not analyzed in the study owing to the lack of variability.
External Factors
The experiments were conducted in unsignalized crosswalks in an urban area, namely on three streets in Guimarães, Portugal: Teixeira de Pascoais street, Martins Sarmento square, and Doutor Joaquim de Meira street (see Figure 3).
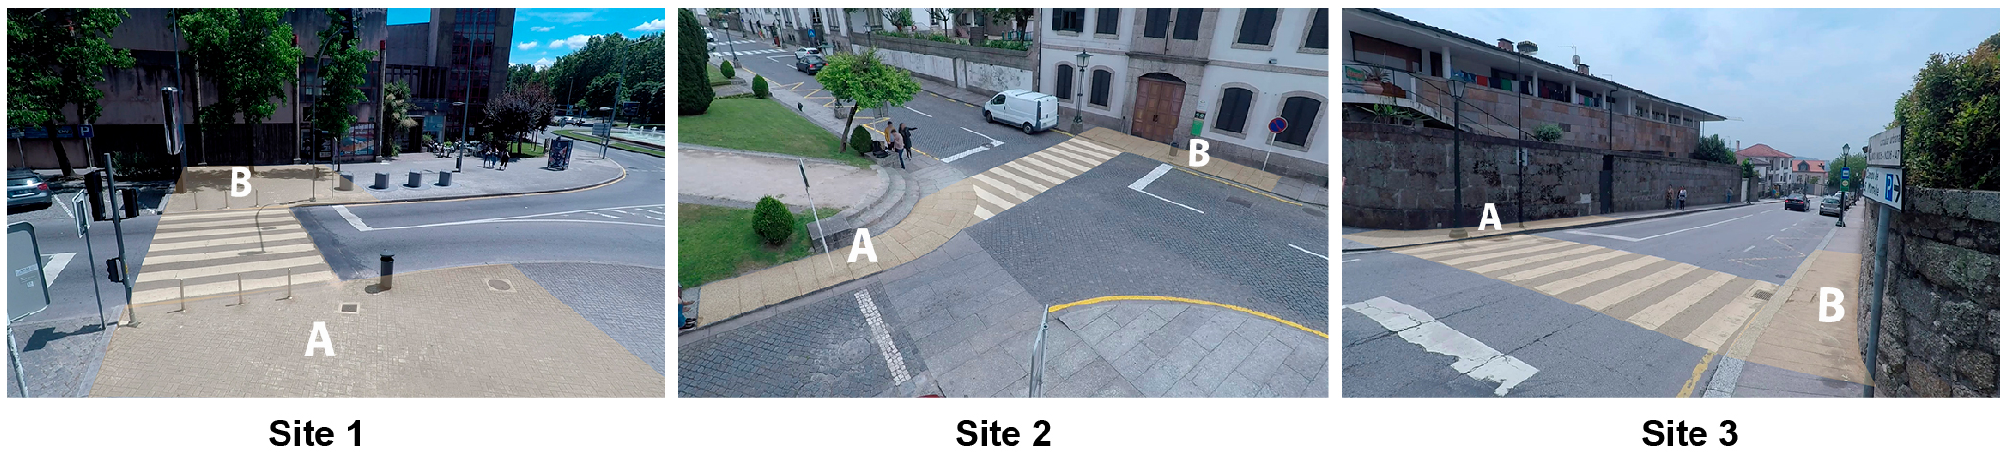
Study section: (a) site 1—Teixeira de Pascoais Street, (b) site 2—Martins Sarmento Square, (c) site 3—Doutor Joaquim de Meira Street, Guimarães, Portugal.
The three streets being studied have varying sidewalk and crosswalk widths, as well as different numbers and placements of obstacles. Each street is a collector road without traffic lights, with two lanes, and mixed land use that includes both commercial and residential properties. A reasonable volume of pedestrian traffic is observed on these streets, resulting in a level of service (LOS) A on the sidewalks according to the Highway Capacity Manual (HCM) 2010 reference values ( 38 ). Table 1 presents the main characteristics and features of the streets. The infrastructure characteristics were measured on-site.
Main Characteristics of the Study Sites
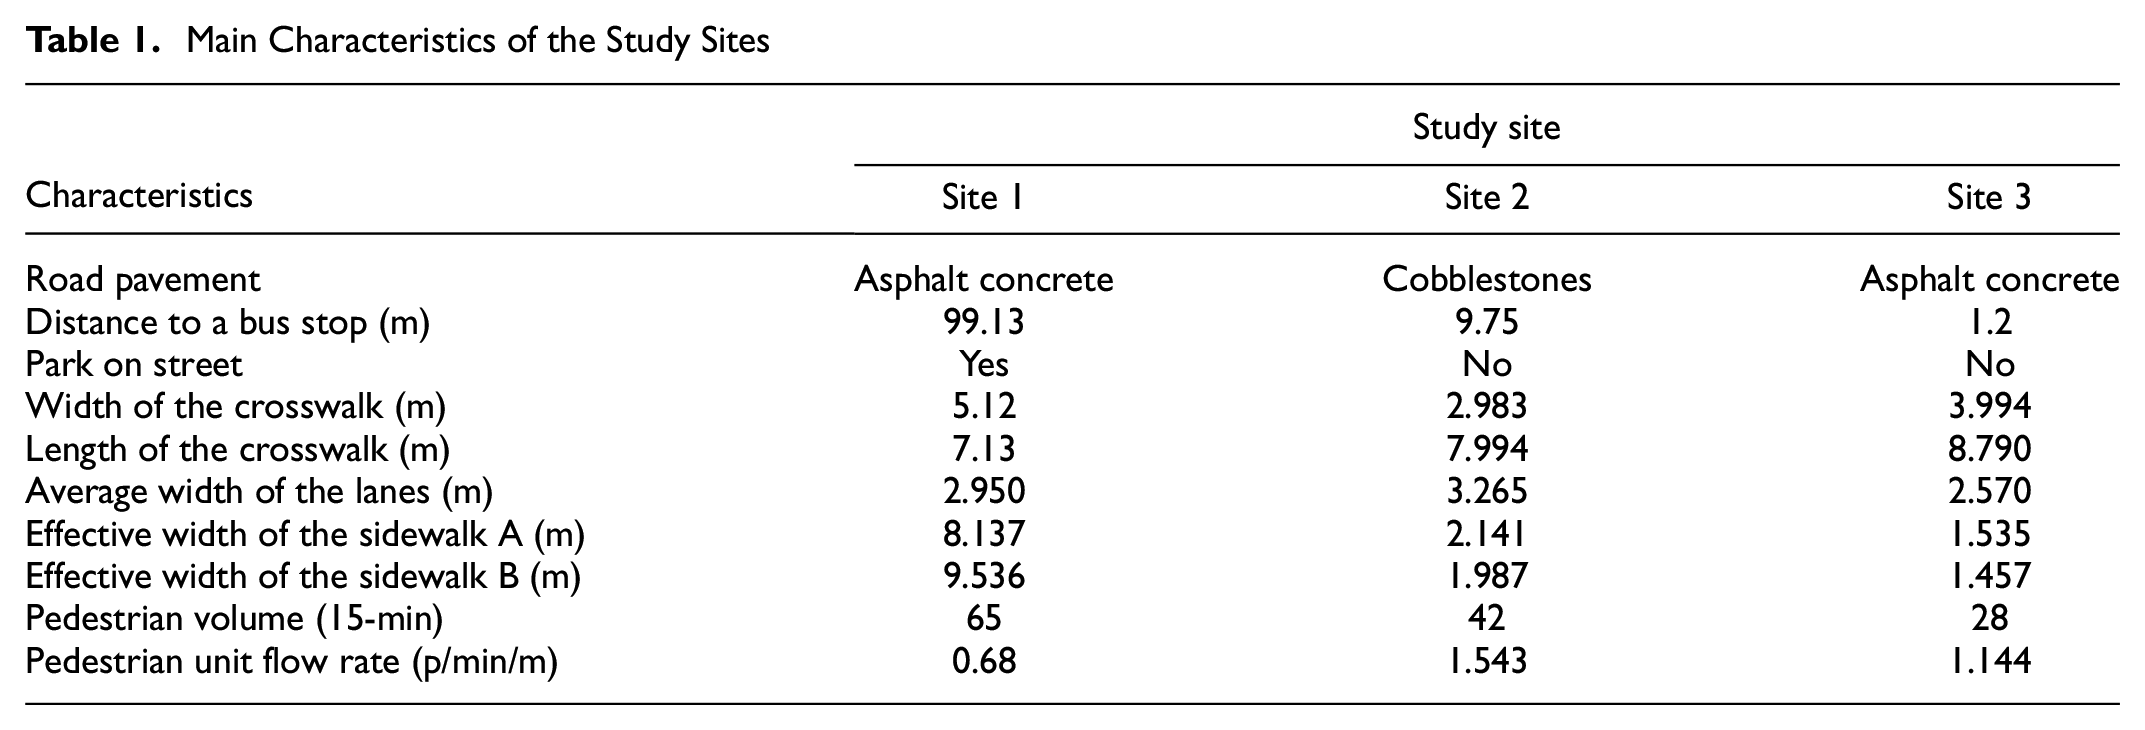
To characterize the space occupied by obstacles on the sidewalks, the effective width was calculated according to HCM, that defines it as the total walkway width minus the width of unusable buffer zones along the curb and building line (HCM, 2010). The widths and shy distances from obstructions considered are presented in Appendix A.
Data Collection
Experimental Procedure
For the experiment, participants were asked to walk a fixed trajectory, from predefined point A to B and vice versa (returning from point B to point A). The circuits included an initial part where participants walk on the sidewalk, followed by a road cross in a crosswalk, then back to the sidewalk on the other side of the road (see Figure 4). At the end of the trajectory, the pedestrians were instructed to return to the starting point, executing the inverse path.
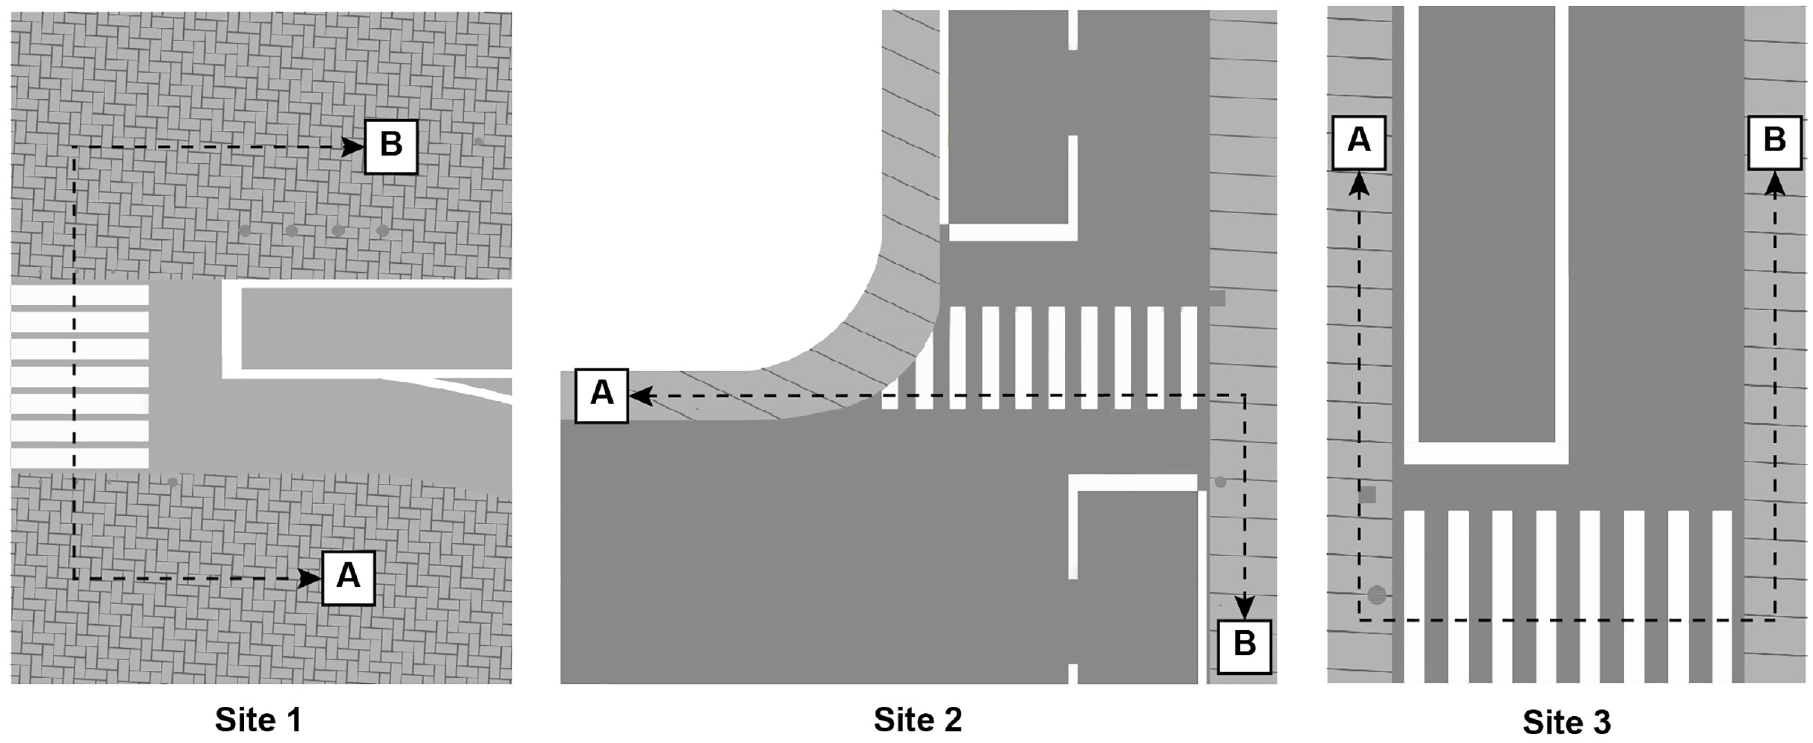
Pedestrians’ trajectories in study sections: (a) site 1, (b) site 2, (c) site 3.
For each experiment, a cluster of five participants was requested to participate. Half of the clusters consisted of three males and two females (type 1), while the other part consisted of three females and two males (type 2) (Figure 5a). Each cluster was then organized into six experimental groups formed by either a single person, two dyads, or three triads. To analyze the influence of social factors on individual behavior, one participant was kept fixed as the cluster’s reference person and was part of all its groups. The composition of the remaining participants in the group, as regards their sex and number, was varied across the six experimental groups. This made it possible to study how the behavior of the reference person was influenced by different social factors in the group. In cluster type 1, the reference person was a man, while in cluster type 2, it was a woman.
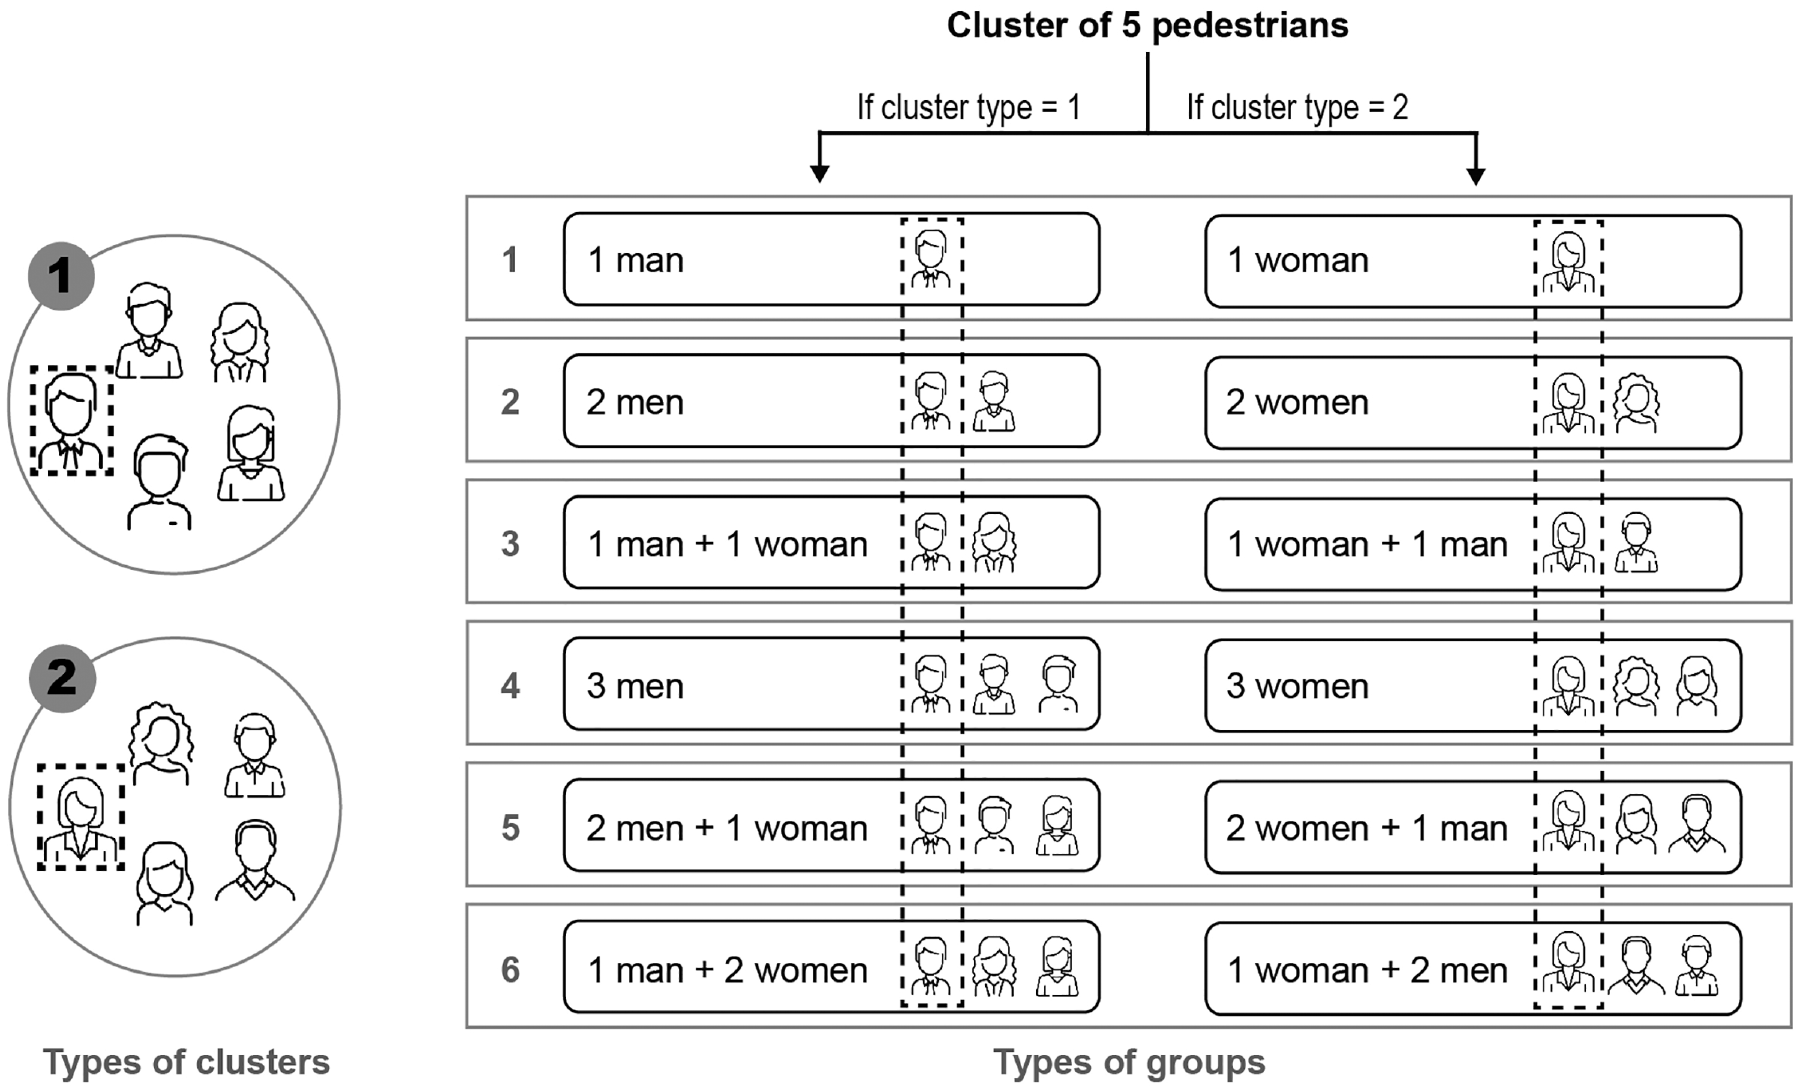
Types of clusters and types of groups.
Following the experimental procedure, each of the six small groups walked the predetermined trajectory repeating it twice in each experiment. The experiments lasted approximately 40 min. A total of eighteen clusters took part in the study (six clusters per study site), divided into 18 singles, 24 dyads, and 36 triads.
Video Recordings
The experimental trials were recorded using a GoPro Hero5 black video camera with a resolution of 1920 × 1080 pixels, a frame rate of 60 fps, and linear range. The camera was placed at a height between 2.5 and 4 m and between 2 and 10 m away from the crosswalk, depending on the conditions of each observation site.
Following the experiments, he video recordings were analyzed using T-Analyst (Figure 6a) (Johnsson, Norén and Laureshyn, 2020). This is a semi-automated video analysis software developed at Lund University and available as freeware ( 39 ). This tool has been used in several road safety studies ( 40 – 42 ).
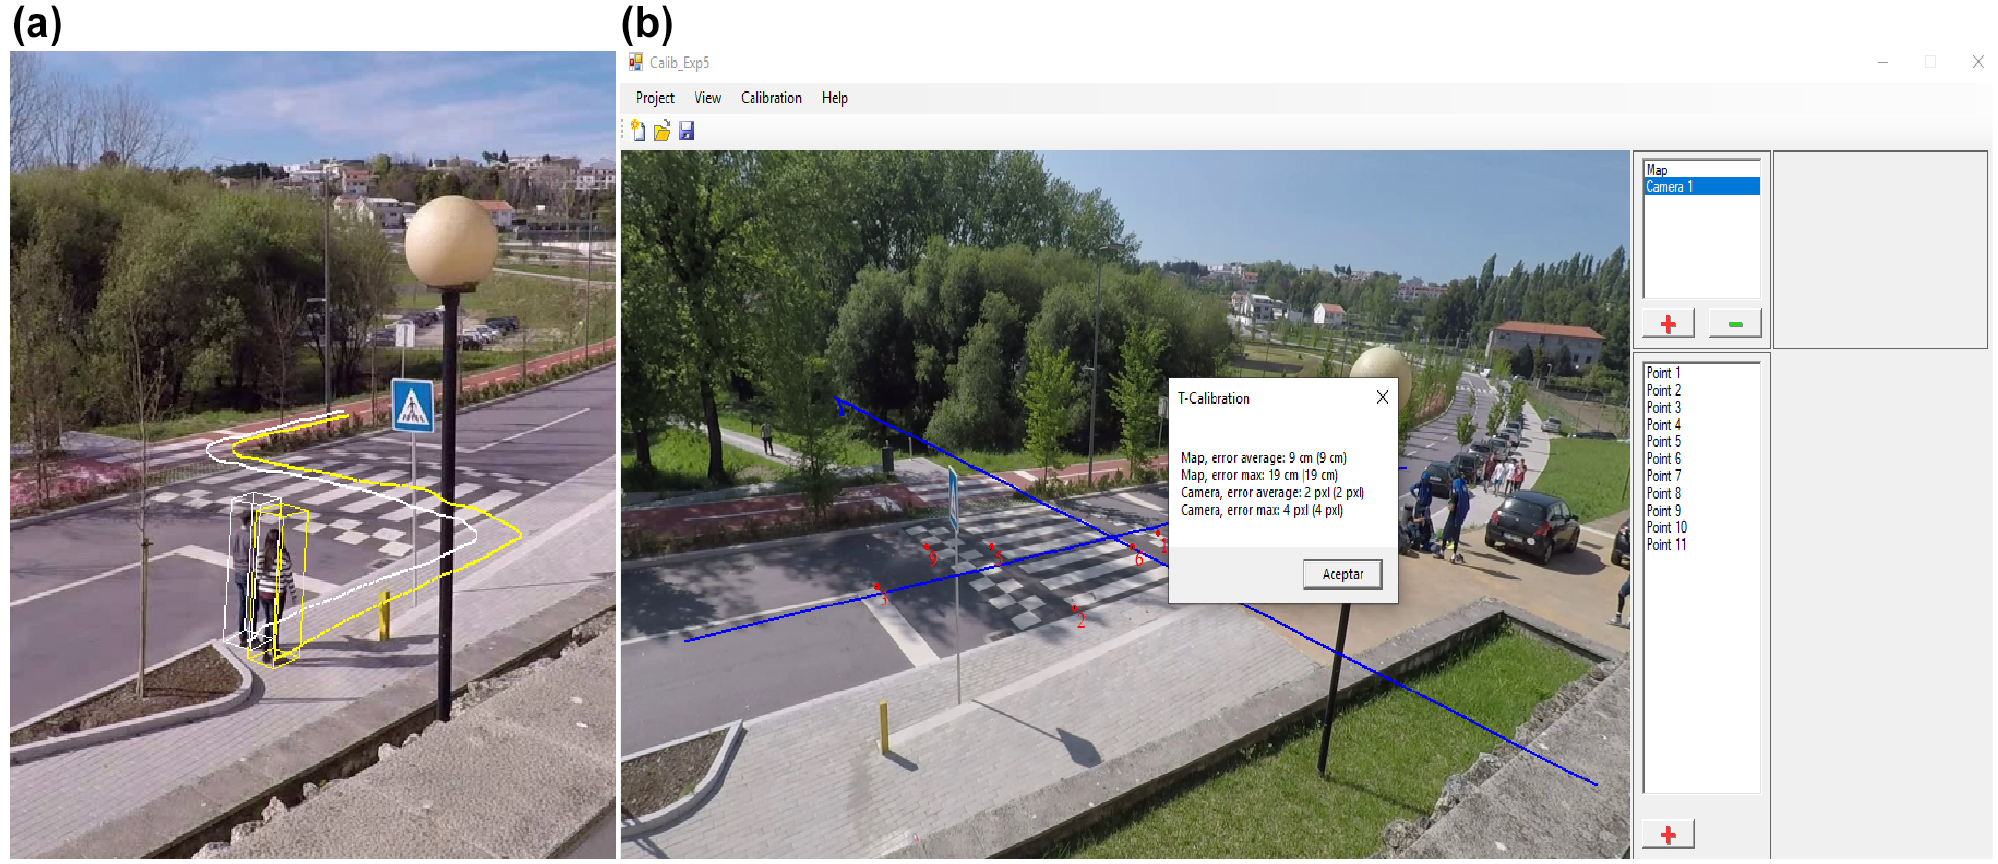
Example of pilot experiment: (a) tracking using T analyst, and (b) calibration using T calibration
The software calculates the trajectories (x and y coordinates) and the speed of the pedestrians. Calibrations were made in a standalone software named T-Calibration using the TSAI-calibration algorithm ( 43 ) (Figure 6b). Manual tracking was chosen to overcome the obstacles that represented potential pedestrian occlusions and reduce the error of distances between the pedestrians walking in groups.
The center of mass coordinates obtained for each participant allowed the calculation of the distance between each pair of pedestrians in the order shown in Figure 7.
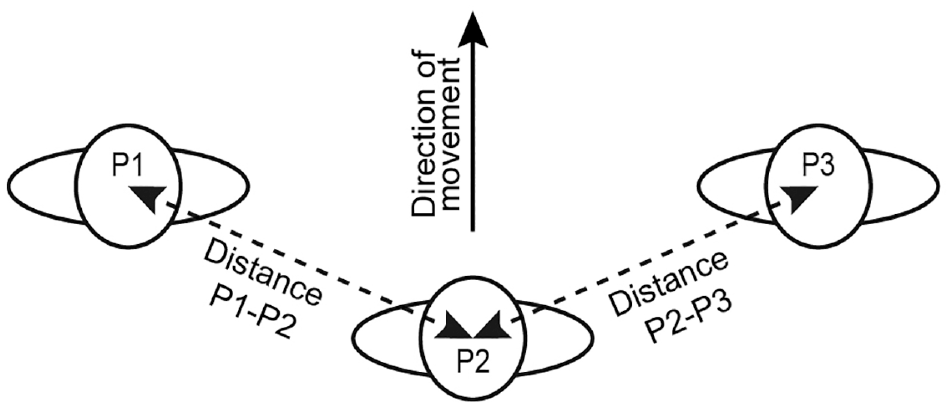
Distances between pedestrians.
Data Analysis
Data Organization
The pedestrians’ trajectories were split into three analysis phases: (i) before the crossing, (ii) during the crossing, and (iii) after crossing. The path of analysis is shown in Figure 8, which includes the width of each zone of sidewalks or crosswalks according to the study site. Additionally, it includes the length of 9 m for sidewalks and the length of each crosswalk. Each phase was divided into two segments to study possible differences in the areas closest to the road crossings, before (segment B1, B2), during (segment D1 e D2) and after (segment A1 e A2) the road crossing.
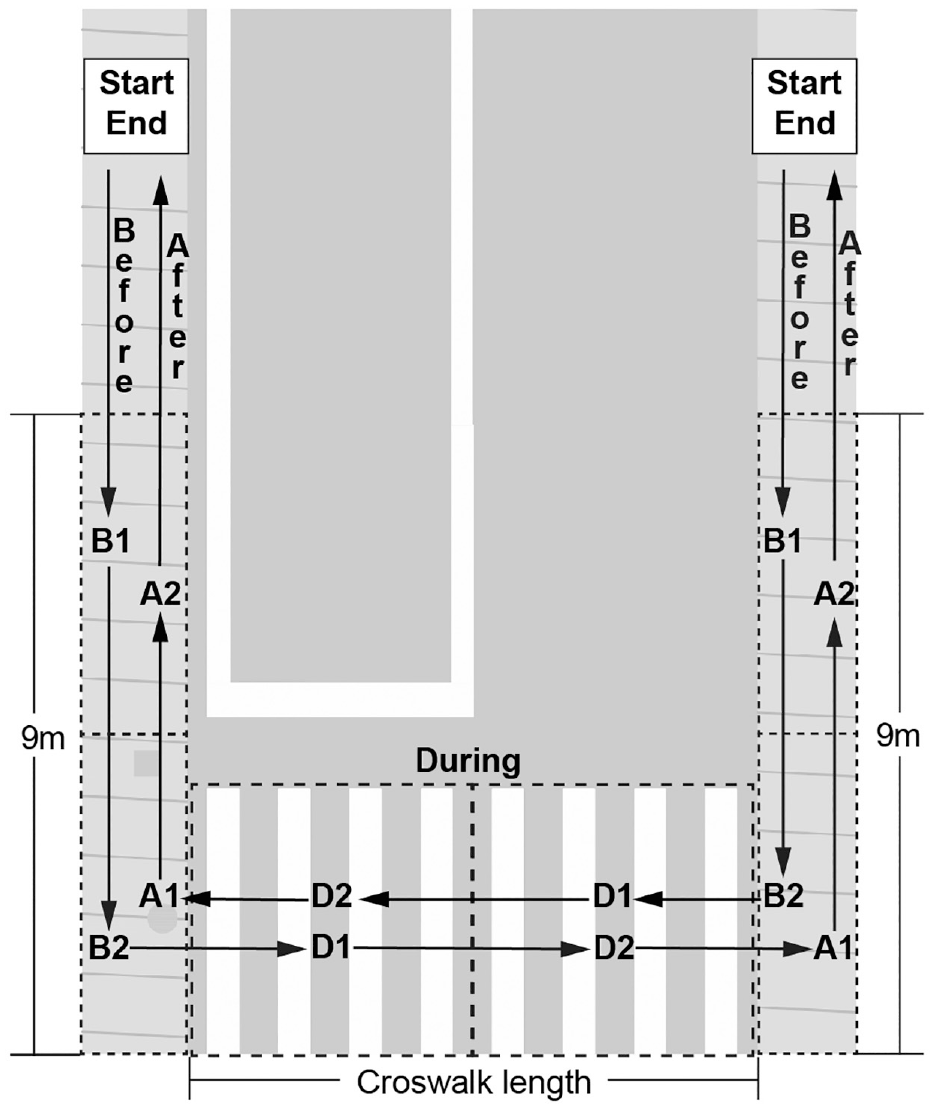
Area of analysis: crossing phases divided into segments.
The final dataset includes the dependent and independent variables. The dependent variables, which were calculated in the segments of each phase, were the average walking speed and average distance between pairs of pedestrians. The independent variables correspond to the factors identified in the literature that influence the pedestrians’ behavior and were divided according to the social and external factors (see Table 2). Personal characteristics are implicit within social factors (sex of pedestrians and leg length).
Description of Independent Variables used in the Study
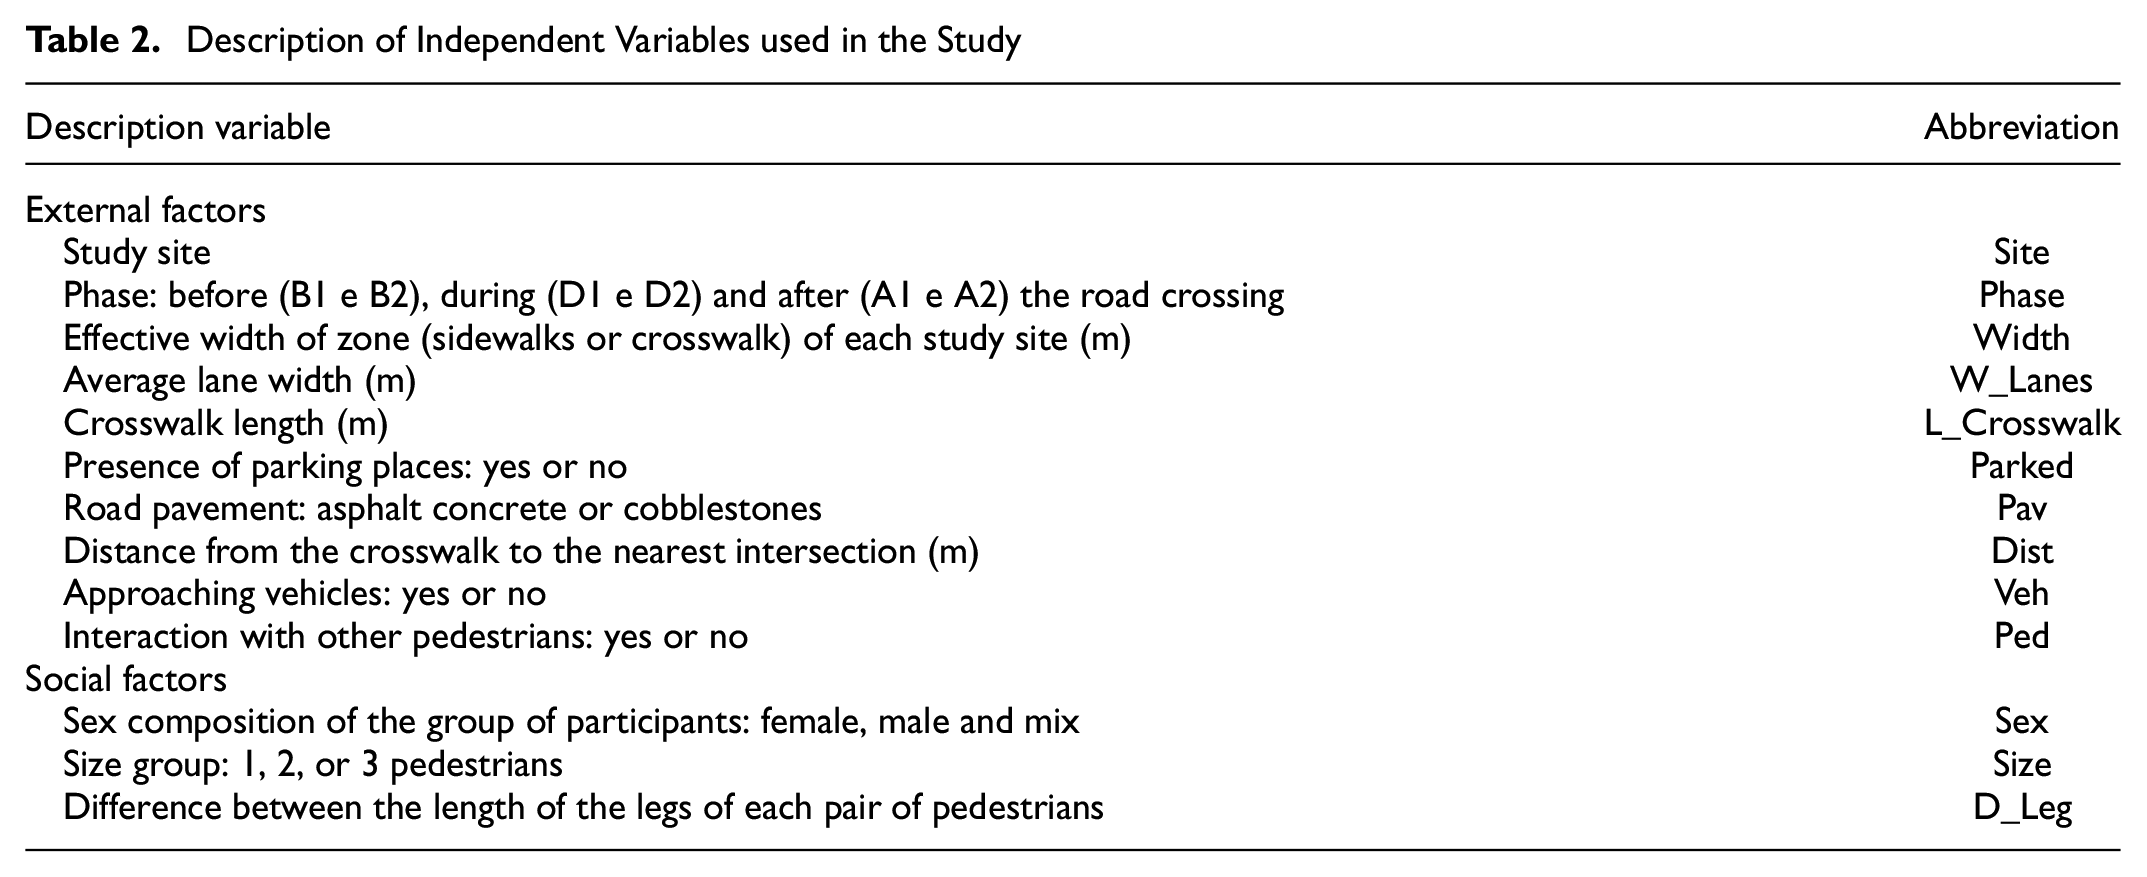
Figure 9 shows a summary scheme of the groups of factors considered to study their influence on pedestrian behavior, the variables analyzed, and the analysis phases.
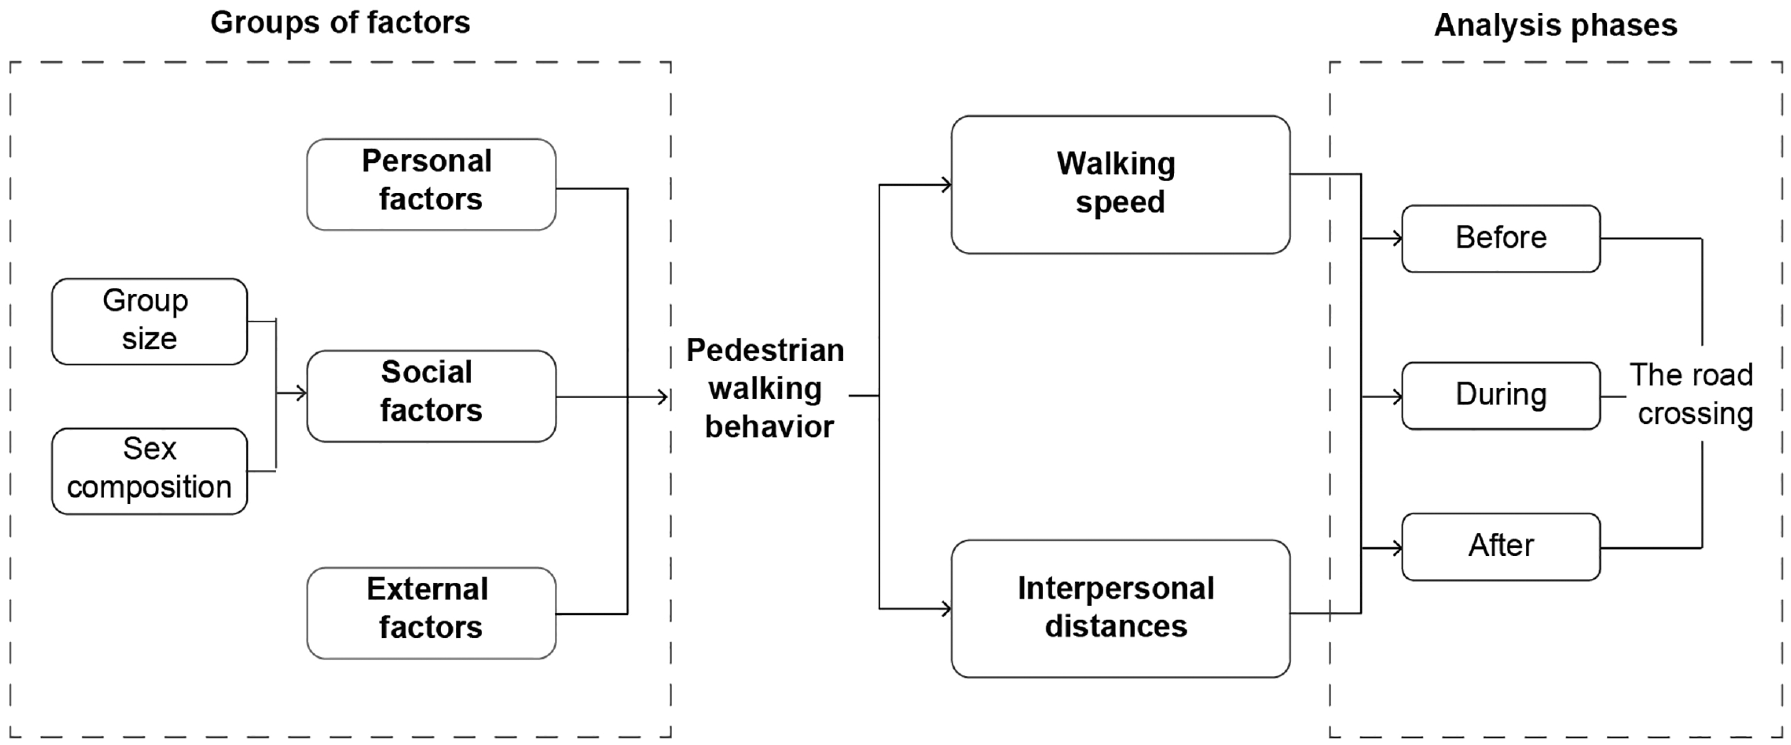
Pedestrian walking behavior analysis scheme.
Modelling Pedestrian Walking Behavior
Data was modelled using LMMs. This class of models is primarily used to describe linear relationships between a response variable and some covariates in grouped data according to one or more factors. LMMs incorporate fixed effects, which are parameters associated with an entire population or with certain repeatable levels of factors, and random effects, which are associated with individual experimental units drawn at random from a population ( 44 ).
LMMs are an appropriate technique for analyzing nested structured data, such as the data presented in this study, owing to repeated measurements. The participants were divided into small groups, and each small group walked twice the predefined trajectory (see section 2.2—Experimental procedure).
LMMs were estimated to assess the influence of all the variables mentioned above (see Table 2) on the distance between pedestrians and the pedestrians’ walking speed.
The hierarchical data structures have three levels (see multilevel diagrams Figure 10). Each observation corresponds to a trajectory of a pair of pedestrians (Pair_ID) for the distance between pedestrians and, of each pedestrian (Ped_ID), for the walking speed. These form part of an upper-level group of participants (Cluste_ID).
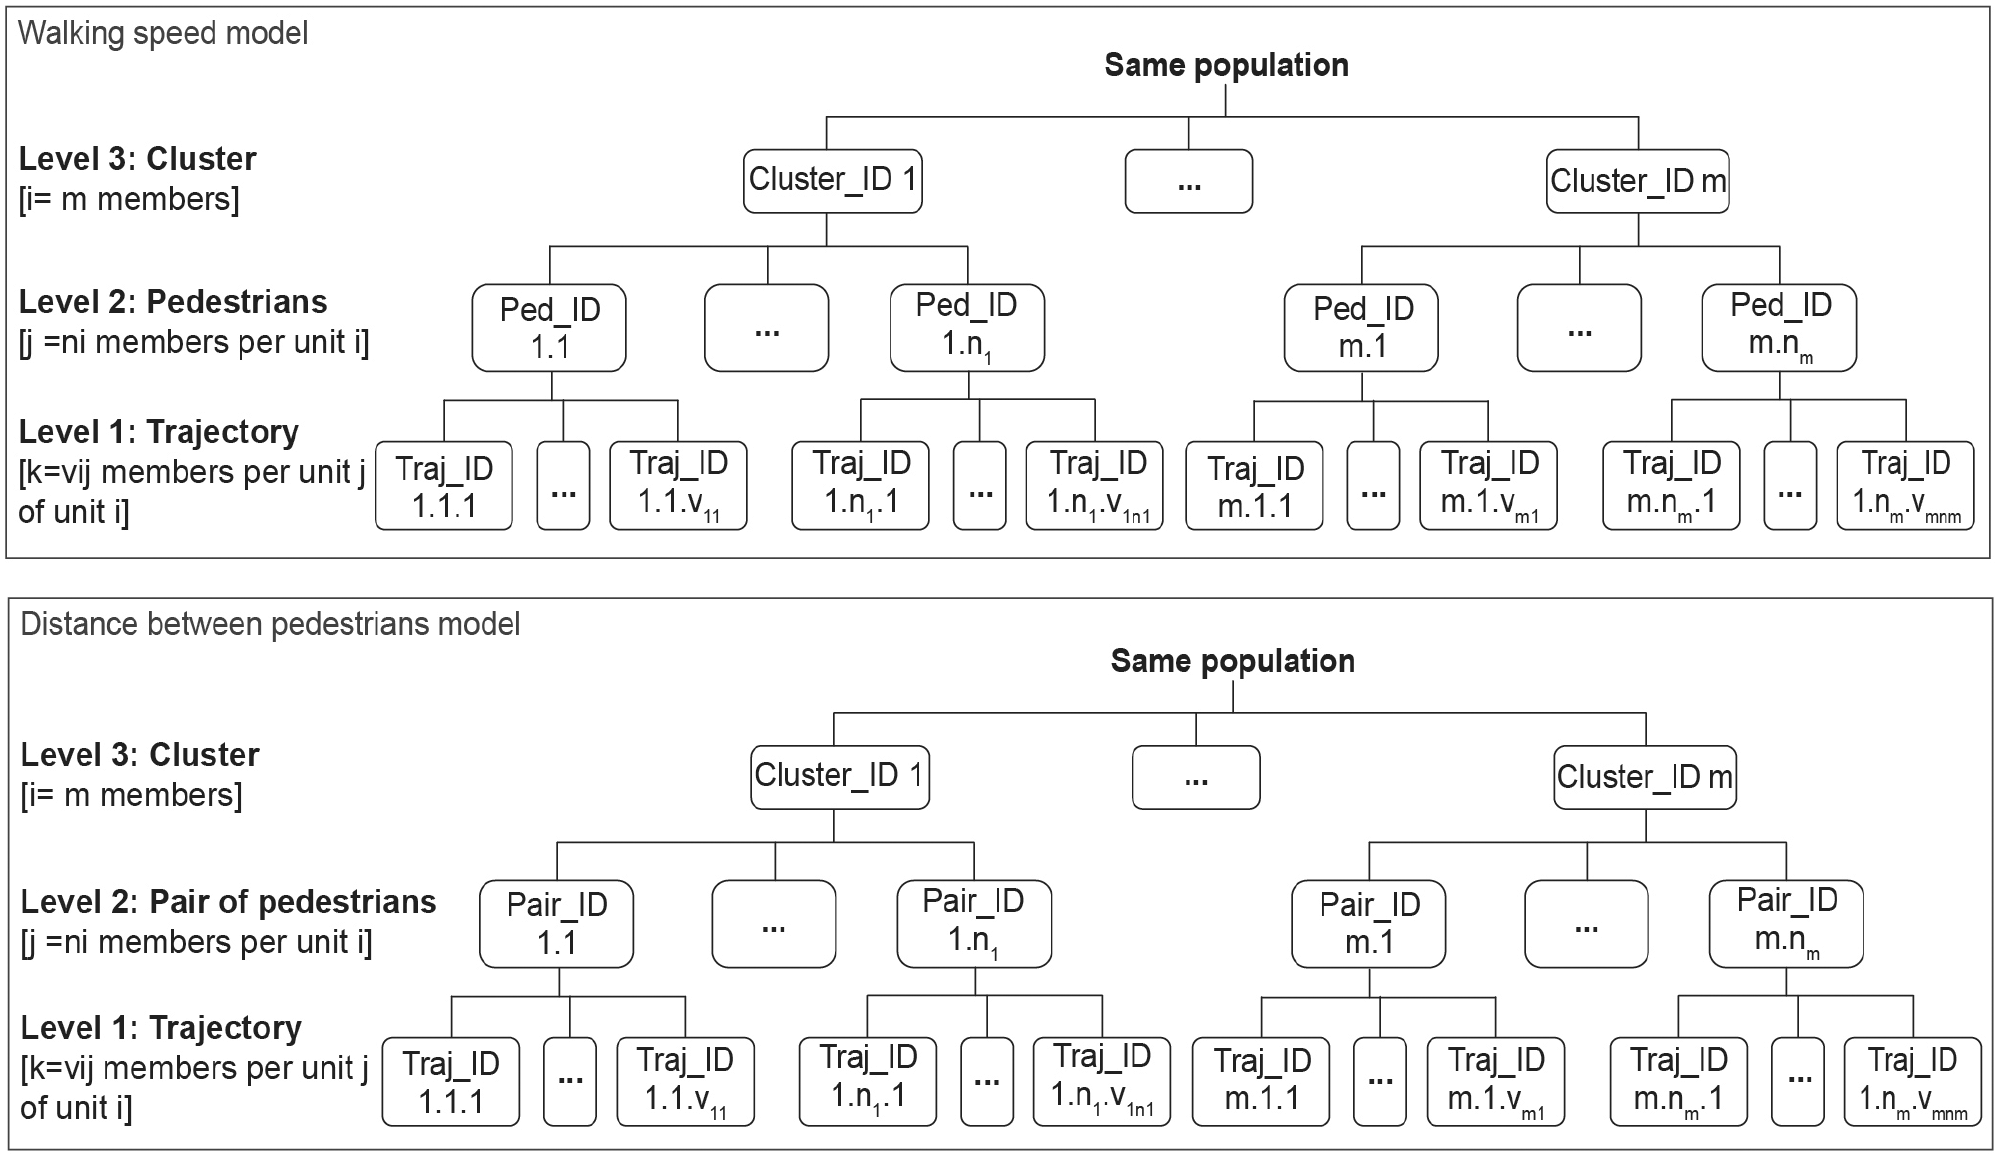
Multilevel diagram of walking speed and distance between pedestrian distance models.
The model, for
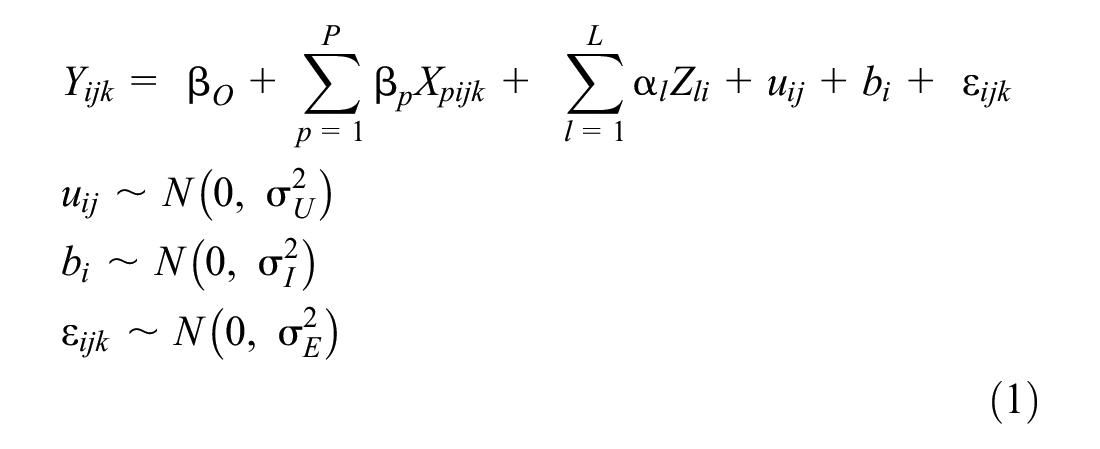
where
The variance inflation factor (VIF) was used to verify that there was no multicollinearity among the independent variables. It was found that none of the independent variables in the models for walking speed and pedestrian distance had a VIF greater than 5 ( 45 ). Variance components are used to calculate the intraclass correlation (ICC), a statistic that quantifies the degree to which data at the lower level are correlated ( 46 ). The ICC, also referred to as the variance partition coefficient (VPC), is obtained as the proportion of random effects variance over the total variation and it ranges from zero to one.
ICC1 quantifies the correlation among all the values between and within pairs of pedestrians (distance) or each pedestrian (speed) nested within groups and is given by:

Similarly, ICC2 quantifies the correlation among the repeated measurements within pairs of pedestrians (distance) or each pedestrian (speed) nested within groups and is given by:

This work’s modelling approach followed the backward deletion method, which consisted of iteratively removing the statistically non-significant variable with the highest p-value. The final model for each response variable, namely walking speed and distance between pair of pedestrians, presents the independent variables that were statistically significant to a level of 5%. All statistical analyses were performed using the R statistical software ( 47 ).
Results
To study the pedestrian behavior when crossing the road in a group, two separate models were developed for the dependent variables: (i) the average walking speed of each participant (see section 3.1), and for (ii) the distance between pairs of participants (section 3.2).
Average Walking Speed
Traffic regulations in Portugal require that drivers cede passage to pedestrians when approaching a crosswalk without traffic lights. However, in 5% of the study’s sample, drivers did not adhere to this regulation, resulting in pedestrians having to wait for the car to pass. Two trajectories with the same participants are shown in Figure 11. One can observe that in the first case (Figure 11a), the vehicle did not stop, forcing pedestrians to considerably reduce their speed compare with the second trajectory (Figure 11b). Only trajectories in which drivers complied with traffic regulations were selected for analysis (5,676 observations).
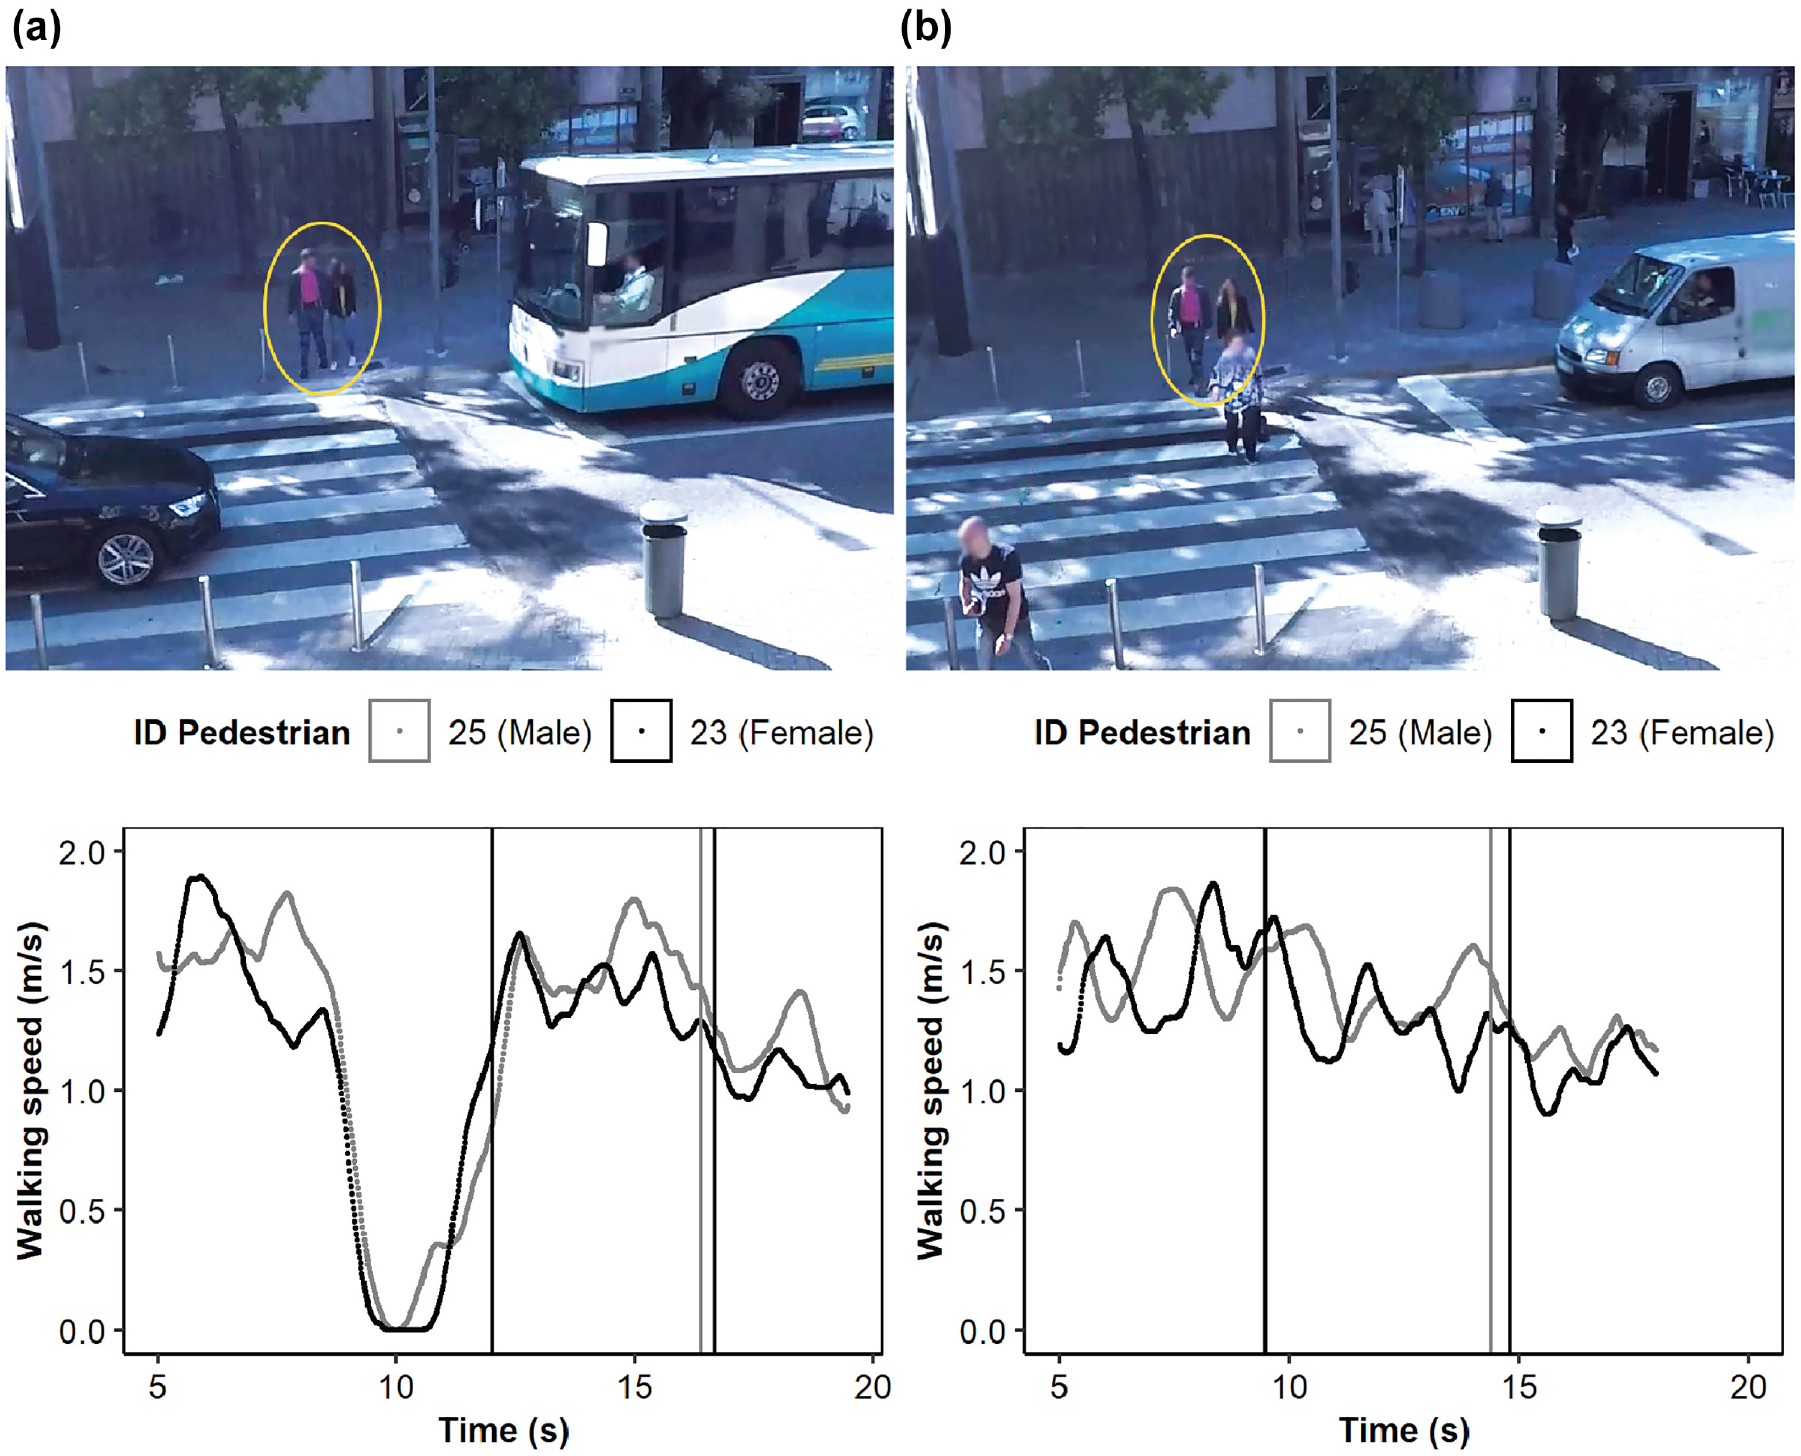
Differences between pedestrians’ speed: (a) the vehicle did not stop, (b) the vehicle stopped.
Table 3 presents summary statistics for pedestrians' walking speed, as a function of social and external factors. On average, the highest walking speed was observed for isolated individuals rather than those in groups, male groups, in the absence of approaching vehicles, and during road crossings.
Descriptive Statistics of the Walking Speed
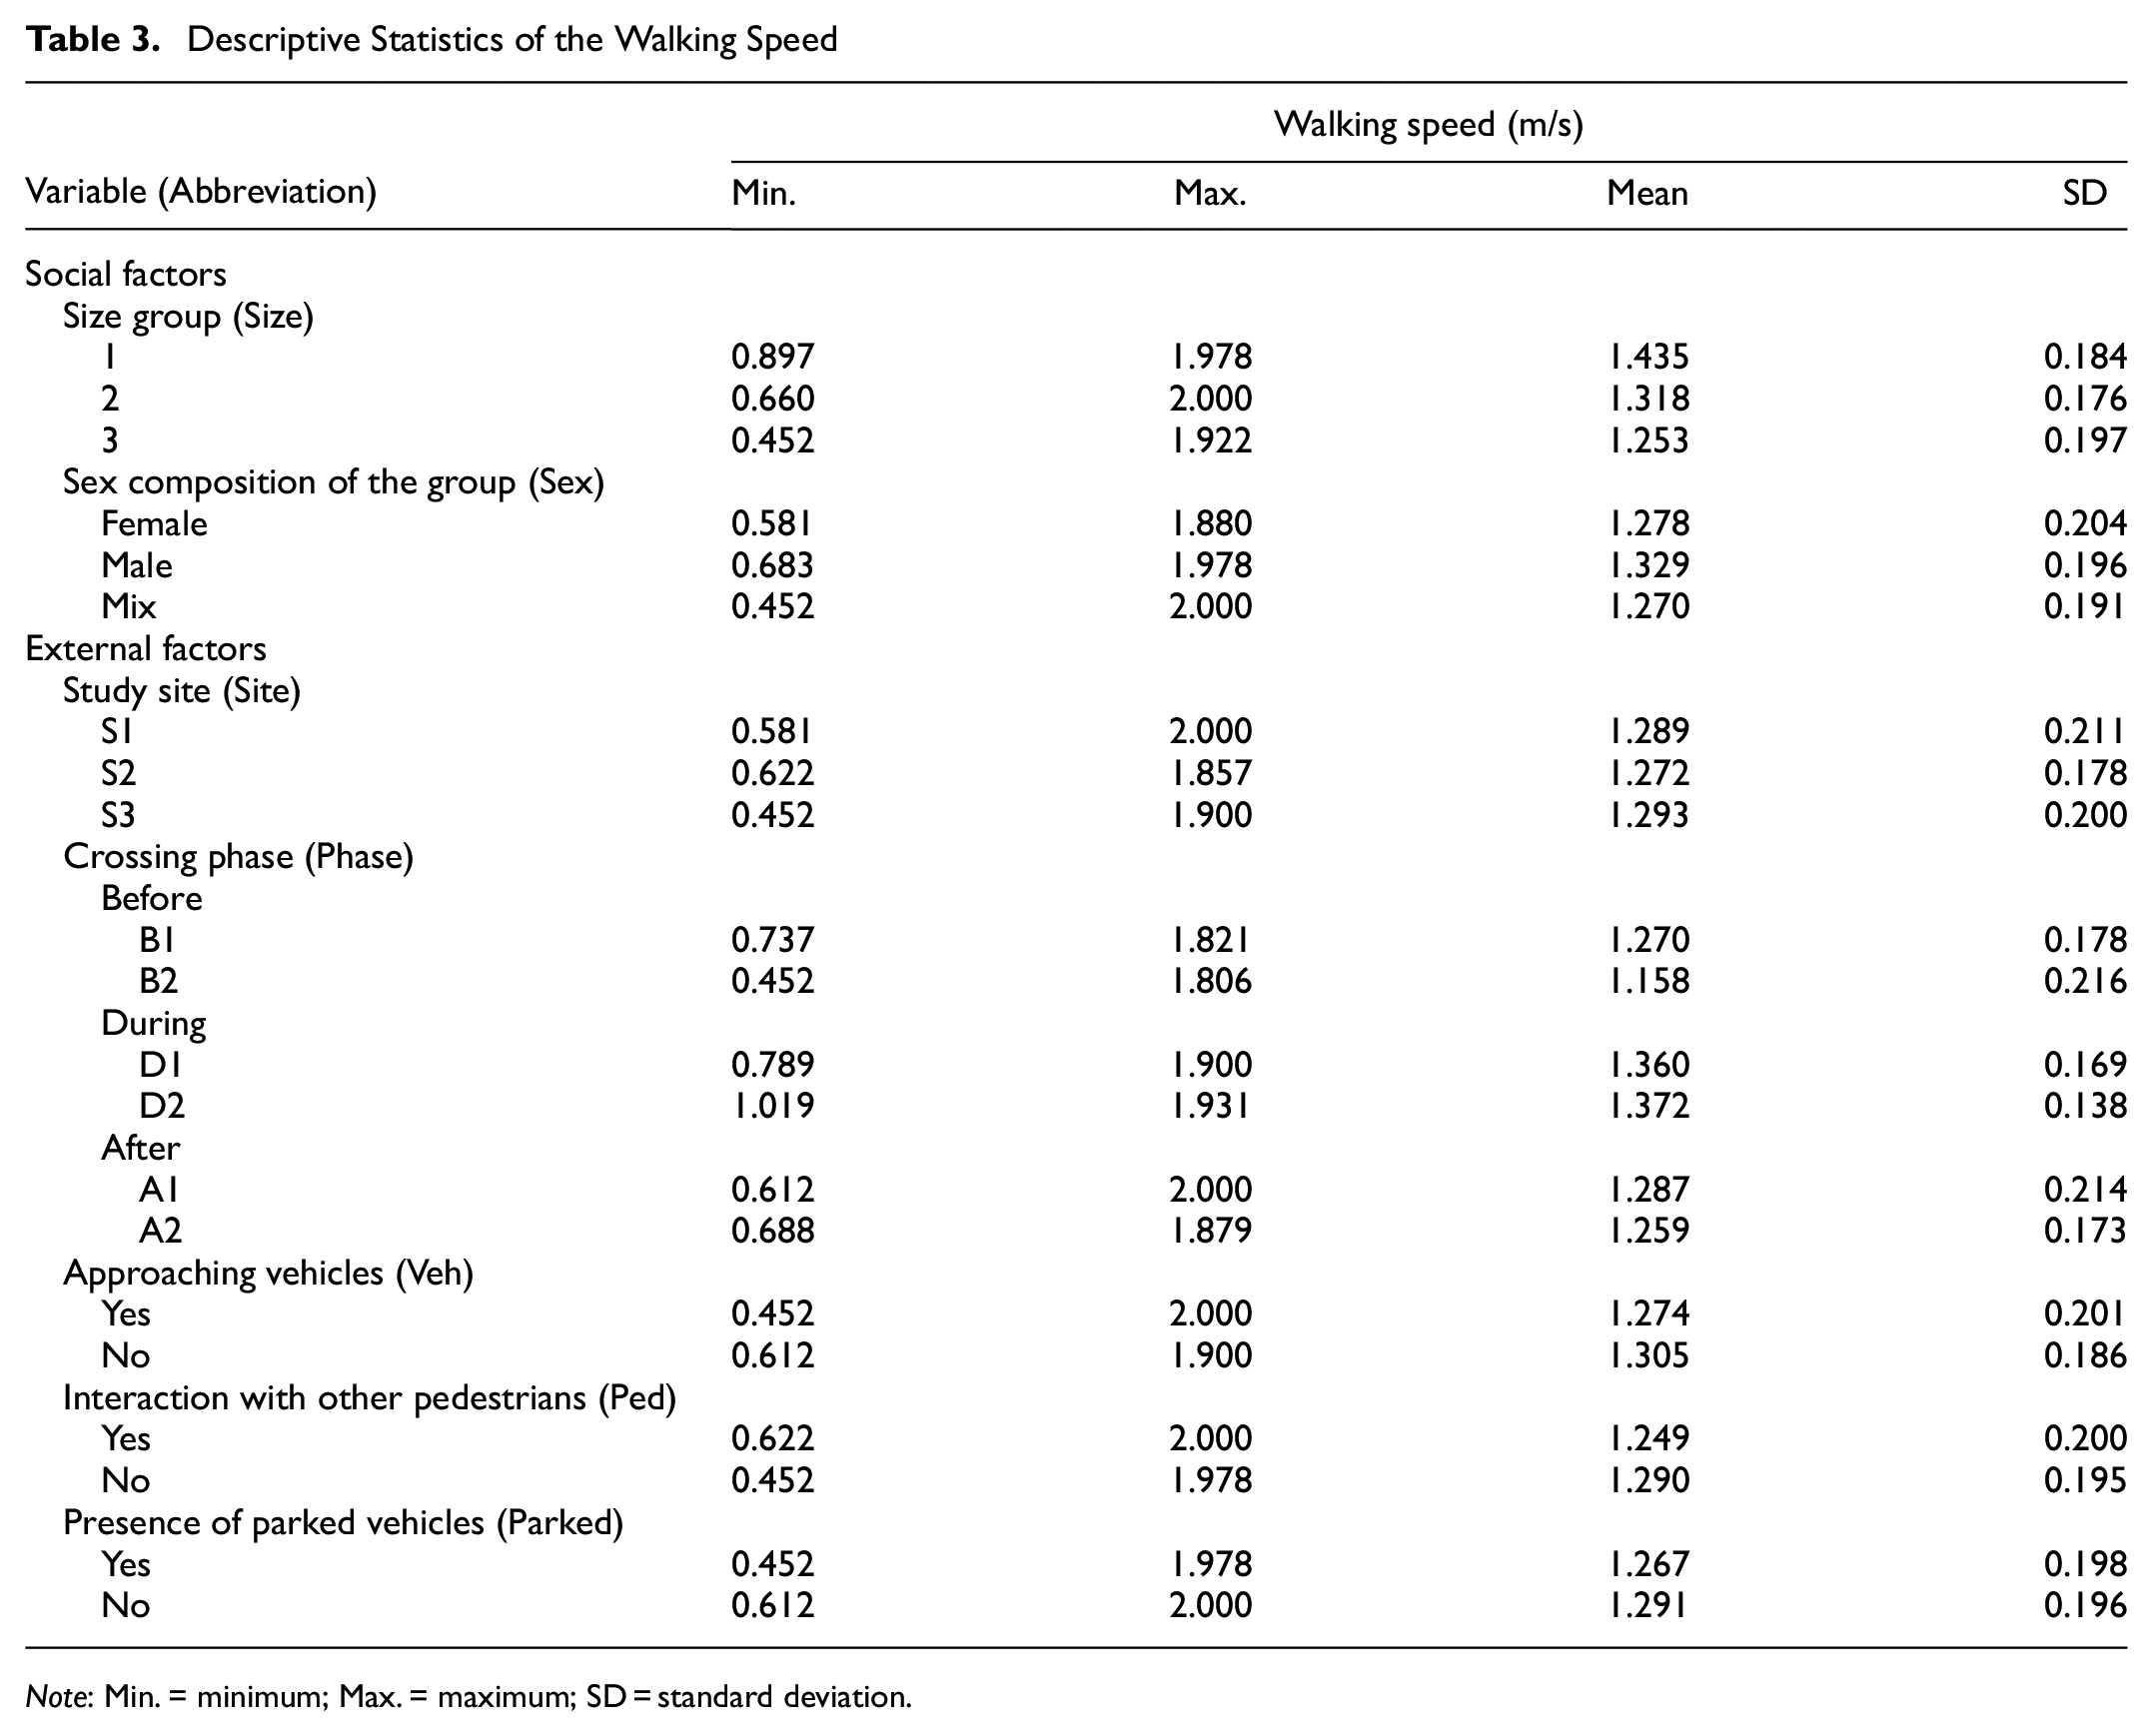
Note: Min. = minimum; Max. = maximum; SD = standard deviation.
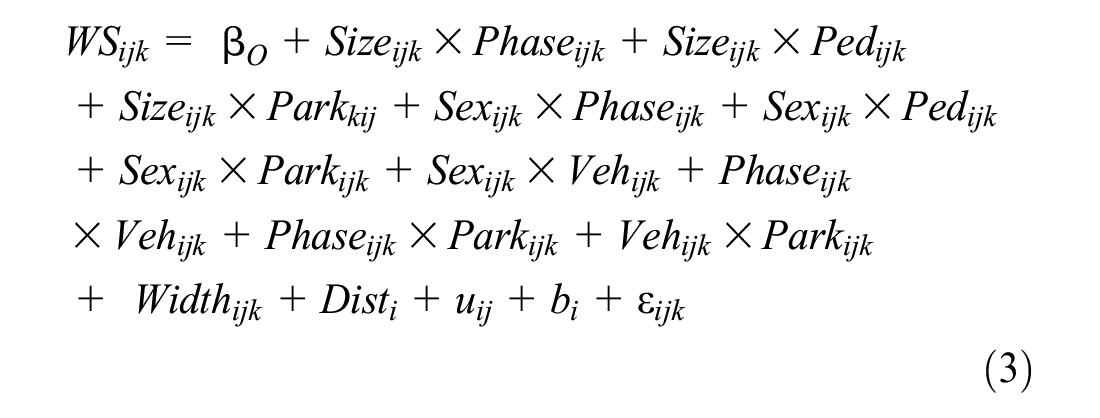
The pedestrians’ walking speed was estimated using a LMM. Random effects were considered for pedestrian and group of participants, to account for repeated measurements. The final model includes all significant predictor variables (Equation 3). Non-significant social factor was D_Leg (leg length) and, external factors were Pav (pavement), W_Lanes (lane width), L_Crosswalk (crosswalk length). The full summary statistics of the model are presented in Appendix B. Contrasts were used to analyze the interactions between variables and to compare the levels within each variable.
For
Significant effects of variables on walking speed were observed based on Satterthwaite’s test (Table 4). Significant predictor variables and interactions are discussed below.
Satterthwaite’s Test Results for the Model for the Pedestrian’s Average Speed
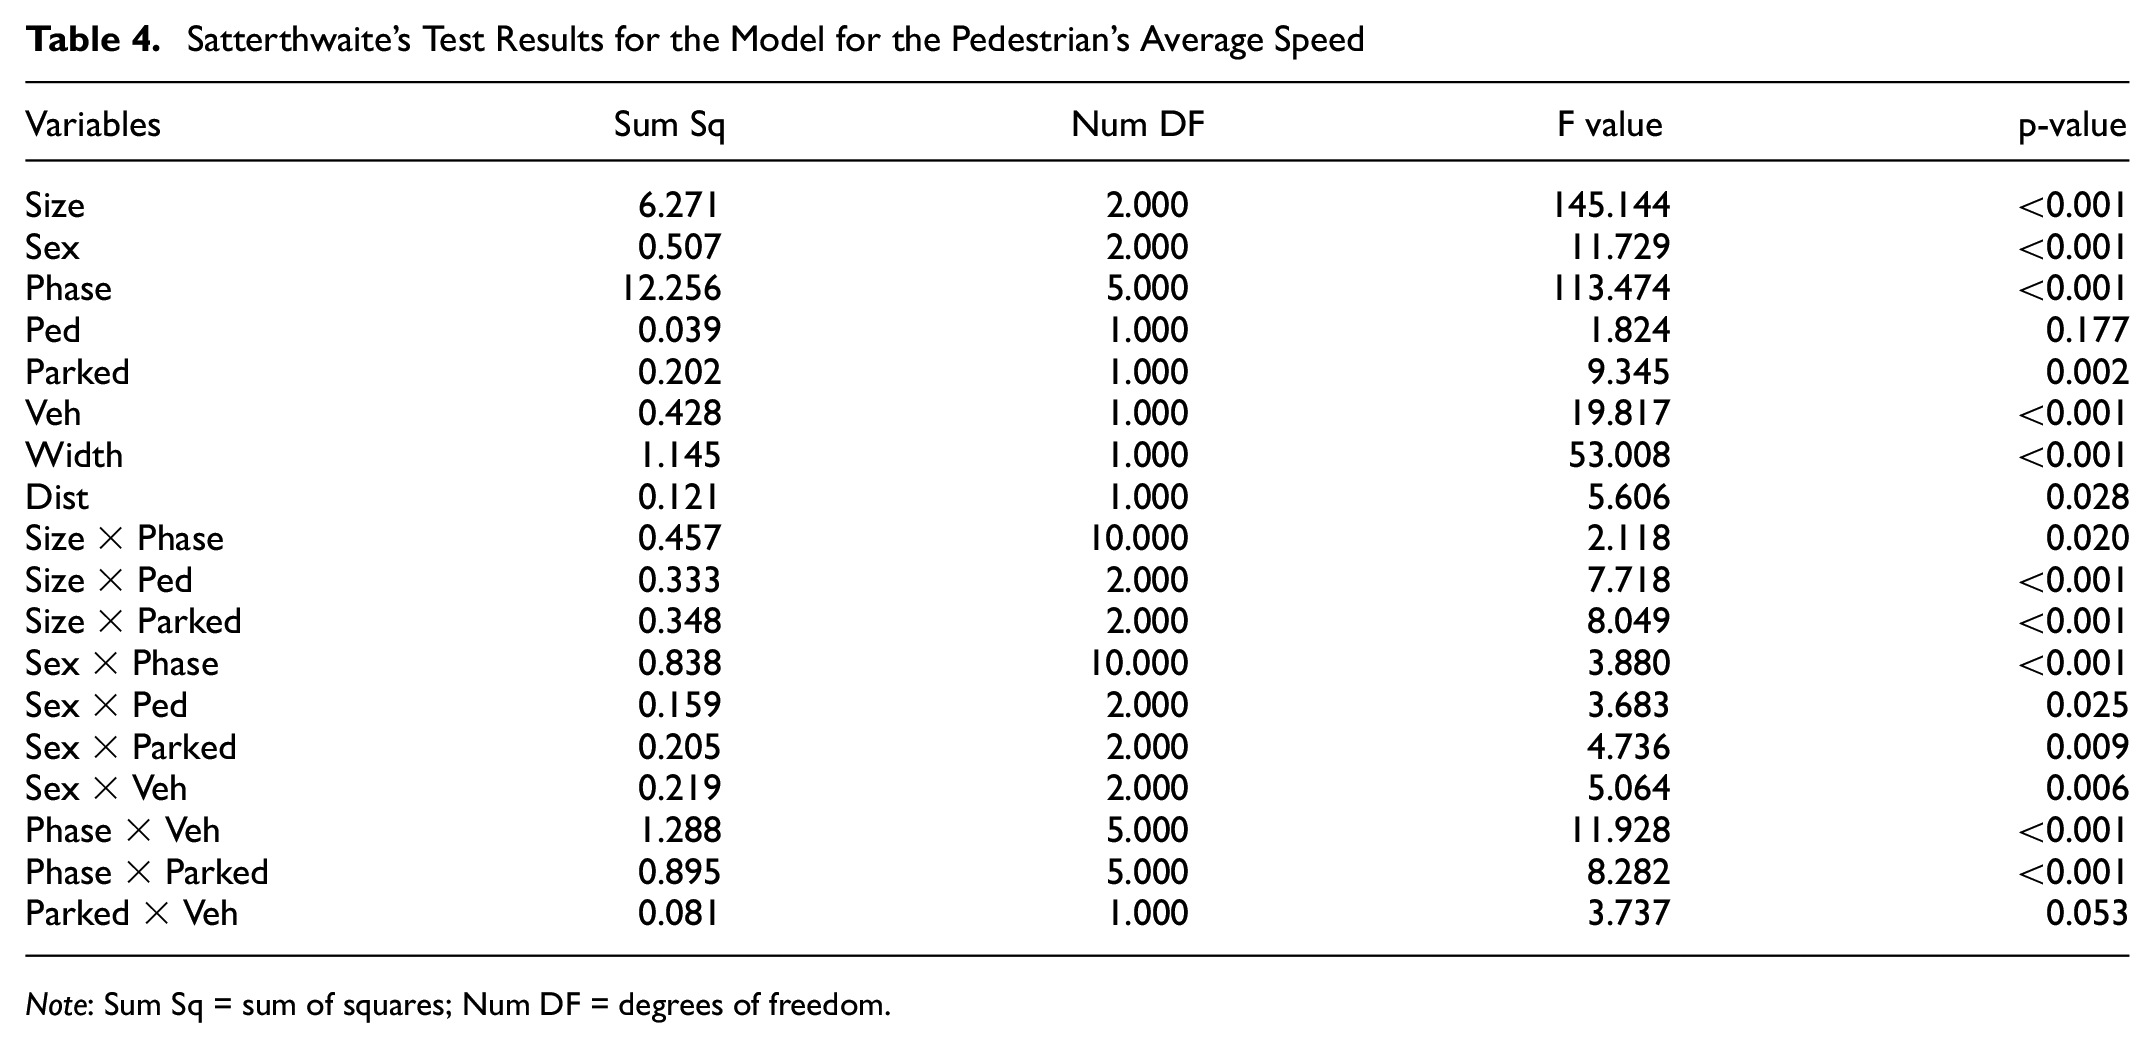
Note: Sum Sq = sum of squares; Num DF = degrees of freedom.
Social Factors
The statistically significant interactions between group size and the crossing phase were analyzed using contrasts. As shown in Figure 12, the pedestrians’ average speed varied with the crossing phase. The average speed decreased as pedestrians approached the road crossing (B2), increased during the road crossing (D1 and D2), and then decreased as pedestrians returned to the sidewalk on the other side of the street. Notably, the average speed in B1 was similar to that in A2, suggesting that pedestrians return to their comfortable walking speed after crossing.
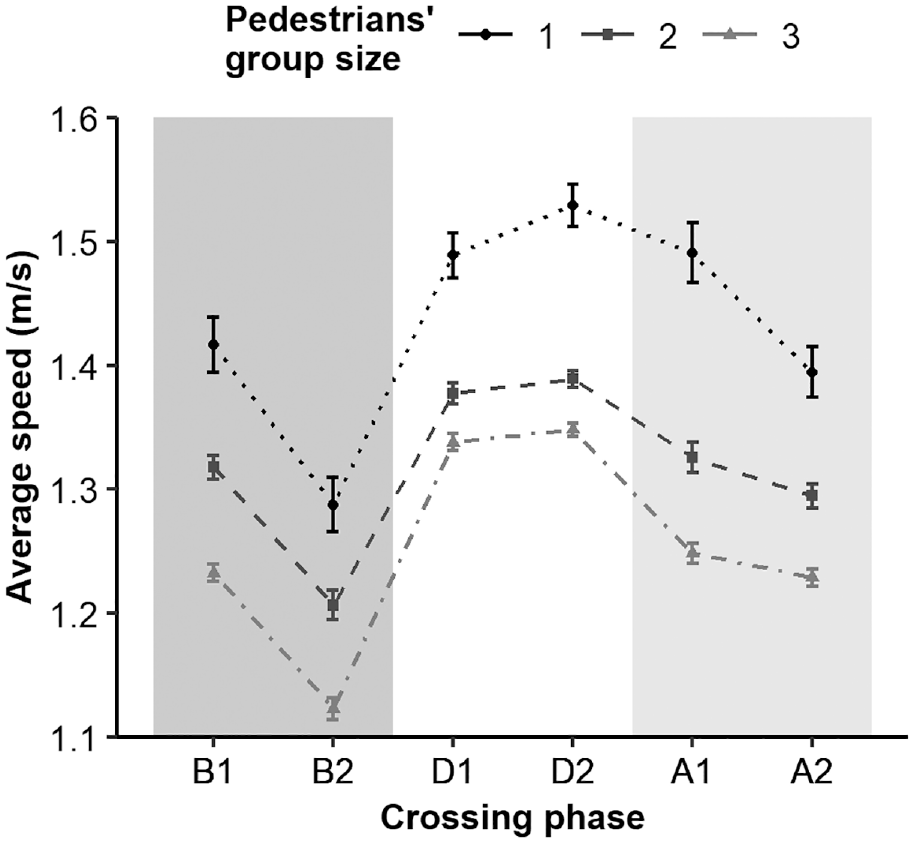
Pedestrians’ average speed and respective standard error according to the group size per crossing phase.
Figure 12 also revealed that speed depended on group size, with pedestrian speed decreasing as group size increased. The highest speed was observed for singles and the lowest for triads, and this decrease was consistent throughout the phases. Table 5 indicated that the difference between pedestrian speeds according to group size was significant (p-value < 0.05) at each crossing phase.
Group Size Contrasts According to the Phase.
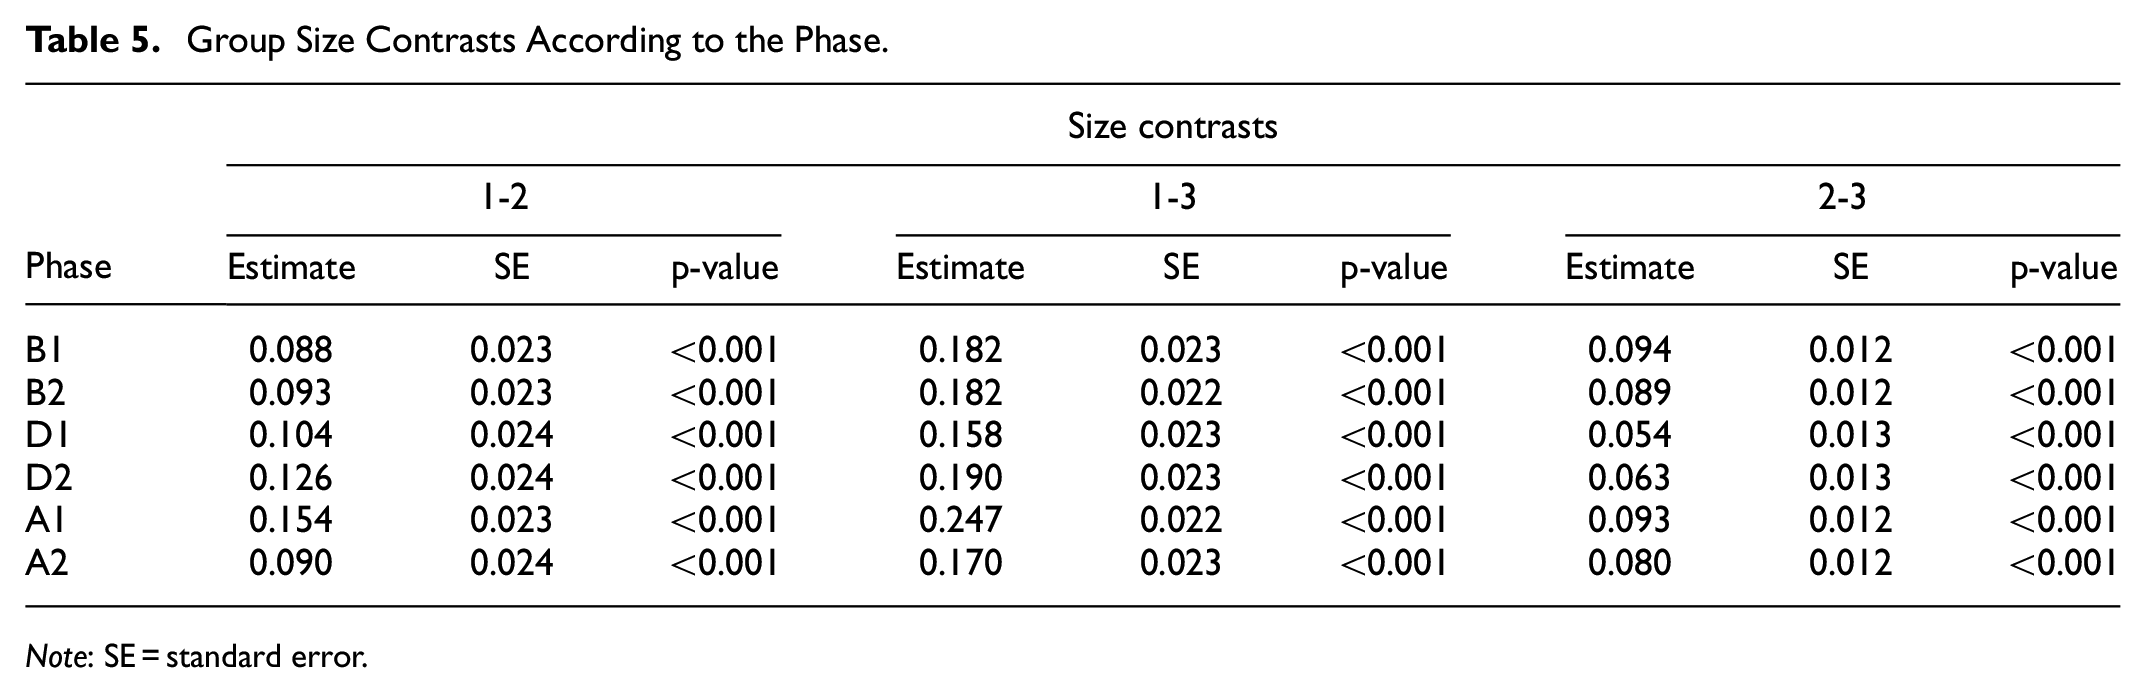
Note: SE = standard error.
The interactions between variables group size (Size) with the presence of out-group pedestrians (Ped) and parked vehicles (Parked) were also significant (see Figure 13).
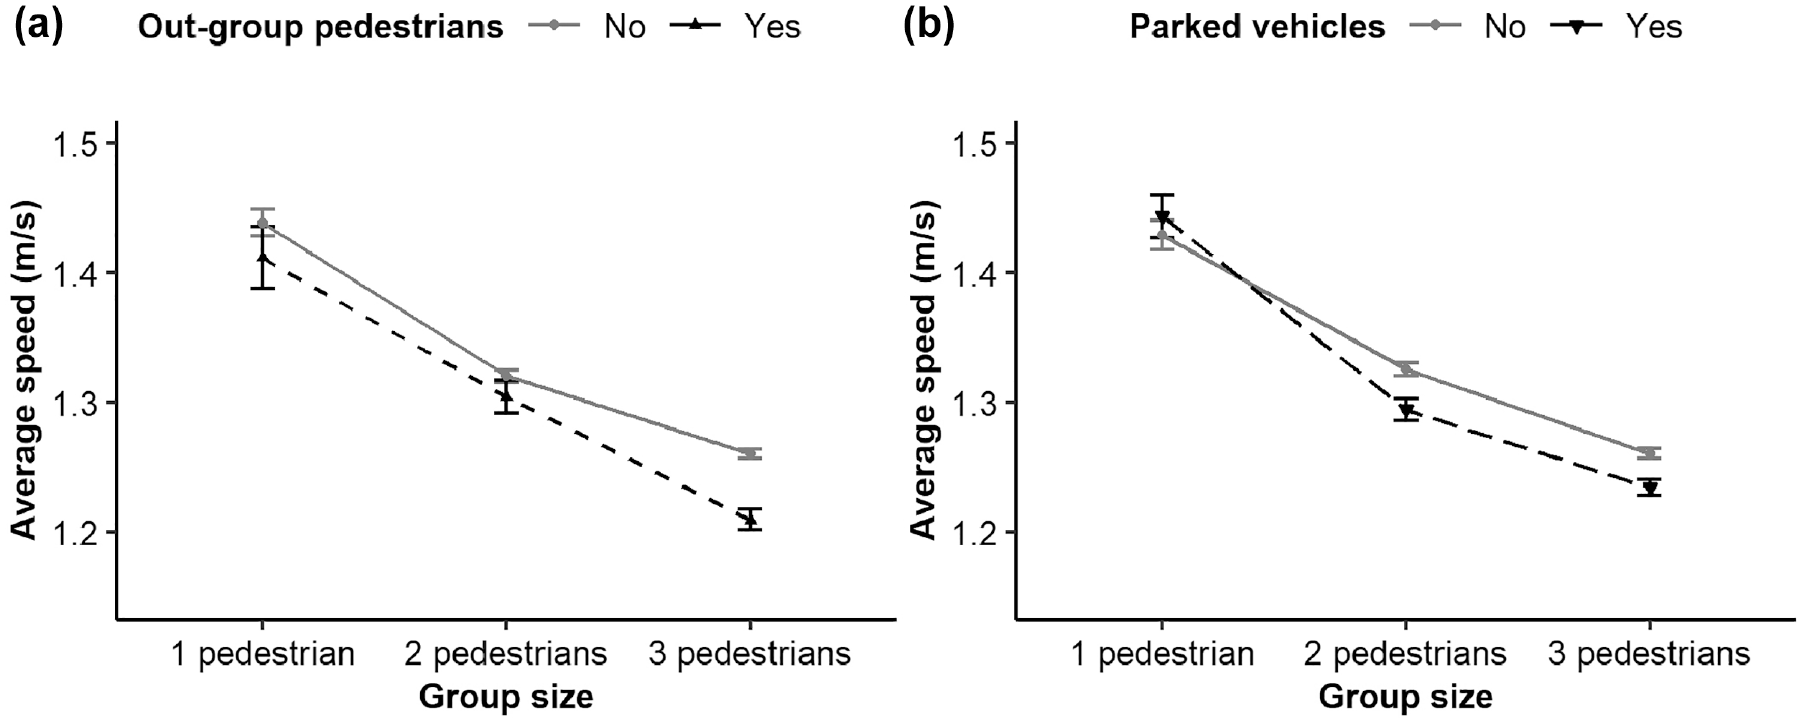
Pedestrians’ average speed and respective standard error per group size according to (a) presence of out-group pedestrians, and (b) presence of parked vehicles.
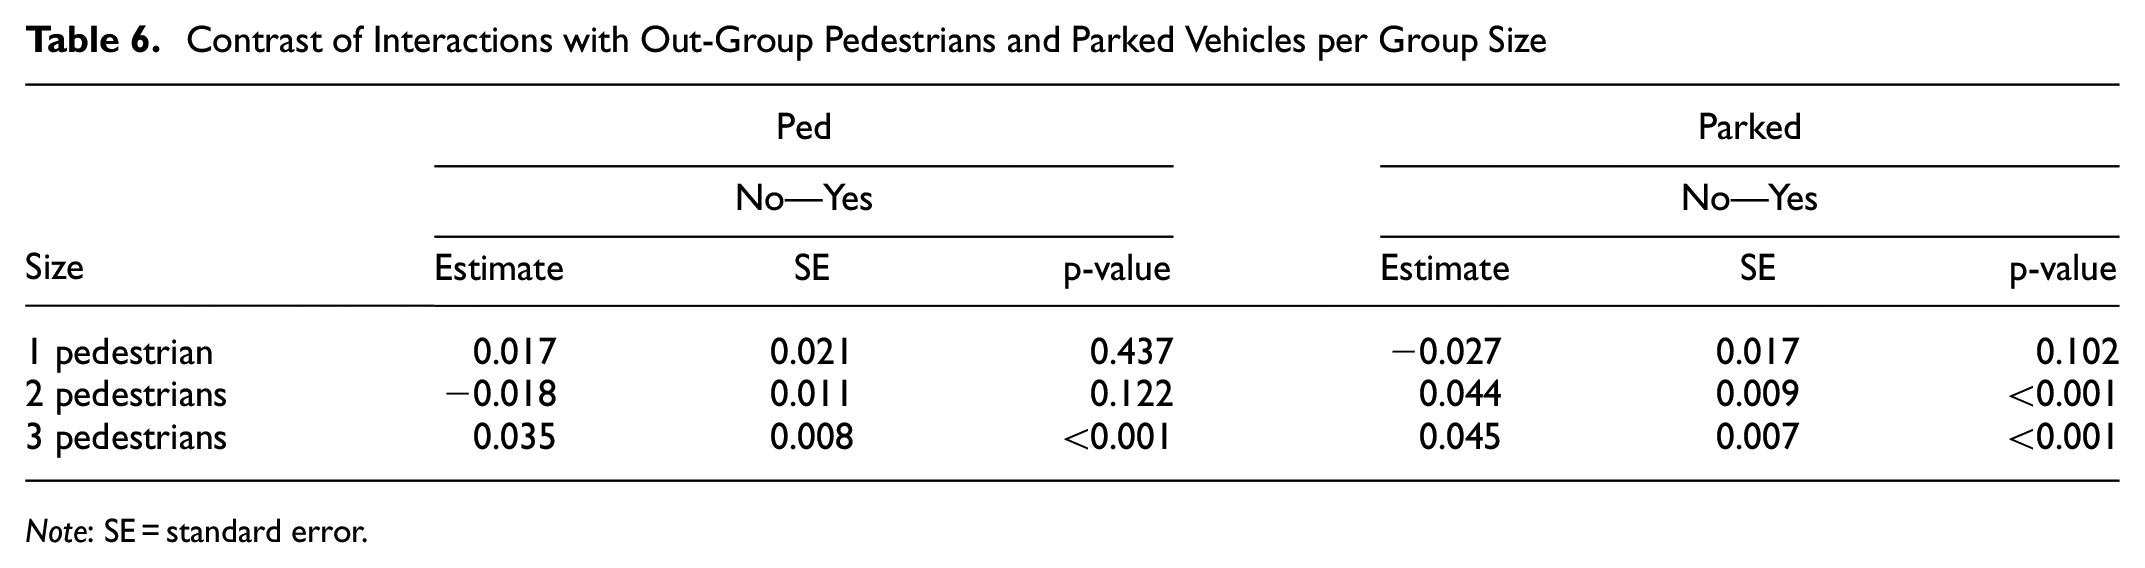
Table 6 presents the contrast comparing the effect of the presence of pedestrians outside the group (Ped) and parked vehicles (Parked) for each group size (Size). These results reveal that the difference between having or not having interactions with pedestrians outside the group was significant only for triads. In the case of interactions with parked vehicles, it was significant for dyads and triads. Without these interactions, the observed pedestrians’ speed was higher.
Contrast of Interactions with Out-Group Pedestrians and Parked Vehicles per Group Size
Note: SE = standard error.
The average speed also varies according to the group sex (Figure 14). It is important to emphasize that although there was a similar pattern of average speed according to the phases, the pattern of the average speed per group sex was not as homogeneous as per group size.
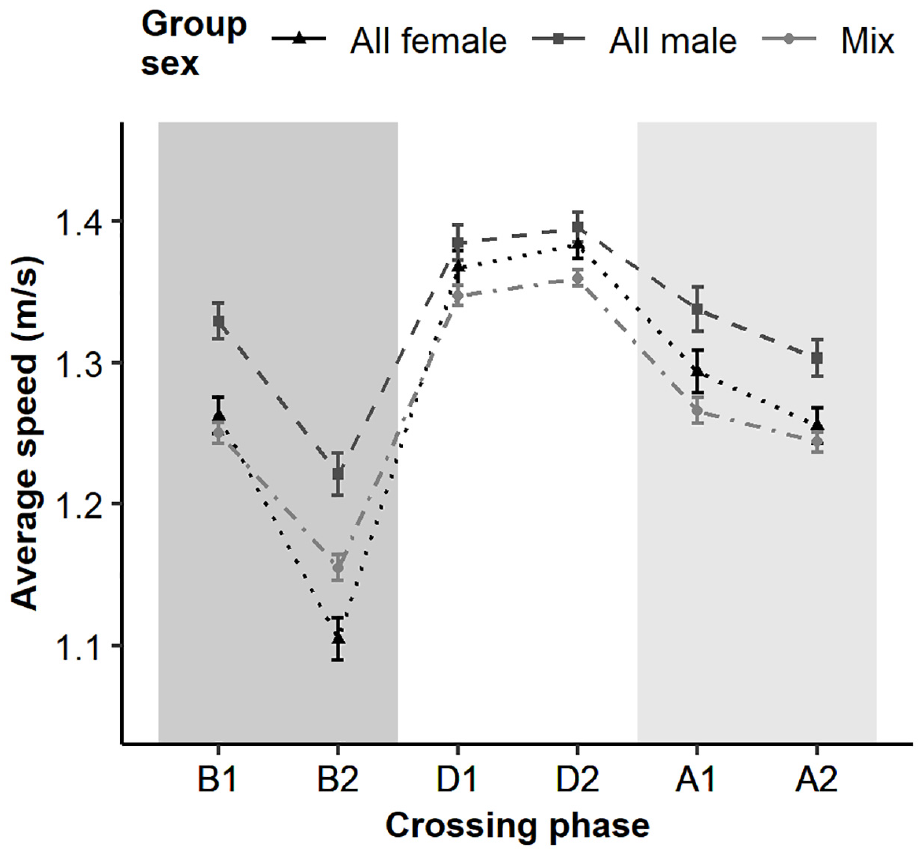
Pedestrians’ average speed and respective standard error according to the group sex per crossing phase.
Concerning the phase before crossing (B1 and B2), there was also a marked reduction in the average speed that was more pronounced for women. The reduction in speed between B1 and B2, in most cases (1, 2, and 3 pedestrians and mixed groups and all-men), was between 8% and 9%, except for female groups where the average speed reduction was of 13% (Table 7— phase B2). Additionally, between B2 and D1, the average speed increase in the female groups was also the highest (24%). Although this study did not evaluate the decision-making process to cross, these results indicate that the group sex could be a relevant factor for the crossing time.
Pedestrian Average Speed by the Phase According to the Size and to the Sex of the Group
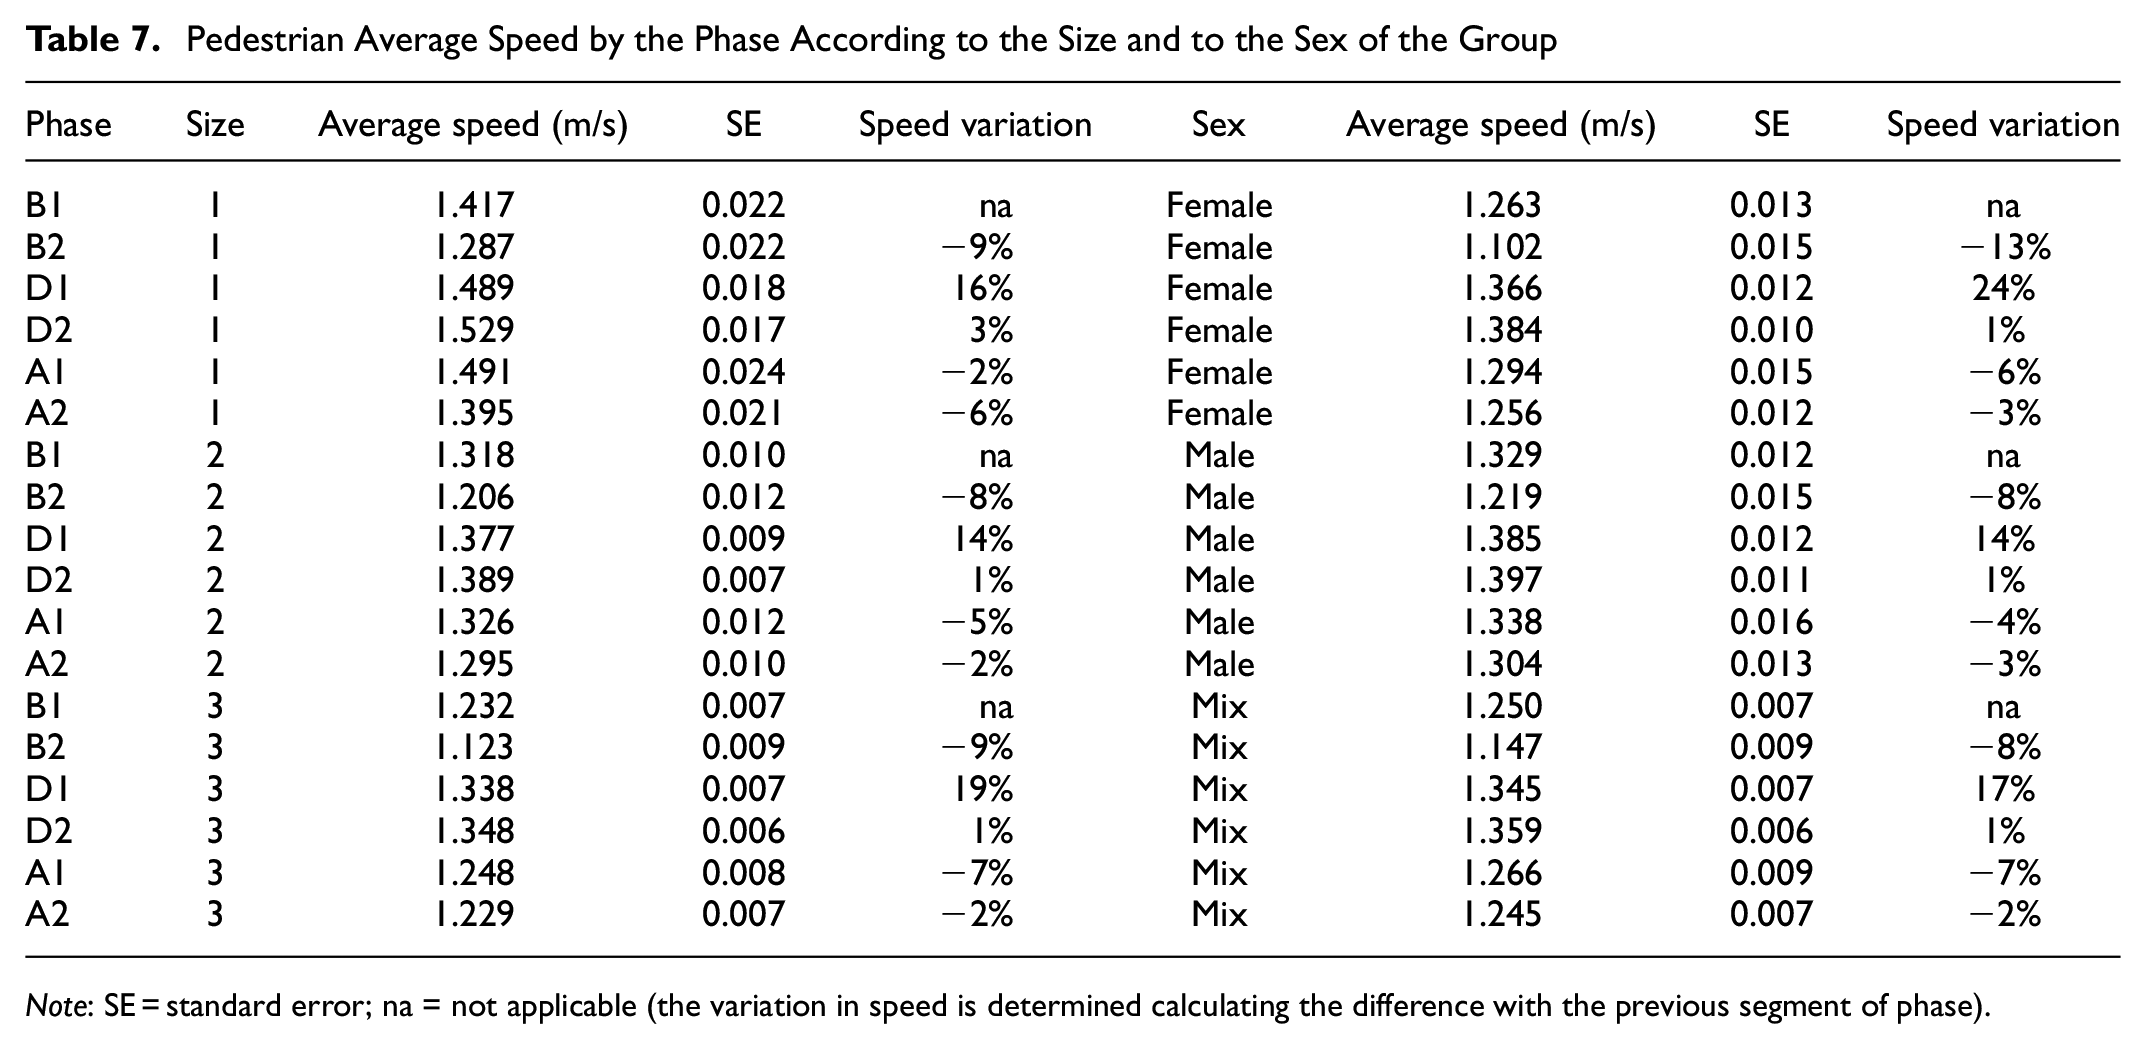
Note: SE = standard error; na = not applicable (the variation in speed is determined calculating the difference with the previous segment of phase).
As can be noted in Table 8, there was a clear difference between the average speed of the all-male groups compared with the all-female ones before and after the crossing. The differences between all-female and mixed groups were only significant before the crossing. This could indicate that women tend to slow down even more when deciding to cross, which is why only in this phase there were significant differences from the mixed groups.
Contrasts of the Group Sex Per Crossing Phase
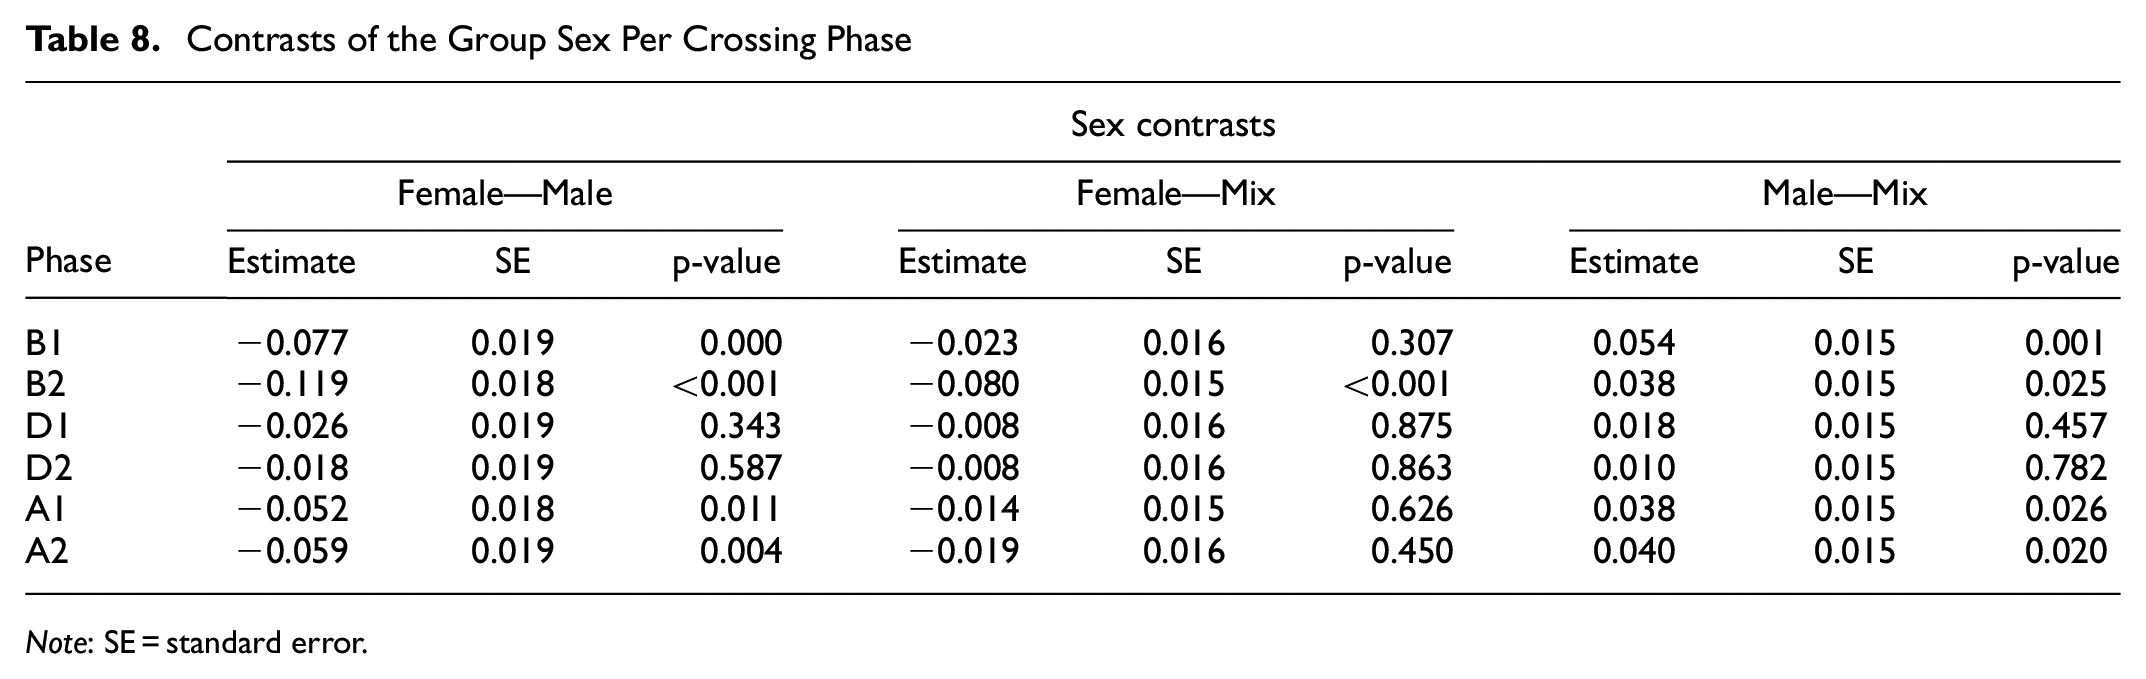
Note: SE = standard error.
Interactions between group sex (Sex) and the presence of out-group pedestrians (Ped), parked (Parked) and approaching vehicles (Veh) were also found to be significant. The results of the contrast between these variables are shown in Table 9.
Contrast of Interactions with Out-Group Pedestrians, Parked Vehicles and Approaching Vehicles Per Group Sex
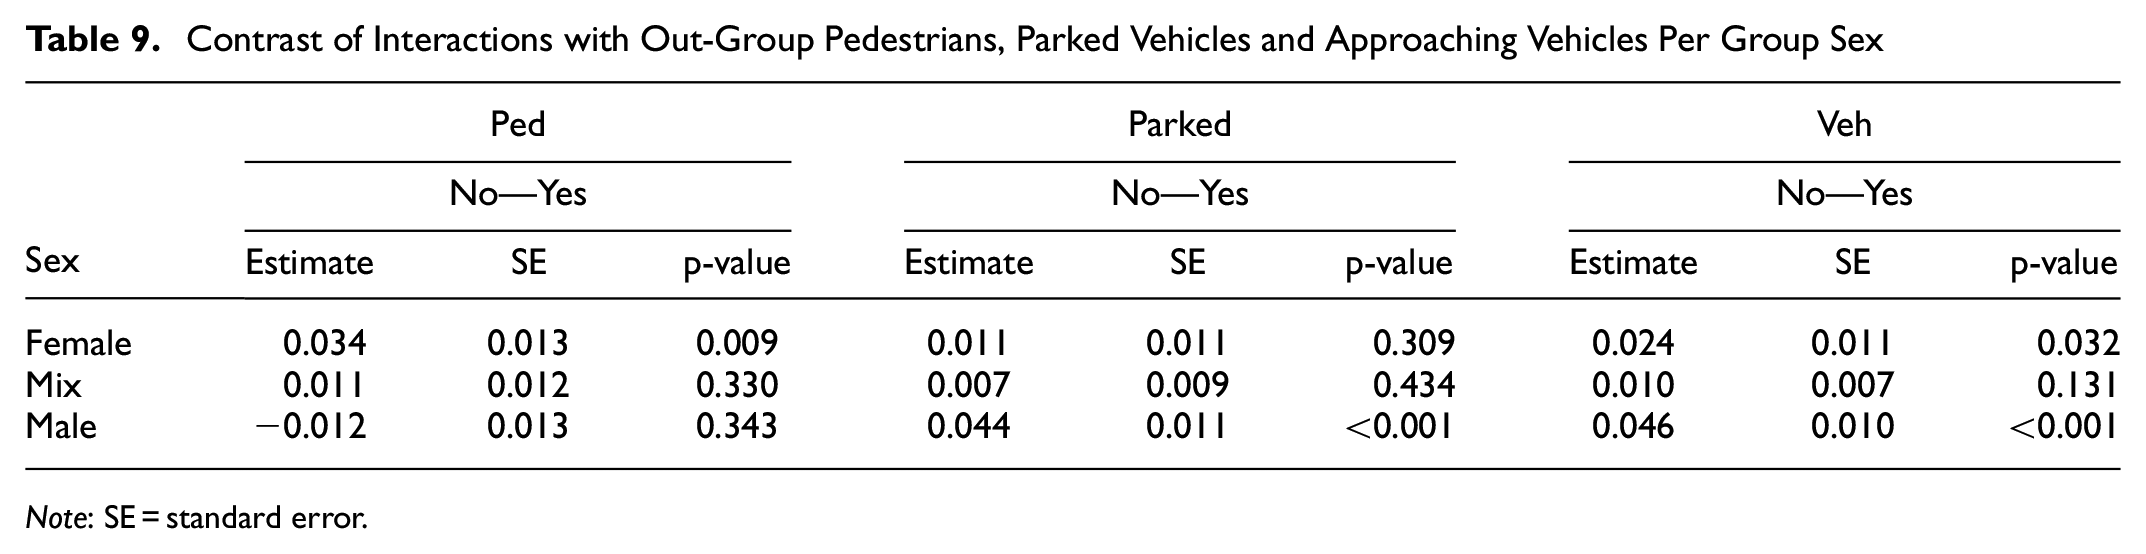
Note: SE = standard error.
As indicated by the model (see also Figure 15), the speed increase in the female groups was significant when there were no out-group pedestrians compared with when there were (Figure 15a). In the male groups, the increase in speed was significant when there were no parked vehicles versus when there were parked vehicles (Figure 15b). Finally, in these two types of groups (male or female), the increase in speed was significant when no vehicle was approaching (Figure 15c).
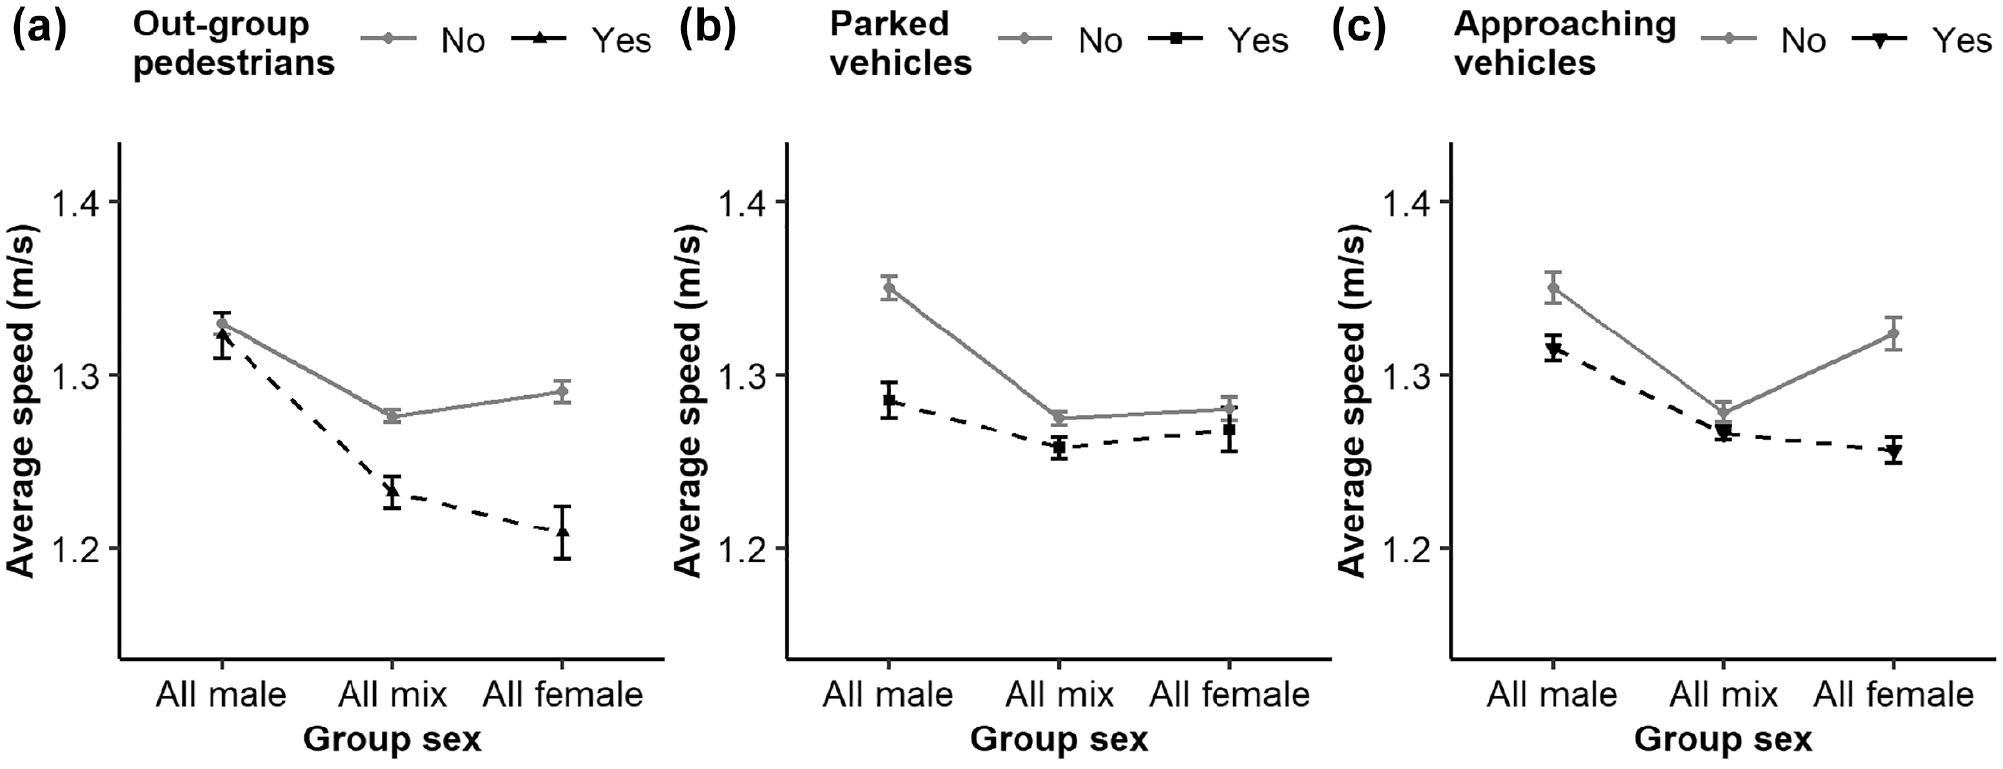
Pedestrians’ average speed and respective standard error per group sex according to (a) presence of out-group pedestrians, (b) presence of parked vehicles, and (c) presence of approaching vehicles.
External Factors
With reference to the external factors influencing pedestrian walking speed, the interaction between approaching vehicles (Veh) and parked vehicles (Parked) was significant, as were the interactions between approaching (Veh) and parked vehicles (Parked) with the crossing phase (Phase).
On the one hand, the model results show that differences in the pedestrians’ speed with or without parked vehicles were significant only when the vehicles approached (
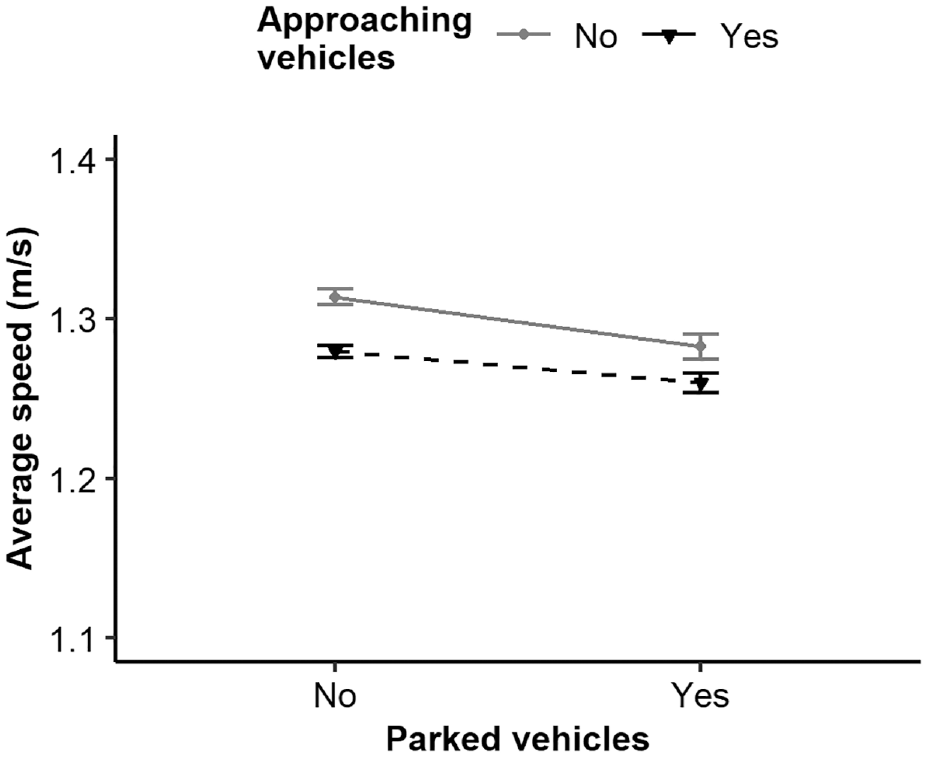
Pedestrians’ average speed and respective standard error according to the presence of approaching vehicles per presence of parking vehicles.
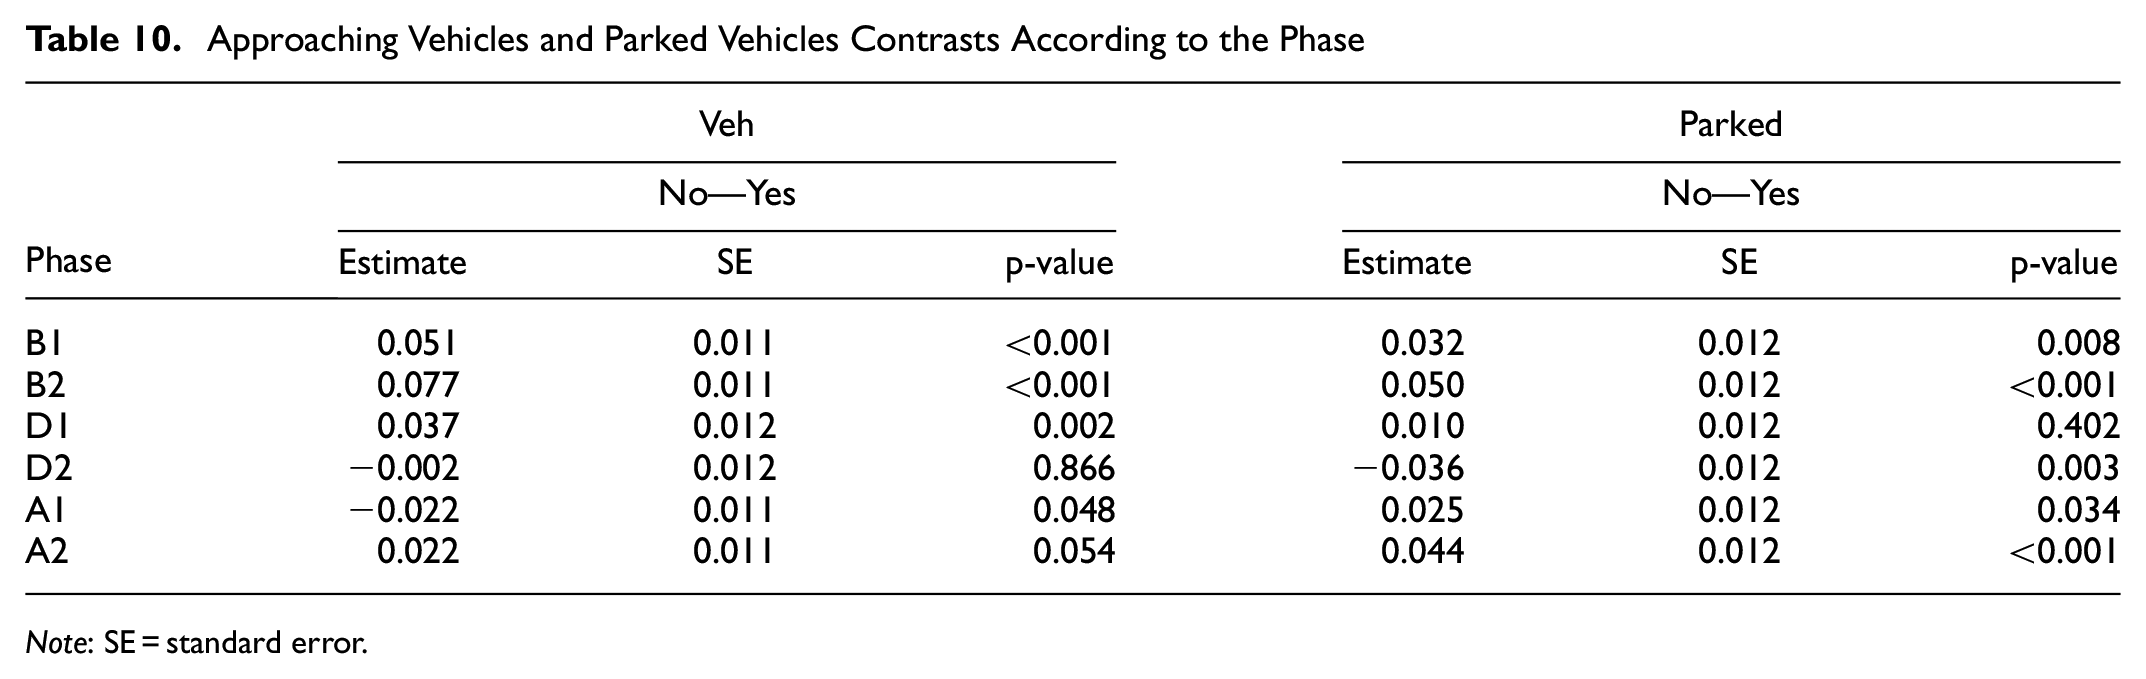
On the other hand, in the interactions between approaching and parked vehicles with the crossing phase, as shown in Figure 17, a and b , there was a similar pattern in both cases, according to the crossing phase. This pattern was similar to the one mentioned previously: speed reduction before the crossing, speed increase during the crossing, and decrease again after the crossing. The results of the contrasts used to analyze these interactions are presented in Table 10.
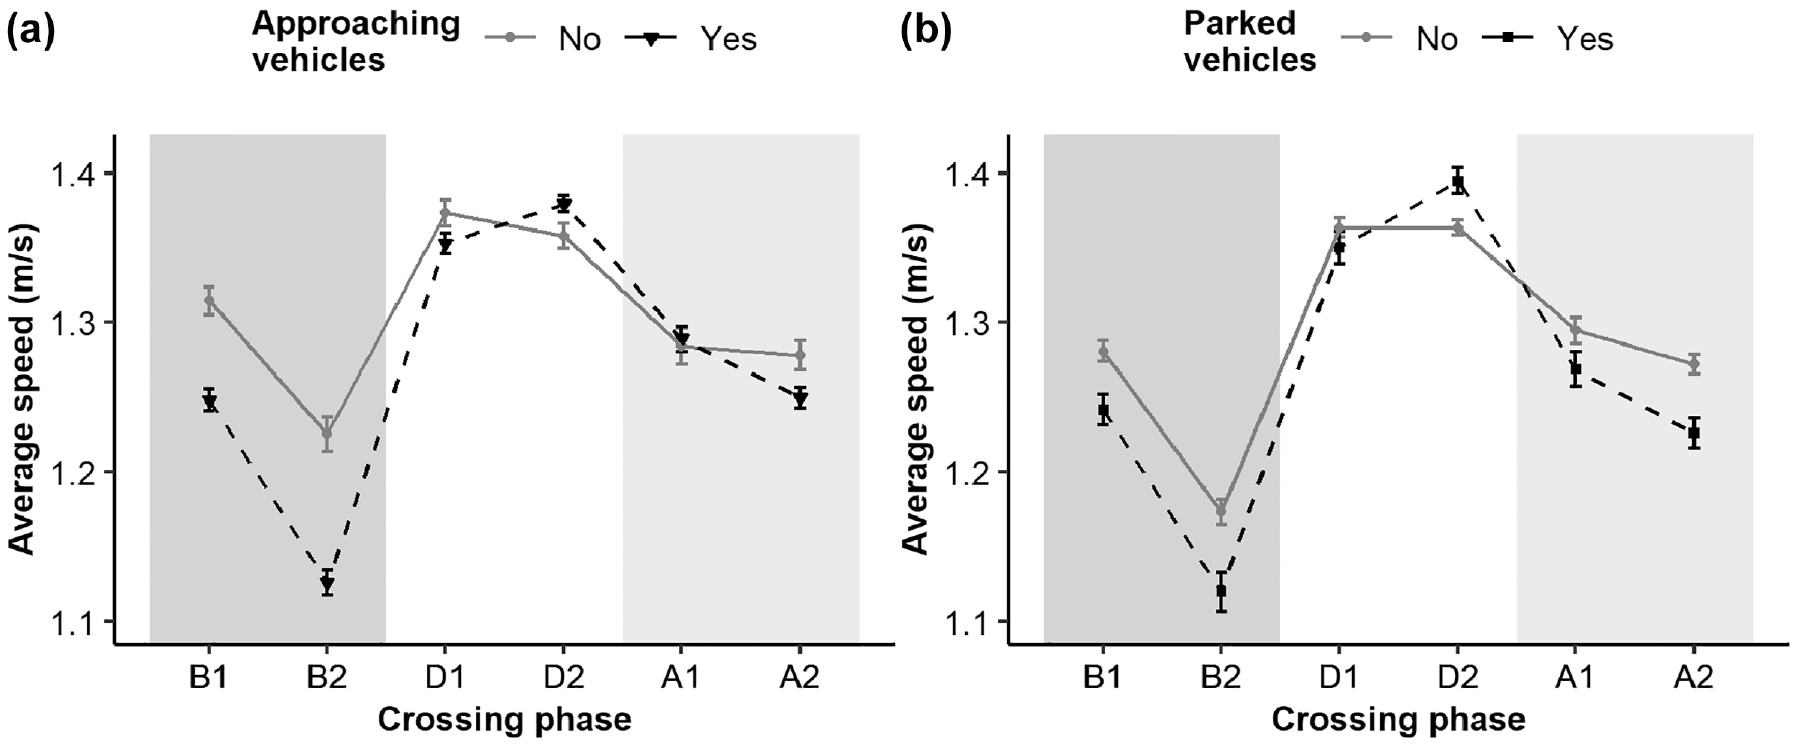
Pedestrians’ average speed and respective standard error per crossing phase according to (a) presence of approaching vehicles, and (b) presence of parked vehicles.
Approaching Vehicles and Parked Vehicles Contrasts According to the Phase
Note: SE = standard error.
Without approaching vehicles, the average speed was higher in phases B1, B2, D1, and A2 (Figure 17a), and the model confirm a significant positive difference. On the contrary, there was a significant difference with a negative coefficient in the first segment after the crossing. These results seem to indicate that when pedestrians confirm that there are no approaching vehicles, they begin to slow down during the road crossing (Phase D2), as on reaching the other side of the road (phase A1), their speed was lower in comparison to when vehicles were approaching. Conversely, when a vehicle approached or waited, pedestrians increased their speed during the crossing.
The pattern according to the phases without parked vehicles was similar to that without approaching vehicles (Figure 17b). Although smaller differences between the speed with or without a parked vehicle exist before the crossing, the contrasts confirm these positive differences.
Before the road crossing (B1 and B2) if there was a parked vehicle, the model results showed that the speed of pedestrians decreases, perhaps owing to difficulty of seeing the oncoming vehicles. During the crossing in D2, the pedestrians increased their speed even more if there was a parked vehicle. This behavior could be explained by the pedestrians’ desire to get closer to the parked vehicle faster as a way of becoming protected from an approaching vehicle. As previously shown, the difference between having or not parked vehicles was only significant when vehicles were on approach. After the crossing, the speed was lower, and the differences were significant.
Finally, within the characteristics of the infrastructure, there were significant effects of the effective width of the zone,
Average Distance Between Pair of Pedestrians
A sample of 3279 observations of the distance between pairs of pedestrians was analyzed. As explained in section 2.3, the random effects considered for these models were the ID of the pair of participants and the ID of the group of participants.
Table 11 shows summary statistics for the average distance between pairs of pedestrians according to the same variables analyzed the walking speed. With these results, it was possible to observe that, on average, the distance between pairs of pedestrians was greater in triads compared with dyads, in male groups compared with female and mixed, and during crossing compared with before.
Descriptive Statistics of the Distance Between Pairs of Pedestrians
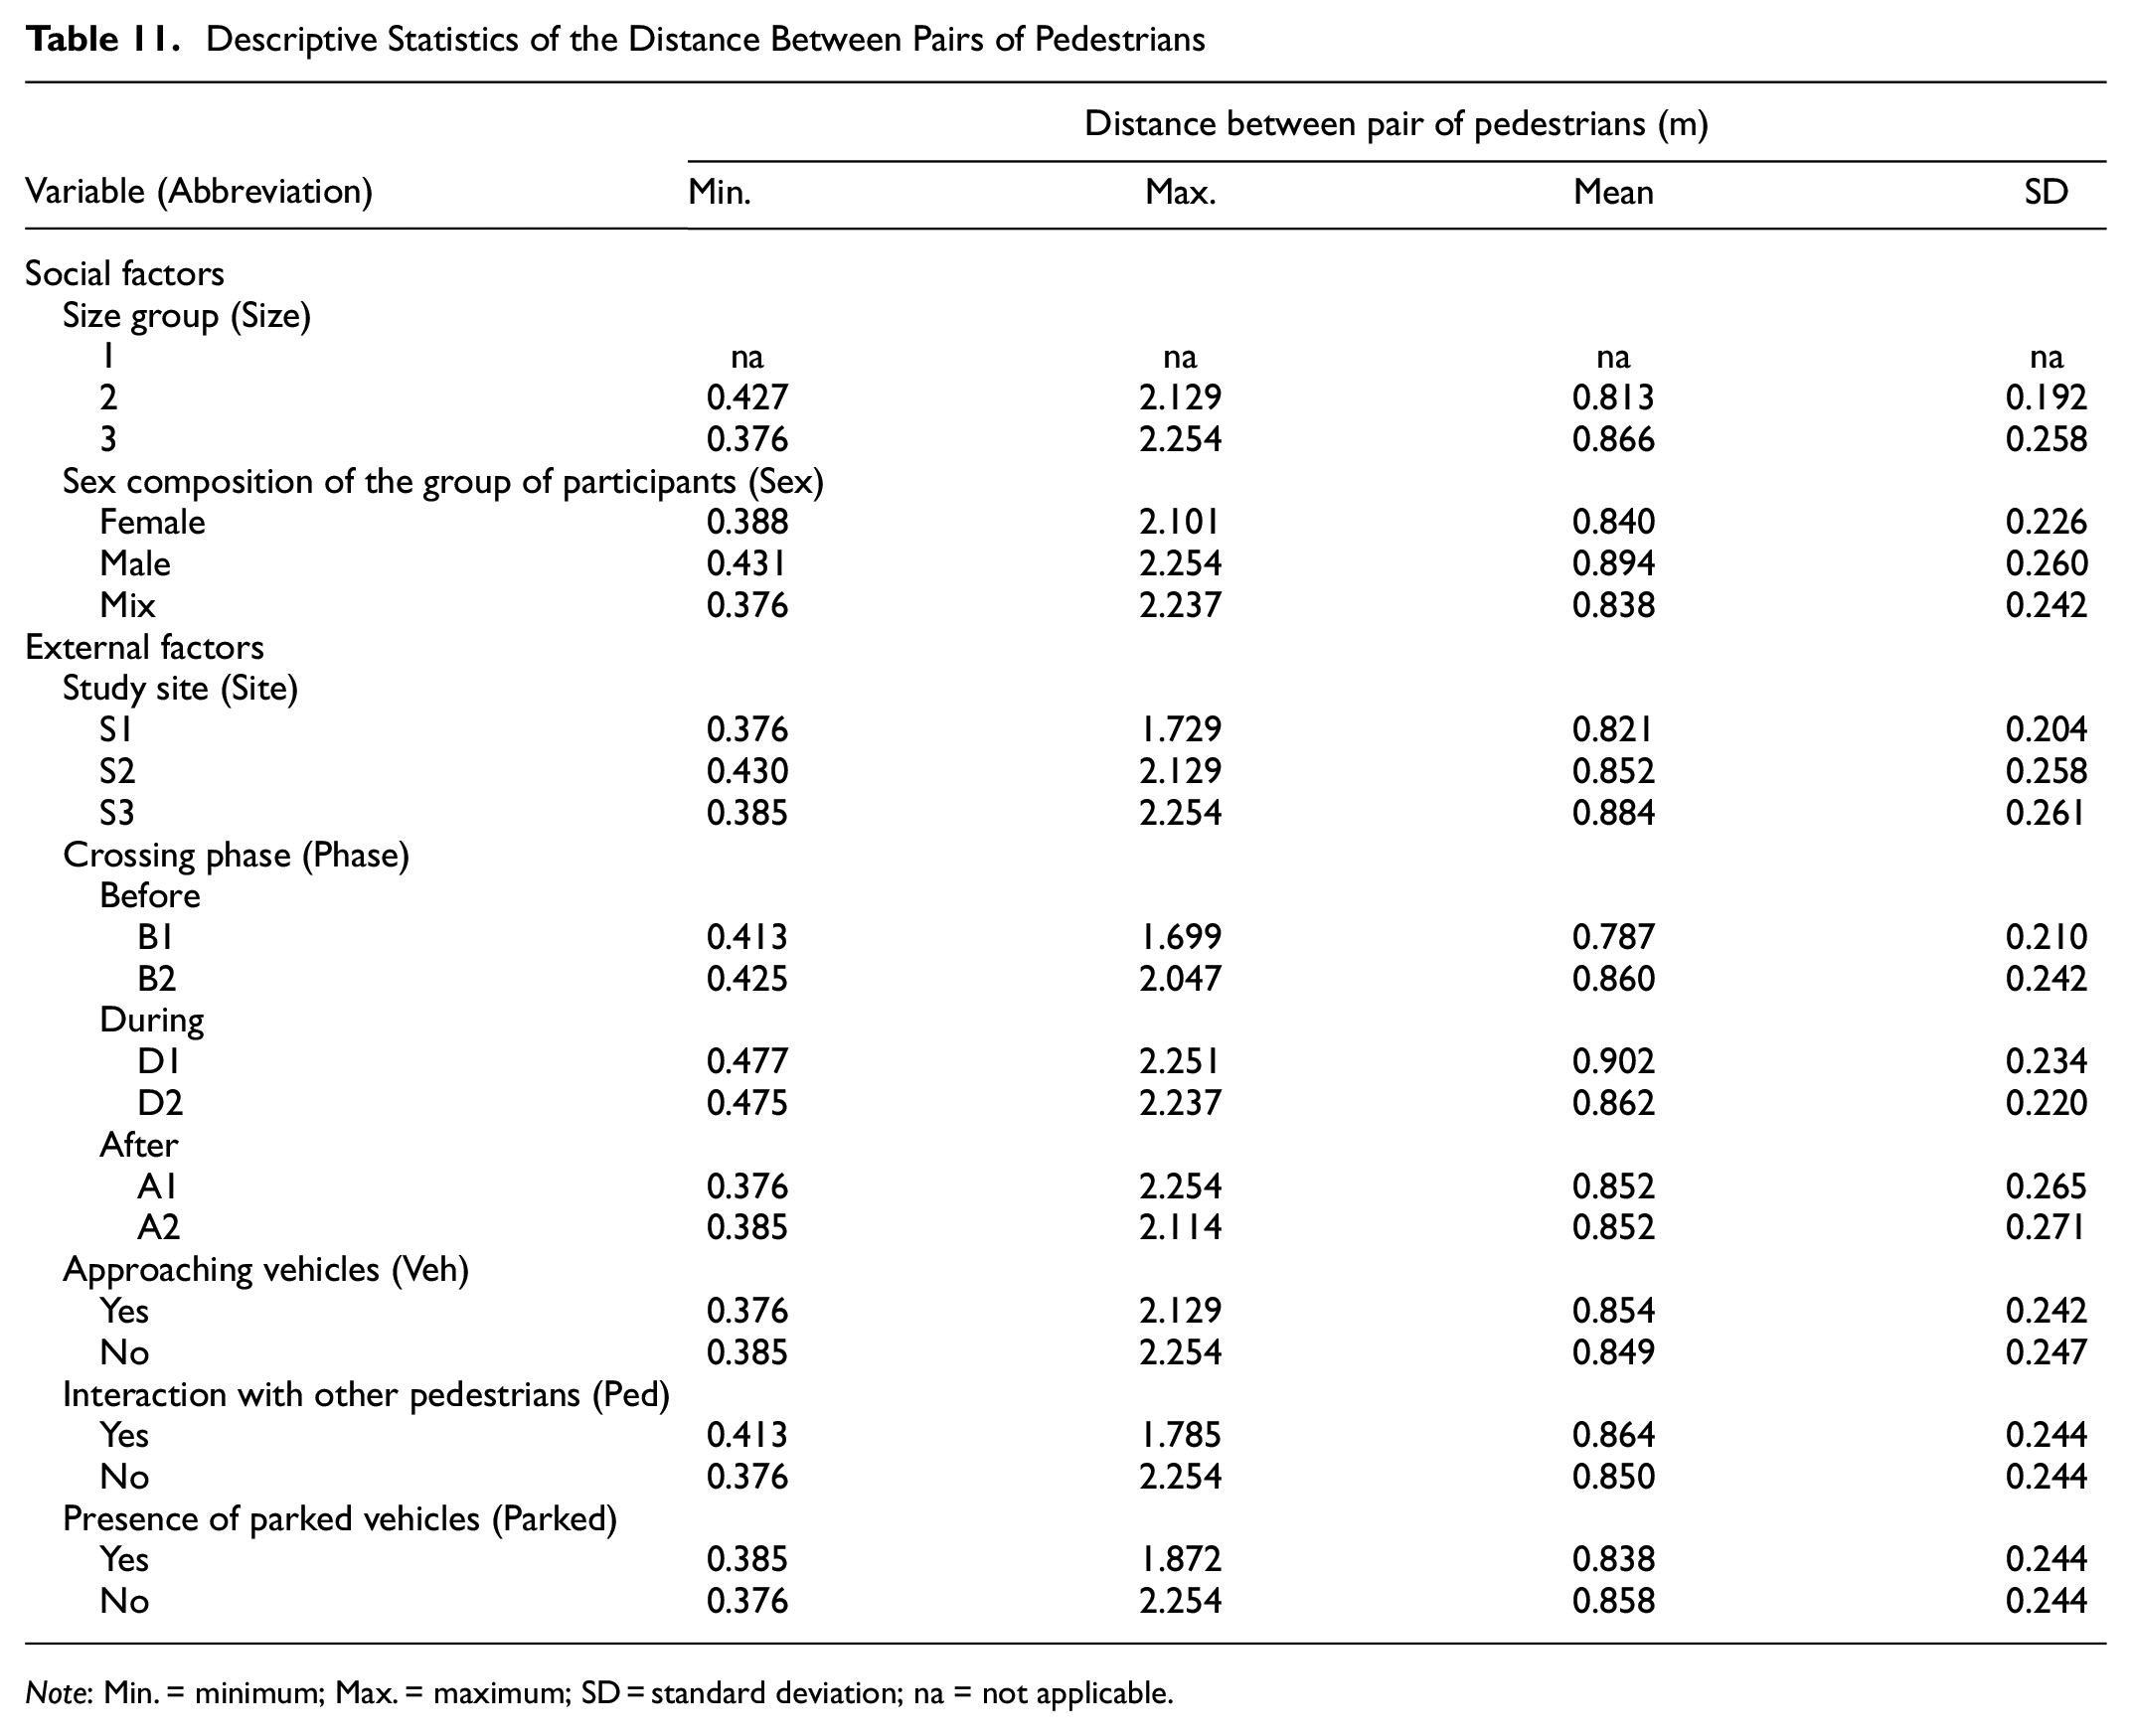
Note: Min. = minimum; Max. = maximum; SD = standard deviation; na = not applicable.
As with the pedestrians’ walking speed, the model was fitted using LMMs. The final model contains all significant predictor variables (Equation 4). Full summary statistics of the model are presented in Appendix C. Contrasts were used to analyze the interactions between variables and to summarize the model results according to each variable.
For
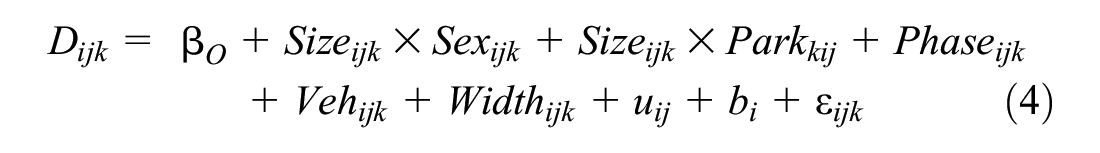
Satterthwaite’s test was used to identify variables with significant influence on the average distance between pedestrians, and the interactions. The results are presented in Table 12. The non-significant social factor was D_Leg (leg length) and external factors were: Pav (pavement), W_Lanes (lane width), L_Crosswalk (crosswalk length), Dist (Distance from the crosswalk to the nearest intersection), and Ped (interaction with other pedestrians).
Satterthwaite’s Test Results for the Model of the Average Distance Between Pairs of Pedestrians
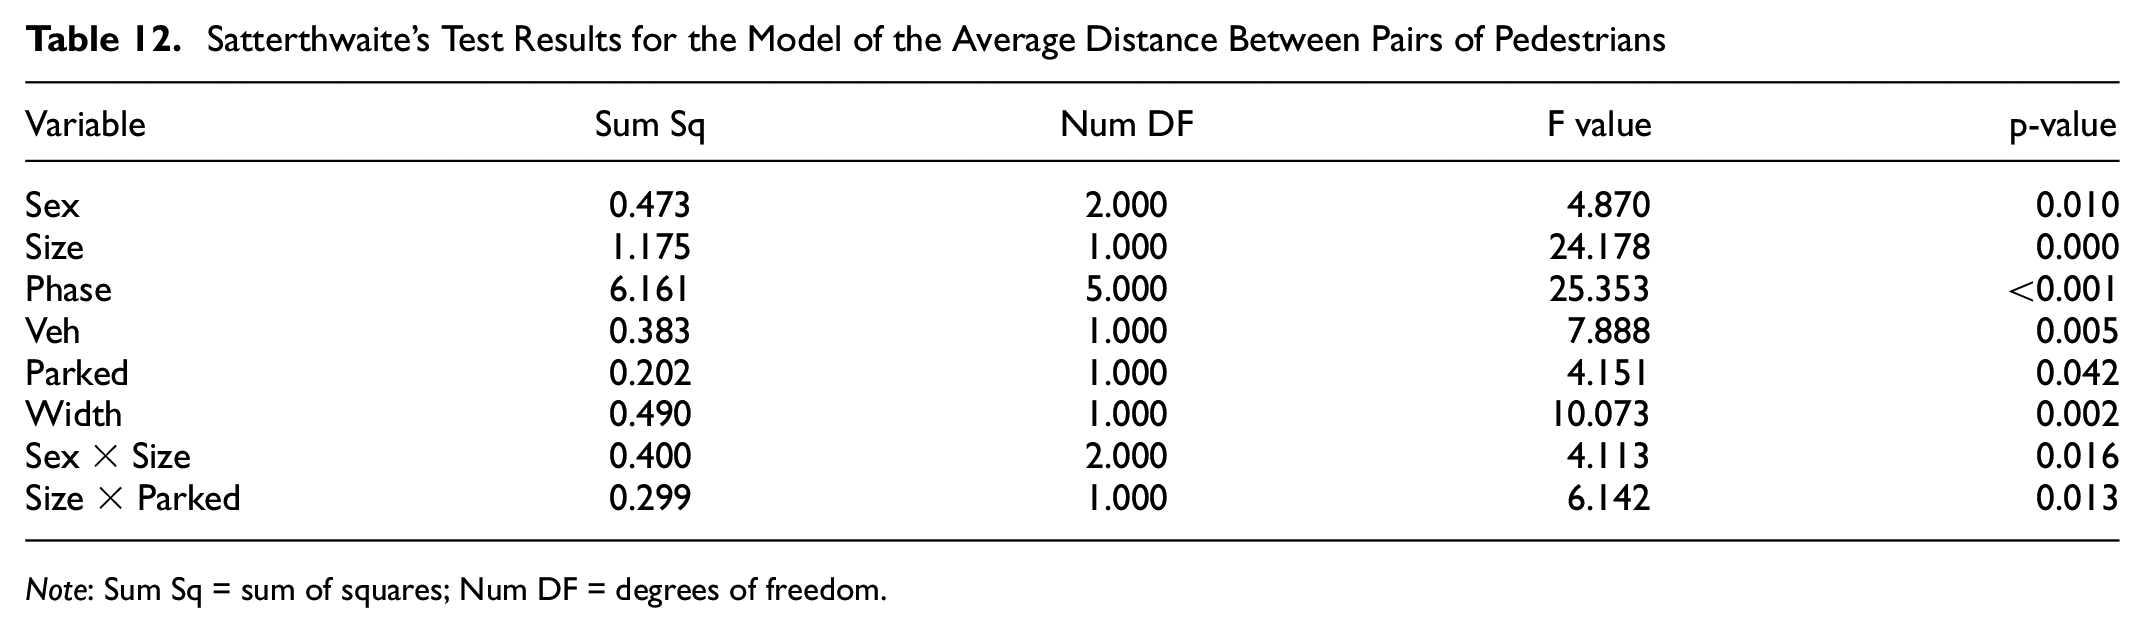
Note: Sum Sq = sum of squares; Num DF = degrees of freedom.
Social Factors
The interactions between group size and sex were statistically significant. As illustrated in Figure 18, distances between pedestrians were greater for triads than for dyads. The variation was 10% for all-female, 7% for all-male, and 4% for mixed groups.
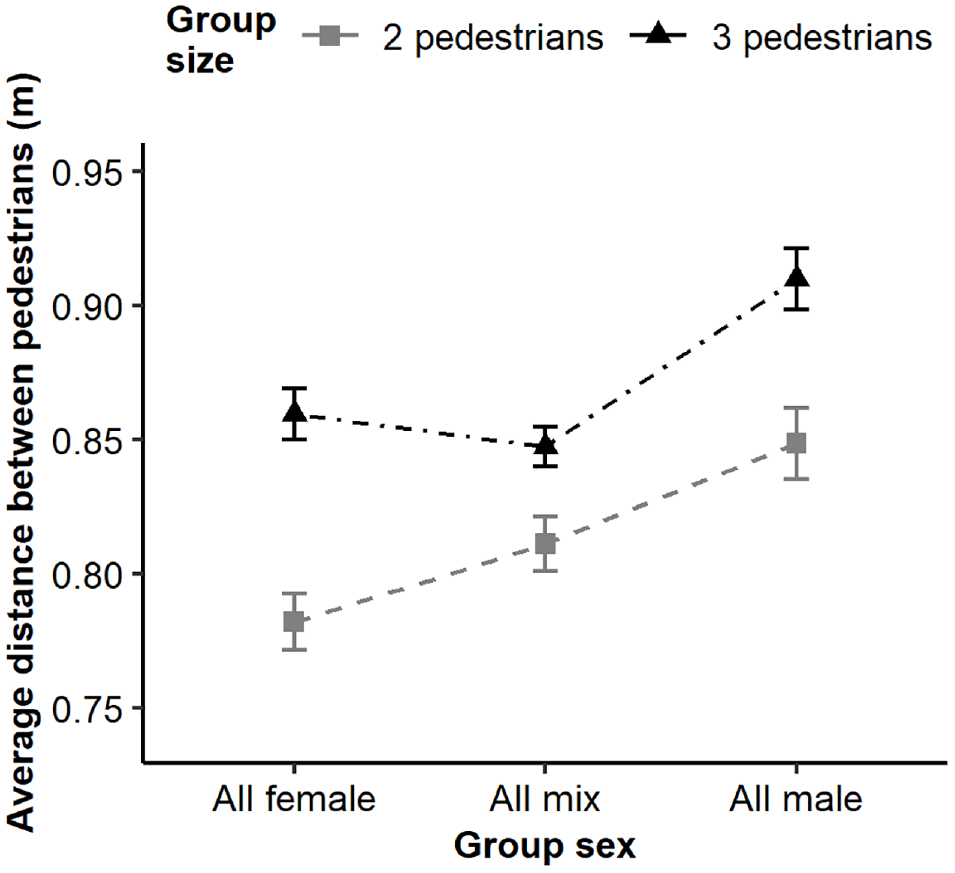
Average distance between pairs of pedestrians and respective standard error according to the group size per group sex.
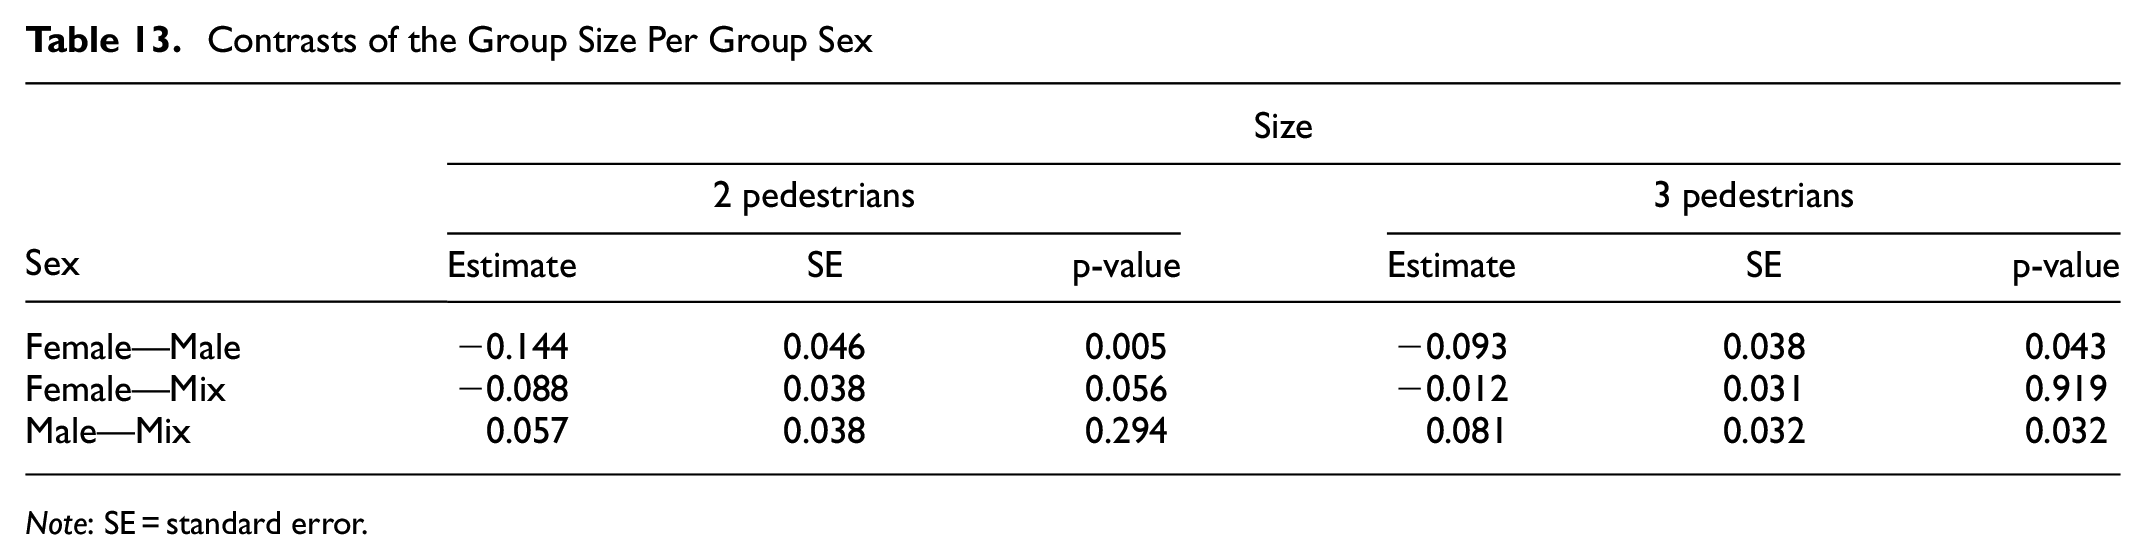
Contrasts were utilized to analyze the effect of the interaction between sex composition (Sex) and group size (Size) on the distance between pedestrians. When comparing groups of dyads and triads based on sex, significant differences were observed in male groups (
Furthermore, male pairs appear to maintain a greater distance between them compared with mixed or female pairs. The contrasts for the interaction between sex and size revealed a significant difference between males and females for dyads and triads. There was only a difference between male and mixed groups for triads, as shown in Table 13.
Contrasts of the Group Size Per Group Sex
Note: SE = standard error.
Interactions of group size (Size) with parked vehicles (Parked) were also significant for the distance between pedestrians. As already mentioned, the distance is greater when the size of the group increases. However, Figure 19 shows that without parked vehicles, the distance was greater than with parked vehicles, particularly for groups of two pedestrians. The contrast confirms these positive differences. (
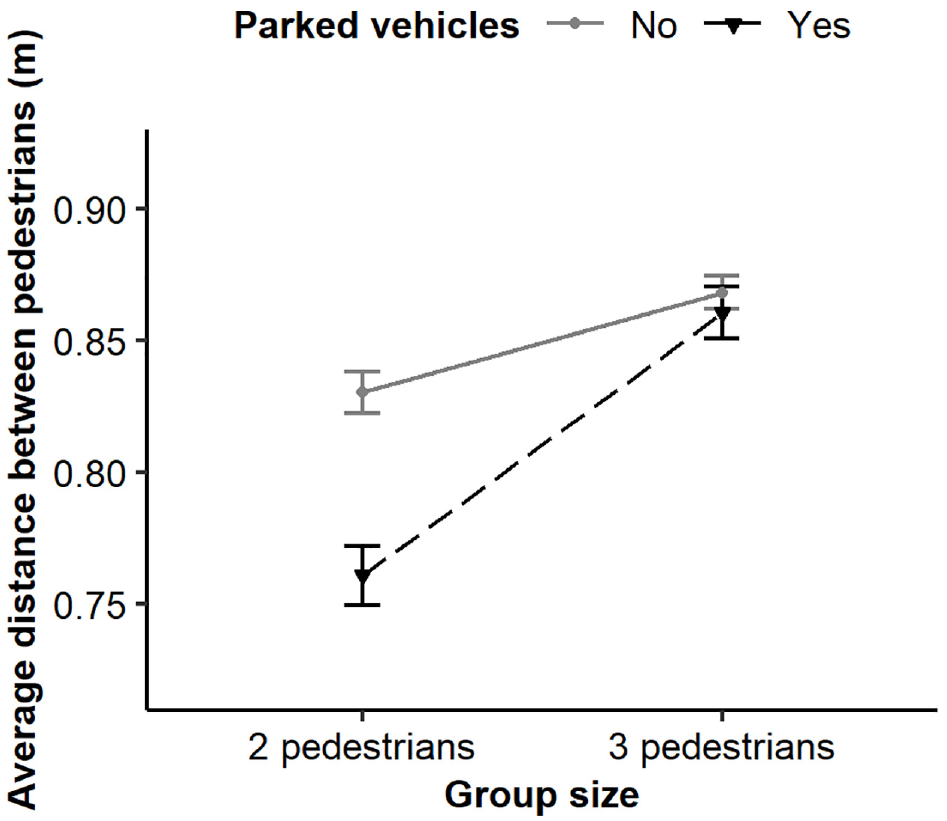
Average distance between pairs of pedestrians and respective standard error according to the presence of parked vehicles per group size.
External Factors
Concerning external factors, the effective width of the zone (Width) (
Furthermore, the distance between pedestrians depends on the crossing phase (Figure 20). Near the crosswalk (B2) the distance increases and the differences between the segments (B1 and B2) before the road crossing were significant (
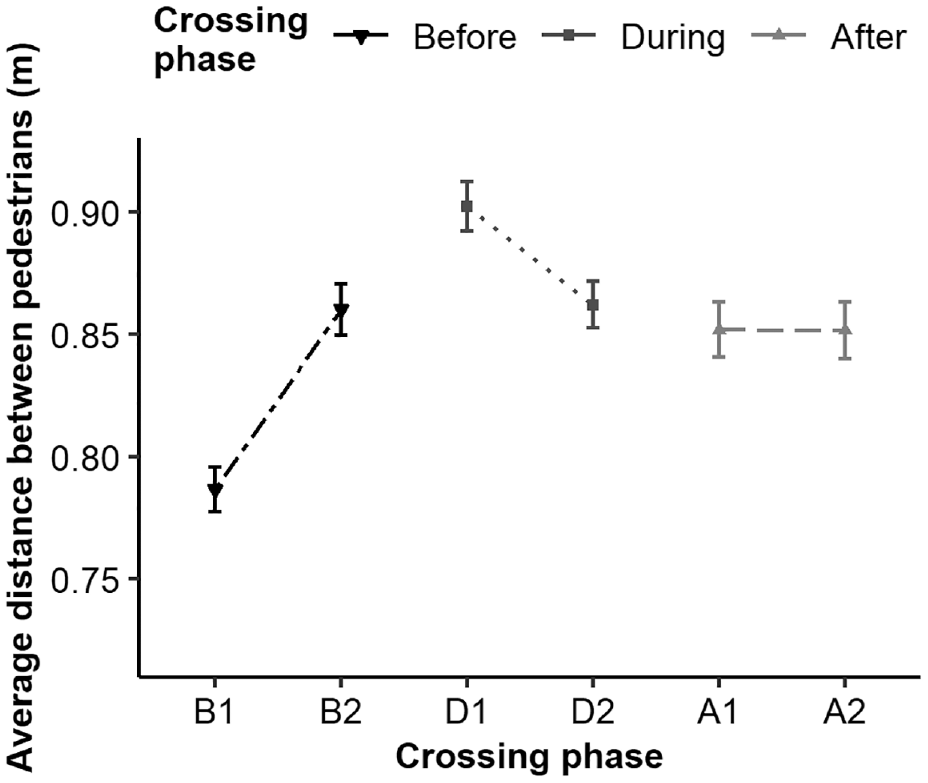
Average distance between pedestrians by crossing phase.
Between the segment during (D1-D2) and after (A1-A2) the crossing there were no significant differences (
During the first segment of the road crossing (D1) the average distance increased, and the difference between the previous segment (B2) was significant (
Discussion
It is indicated by the findings reported here that the dependence of walking behavior of social group pedestrians on group size and the composition by sex is also commonly observed in the road crossing context under normal conditions of low pedestrian density.
Size
An increase in group size was found to be associated with a decrease in average speed and an increase in average distance between pairs of pedestrians. Previous studies have shown that in areas without vehicle interactions, such as commercial areas, streets, or inside universities, social groups walk at a slower speed than isolated pedestrians ( 3 , 17 , 30 ). The decrease in speed by the groups was attributed to the need to maintain cohesion between individuals to facilitate social interactions ( 3 , 17 ). However, these studies were conducted under medium to high pedestrian densities, and the decrease in speed could be an effect of the group’s difficulty to stay together. Similarly, it was found in the present study that pedestrian groups also walked at a lower speed under low-density conditions, even while crossing the street.
With regard to the distance between pedestrians, the largest distances were observed among triads compared with dyads ( 3 , 27 ). This could be explained by a tendency for greater intimacy among couples among triplets ( 27 ). Nevertheless, it is also possible that triads organize themselves differently to facilitate communication. For instance, on sidewalks, where there is limited space, they may need to adopt different formations, such as a “V”-like shape observed by Moussaïd et al. ( 3 ), where the distances between people are greater.
Sex
The average speed and distance are also affected by the sex composition of the group. Firstly, a clear difference in average speed was observed between male groups and female/mixed groups before and after the road crossing, with male groups showing higher speed. These findings were expected, as males are generally associated with higher average speeds than females ( 48 ), and other studies have shown that male groups walk faster than females and mixed groups ( 7 , 27 ). Costa ( 7 ) suggested that the deeper the affective involvement between a couple (mixed dyads), the slower the walking speed tends to be. In this study, the participants were friends, and little difference was found between the walking speed of female and mixed dyads (except before the road crossing).
In contrast, Federici et al. ( 30 ) did not observe differences in walking speed according to the sex of the group. However, the analysis conditions of these two works were different, as Costa ( 7 ) observed the group behavior of pedestrians while walking on sidewalks and in pedestrian areas in different urban settings, while Federici et al. ( 30 ) focused on investigating pedestrian dynamics in medium-high density situations with observations of incoming pedestrian flows to a university admission test. This difference could indicate that in normal or/and low-density conditions, sex can be a relevant factor in the speed of pedestrians.
Secondly, male groups maintained a greater distance than the female groups (dyads and triads), as well as the mixed triads. No difference was observed between female and mixed groups. Similar results were reported by Costa ( 7 ), who found that male dyads and triads tended to walk together less often than female dyads, and mixed dyads walked together more often than same-sex dyads. This is consistent with the literature on the topic of interpersonal distance, which indicates that female pairs tend to maintain closer distances than male pairs, possibly owing to a greater predisposition of women to be affiliative (see Uzzell & Horne [ 49 ] for a review and discussion).
Phases
It was found that neither the pedestrians' average speed nor the distance between pairs remained constant throughout the three crossing phases, according to the results. Empirical observations in previous studies of stairs inside a university had shown that the average distance for groups of different sizes is stable for the purpose of maintaining group structure ( 50 ). However, the results of this study showed that the distance between pairs of pedestrians changed according to the phases of the road crossing. One possible reason for this may be that individuals increase their distance from each other (separate) near the crosswalk when deciding whether to cross or not. Furthermore, since the width of the crosswalk is usually greater than the effective width of the sidewalks, the distance between pedestrians could also be expected to increase during the road crossing. However, in this study, the effect of the effective width showed that the distance was smaller in the broader zones.
With regards to the average speed, there was a significant reduction before the road crossing, followed by an increase during the crossing and a posterior reduction back to the initial speed. This pattern was expected since before the crossing in segment B2, near the crosswalk, pedestrians evaluate whether they can cross or not, and while making that judgment, they reduce their speed. During road crossings, an increase in speed was also expected since previous studies have reported that pedestrian speeds are higher when crossing streets than on sidewalks (although the behavior of social groups has not been previously analyzed ( 51 ).
An important conclusion of this study is that the average speed pattern is maintained through the phases by group size (higher speed for singles and lower for groups in all phases). However, there were some differences in the pattern throughout the phases according to the groups’ sex. Before the road crossing, the speed reduction was higher for female groups, followed by mixed and male groups. It was the only phase where there was a significant difference between females and mixed groups. Although the objective of this study was not to analyze the effect of sex on the decision-making process to cross, the observed differences may indicate that sex plays an important role when pedestrians decide to cross. Also, the effect of oncoming vehicles was significant on average speed by sex composition but not by group size.
This observation is consistent with those of Holland and Hill ( 52 ). They compared the intention to cross and the perceived risk through the answers to a questionnaire in which people were asked to evaluate whether to cross or not in hypothetical textual risk descriptions, concluding that women were less likely than men to try to cross under risky situations. Also, Díaz ( 53 ) analyzed the attitude toward (illegal) mid-block crossing and found that men reported more violations than women.
Unlike before and after the crossing, during the road crossing, there was no significant difference in average speed between the group sex composition. This could indicate that the behavioral approach was different between phases. During the crossing, the objective of reaching the other side as quickly as possible may override the behavioral characteristics on the sidewalks. The greater the risk involved in walking, the higher the walking speed ( 51 ). This contrasts the conclusion of Montufar et al. ( 48 ), who found significant differences between the speed of men compared with women during street crossings, although they did not study the behavior of pedestrians in groups.
Interactions with Parked Vehicles and Out-Group Pedestrians
The results revealed that the presence of parked vehicles had an effect according to the phase. If there was a parked vehicle before the road crossing, the pedestrians’ average speed decreased. On the other hand, during the crossing, pedestrians increased their speed even more. These results may align with the conclusions of previous studies, which analyzed the acceptance of the gap for mid-block street crossings and red-light violations. On the one hand, the presence of illegal parking seems to discourage pedestrians from crossing because it affects pedestrians’ visibility, forcing pedestrians to be more careful and reject shorter time gaps for crossing, according to Yannis et al. ( 51 ). This could be related to the decreased speed before crossing. On the other hand, according to Dommes et al. ( 52 ), the presence of parked vehicles generated red light violations, suggesting that parked vehicles may increase the pedestrians' feeling of safety once the road width decreases. This could be related to increased speed during the crossing once the decision to cross has been taken.
Finally, the results show that, in conditions of low pedestrian density, the differences in average speed owing to interaction with other pedestrians were significant for triads and groups of women. Groups of pedestrians slow down, perhaps to avoid splitting up. Additionally, no significant differences were found in the average distance. This may indicate that in normal situations, young pedestrians only change their speed and do not change their organization. This was not unexpected since it is known that the presence of other pedestrians strongly influences average walking speeds, depending on pedestrian density ( 51 ).
Conclusions
Even though it had been revealed in previous studies that pedestrian traffic comprises groups and that social interactions are crucial for organizing human crowds, little or no research had been conducted on the behavior of pedestrians’ social groups under normal conditions near pedestrian crossing sites.
This study’s empirical observations confirmed that at least 40% of observed pedestrians walk in a group. The findings suggest several critical factors in the movement preferences of social groups, even under normal conditions and in places with low pedestrian density. It was found that typical walking patterns arose from local interactions between group members. Differences in speed and distance between young pedestrians depended on social factors (group size and sex composition) and external factors (crossing phases and interaction with other pedestrians, approaching and parked vehicles).
The results of this study should help to increase understanding of how young pedestrians in social groups interact with each other and with the environment, thus improving the way scientists, engineers, policymakers, and designers increase the safety of vulnerable road users. The description of several fundamental elements of movement behavior (speed and distance) can be used to assign realistic values to models of pedestrian behavior based on parameters such as group size, sex composition, and crossing phases.
Furthermore, these findings could be used in risk studies of vehicle–pedestrian interactions and in new challenges concerning pedestrian dynamics, for example, to create rules and improve shared space areas, as well as to give indications to improve the automatic detection of pedestrians by autonomous vehicles.
As with any experiment, there are limitations and extensions that need to be further investigated in future studies. The conclusions drawn in this work are based on young voluntary participants. However, previous studies have reported that age affects the speed and distance between pedestrians, with older pedestrians walking at slower speeds and preferring greater interpersonal distances ( 54 , 55 ). Therefore, it is crucial to include participants from different age groups in future work on social group behavior. Additionally, future studies should consider mixed traffic conditions, including particular types of pedestrians, such as people with disabilities (i.e., wheelchair users). These individuals, for example, have different physical dimensions (i.e., weight, width, or height) that affect the required sight distance and speed, whether on sidewalks or at crosswalks ( 56 ).
Furthermore, conclusions drawn from these results about infrastructure factors for urban planning should be taken cautiously. The results have been obtained from experiences in a few urban settings, which may not represent a diversity of environments. Nevertheless, this work reaffirms the need to continue studying how pedestrians perceive and interpret differences in urban environments, such as the presence of obstacles. Another question that remains open is whether the organization of social groups results in more risky crossing decisions.
The coexistence of pedestrians and micro-mobility vehicles (MMV) presents a recent challenge for efficient and safe use of road infrastructure. MMVs are becoming more popular and widely used, potentially owing to the time savings they offer for short distances to their final destinations ( 57 , 58 ). MMVs can move at higher speeds, which can affect pedestrians’ risk perception. For instance, cyclists and electric scooter users have already been observed breaking the law by riding on sidewalks and footpaths, which could increase the rate of injuries to both pedestrians and MMV riders. Furthermore, a high density of pedestrians was found to significantly reduce the speed of (e-)cyclists ( 58 ). Nevertheless, the effect of MMV interaction on the behavior of pedestrians in social groups and the operational efficiency of shared space under low-density conditions remains unknown. Thus, it is necessary to examine these interactions in future studies.
Supplemental Material
sj-pdf-1-trr-10.1177_03611981231180206 – Supplemental material for Analysis of Pedestrians’ Road Crossing Behavior, in Social Groups
Supplemental material, sj-pdf-1-trr-10.1177_03611981231180206 for Analysis of Pedestrians’ Road Crossing Behavior, in Social Groups by Leidy Barón, Susana Faria, Emanuel Sousa and Elisabete Freitas in Transportation Research Record
Footnotes
Acknowledgements
This work is part of preparatory activities of the research project IMPACT—IMproving Pedestrians’ sAfety PerCepTion of shared streets: Auditory, visual and geometry-based strategies with reference 2022.06271.PTDC, funded by national funds through FCT—Foundation for Science and Technology.
Author Contributions
The authors confirm contribution to the paper as follows: study conception and design: L. Barón, E. Freitas; data collection: L. Barón, E. Freitas; analysis and interpretation of results: L. Barón, S. Faria, E. Sousa, E. Freitas; draft manuscript preparation: L. Barón, S. Faria, E. Sousa, E. Freitas. All authors reviewed the results and approved the final version of the manuscript.
Declaration of Conflicting Interests
The authors declared no potential conflicts of interest with respect to the research, authorship, and/or publication of this article.
Funding
The authors disclosed receipt of the following financial support for the research, authorship, and/or publication of this article: This work was financed by national funds through FCT—Foundation for Science and Technology, under grant agreement SFRH/BD/138728/2018, attributed to the first author; and by FCT/MCTES through national funds (PIDDAC) under the R&D Unit Institute for Sustainability and Innovation in Structural Engineering (ISISE), under reference UIDB/04029/2020, and under the Associate Laboratory Advanced Production and Intelligent Systems ARISE under reference LA/P/0112/2020.
Supplemental Material
Supplemental material for this article is available online.
References
Supplementary Material
Please find the following supplemental material available below.
For Open Access articles published under a Creative Commons License, all supplemental material carries the same license as the article it is associated with.
For non-Open Access articles published, all supplemental material carries a non-exclusive license, and permission requests for re-use of supplemental material or any part of supplemental material shall be sent directly to the copyright owner as specified in the copyright notice associated with the article.