
Abstract
Autonomous busses and on-demand (OD) services have the potential to improve the public transport system. However, research on potential traffic impacts is still ongoing, mainly because of a lack of existing use cases of autonomous driving as part of public transport. The availability of revealed preference data for mode choice decisions is thus very limited. Therefore, we conducted a stated choice experiment to assess mode choice preferences with regard to use cases as the main mode of transport and as the solution for the first and last mile. We also distinguished between OD and schedule-based (sched.) services. The target population of the survey is the population of Baden-Württemberg, a state in southwestern Germany. The responses of 1,434 people were analyzed using a nested logit approach. On this basis, we established exemplary utility functions and descriptively derived recommendations for efficient forms of deploying autonomous busses in addition to already existing well-developed public transport systems. It was found that, under the given conditions, public transport pass owners without a car in their household would be the most interested in using autonomous busses. Car owners without a smartphone see less benefit. It was also shown that the recruiting method of the respondents is crucial. Those reached via social media were significantly more positive than those contacted via an online panel. Further evaluations show that autonomous busses are rated similarly to existing public transport and consequently have particularly high potential on medium distances, especially if their deployment leads to shorter access routes.
Keywords
For climate and environmental protection reasons, a modal shift to public transport is intended. For this purpose, public transport needs to become more attractive. This is especially relevant for densely populated cities and their surroundings with already existing public transport systems. To achieve this goal cost effectively, great hopes are placed on technical developments such as autonomous driving. In the context of public transport, the current focus is on the use of this technology in the form of autonomous vehicles (AVs) as feeders to rail-based public transport and autonomous busses for several applications in densely populated areas. The technology is still under development and is currently being tested in various trial operations with low velocities and short routes. When the technology reaches market maturity and the legal framework is in place, it will be quite expensive at the beginning before it can demonstrate its cost advantages in the long term. It is therefore even more important to implement these vehicles as efficiently as possible to increase acceptance of this new technology. Consequently, it is important to understand under which conditions the acceptance of the new mode of transport is at its highest and on which locations public transport operators should concentrate first. These issues are particularly relevant for regions with an already well-developed public transport system consisting of conventional busses, light rail, and trains. A travel demand model could be used to determine the most efficient forms and locations of deployment. Consistently generated parameters for the mode choice are needed for this approach. These consistent parameters cannot be found in the literature. Since autonomous busses have not yet been implemented in public transport systems, a stated choice survey offered an opportunity to gain insight into public transport user choice behavior with regard to these new services and enabled the generation of consistent parameters for a travel demand model.
The paper is structured as follows. The next section provides a literature review of studies on usage intentions of future AVs in the context of public transport. Subsequently, data collection, data preparation, and sample composition are described. Finally, the method of model-based evaluation is presented and the results are discussed, followed by a summary.
Literature Review
Since the deployment of AVs is expected to significantly change mobility, a large field of research has emerged. On the one hand, there are many simulation studies using a given demand to examine mileage effects and bundling potentials through AVs in particular areas (e.g., Fagnant and Kockelman [ 1 ] and Martinez and Viegas [ 2 ] or for special AV applications [ 3 , 4 ]). On the other hand, researchers investigate how travel demand and mode choice will change through automation. Many studies cover the acceptance of AVs in general, as this is considered an important prerequisite for a successful expansion. Initially, a strong focus was placed on the acceptance, potential future use, and the willingness to pay (WTP) for privately used AVs. Now, different articles have been published providing an overview of the multitude of studies in this field (e.g., Gkartzonikas and Gkritza [ 5 ], Faisal et al. [ 6 ], Narayanan et al. [ 7 ], Jing et al. [ 8 ], and Othman [ 9 ]). Some of the studies differ in their findings depending on the research question, the sample, and the regional context of the investigation, but they mainly agree that young men have the most positive attitudes toward AVs and that young people are more open to new technology compared with the elderly.
Several studies focused on the use of shared AVs (SAVs), as the private use of AVs might have a negative impact on the overall mileage. Zubin et al. did a meta-analysis of existing literature for SAVs and concluded that current drawbacks come from a lack of trust in vehicle and technology, low willingness to share, and the fear of not having an operator on board ( 10 ). The authors further proposed a conceptual scheme for SAV implementation, defined research gaps, and formulated questions that should be addressed. Zubin et al. developed scenarios for the deployment of autonomous shuttles in the context of public transport ( 11 ).
In many areas, SAVs are considered as a ride-hailing service. However, in areas with high population density and already well-developed public transport, the use of busses as SAVs is also discussed. This means people do not only share a vehicle consecutively but share a ride with other passengers. Pigeon et al. reviewed factors influencing the acceptance of (non-rail) autonomous public transport ( 12 ). Krueger et al. conducted a choice experiment considering SAVs with and without dynamic ride-sharing (DRS), as well as the respondents’ current travel option on a reported trip ( 13 ). They concluded that AVs with and without DRS are perceived as different modes of transport. Gurumurthy and Kockelman focused on the acceptance of DRS and found the WTP to share rides will rise over time, and SAV use will be particularly popular for long-distance business travel ( 14 ). Kassens-Noor et al. found that autonomous busses might increase public transport use, but safety and distrust are a concern, especially for vulnerable groups like women, seniors, and people with disabilities ( 15 ). Etminani-Ghasrodashti et al. did a focus group study to examine the integration of an SAV into an existing ride-sharing service, and revealed that for all groups service accessibility, flexibility, and reliability have a major impact on demand ( 16 ). Kostorz et al. developed a hybrid choice model based on a Germany-wide survey to investigate the use of autonomous transit feeders for public transport ( 17 ). Besides the already known influencing factors such as gender and current travel behavior, they found the latent factor “simplification through AV” a crucial factor for acceptance. Azad et al. performed a literature review on autonomous busses and derived a need for more research in the area of technology deployment, user acceptance, safety, social and economic aspects, as well as regulation and policy, and also mentioned different key topics in studies conducted in Europe compared with the United States ( 18 ).
Numerous test deployments are currently underway, often accompanied by empirical studies investigating the acceptance of the busses deployed in test operation. Madigan et al. applied behavioral theories to better understand current and future use intention ( 19 ). Soe and Müür conducted a survey in the context of a test operation in Tallinn, Estonia, and investigated user experience with reference to safety and security ( 20 ). The participants were mostly satisfied, but the bus operation was sometimes hindered because of technical issues, traffic, or environmental factors. Chee et al. examined determinants to use an automated first-/last-mile service during a test operation in Stockholm, Sweden, and found that different subgroups prioritized different service features ( 21 ). While inexperienced users attach importance to the service frequency, experienced users value an increase in comfort. The authors further applied a structural equation model to describe long-term changes in the intention to use the service ( 22 ).
Another approach to examine mode choice and the WTP for AVs is the use of choice experiments. Alessandrini et al. conducted a stated choice experiment with an autonomous bus and a conventional bus in 12 European cities and found that the provision of information on how the autonomous busses work is needed to raise acceptance, in particular if the AV runs in the normal mixed-traffic environment ( 23 ). Wicki et al. carried out a mode choice experiment within the context of a real bus operation in Neuhausen, Switzerland, and found that technology acceptance strongly influences the decision ( 24 ). Lee and Kockelman focused on the vulnerable population within their research and found that vulnerable people can strongly benefit from SAVs when access is guaranteed ( 25 ). Yap et al. carried out a stated preference experiment for an autonomous last-mile transport for multimodal train trips and found that AVs could be an alternative for first-class train passengers ( 26 ). Nevertheless, respondents still had safety concerns, and travel time in the AV is perceived more negatively than travel time in cars. Dong et al. analyzed the usage of driverless busses and found that young males are more willing to use them ( 27 ). Abe did a stated choice for first-/last-mile AVs and found that AVs are most likely to substitute busses and slower modes of public transport, as well as cars for leisure trips ( 28 ). Reck and Axhausen examined the first/last mile to public transport and found significant effects of transfer penalties, consequently recommending implementation of the first-/last-mile service only for areas with long ingress/egress distances ( 29 ).
In summary, we found that many surveys and simulations have been conducted in the field of autonomous driving, and specifically on autonomous busses. Regardless of the context of a test operation or a general survey, the focus is often placed on a single form of deployment (door-to-door, first/last mile) of the busses. A holistic view is missing of all the possible forms of use of autonomous busses as part of a well-developed public transport system considering future technical developments. The question remains as to which situations and which deployment forms of autonomous busses would be the most efficient way to integrate them into public transport. The necessary answers could be given using an agent-based travel demand model. However, this requires a consistent set of parameters for mode choice for all forms of deployment that is not yet available. In this study, we therefore carried out a survey and presented a possible future state of the technology to the respondents. Subsequently, we conducted a stated choice experiment. In the first part, the participants were given the option to use an on-demand (OD) or a schedule-based (sched.) autonomous bus as the main mode of transport besides familiar alternatives (e.g., car or public transport). In the second part, we presented different feeder options to rail-based public transport, among them autonomous busses. From this, consistent mode choice parameters were estimated across all deployment forms that can be used in a travel demand model.
Data
Data Collection
An online survey was set up to collect the data. This survey was then distributed over several channels. The main channel was an online panel conducted by the company Bilendi & respondi. The panel sample was generated from the population of the federal state of Baden-Württemberg, Germany, selected to be representative according to age groups and gender ratios. This group was only allowed to fill out the survey on a computer and not on mobile devices. The use of mobile devices was prevented because the display of the stated choice experiment is not as concise on a mobile as on a computer. Other distribution methods were the social media presences of the participating research institutes, transport companies, and transport associations from Baden-Württemberg, as well as the Ministry of Transport Baden-Württemberg. These respondents were allowed to complete the survey on a mobile device or computer. Despite the poorer representation of the stated choice experiment, this was allowed to keep the response burden low for respondents who did not receive an incentive. The survey was conducted in the period from February 16, 2022, to March 10, 2022, in Germany. The focus of this survey was not on the pilot projects currently taking place, but on the fields of application of future autonomous busses with a mature technical status. For this reason, the interviewees were shown various technical features of autonomous busses that can be expected in the future, as shown in Figure 1. In the further course of the survey, this future state of the art should be assumed. The characteristics used in the survey are based on a literature review and a workshop with a research institute, a vehicle manufacturer, and two transport companies.
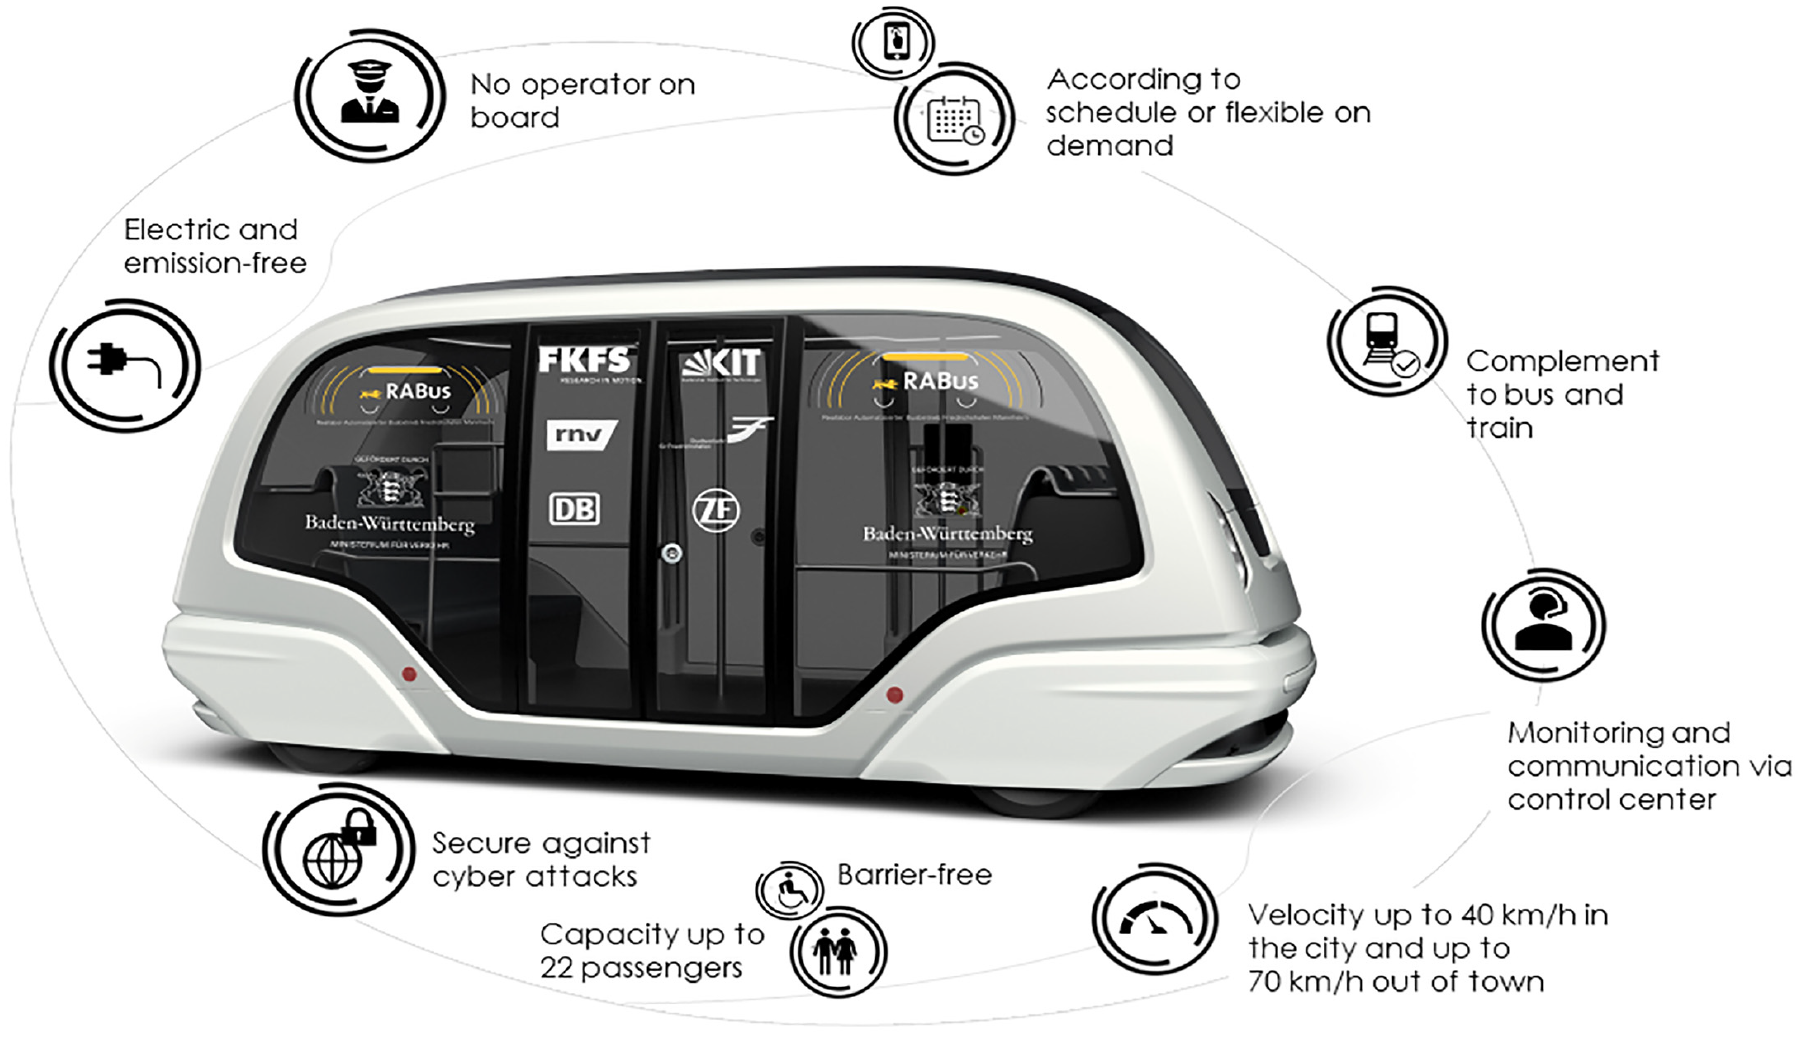
Presented future state of technology (translated from German).
After conducting the survey, the data were pre-processed to ensure a high-quality level. The first exclusion criterion was a set minimum average response time per stated choice situation, and the data sets with times below were removed. Then the data sets were examined for straightlining, meaning that respondents always choose the items underneath each other in a block of questions with a constant scale or answer exactly in a slanted line. For this purpose, two questions outside the stated choice part of the survey were used. If there was a high probability of straightlining, the data sets were removed because no serious response to the questions was expected in the stated choice part either ( 30 ). These quality assurance measures led to the exclusion of 213 records, resulting in the net sample of 1,434 persons.
Questionnaire Design
The stated choice experiment is embedded in a questionnaire with further questions about attitudes toward autonomous busses and the socio-demographics of the participants. The experiment itself consists of eight stated choice situations. In four situations, the autonomous shuttles are available to the respondents as the main mode of transportation as well as the familiar modes (walking, bicycling, driving, public transportation with walking). The autonomous shuttles are differentiated into an OD mode and a sched. Mode. In the other four situations, the focus is on feeder routes to public transport. In addition to the familiar modes of transport (bicycle, car, public transport with walking), there is public transport in combination with cycling, car driving, the OD shuttle, and the sched. Shuttle. To ensure clarity for the respondents, attribute levels of public transport as part of an intermodal trip were set to be the same for all intermodal alternatives within one choice set. Only the levels for the access modes differed within a single choice set. The attributes and attribute levels are shown in Table 1.
Attribute Levels Used in the Stated Choice Questions
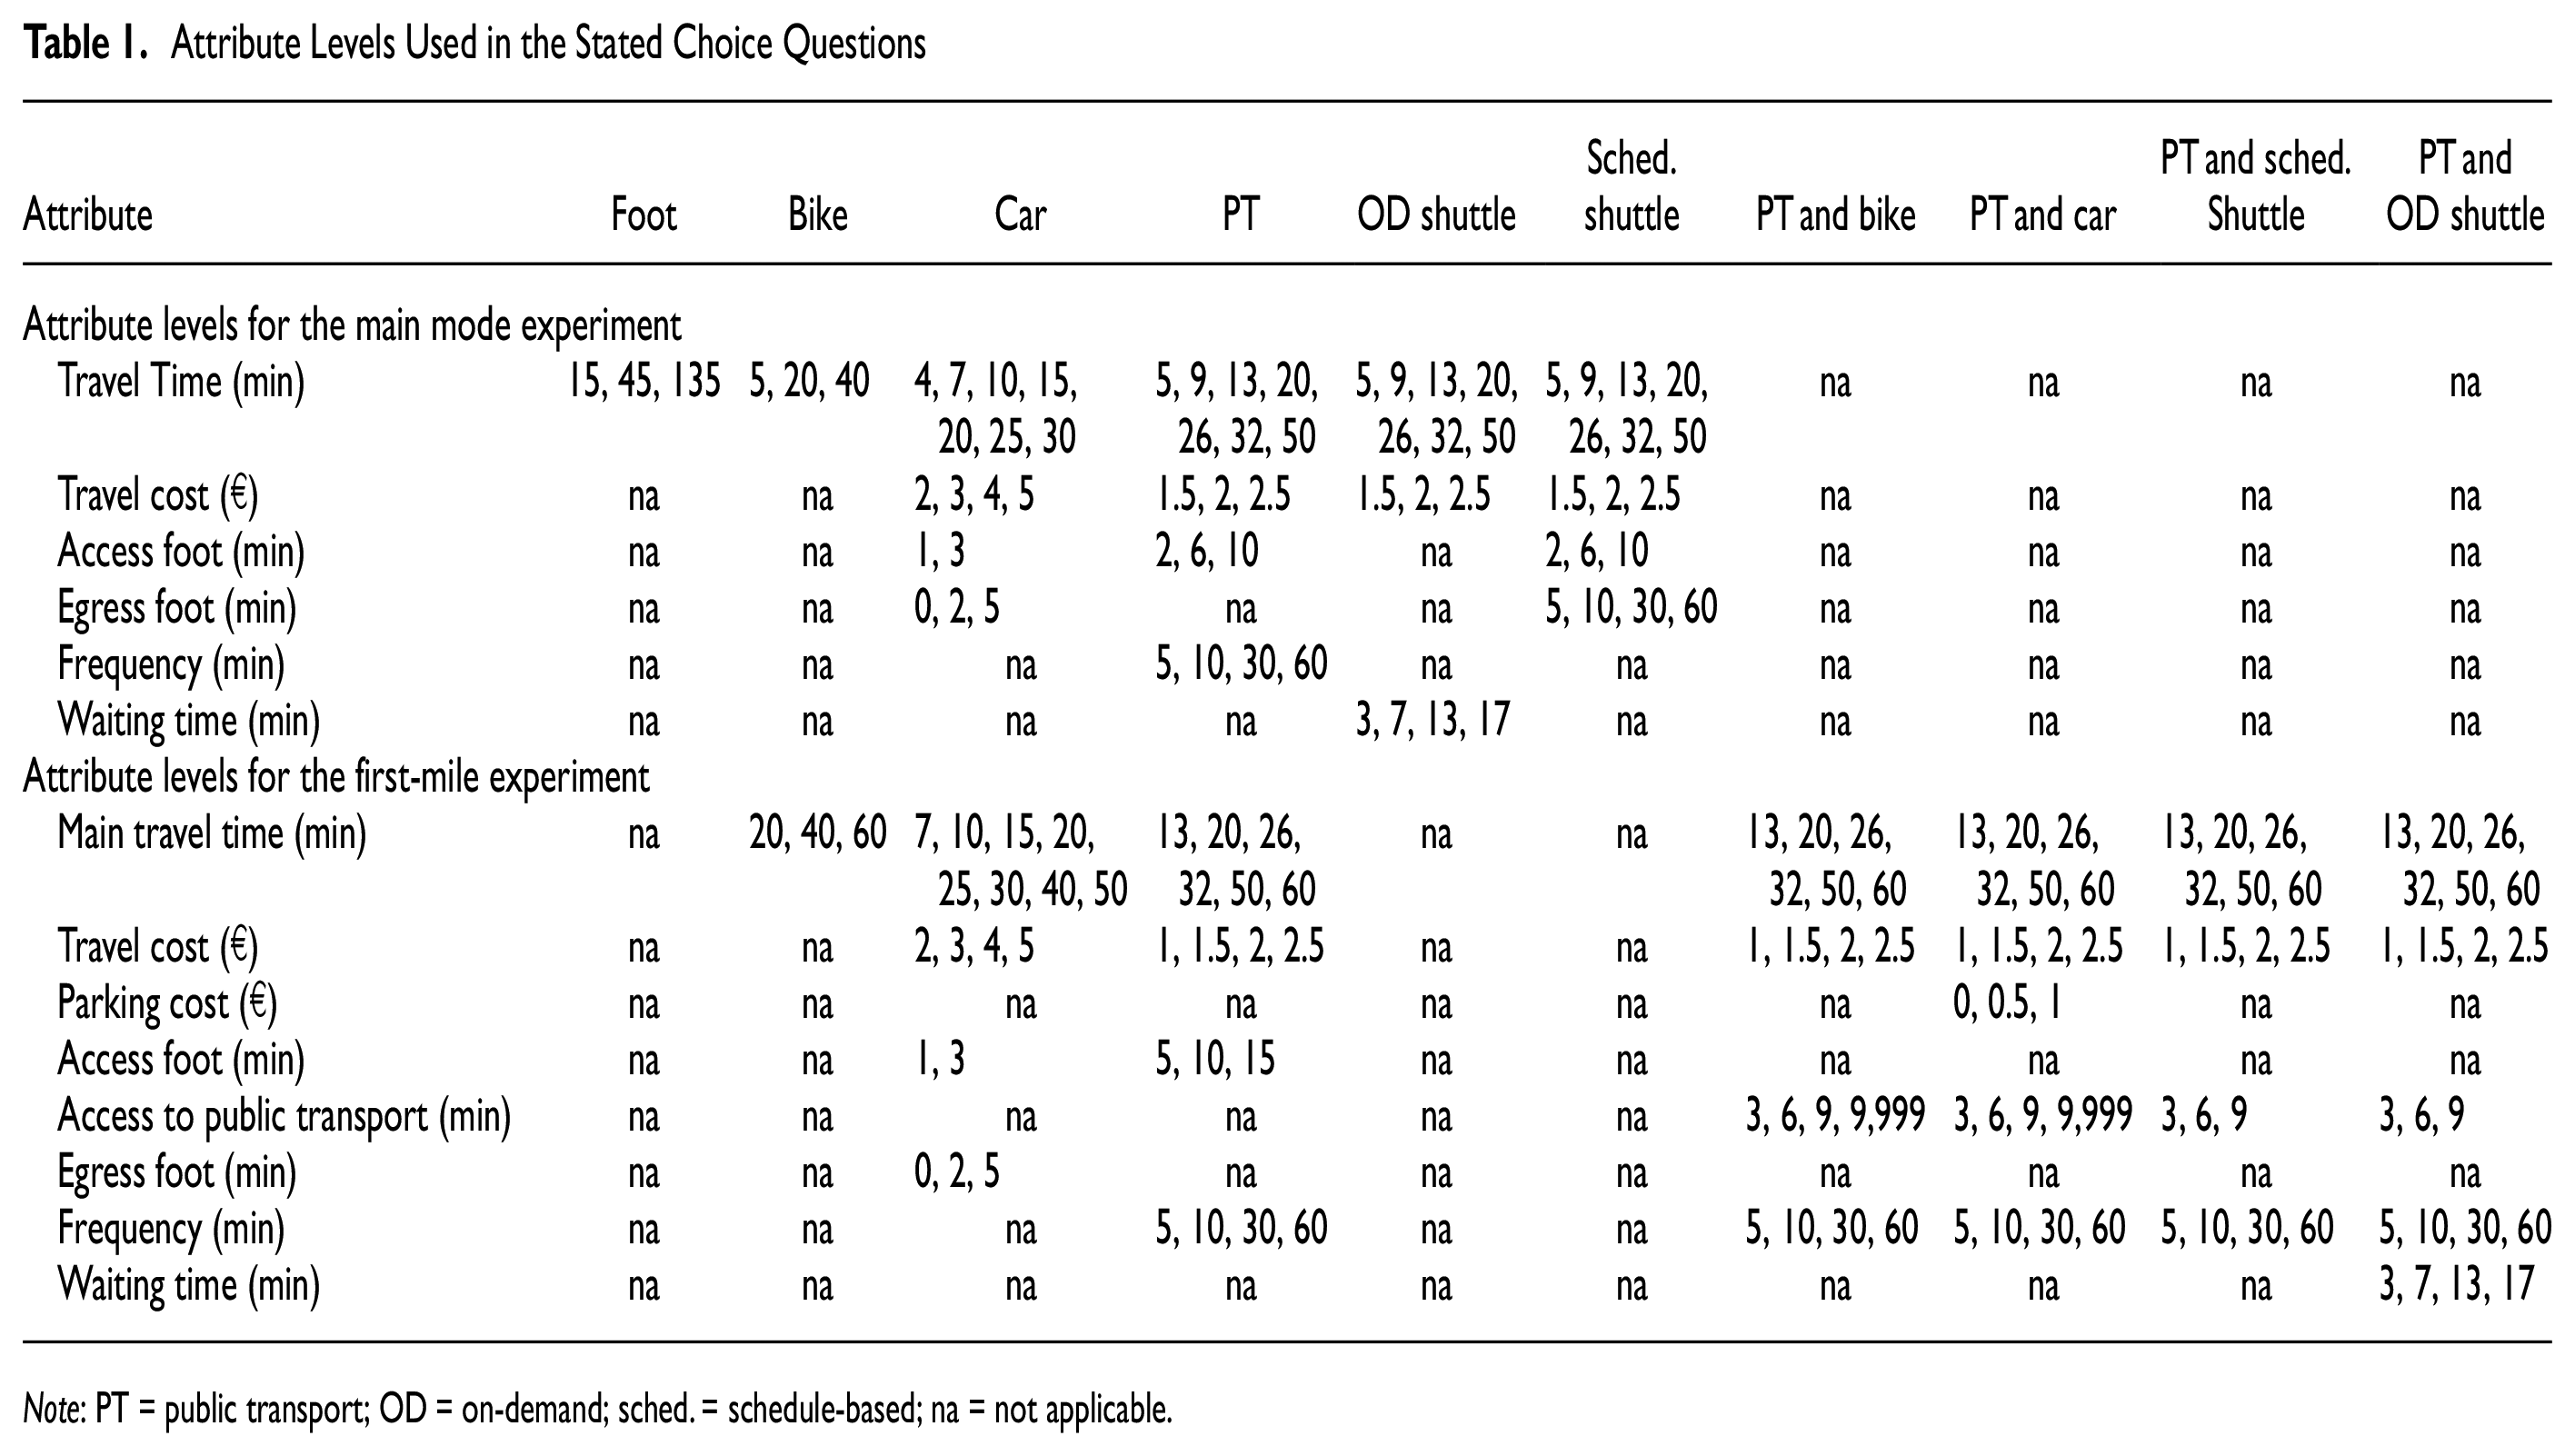
Note: PT = public transport; OD = on-demand; sched. = schedule-based; na = not applicable.
The Ngene software is used to compile suitable decision-making situations. In Ngene, utility functions are stored that are used to optimize the design for the experiment. Because of the many possible combinations of attributes, a D-efficient design was chosen to minimize the number of respondents needed. Using a D-efficient design, Ngene aims to minimize the D-error that is calculated from the determinant of the asymptotic variance-covariance matrix ( 31 ). Different numbers of question blocks were tested, with four blocks proving to be the most suitable. Consequently, the number of questions per person did not increase and the expected sample would still lead to significant results for the attribute levels used. Furthermore, conditions for travel time were specified in Ngene, so that the travel times in a single choice set pivot from real travel times in and around a typical German city for five different distances. Thus, the times seem meaningful for the respondents.
The attributes from the design were then prepared as graphics, making them as easy to comprehend as possible. Therefore, the bars of the modes of transport were scaled based on the travel times. The other attributes were also graphically highlighted using symbols (see Figures 2 and 3).
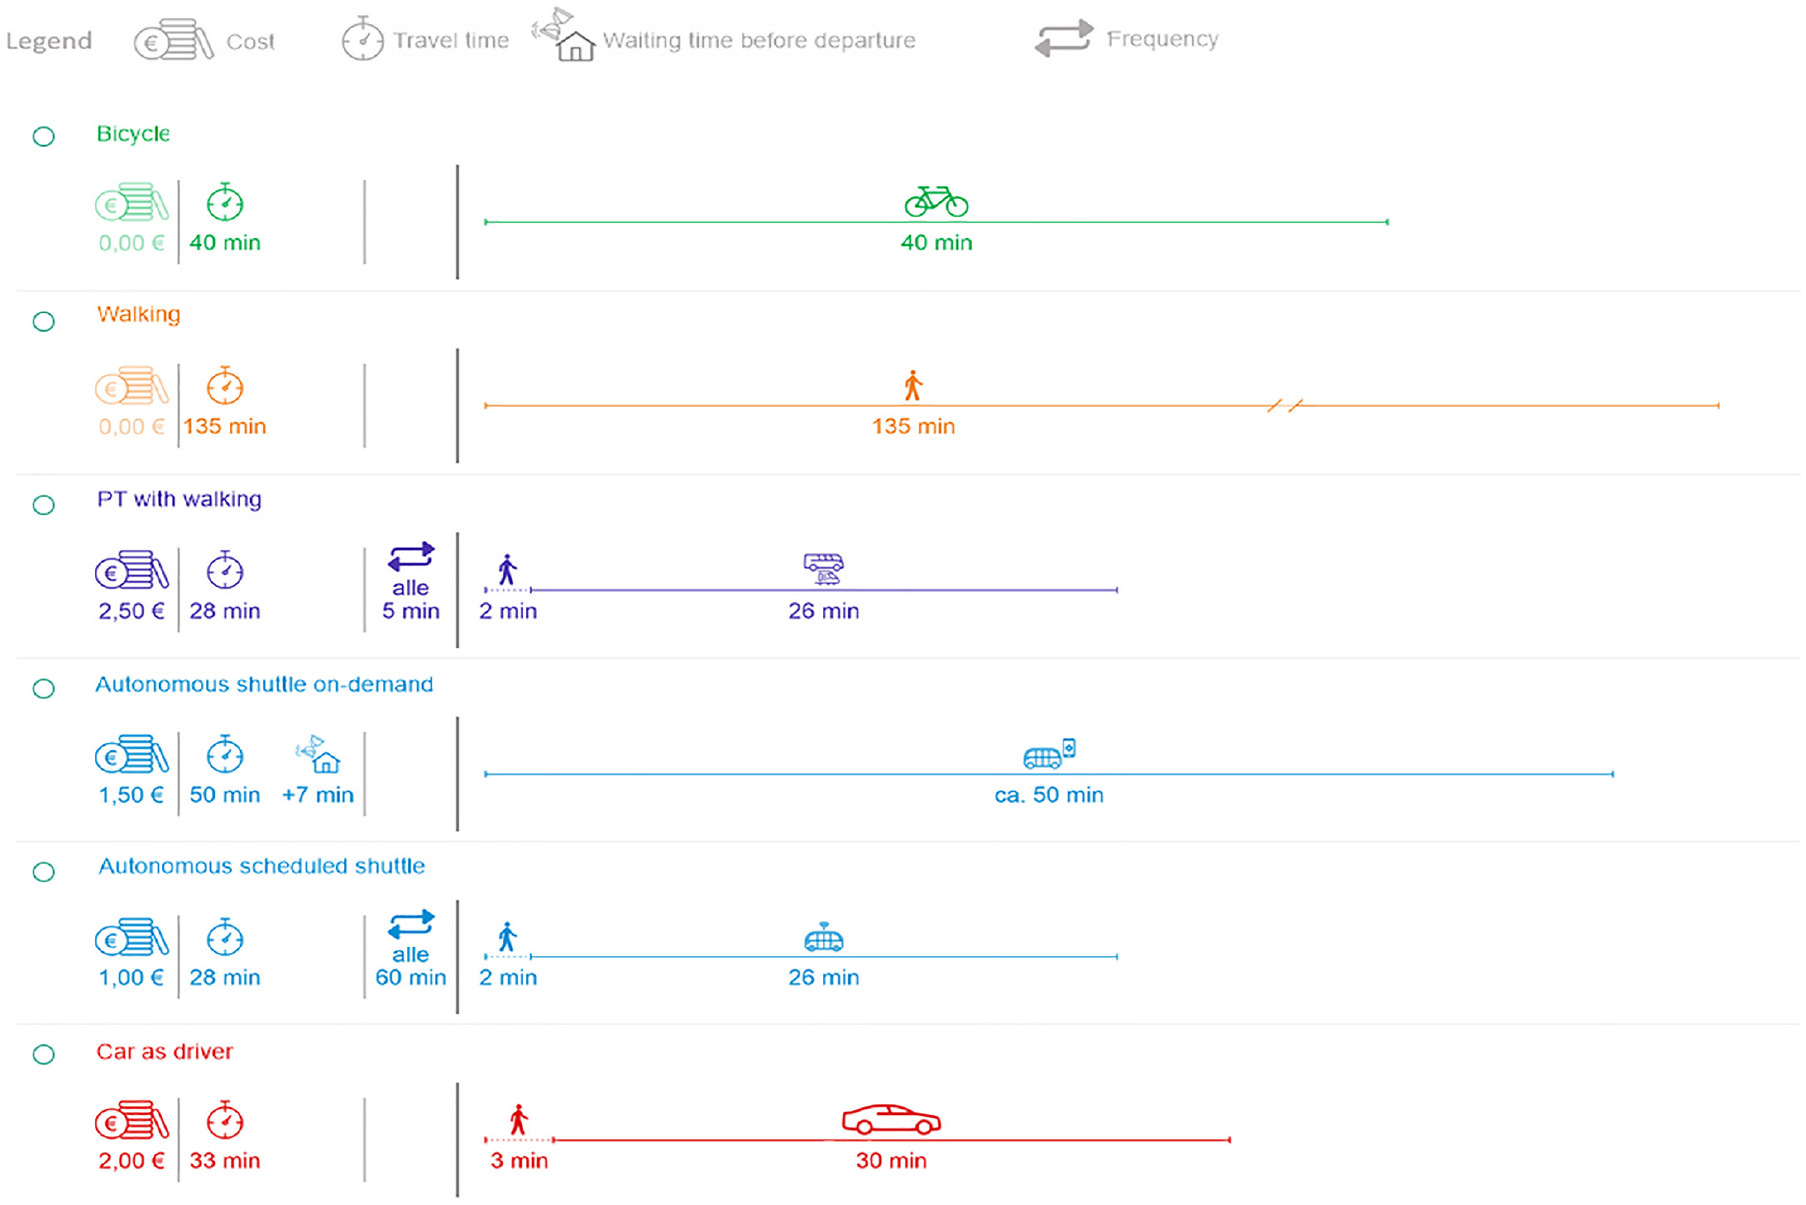
Example illustration of the stated choice experiment with a focus on autonomous busses as the primary mode of transportation.
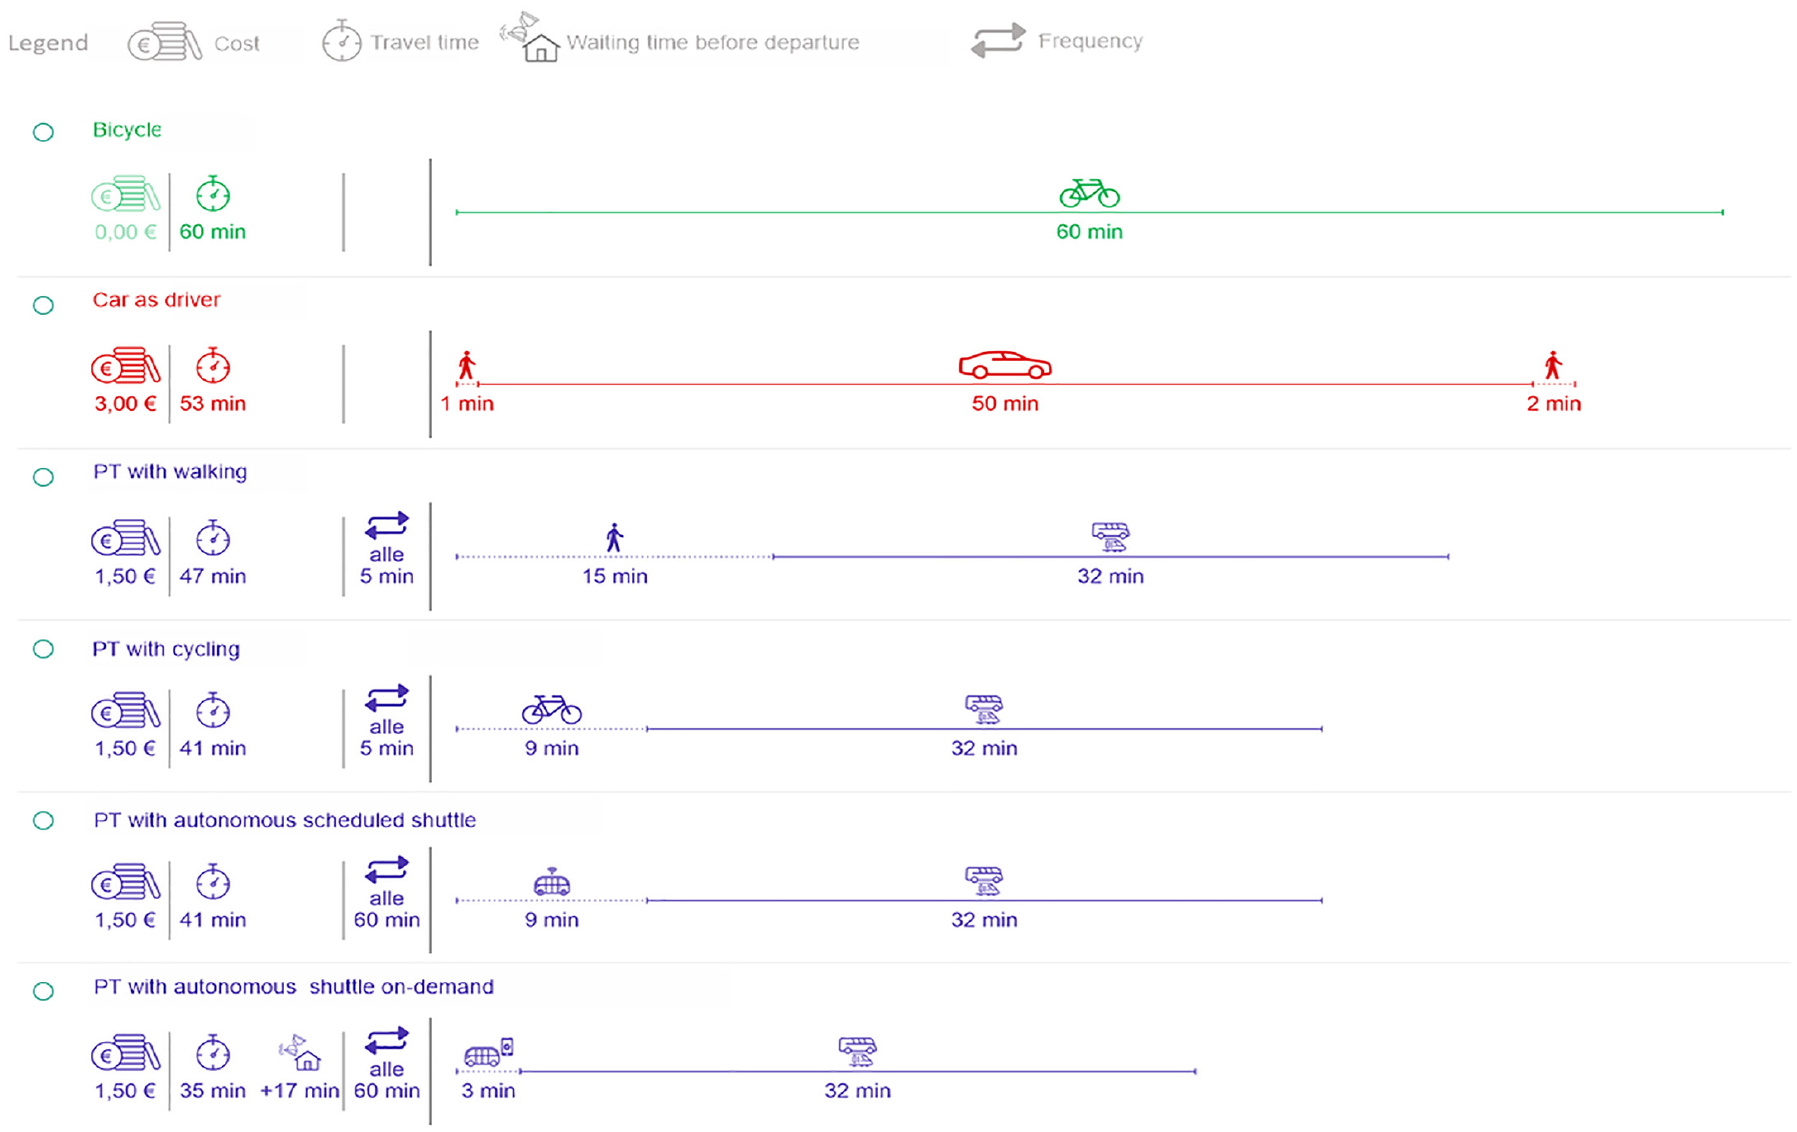
Example illustration of the stated choice experiment with a focus on autonomous busses as feeder for public transport.
Sample Composition
The analyzed sample consists of a data set with 1,434 observations in total. Overall, N = 962 respondents were recruited through the panel conducted by the company Bilendi & respondi, N = 368 participated in the survey after a call on social media, and N = 104 answered after attention was drawn to the research by transport companies and transport associations from Baden-Württemberg and the Ministry of Transport Baden-Württemberg (see the section on Data Collection).
Table 2 presents a summary of the socio-demographic composition and access to various mobility tools of the sample. The information is compared with the results of Mobilität in Deutschland (MiD) by infas ( 32 ), a nationwide study on mobility and travel behavior. In this context, only the weighted results for the state of Baden-Württemberg are compared with the key data of our sample because the targeted sample was also the population of this region.
Survey Sample Composition compared with MiD 2017
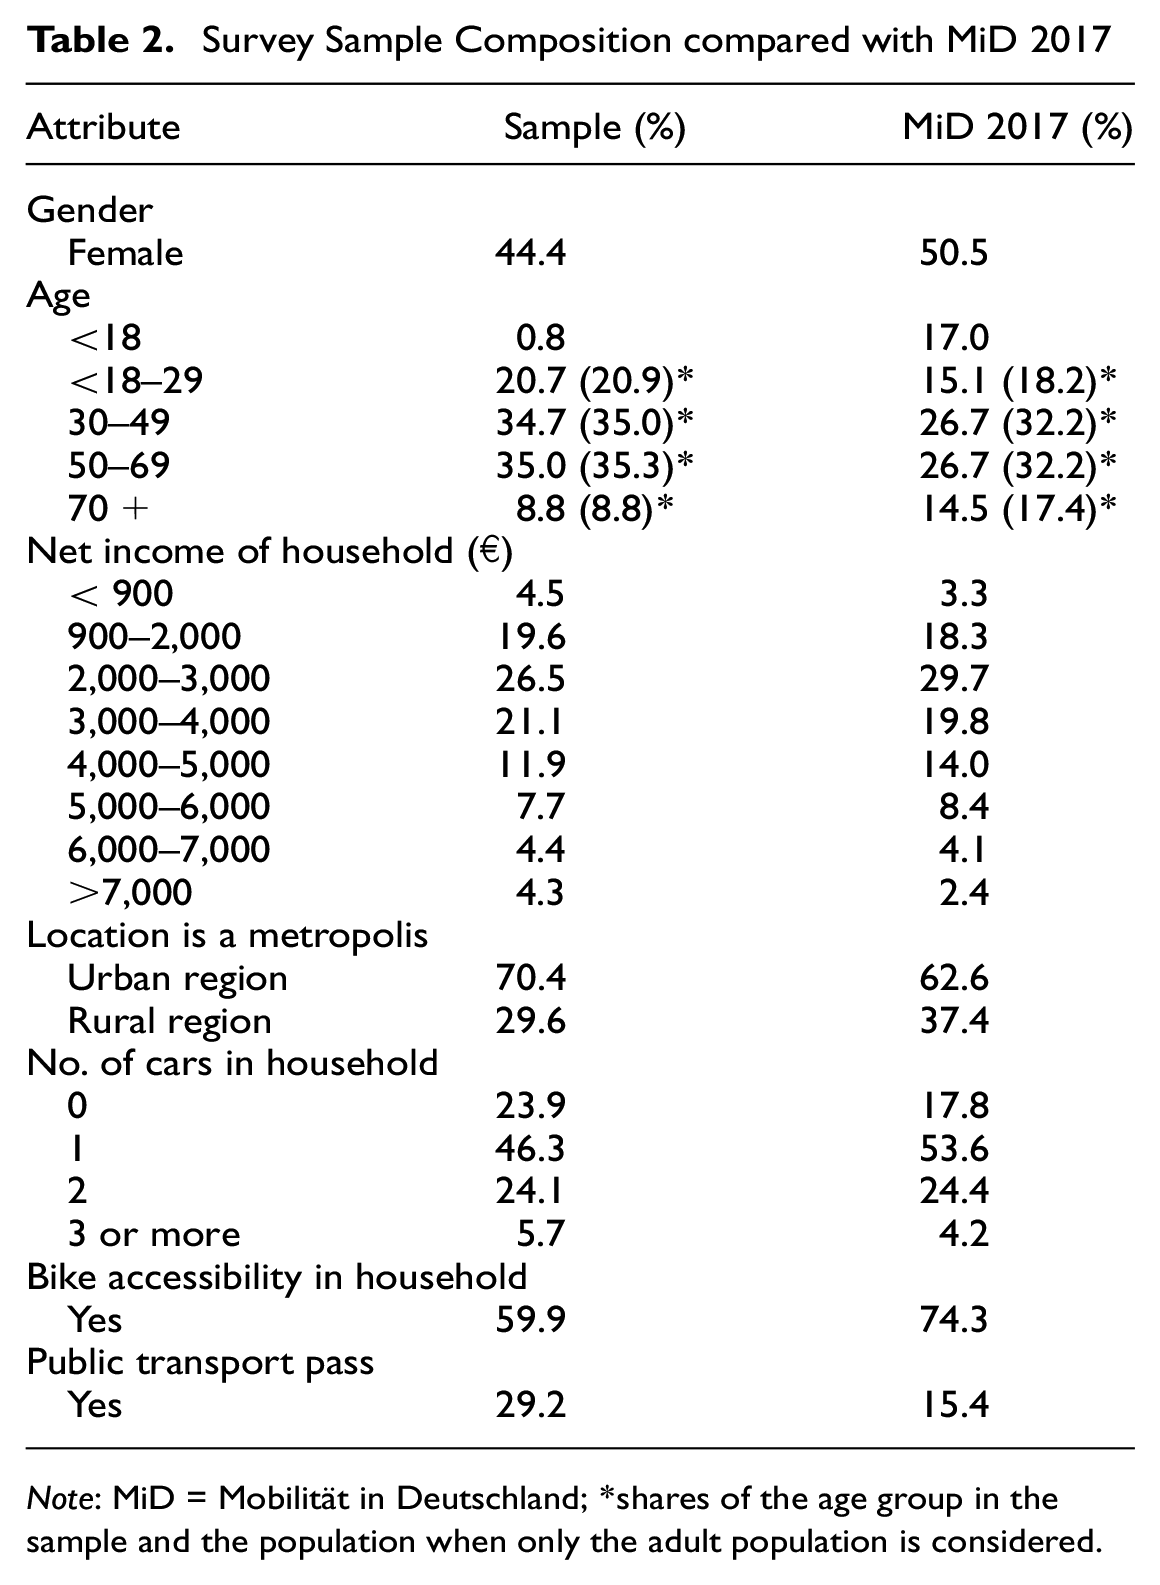
Note: MiD = Mobilität in Deutschland; *shares of the age group in the sample and the population when only the adult population is considered.
Looking at the gender distribution of the sample, the share of women is slightly lower than the share of men with 44.4% compared with 55.6%. In comparison, the MiD comprises an almost equal proportion between women and men. The disaggregation of the sample data by age shows that the majority of respondents are either in the age groups 30 to 49 or 50 to 69, with each approximately 35%, followed by the age group 18 to 29, with 20.7%, and age 70+, with 8.8%. There is almost no representation of minors under 18 years (less than 1%) as opposed to the MiD where this age group forms 17% of all respondents. The small representation in the sample can be explained by minors not forming part of online panels and not usually being the target group of the social media channels used. This should be considered when evaluating the results, but the influence on the overall results is not likely to be decisive. The youngest and the oldest age groups are each represented more profoundly in the MiD. Similar to the sample on hand, the age groups 30 to 49 and 50 to 69 make up the majority of respondents in equal parts. With regard to household income, the distribution of the sample also shows parallels to the MiD. Lower as well as higher income groups are featured slightly more heavily in the sample than in the comparative MiD study. The location profile of the respondents is more urban than rural, with 70.4% in contrast to 29.6%. There are more households with no car in the sample than in the MiD, which can probably be attributed to the more urban composition of the respondents. Bike accessibility per household is lower in the sample than in the MiD, whereas more respondents own a public transport pass in the sample, probably because of the respondents recruited through social media channels were already biased in favor of public transport because they were following the channels of the public transport providers.
Analysis and Results
Utility functions were established for each choice alternative. These were then used to estimate discrete choice models (see Figure 4). The similarity of the analyzed autonomous bus modes to public transport modes, as well as the implementation of several forms of autonomous shuttle services, suggests that not all given alternatives are independent from each other. The intermodal trips in particular all overlap with public transport in a certain manner. Therefore, after estimating a multinomial logit model, we tested a nested logit approach. This approach was chosen because of the better Bayesian information criterion (BIC) of the nested logit model. All estimated nest-related lambda parameters have values between 0 and 1 and differ significantly from 1. Since multinomial logit and nested logit models have been state of the art for a long time, we refer the reader to Train for details and an overview of generalized extreme value (GEV) models ( 33 ). Different nested logit model structure variations were tested and compared by their log-likelihood. Figure 5 shows the final nested logit model structure with the best values and model fit. A separate utility function was applied to each alternative (Figure 4). The following formula gives an overview of the structure of the functions:
The constants used in Equation 2 in Figure 4 are different for each alternative. The constants for the alternative car have been fixed to zero as the reference level. Also the
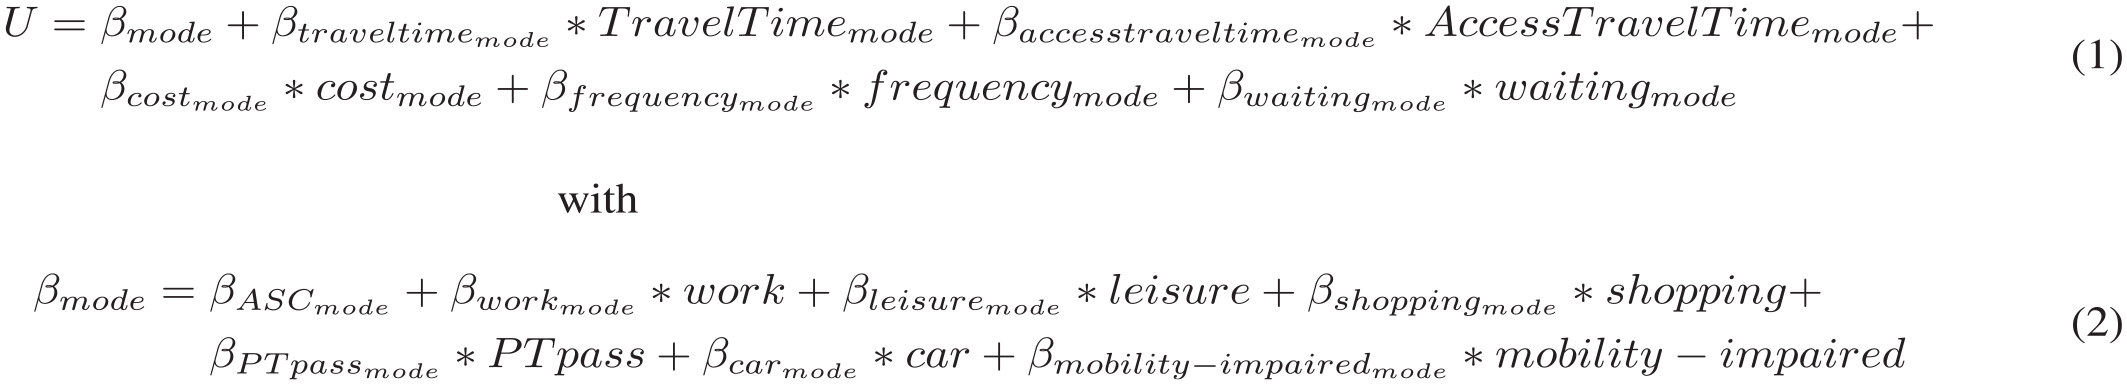
Structure of the utility functions.
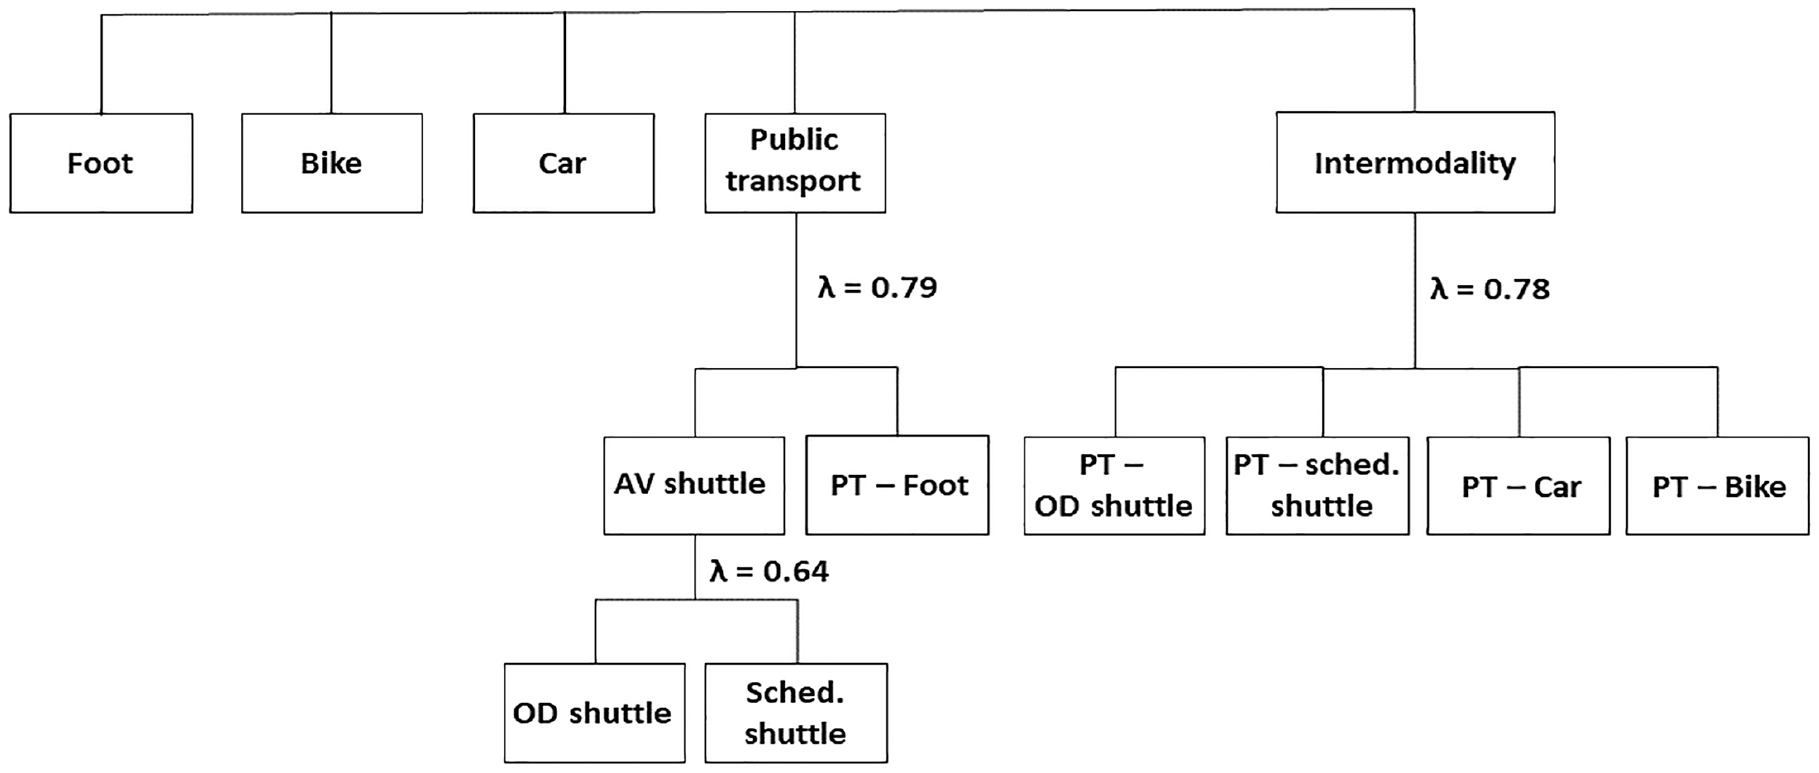
Nesting structure of the model.
Model Estimates
Nests are used for both public transport and intermodal alternatives (see Figure 5). Public transport correlates with a lambda of 0.79 and is divided into the classic combination of public transport with walking and autonomous shuttle services. The latter can further be specified to OD and sched. Shuttles and shows a correlation with a lambda of 0.64. Intermodal trips are categorized into public transport with either bike, car, OD shuttles, or sched. Shuttles. Again, the lambda of 0.78 illustrates a correlation between these intermodal alternatives.
The estimates from the nested logit model are presented in Table 3. To separately assess the influence of the time, cost, and socio-demographic parameters, and the alternative specific constants, two values for the log-likelihood, the BIC, and the adjusted Rho-square are calculated. Since the adjusted Rho-square is traditionally only calculated for a comparison of the estimated model with the zero model (only coincidence), the basic modal shares have a large influence on this value. For that reason, we provided the log-likelihood, the BIC and the adjusted Rho-square for the model with alternative specific constants only and for the final model. These adjusted Rho-square values show that the time, cost, and socio-demographic parameters improve the final model compared to the model with alternative specific constants only.
Model Estimates for Mode Choice Experiment (Only Statistical Significant Values Are Presented)
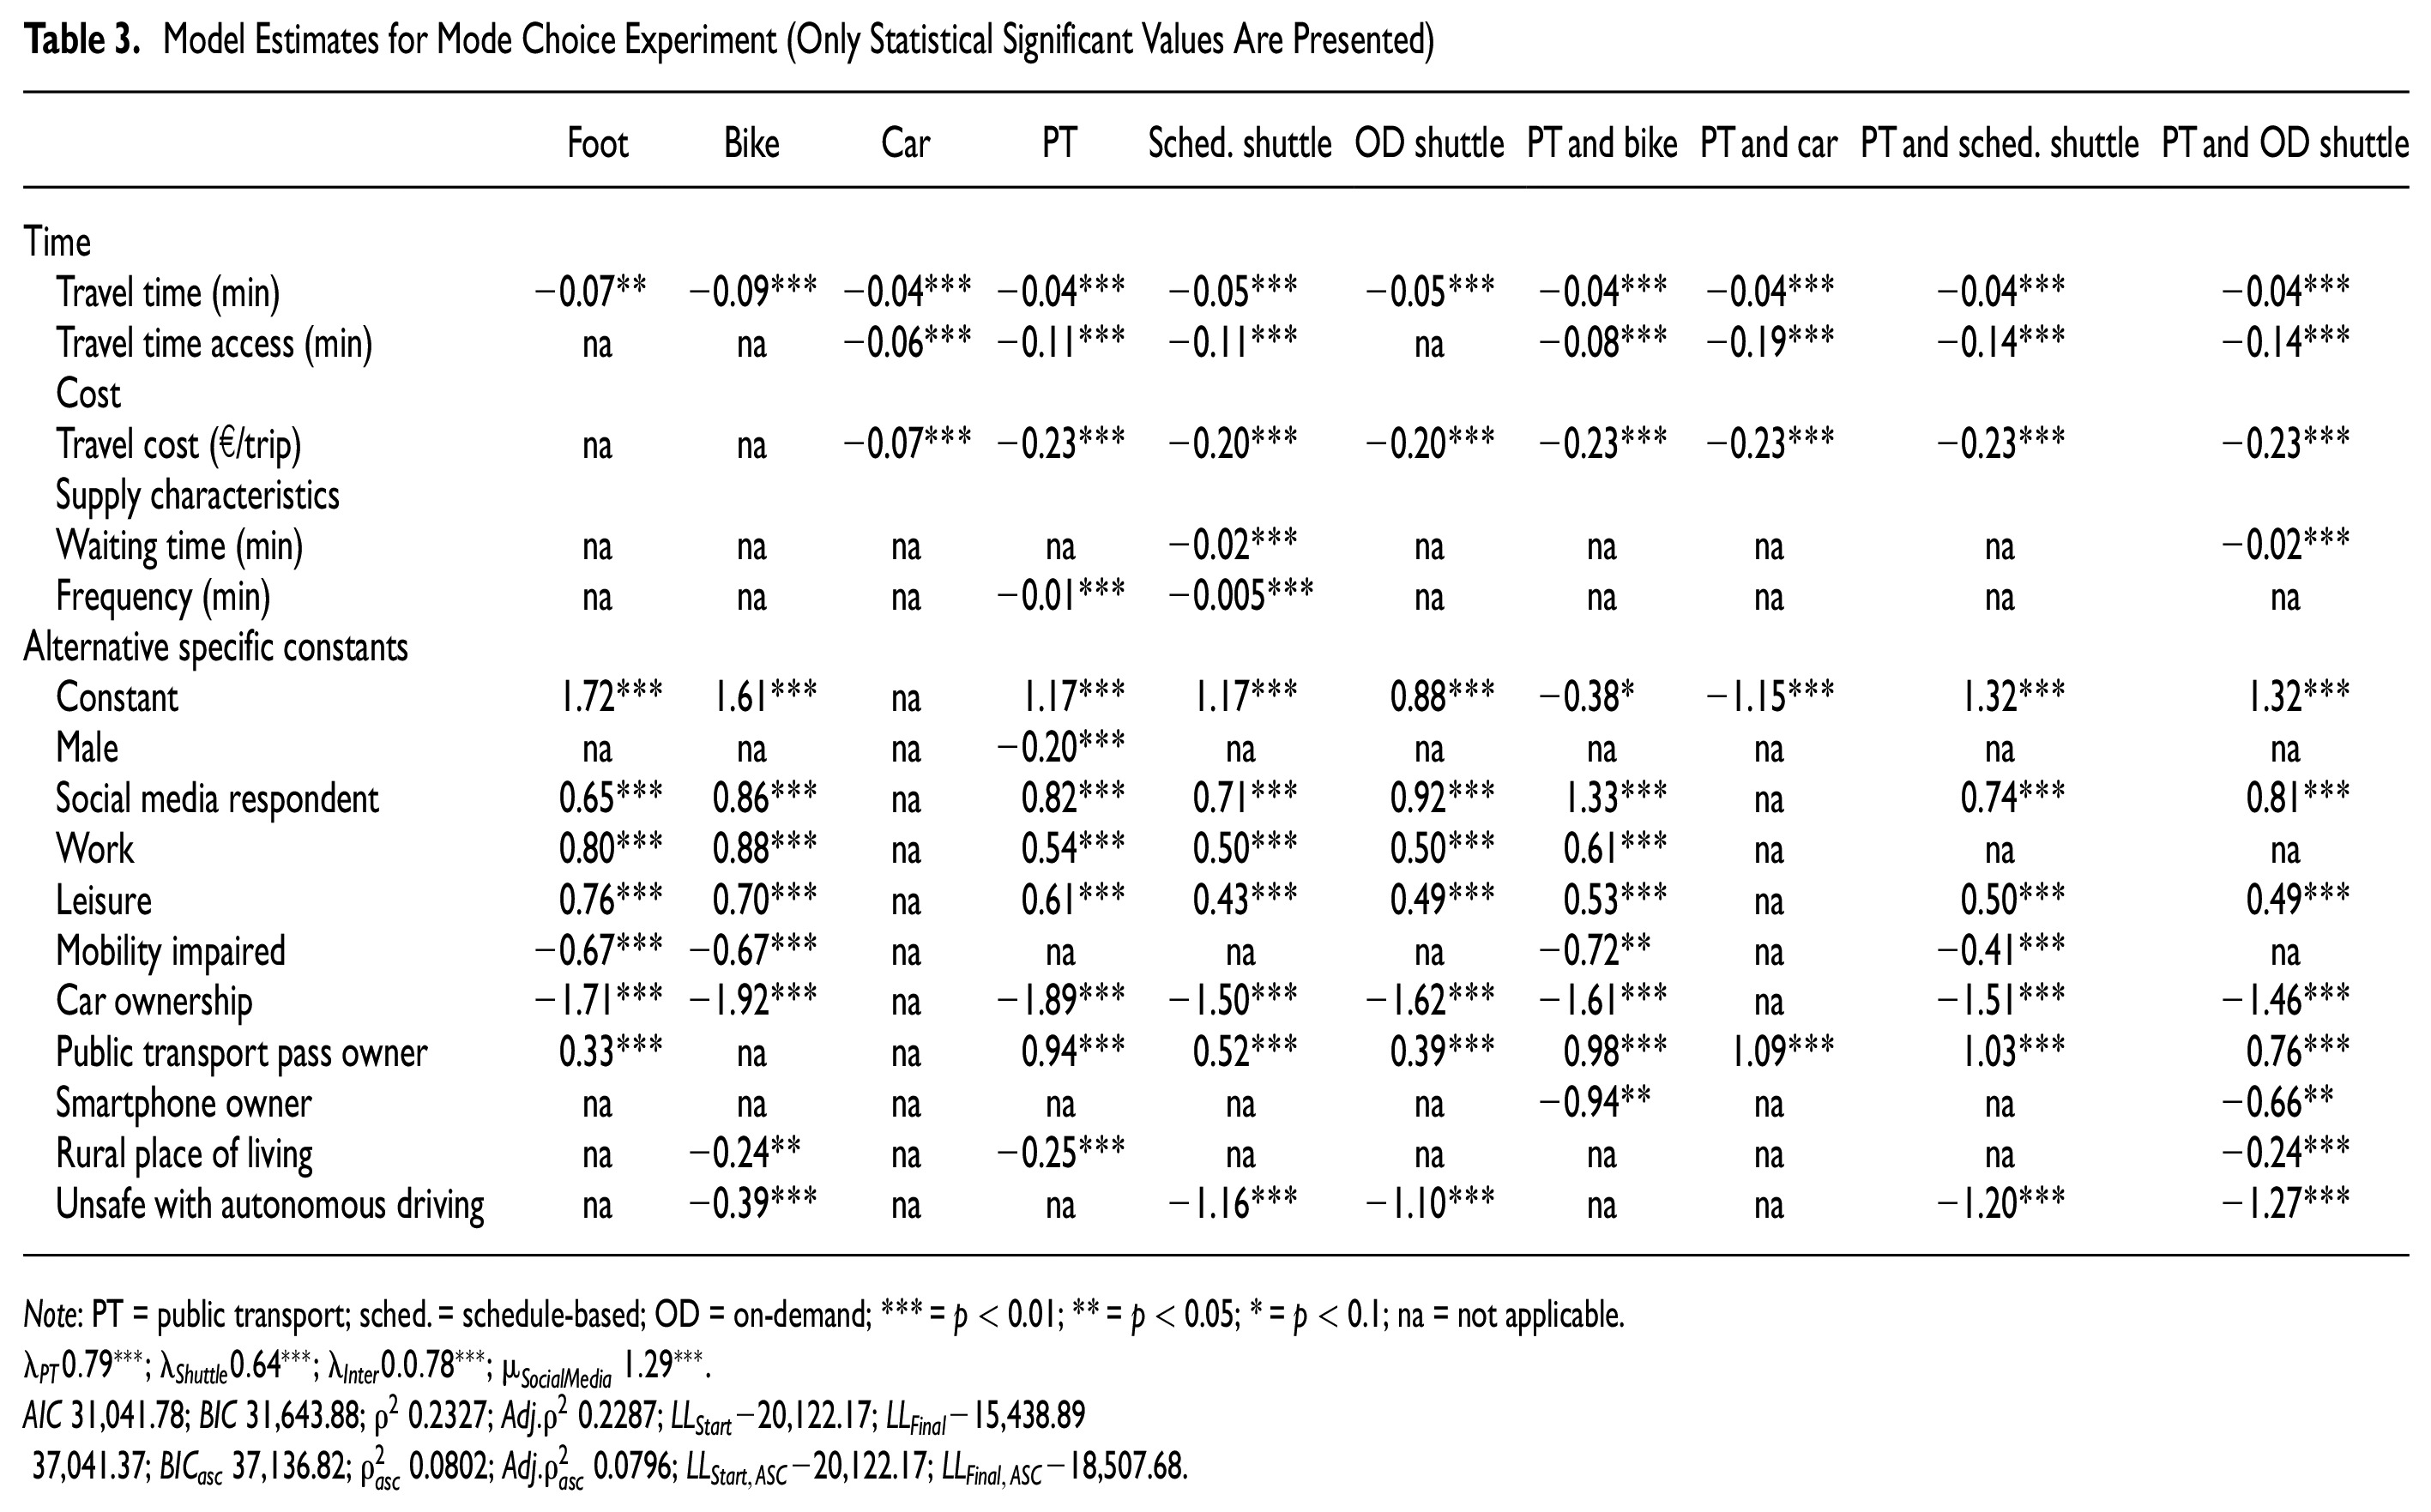
Note: PT = public transport; sched. = schedule-based; OD = on-demand; *** = p < 0.01; ** = p < 0.05; * = p < 0.1; na = not applicable.
37,041.37;
In this section, the major socio-demographic influences on the utility of autonomous busses are described. The estimate with the highest positive influence on the use of autonomous shuttles is public transport pass ownership, which is probably because people who own a public transport pass are already prone to use public transport. This is followed by the survey recruitment through social media, where following these types of social media channels also indicates an inclination to choose public transport services. Moreover, the estimation shows positive values for the trip purposes of work and leisure compared with other trip purposes. In contrast, car ownership has the most negative effect on using the shuttle as a mode. Part of the survey is the assessment of the individual sense of safety in the context of autonomous driving. As expected, a strong sense of insecurity toward autonomous driving leads to a lower selection probability of the shuttle, which translates to negative estimates—a result that was also found in other surveys (
35
). This characteristic was true for 17.6% of our sample. Negative estimate values also arise for people who do not own smartphones. This is consistent with other studies that found more tech-savvy people to be more likely to use an autonomous shuttle (
24
). It must be taken into consideration that the participants recruited via the online panel were not allowed to participate via smartphone. This could have slightly biased the results. Overall, however, it was more important that the stated choice experiment was presented on a larger screen so that it could be better understood. In contrast to other studies, age was not significant in our survey for any of the age group compositions examined. Several explanations are possible for this. First, there is a strong correlation between belonging to older groups and owning a smartphone. Nevertheless, smartphone ownership is the more significant variable for our data. Second, it may be because our presentation of autonomous busses emphasizes the connection to familiar public transport, and thus the novelty of the technology was not a primary concern for respondents. In the following, the estimated parameters for the trip-specific attributes are compared with each other. Comparing the
To investigate the sensitivity to frequency, two different parameters were estimated for the sched. shuttle and for the familiar public transport. For public transport, the exchange ratio to 1-min travel time savings is 0.2. Consequently, a reduction of the vehicle sequence from 20 min to 15 min corresponds to a travel time reduction of 1 min. This is also consistent with the value found in another large stated choice survey ( 36 ). For shuttles, the replacement ratio is 0.1. This means that the reduction of the vehicle sequence from 20 min to 15 min corresponds to only a half-min reduction in travel time. However, the linear mapping of frequency probably leads to problems, which need to be investigated in more detail.
In a further step, the value of time of the different modes of transport was calculated. Value of time means how much money the respondents are willing to pay for 1 h of travel time reduction using the respective mode of transport. For public transport, a value of 11.7 was calculated, which is more than the 4.83 from another study for Germany ( 36 ). A value of 14.42 was determined for autonomous shuttles. For private cars, an unusually high value was calculated: at 35.06, it is significantly higher than the value of 4.66 determined in the study for Germany ( 36 ). One explanation could be the format of the survey. In the case of a stated choice survey, respondents may have overestimated their WTP. This high WTP, in turn, leads to a high value of time and is particularly noticeable for the car.
Results for the Deployment of Autonomous Busses
Here, we want to illustrate the meaning of the estimated parameters and identify recommendations for the future deployment of autonomous busses. For this purpose, exemplary utility functions are set up with the estimated parameters and presented as diagrams. Individual input variables are varied to show the respective influences. Other variables, especially those related to socio-demographic characteristics, are kept constant. Unless otherwise stated, we assume a woman’s trip with car ownership and without a transit pass, who was recruited via the panel. Urban area, smartphone ownership, and no mobility restrictions are assumed. In addition, it is assumed that the person is not very insecure about autonomous driving functions. Typical average journey travel speeds are supposed to ease comparison of the modes of transport. These are 5 km/h for walking, 15 km/h for cycling, 20 km/h for public transport and autonomous busses, and 35 km/h for cars. Other assumptions are the cost per trip for public transport and for the shuttle of €2.5 and for the car of €0.3/km. A frequency of 10 min for the sched. shuttle and public transport and a waiting time of 5 min for the OD shuttle is determined. The assumptions described relate to the following evaluation and also to Figures 6, 7 and 8.
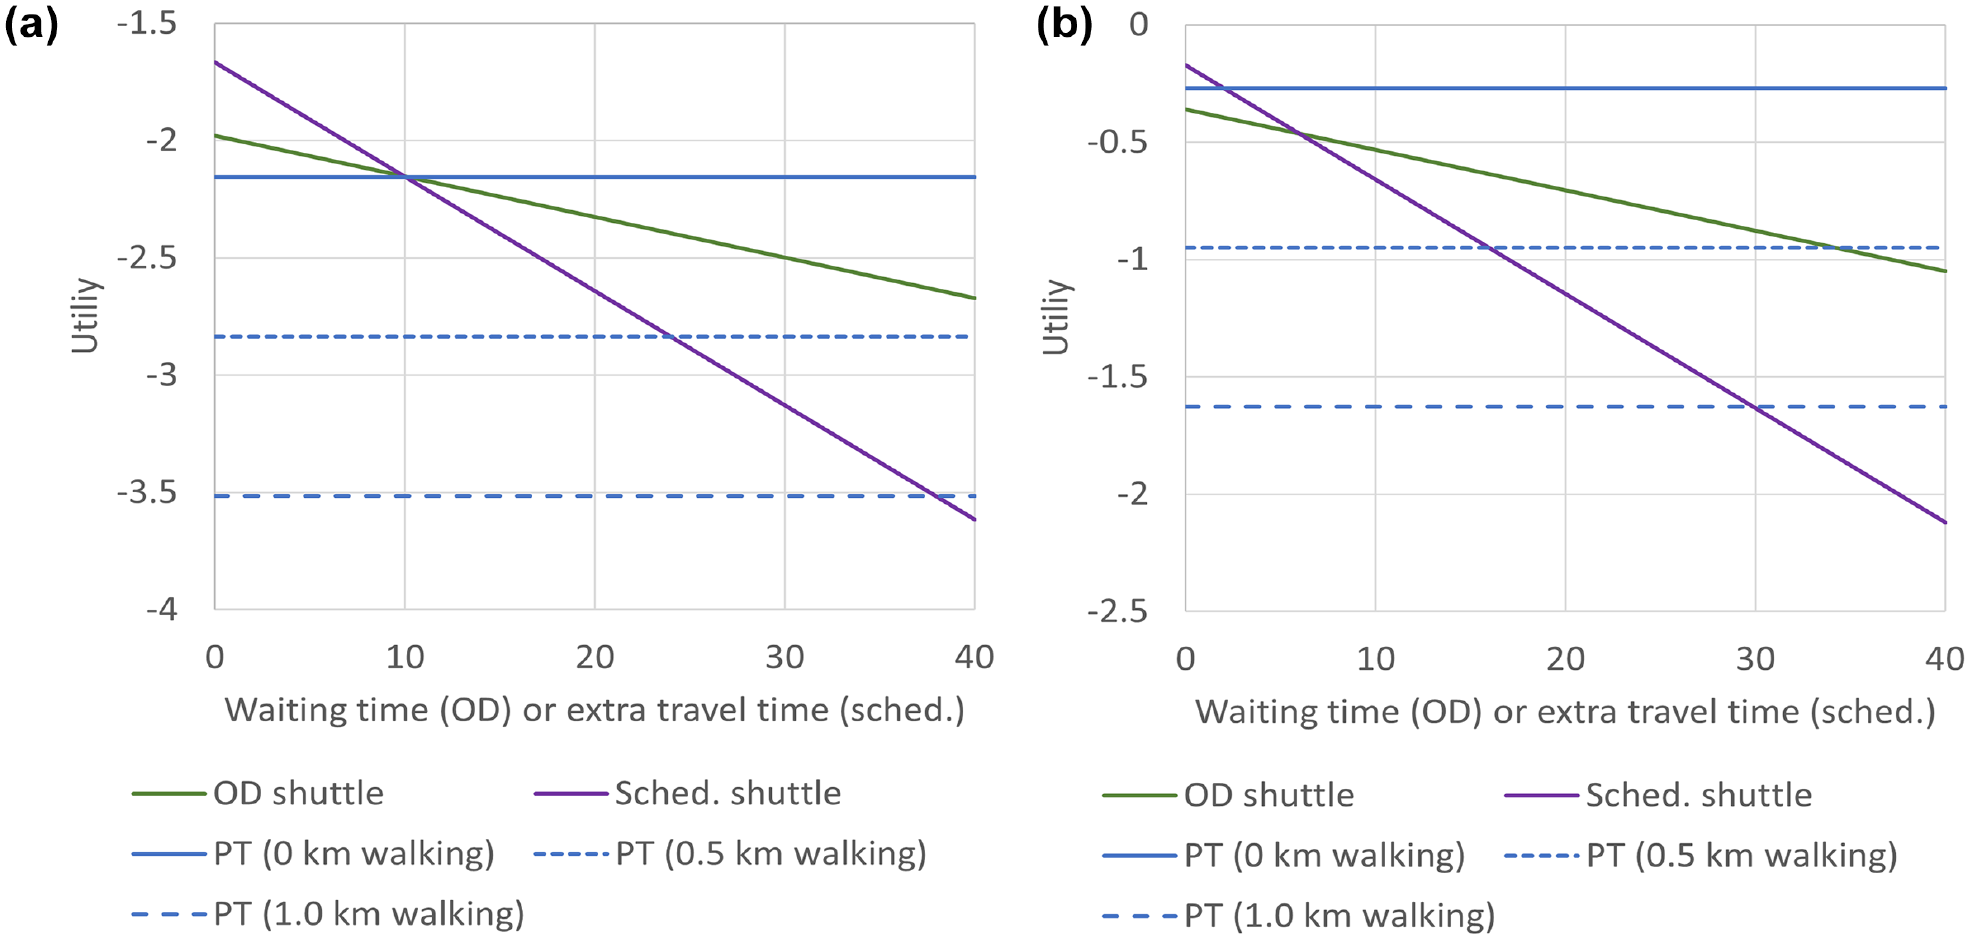
Correlation between waiting time for the on-demand (OD) shuttle and extra travel time for the schedule-based (sched.) shuttle and the utility compared with public transport (PT) for a trip of 15 min: (a) with car ownership and (b) without car ownership.
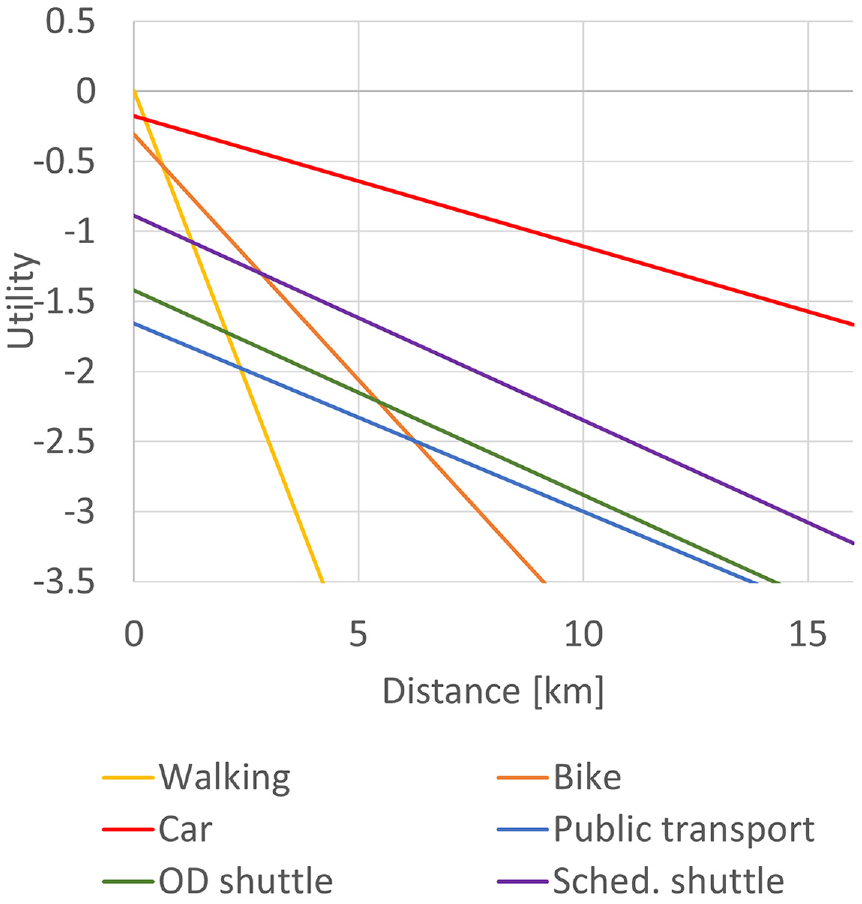
Varying travel distances and the respective utility compared with familiar modes of transport under the condition of car ownership.
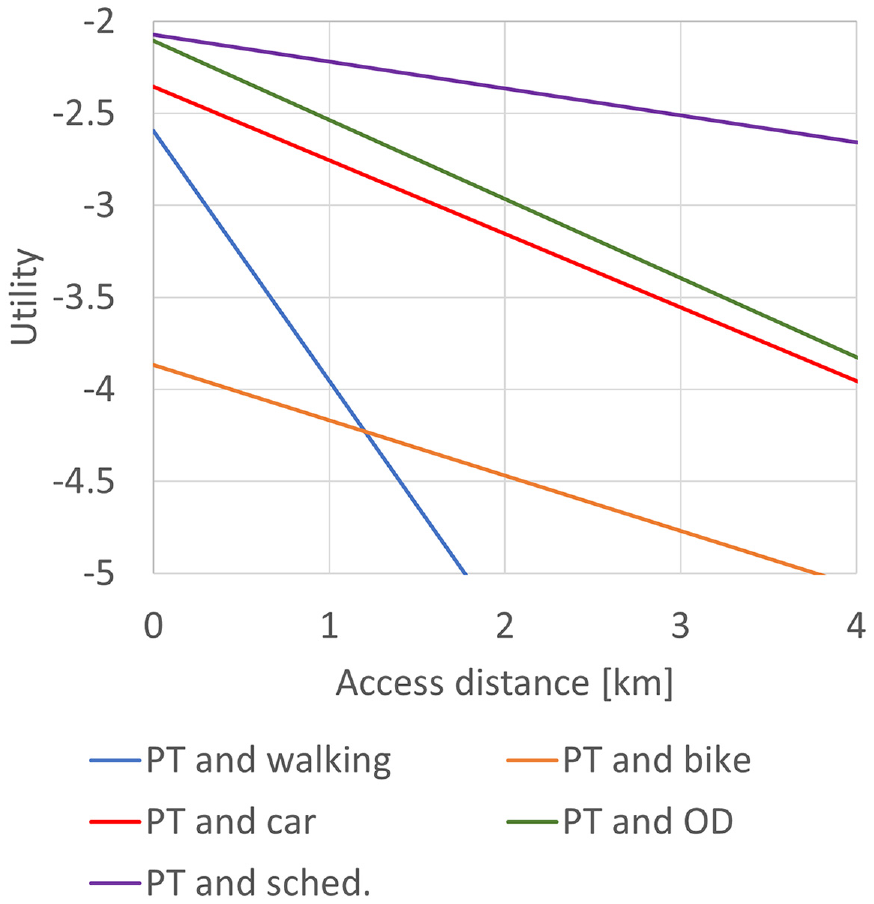
Different access modes in combination with public transport compared with public transport with walking as access mode for varying distances of the access trip.
First, the existing public transport is compared with an offer of autonomous busses as the main mode of transport. One benefit expected from autonomous busses is the shortening or even elimination of access routes to stops. Figure 6 shows how the utility of the autonomous busses without access route to the stop changes in relation to waiting time or extra travel time, compared with public transport with three different distances of access. For car owners, the graph shows that for the same conditions and no access route, the respondents preferred both types of autonomous shuttles over public transport. For respondents without a car, the graph shows that the sched. shuttle is rated almost the same as the classic public transport without an access route. The novelty of the service is not evaluated positively, but it does not seem to be a disadvantage. Based on the gradient of the straight lines, it is revealed that an increase in waiting time at home is clearly perceived less negatively than an increase in travel time in the scheduled bus. For both groups, it also shows that longer waiting times or longer travel times are accepted to avoid walking to the public transport stop. For public transport pass owners, a 500-m walk is similar to 33 min of waiting at home or extra travel time of 16 min. For car owners, it is 50-min waiting time and 24 min of extra travel time. It can also be seen that a 10-min frequency of a sched. shuttle exceeds the utility of an OD shuttle without waiting time in both groups. In summary, a greater utility compared with public transport is generated if the deployment of the shuttles shortens access routes and if the final destination of the trip can be reached by the shuttle.
In addition to public transport, the shuttles are also compared with walking, cycling, and driving (see Figure 7). For this purpose, the total travel distance and travel time is varied while assuming an access distance to public transport of 200 m. It can be seen that walking and cycling beat both shuttle and public transport on small distances. As soon as there is a car in the household, the benefit of driving a car is far higher than all public transport alternatives, and is also superior to walking and cycling for distances of only a few hundred meters. Consequently, even shuttles cannot change the situation that mobility tools determine a large part of the mode choice decision. We also calculated that the utility of driving is the highest for distances more than 9 km, even for respondents who do not have a car available in their household. However, the utilities of the shuttles are higher than for existing public transport and therefore they have the potential to attract more people.
Finally, the different alternatives for access to classic public transport are examined. Various studies assume a great potential of AVs in this area ( 3 , 4 ). In Figure 8, the utilities of different access modes are shown in relation to the length of the access route. In this case, a total travel distance of 9 km with public transport is assumed. It can be shown that the sched. shuttle is the most popular mode. One possible explanation would be that this combination is not seen as a change of transport mode. The OD shuttle shows the second highest benefit, although this drops off with increasing distance in comparison. It is followed by the car and, least popular, the combination with a bicycle or walk. In summary, however, the ranking of these combinations hardly varies with distance, except for walking.
Conclusion
We conducted a stated choice experiment on mode choice to identify the adequate areas of application and potential of autonomous busses by schedule and on demand. As well as AVs, the 1,434 respondents were given a choice of familiar modes of transport. In the course of the survey, a future state-of-the-art vehicle was presented, which was taken into account as a basis for the mode choice. A model-based analysis was used to identify areas of deployment and groups with increased demand. While car owners are more positive toward the autonomous shuttle compared with public transport, respondents without a car evaluated both shuttle types similarly to the existing public transport system. This is probably related to the presentation of shuttles as part of public transport in the survey. There is potential in all existing areas of public transport with low-demand density, as soon as the use of AVs is economically feasible. This includes, in particular, medium distances, since walking and cycling perform better for the short distances and the car is better for longer distances, even if the household does not own any vehicles. Faster rail-based long-distance transport could change the ratio, which is why the combination of shuttles with long-distance transport should be a research focus in the future. As a primary mode of transportation, autonomous busses can be especially beneficial when access routes to existing public transportation are long. The respondents also accept longer waiting times for an OD bus or longer travel times. Regardless of the distances, however, it is also evident that if the household owns a car or has a public transport pass, this strongly determines the decisions in one direction or the other. Further research is needed to investigate whether a possible future availability of public transport at all origins and destinations and at all times can have an influence on these ownership decisions. In contrast to various other studies, this study found a weaker dependence of age, rather than smartphone ownership, on the acceptance of autonomous busses. The influence of the survey channel on acceptance is also clear. People who were approached via the various public transport social media platforms were significantly more positive about autonomous shuttles than those recruited via the online panel. A correlation with the attitudes that lead to visiting the social media sites can be assumed. Moreover, it shows that both types of shuttles are more popular as a feeder than driving a car, biking, or walking. This also opens up great potential if the resistance for a direct car ride (e.g., parking pressure, increased travel time, city toll) is high enough and the distance for biking and walking is too long. Further research will be needed once AVs reach higher travel speeds and operate without an attendant on board. Then, more revealed preference surveys will need to be conducted as a stated choice survey like this can only give an impression of a possible future. Nevertheless, this survey will be used to create an agent-based travel demand model. This will investigate different scenarios for the cities of Mannheim and Friedrichshafen in Germany. In this way, the usefulness of different forms of deployment in the context of public transport can be tested for an urban and a rural region.
Footnotes
Author Contributions
The authors confirm contribution to the paper as follows: study conception and design: C. Klinkhardt, K. Kandler, M. Heilig, N. Kostorz, M. Kagerbauer, P. Vortisch; data collection: C. Klinkhardt; analysis and interpretation of results: C. Klinkhardt, K. Kandler, M. Heilig, N. Kostorz; draft manuscript preparation: C. Klinkhardt. All authors reviewed the results and approved the final version of the manuscript.
Declaration of Conflicting Interests
The authors declared no potential conflicts of interest with respect to the research, authorship, and/or publication of this article.
Funding
The authors disclosed receipt of the following financial support for the research, authorship, and/or publication of this article: This work was conducted within the projekt RABus (Living Lab for an Automated Bus Service Operating as Part of Public Transportation in Rural and Urban Areas, ![]() ), which is funded by the Ministry of Transport Baden-Württemberg, Germany.
), which is funded by the Ministry of Transport Baden-Württemberg, Germany.