
Abstract
Motorcycle road traffic accidents represent a big concern, as vulnerable road users account for more than half of all road deaths worldwide. The estimation of the influential factors associated with the increase of injury severity of motorcyclists involved in a road accident is of extreme importance as it provides a necessary basis for the development of an appropriate and targeted sustainable prevention plan for improving road safety. This study adopted the decision tree, ordered logistic regression (LR), random forest (RF), gradient boosting, extreme gradient boosting, k-nearest neighbor, and support vector machine methods to predict the injury severity outcome of motorcycle accidents. All the developed models were compared with six different performance metrics. A 10-year (2010–2019) dataset with motorcycle accidents that occurred in Portugal was used for analysis. As usual in traffic accidents datasets, this dataset is class unbalanced which was dealt with by under-sampling. The developed models made it possible to determine the factors associated with the increase of injury severity of motorcyclists involved in road accidents. The interpretation of each factor is based on the Shapley additive explanations values. The RF and LR models (developed with the balanced dataset) outperformed the other models. Risk factors associated with alcohol consumption, road type, road conditions, location, motorcycle age, rider’s gender, and when the accident occurs were estimated. This study provides a suitable framework analysis to build a proper predictive model, allowing researchers and practitioners to evaluate more accurately the risk factors of motorcycle injury severity.
Keywords
Road traffic accidents claim 1.35 million lives and cause 50 million severe injuries worldwide each year, representing a serious social and economic problem ( 1 ). Pedestrians, cyclists, and motorcyclists (vulnerable road users) represented about 54% of all road deaths worldwide and 43% in Europe in 2018 ( 1 ). There has been an overall decrease in the number of road accidents as well as the number of victims and fatalities in all types of road accidents in Europe over the years ( 2 ). However, between 2007 and 2016, the number of fatalities in motorcycle accidents decreased less than in car accidents. In the EU-28 (European Union with a group of 28 countries), between 2000 and 2018, the share of fatalities in motorcycle accidents has increased, contrary to the decrease in the share of fatalities in car accidents, in all road fatalities. In a road accident, the risk of death for a motorcycle rider can be 34 times higher when compared with other types of motor vehicles per vehicle mile traveled ( 3 ).
Several studies have focused on determining risk factors associated with the increase of injury severity of motorcycle riders when involved in a road accident ( 4 – 11 ). Such studies are of extreme importance as they allow us to understand the main factors associated with the motorcycle riders’ levels of injury severity when involved in road accidents. This way, it is possible to take countermeasures to minimize injury severity and reduce the number of fatalities on the roads. On the other hand, it is also important to compare different methods that allow to extract these risk factors. In Santos et al. is presented a literature review of 56 studies, from 2001 to 2021, that compared different machine learning methods applied to injury severity prediction in road traffic accidents ( 12 ). Santos et al. concluded that random forest (FR), support vector machine (SVM), decision tree (DT), and k-nearest neighbor (KNN) were good algorithms for road traffic accident injury severity prediction ( 12 ).
In the present study, the above four machine learning algorithms presented as the “best” in Santos et al. are going to be compared ( 12 ). Additionally, a classical statistical method, the ordered logistic regression (LR), will be used in this comparison, as in Santos et al., where an LR model was developed to determine risk factors associated with increased injury severity in powered two wheelers’ riders when involved in a road accident ( 4 ). Gradient boosting (GB) and extreme gradient boosting (XGBoost) models are going to be developed and compared too. The XGBoost algorithm was chosen because of its advantages of high efficiency and sufficient flexibility ( 13 ). As XGBoost is a novel extension of the commonly used gradient tree boosting, GB was chosen for this analysis too.
As mentioned, several machine methods have been used to study the accident injury severity. However, an important issue with these models is the model results’ interpretability. The Shapley additive explanations (SHAP) method is used in the current study to interpret how each variable affects model prediction results. The SHAP explanation method computes Shapley values from coalitional game theory. The variable values of a data instance act as players in a coalition. Shapley values tell us how to fairly distribute the “payout” (the prediction) among the variables ( 14 ). Calculating the contribution of each individual variable to the prediction yields explanations for the results.
The dataset used to analyze the performance of the mentioned methods corresponds to all motorcycle accidents with victims that occurred in Portugal between 2010 and 2019. Southern European countries, such as Portugal, Spain, Italy, and Greece, can be seen as a cluster as they present economic and market similarities as well as similar weather conditions ( 15 ). It is important to analyze risk factors in one of these countries not only to understand the influence of such factors in the increase in injury severity but also to compare them with similar countries. What is more, the number of fatalities per million inhabitants in the group of the southern European countries has been higher (2010–2018) than for the rest of the countries of the EU-28 combined ( 2 ).
The dataset for analysis is unbalanced, meaning that the distribution of casualty severity is not uniform (or nearby). This class unbalance problem happens since the number of instances classified under the fatality class is much lower than those classified under the severe injuries or minor injuries classes. In such cases, standard machine learning models tend to be overwhelmed by the majority classes and overlook the minority ones. To handle this problem, several methods have been proposed ( 16 ). The random under-sampling of the majority class procedure is used in this study to control this problem and offer a better prediction for the minority classes.
Literature Review
The study conducted by Mannering and Bhat was a very important step in identifying future methodological directions in accident research where methodologies that can address complex issues relating to unobserved heterogeneity, endogeneity, risk compensation, and spatial and temporal correlations were presented ( 17 ). Studies presented in Mannering and Bhat that analyzed accident-frequency data and accident injury severity are of extreme importance to improve the development of safety countermeasures that could reduce accident severity ( 17 ).
From the literature review presented in Santos et al. can be extracted information about studies that compared different machine learning algorithms to develop injury severity prediction models in road traffic accidents ( 12 ). There are several studies that compare different machine learning techniques to predict injury severity where at least two of the following algorithms were used: RF, SVM, DT, KNN, and XGBoost ( 18 – 32 ). In all these studies, the most-used performance metric to compare the model results was accuracy. The number of severity levels considered in these studies vary from two to five which could be considered as: property damage only, no injuries, minor injuries, severe injuries (or just injuries where the last two are joined), and fatal accidents. The best performance in these studies were achieved by RF (six times), KNN (three times), and XGBoost (twice).
As referred to before, there are several examples of studies that determined influential factors associated with the increase of injury severity of motorcycle riders when involved in a road accident using only a statistical or machine learning method. However, studies that compare several methods to then extract those risk factors are not so common. Ospina.Mateus et al., Reapour et al., and Wahab and Jiang compared different machine learning algorithms with model injury severity in motorcycle accidents ( 33 – 35 ). At least two of the following algorithms were used in these studies: RF, SVM, DT, and KNN. In all three of these studies, the first step was to evaluate the predictive power of different modeling techniques and then present results about the risk factors associated with more severe accidents from the point of view of injuries. However, only in Ospina-Mateus et al. are these risk factors connected to the different classes of each variable, while in the other two studies the risk factors are connected to the variables ( 33 ). The best performance was achieved by a non-dominated sorting genetic algorithm and simulated annealing heuristic (NSGA-II & SA) model and by RF models ( 33 – 35 ).
Data and Methods
For this study, all police-reported road accidents involving at least one injured motorcyclist that occurred in Portugal over a 10-year period, from January 1, 2010, to December 31, 2019, were considered. This dataset was provided by the Portuguese Road Safety Authority (ANSR) and contains detailed information on all recorded accidents with victims within 30 days of the accident. A “fatality” is defined as when the victim passes away within 30 days of the accident. Motorcyclists with “severe injuries” are victims that do not die within 30 days of the accident, who have body injuries requiring medical assistance for more than 24 h. All other cases of injured motorcycle riders are those with “minor injuries.” The information present in the data (a total of 117 variables) can be divided into three parts: accident information (50 variables), motorcyclist information (43 variables), and a third part related to the other driver involved (24 variables), when this exists.
From the original dataset were removed 82 variables (37 duplicated, 21 with no meaning for the analysis, 6 with a high number of blanks, and 18 with similar meaning to other variables). After the variable removal, all the observations with missing information were removed from the remaining 35 variables. After this process, the dataset includes 34,298 minor injuries (90.9%), 2,663 severe injuries (7.1%), and 767 fatalities (2.0%). The response variable for the problem that is going to be analyzed is the motorcyclist injury severity, which is an ordinal variable with the following classes in crescent order of injury severity: minor injuries, severe injuries, and fatalities.
A full exploratory analysis of the data was performed for all 35 variables in the dataset. To begin with, the exploratory analysis was performed on the original dataset. Afterwards, the continuous variables were discretized and, considering the previous exploratory analysis, some classes were grouped within the different variables. A new exploratory analysis was performed on this new discretized and regrouped dataset. With the objective of keeping the length of this study reasonable, the explanatory analysis is not going to be presented.
The methodology proposed by Santos et al. is going to be followed and it is summarized in Figure 1 ( 12 ). Seven different machine learning methods are investigated and discussed in this study: DT, LR, RF, GB, XGBoost, KNN, and SVM ( 13 , 36–38). To compare the models’ performance, the following metrics were used: sensitivity, specificity, precision, F1-score, accuracy and area under the curve (AUC). Information about the different machine learning methods and performance metrics can be submitted on request.
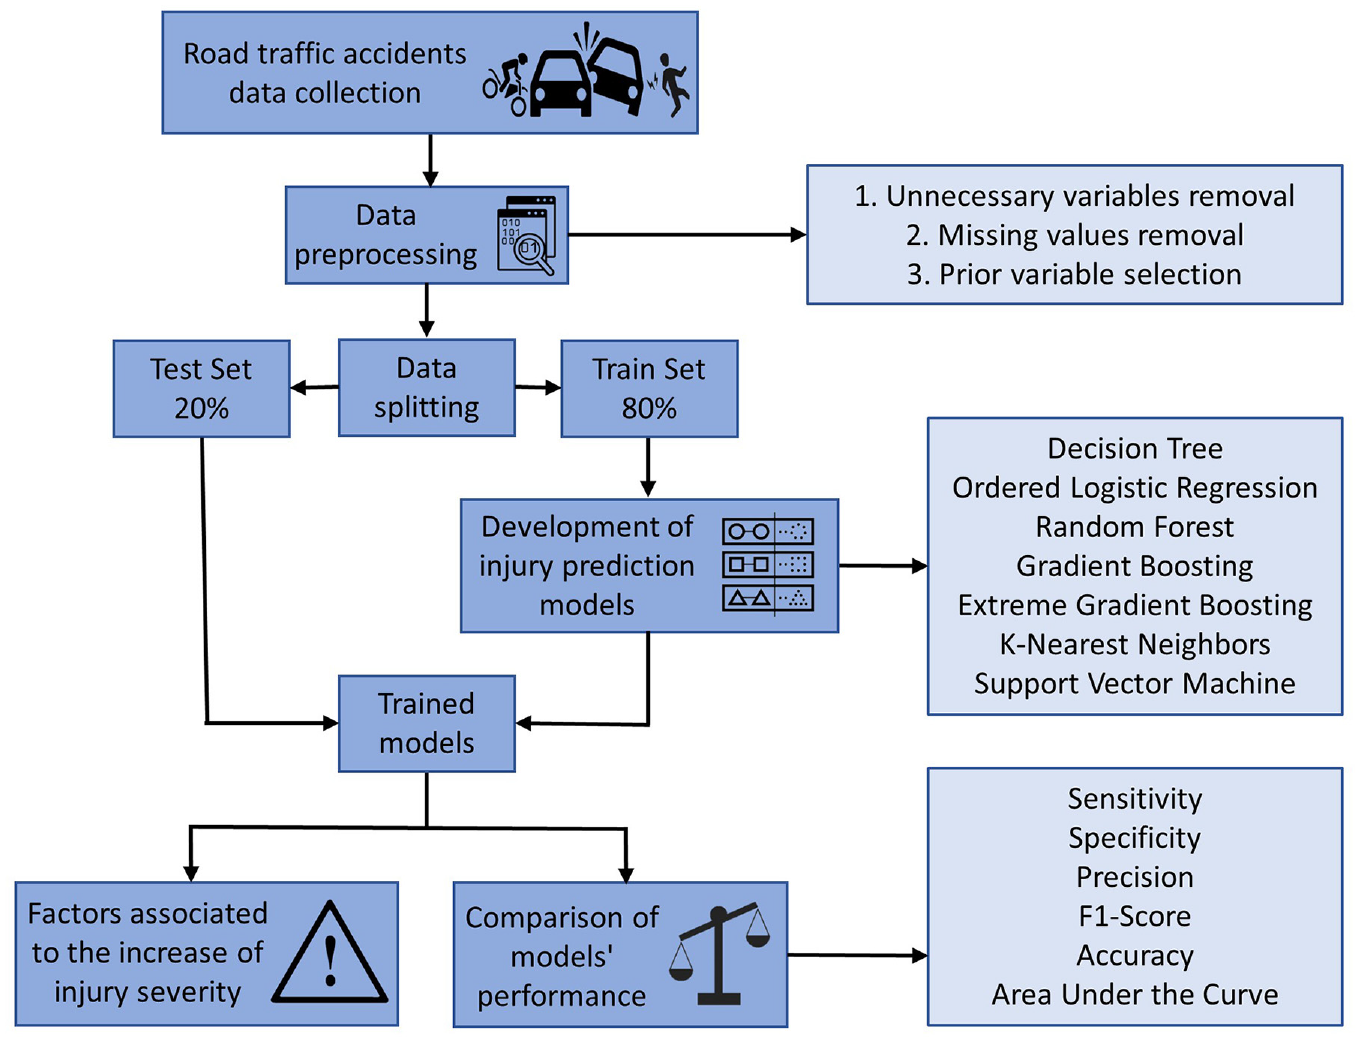
Methodology used in this work.
Prior Variable Selection
Four different variable selection methods were used to identify and remove irrelevant and redundant information from the dataset. These methods reduce the size of a dataset by discarding irrelevant variables, which will improve the algorithms’ performance. Correlation measures, mutual information criteria, minimum redundancy maximum relevancy, and stepwise regression were used. A non-parametric correlation coefficient, Spearman, was used for the correlation measures and for the analysis between an ordinal variable with more than two levels and a continuous variable. The Kruskal-Wallis test was applied for the analysis of an ordinal and a nominal variable.
Each variable selection method was applied separately to both the original dataset and the discretized and regrouped dataset. Some criteria were defined to choose the variables after the variable selection methods were applied. To begin with, the variables selected by all the techniques for both datasets (Region, RoadType, and MotorcyclistAlcohol) were chosen. Secondly, the variables selected in at least one dataset by each technique (OtherDriverAlcohol and OtherDriverInjuries) were chosen. Finally, the variables selected at least four times for any dataset (DaysWeek, Grip, Location, Light, RoadMark, Police, MotorcyclistLicense, MotorcyclistHelmet, MotorcycleAge, MotorcycleInsurance, and OtherVehicleCategory) were chosen. So, from the 34 explanatory variables considered in the dataset, 17 were selected with the variable selection methods.
Afterwards, three preliminary ordered logistic models were developed to complete the variable selection process. In first place, a model with the previous 17 selected variables was developed. Secondly, a model with all the 34 explanatory variables of the dataset was developed. The previous two models were finally combined to achieve a model with all variables statistically significant. Taking this process into consideration, 22 explanatory variables were selected: DaysWeek, Grip, Region, Weather, Intersection, Location, Light, RoadMark, AccidentType, SegmentType1, SegmentType2, RoadType, MotorcyclistGender, MotorcyclistLicense, MotorcyclistHelmet, MotorcyclistAlcohol, MotorcycleAge, MotorcycleInsurance, OtherDriverAlcohol, OtherDriverInjuries, OtherDriverGender, and OtherVehicleCategory.
Results and Discussion
Only 2.0% of all the observations in the dataset relate to fatal accidents. To handle such an unbalanced data set, under-sampling was used as it is often applied and is a good solution for this type of data ( 39 ). For all the seven selected methods, two different models are going to be developed considering the discretized and regrouped dataset (with the selected 22 explanatory variables and considering this dataset using the under-sampling technique). The machine learning methods were applied and developed in Python. As represented in the methodology (Figure 1), the data was split into a training set with 80% of all observations and a test set with 20% of all observations. Both training and test sets present the same proportion of observations for each year and for each injury severity level. The splitting share was chosen considering similar previous studies ( 40 – 43 ). The accuracy of machine learning methods is highly dependent on the choice of learning parameters and model coefficients ( 44 ). As a result, for all of the developed models, a parameter grid search was performed to determine the optimal values of the hyperparameters. The DT developed model is a classification and regression tree (CART). In the case of the KNN models, it was necessary to use a categorical distance, as the response variable is categorical, and the Hamming distance was used, as it is recommended ( 45 ). The LR model was developed with regularization.
Performance of the Prediction Models
All the results considering the performance of the different 14 developed models are presented in Tables S1 and S2. For all the models, the AUC, sensitivity, specificity, F1-score, and precision are presented for each class of the response variable, as well as the overall micro, macro, and weighted value for each metric. Also, the overall accuracy is presented for each model. The model results considering the balance dataset are represented with “_Bal” after the method name. As stated before, micro sensitivity, micro specificity, micro F1-score, and micro precision present the same value and so only the micro sensitivity is presented that is always the same value as the accuracy.
The most important class to predict correctly is class 3 (fatal). It is not desirable to classify a fatal event as an event where a minor or severe injury occurred, as human life is always the most important factor to consider. In this case, sensitivity answers the following question: of all the motorcyclists who died in road accidents, how many of them were correctly predicted? Sensitivity should be a parameter to be aware of when the idea of false positives is far better than false negatives. That is, the occurrence of false negatives is much more unacceptable than getting some extra false positives (false alarms) over saving some false negatives. It is better, in this case, to classify a minor or severe injury as a fatality (false positive) than to classify a fatality as a minor or severe injury (false negative). The F1-score is a good parameter to analyze the balance between precision and sensitivity. Specificity can be analyzed to understand the number of minor and severe injuries correctly classified among all the minor and severe injuries that occurred (in the case of class 3).
Concerning the sensitivity for class number 3 (fatal), the top three values were achieved with the RF_Bal, LR_Bal, and XGB_Bal models. Not only were the values of sensitivity for class 3 better for the models developed with the balanced dataset, but they were much higher when compared with the models with the unbalanced dataset (improvements of at least 250%). The sensitivity of the RF model was 0.039 and that of the RF_Bal model was 0.757. In the case of the LR model and LR_Bal model, the sensitivity was improved from 0.066 to 0.737. This means that the balanced models correctly predicted many more injuries of class 3 (fatal). The best values of specificity for class 3 were achieved for the GB_Bal, XGB_Bal, RF_Bal, and LR_Bal models. The top three values of F1-score for class 3 were achieved for the GB_Bal, LR_Bal, and RF_Bal models. Considering the severe injuries (class 2) the best results of sensitivity, specificity, and F1-score were achieved in the GB_Bal and XGB_Bal models. The RF_Bal and LR_Bal models achieved better results in sensitivity, specificity, and F1-score in class 2 when compared with the models developed with the unbalanced dataset.
As the models developed with the balanced dataset presented the best results in correctly classifying classes 2 and 3, they are now going to be analyzed for their weighted overall performance. The weighted average is preferred when considering an unbalanced dataset and it is desirable to consider the proportion of each label in the dataset. However, using the macro average would be a better choice with an unbalanced dataset where all classes are equally important, as it treats all classes equally. Micro averaging is preferred when the dataset is balanced and it is desirable to have an easy-to-understand metric for overall performance regardless of the class. In this study, the different classes of the response variable do not present the same importance, as there is a crescent level of injury severity. Additionally, as seen before, the dataset is unbalanced, as only 2% of all observations are considered fatalities. This way, the weighted average is the preferred average parameter as each class’s support is considered.
The comparisons of the methods and metrics applied considering the weighted average of the performance metrics are presented in Figures 2 and 3 (only consider the results for the dataset with under sampling). The KNN_Bal model presents the best accuracy value, followed by the GB_Bal, LR_Bal, and RF_Bal models. However, the accuracy of a model is not a good overall metric. AUC is threshold-free and is used to have a generalized view of model classification performance. The LR_Bal and RF_Bal models presented the best weighted AUC values, followed by the GB_Bal model. The KNN_Bal model presented a good result in weighted sensitivity, specificity, and F1-score, but its weighted AUC value was the lowest of all the models developed with the balanced dataset, and, because of this, it will not be considered further in this discussion. Considering the weighted sensitivity, specificity, and F1-score, the RF_Bal, LR_Bal, and GB_Bal presented the best results among the models developed with the balanced dataset. In predicting fatal injuries (class 3) the best results were achieved with the RF_Bal model, followed by the LR_Bal model.
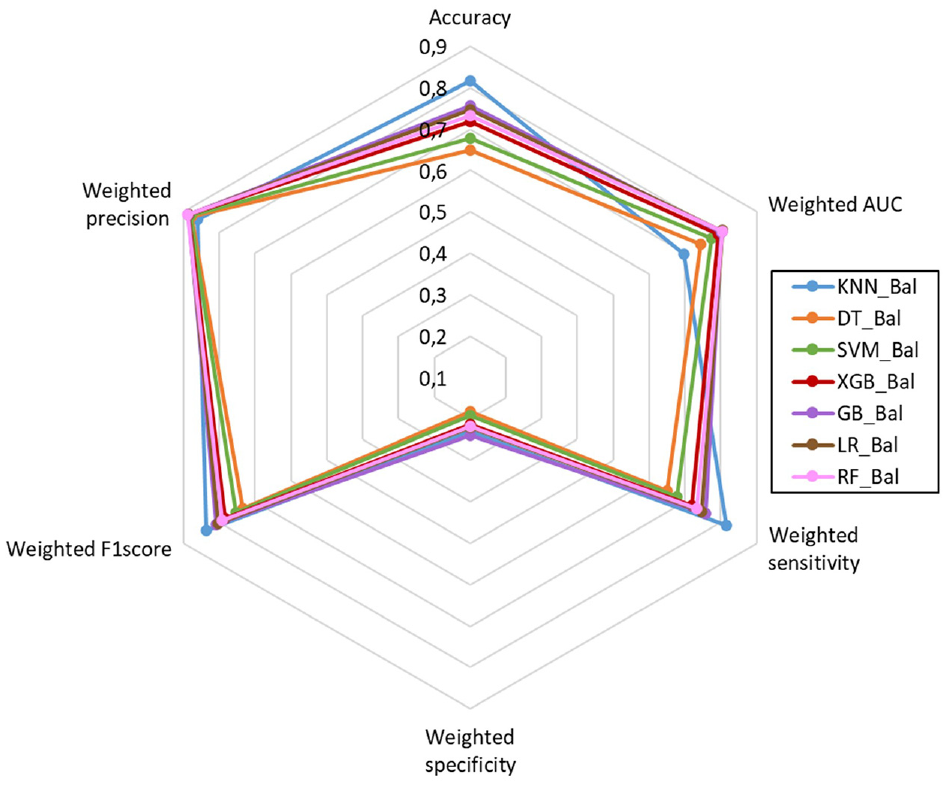
Weighted average performance metrics obtained for each method (with under sampling).
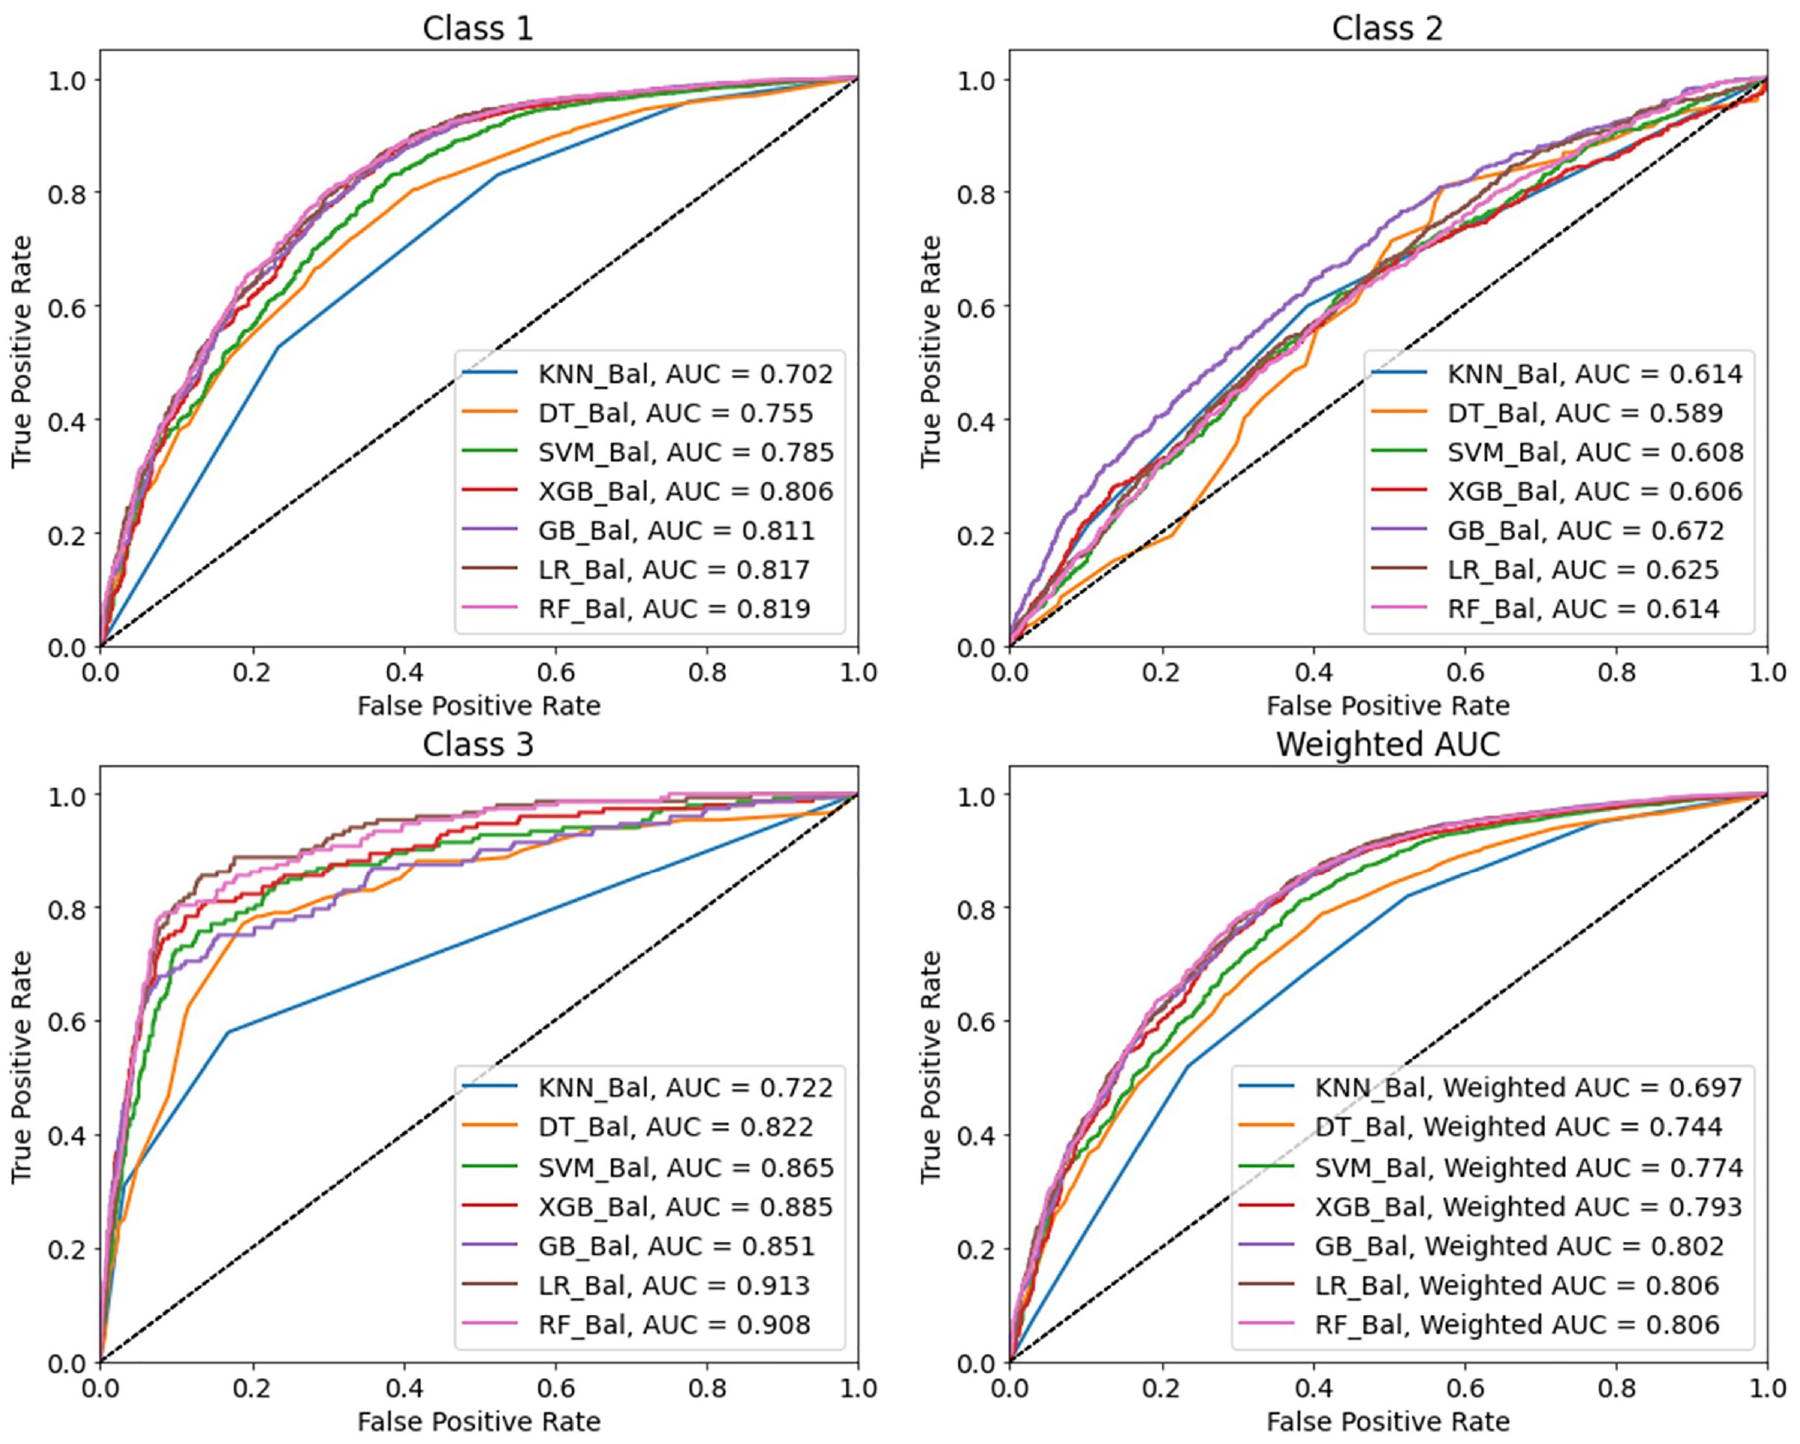
ROC curves for all classes and average weighted values (dataset with under sampling).
Analyzing only the ROC curves of the models developed with the balanced dataset (Figure 3), it is clear that the RF_Bal model presented the best results, followed by the LR_Bal model. RF was the method that achieved the best performance in the 56 studies analyzed in Santos et al., achieving the best performance 70% of the times used among the analyzed studies ( 12 ). A prediction model can be considered valid if all the ROC curves are located in the upper left of the 45° diagonal line, which extends from the bottom left corner to the top right corner of the graph. Only the DT_Bal model in prediction class 2 did not present its ROC curve located in the upper left of the 45° diagonal line.
The models developed are really sensitive to unbalanced data, so they will correctly classify the dominant class (minor injuries) while incorrectly classifying the classes with few observations (severe injuries and fatalities). To reach a conclusion about the factors that can be related to the increase in the injury severity of motorcyclists when involved in a road accident, the most severe accidents (with severe injuries and fatalities) must be correctly classified. To handle such an unbalanced dataset, the under-sampling technique gives a huge advantage in solving this problem. The trade-off of reducing the correctly classified minor injuries (class 1) to correctly classify more severe injuries and fatalities (class 2 and class 3) is a better deal, despite the overall performance metrics being worse for the models developed with the balanced dataset. Despite the weighted AUC being higher for the RF (0.824), XGB (0.822), and GB (0.819) models, that value was not much higher than the RF_Bal (0.806), LR_Bal (0.806), and GB_Bal (0.802). However, the sensitivity values in class 3 (fatal) were much better in the balanced models, especially in the RF_Bal and LR_BaL models.
Influential Factors in Injury Severity
To partially justify a model’s validity, not only the model performance should be considered. It is also important to understand the effects of influential factors on injury severity ( 40 ). In this section, a model analysis and an interpretation of the results from the model are presented. An interpretation of which features are more relevant and how each feature influences the injury severity of a motorcyclist involved in an accident is presented. As discussed before, RF_Bal and LR_Bal were the models that presented the best performance for the purpose of this study. This way, only the results of these two models are going to be discussed.
In Figure 4 are shown the 20 most important features for each model. When comparing both models, some features are commonly important in the motorcyclists’ injury severity prediction. Considering the top 10 most important features of both models the following features are common: MotorcyclistAlcohol, RoadType, RegionRoadMark, and OtherDriverInjuries. The MotorcyclistAlcohol is without a doubt one of the most important features in both models.
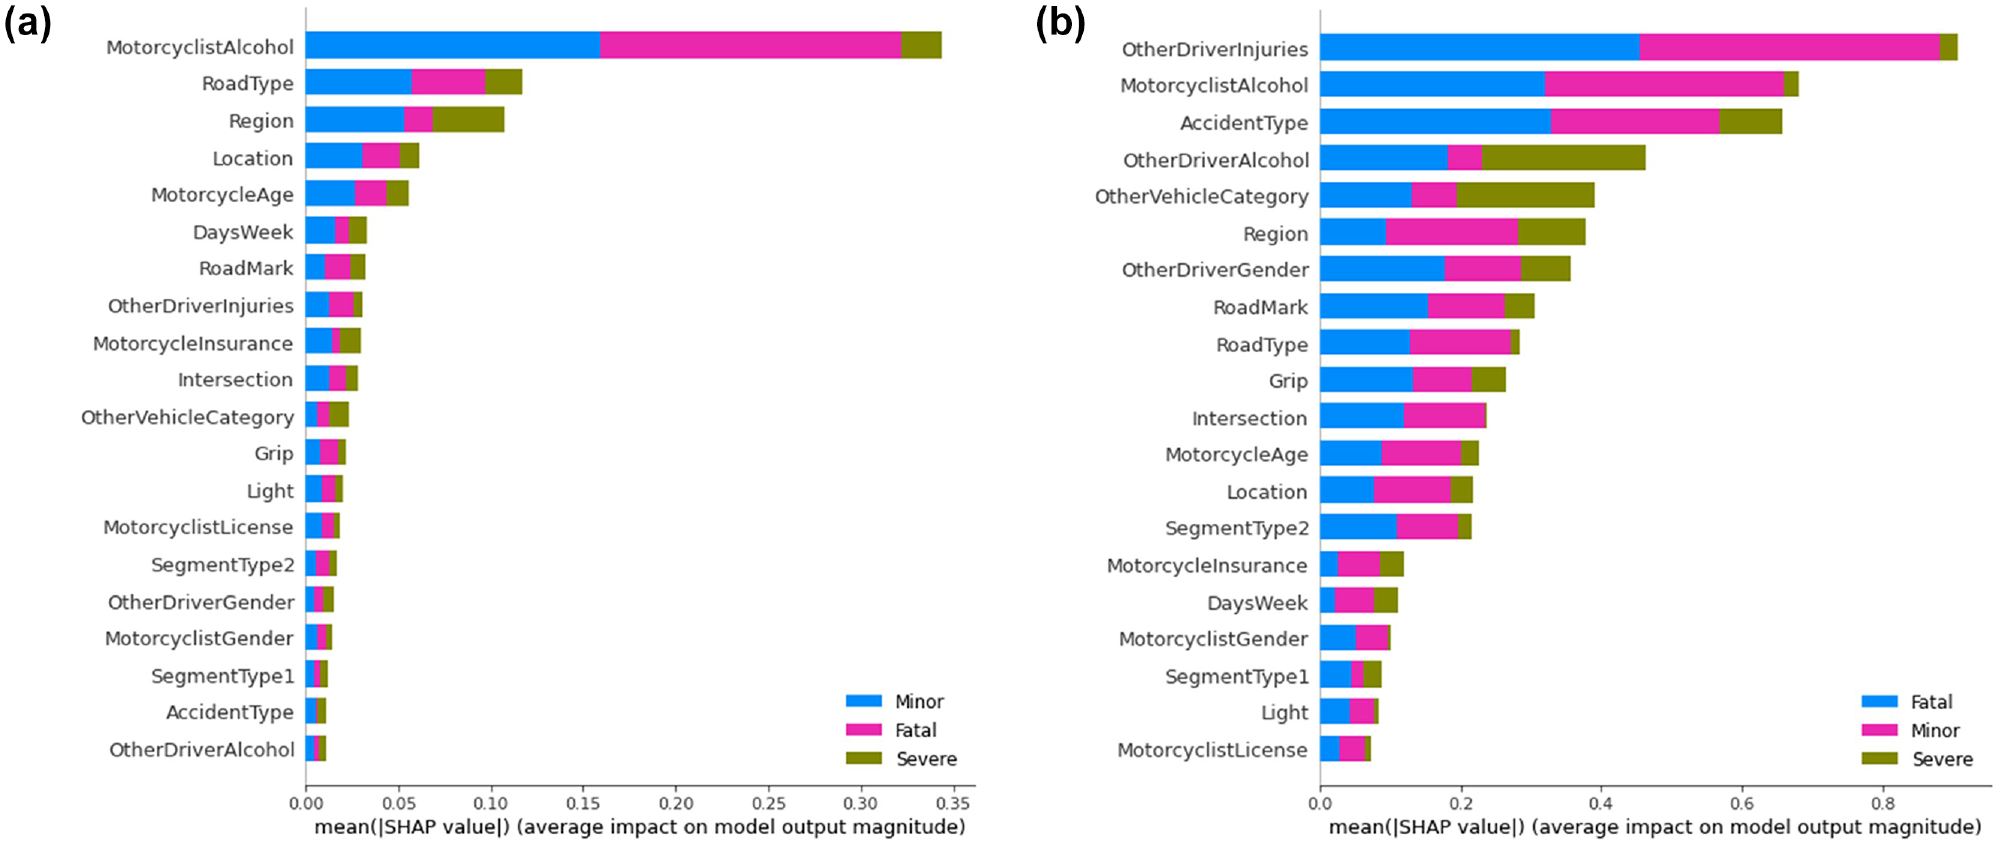
Features’ importance ranked through Shapley additive explanations (SHAP) values: (a) feature importance the RF_Bal model and (b) feature importance the LR_Bal model.
To explain the output of ensemble tree models, such as RF, the SHAP values can be estimated as they provide the importance of each feature. In Figure 5 are presented the SHAP values for the 20 most important features for each injury severity class for the RF_Bal model. To know if each feature negatively or positively affects the injury severity outcome, dots representing each motorcyclist victim of an accident are plotted horizontally by their SHAP value and colored by their nominal feature value. The different classes of each variable are represented from low (light blue) to high (red). When many motorcycle accident victims are concentrated in a SHAP value, dots will be stacked vertically as they run out of space, creating a density effect ( 14 ). In a brief example and taking into account Figure 5c, MotorcyclistAlcohol is the feature that mostly affect class 3. Blue dots stacked vertically at the left-side of the figure indicate that a low nominal value for the feature (0 in the case of the MotorcyclistAlcohol feature) contributes negatively for the outcome (less probability of fatal injury). As the feature nominal value increases, the probability of fatal injury also increases, as can be seen by the presence of red dots in the right-side of the figure. The higher the value, the greater the contribution to the probability of fatal injury.
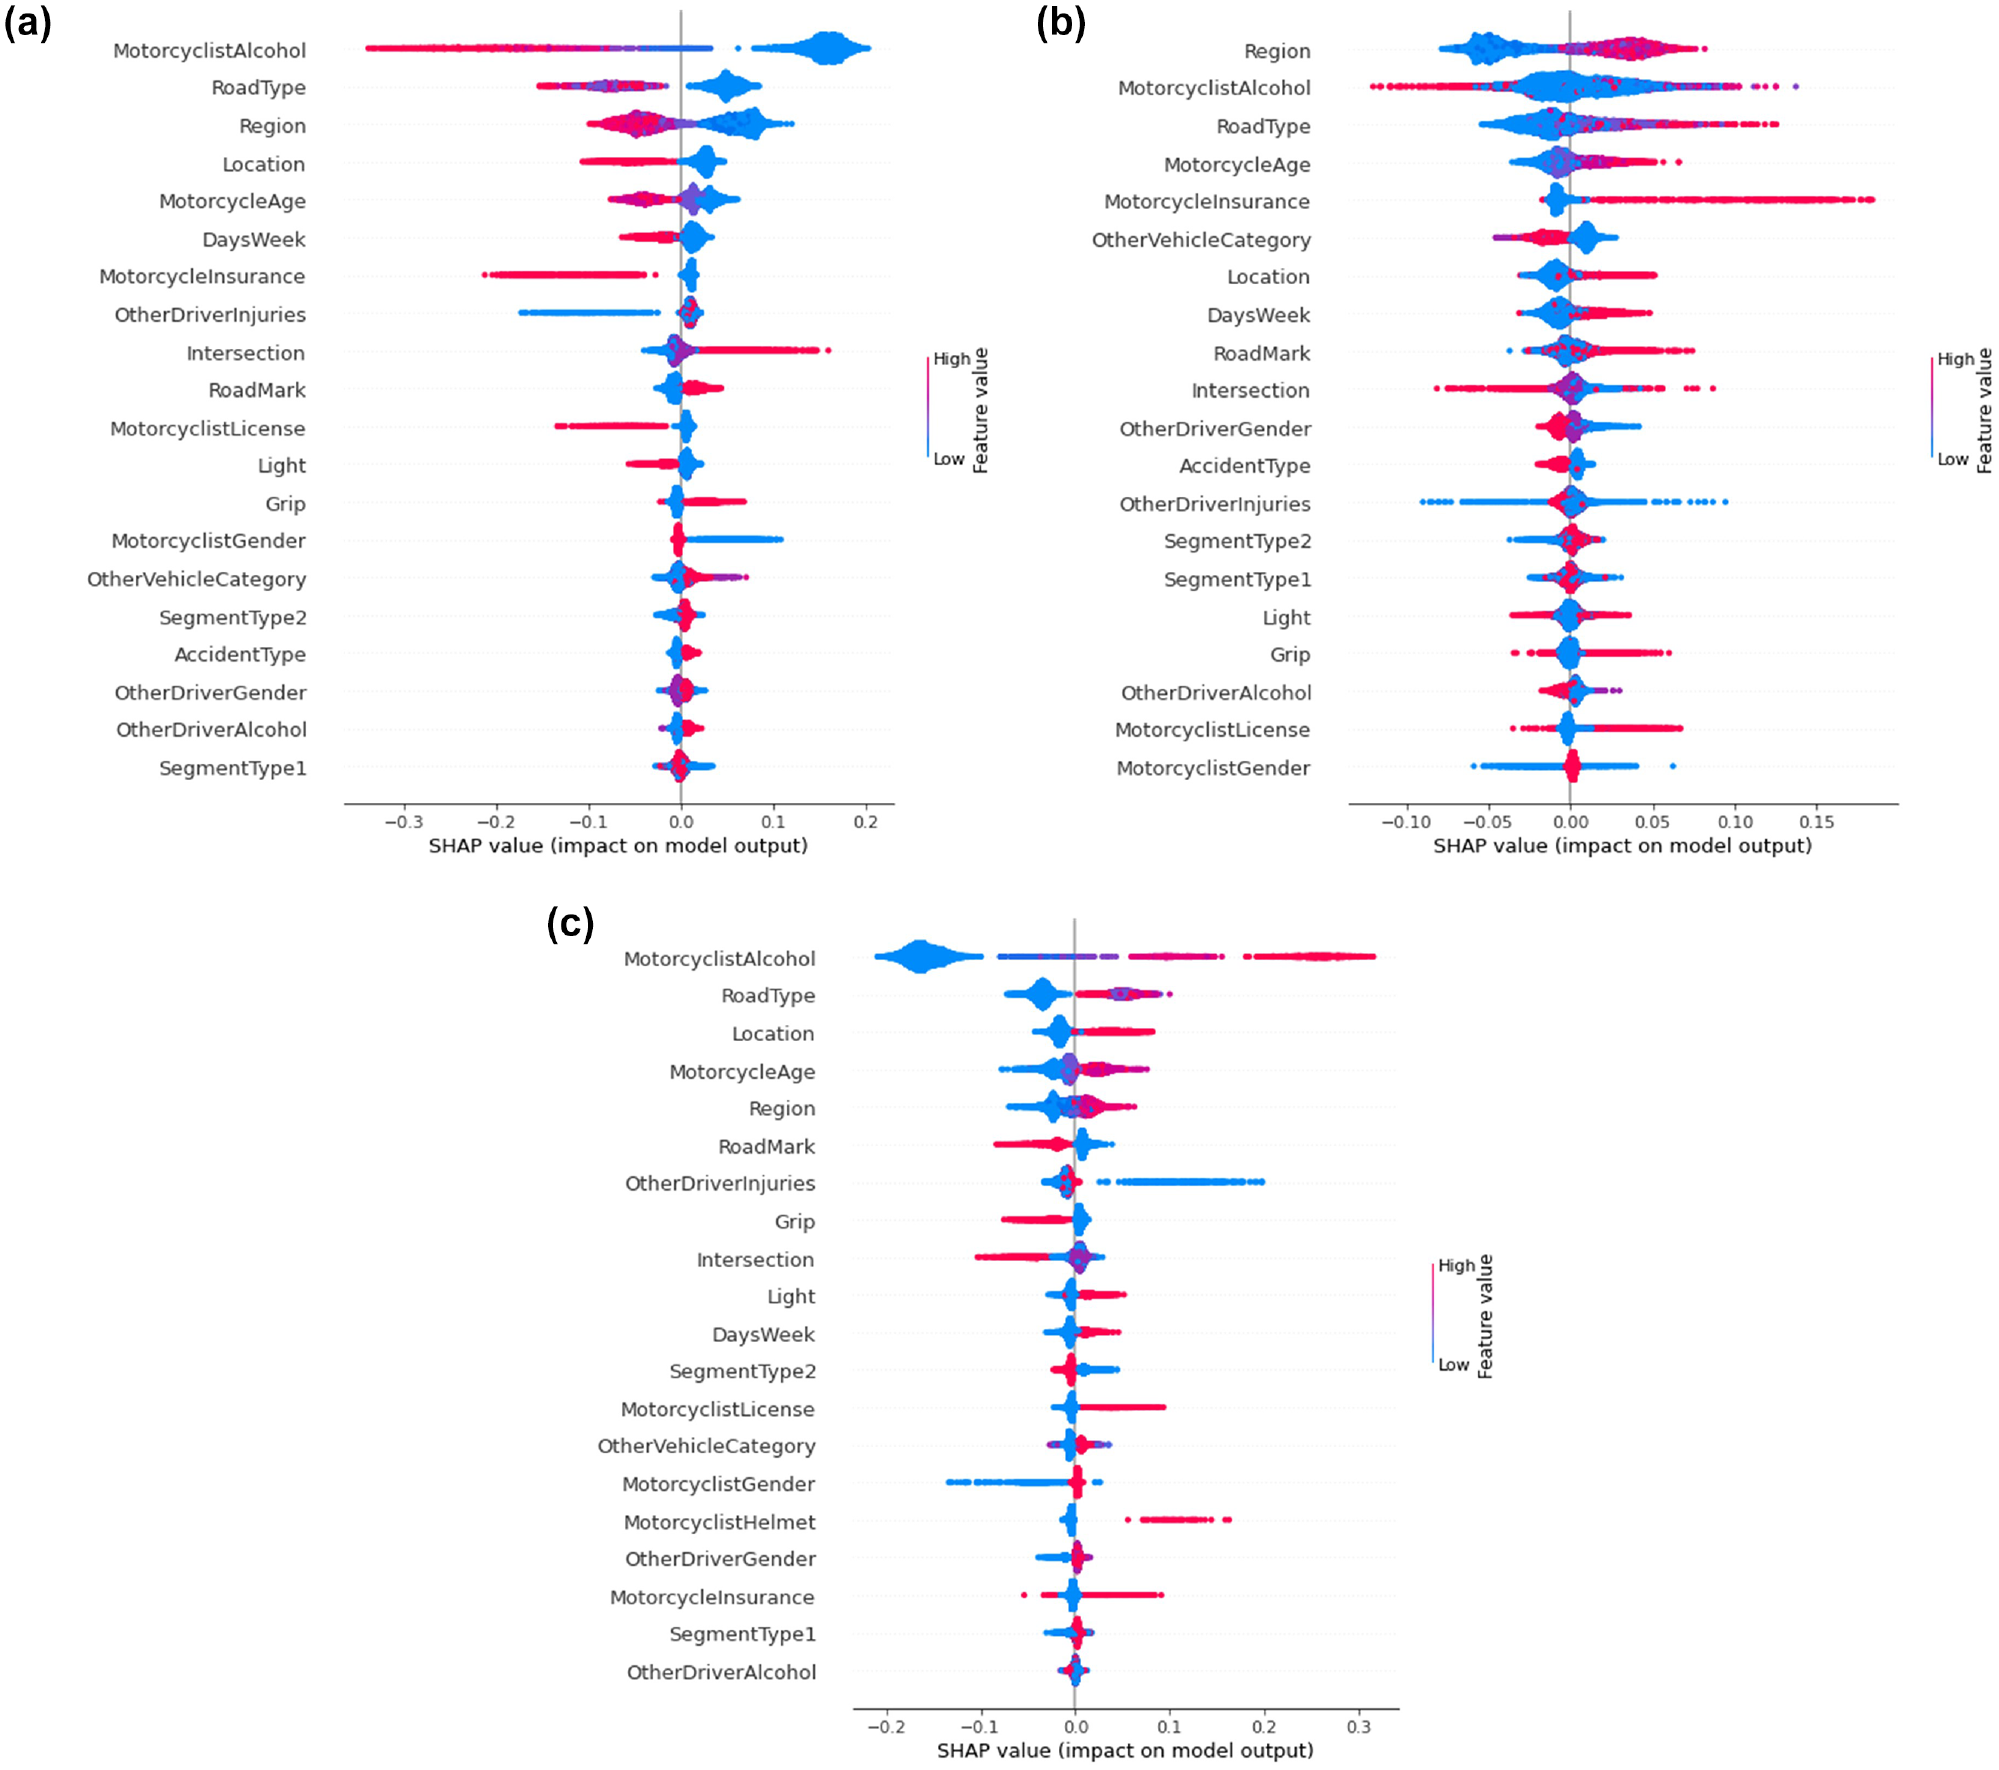
Shapley additive explanations (SHAP) values for RF_Bal model: (a) class 1—minor injuries, (b) class 2—severe injuries, and (c) class 3—fatal injuries.
Through the LR coefficients estimated, the odds ratio (OR) can be calculated. In this case, the ORs represent the increase (OR > 1) or decrease (OR 1) in the likelihood of suffering more severe injuries in a motorcycle accident. In Table 1, some p-values based on the Wald chi-square test are presented. This statistical test tests that at least one of the explanatory variables’ regression coefficients is not equal to zero in the model. The p-value should be compared with a significant level (0.05 in this study) to assess the validity of the null hypothesis (the coefficient of the explanatory variable is zero). The null hypothesis states that there is no association between the explanatory variable and the response variable. P-values higher than 0.05 mean that the association is not statistically significant. The results achieved with the LR_Bal model for the explanatory variables that presented p-values lower than 0.05 in all classes are presented in Table 1.
Odds Ratio and P-Values for the LR_Bal Model
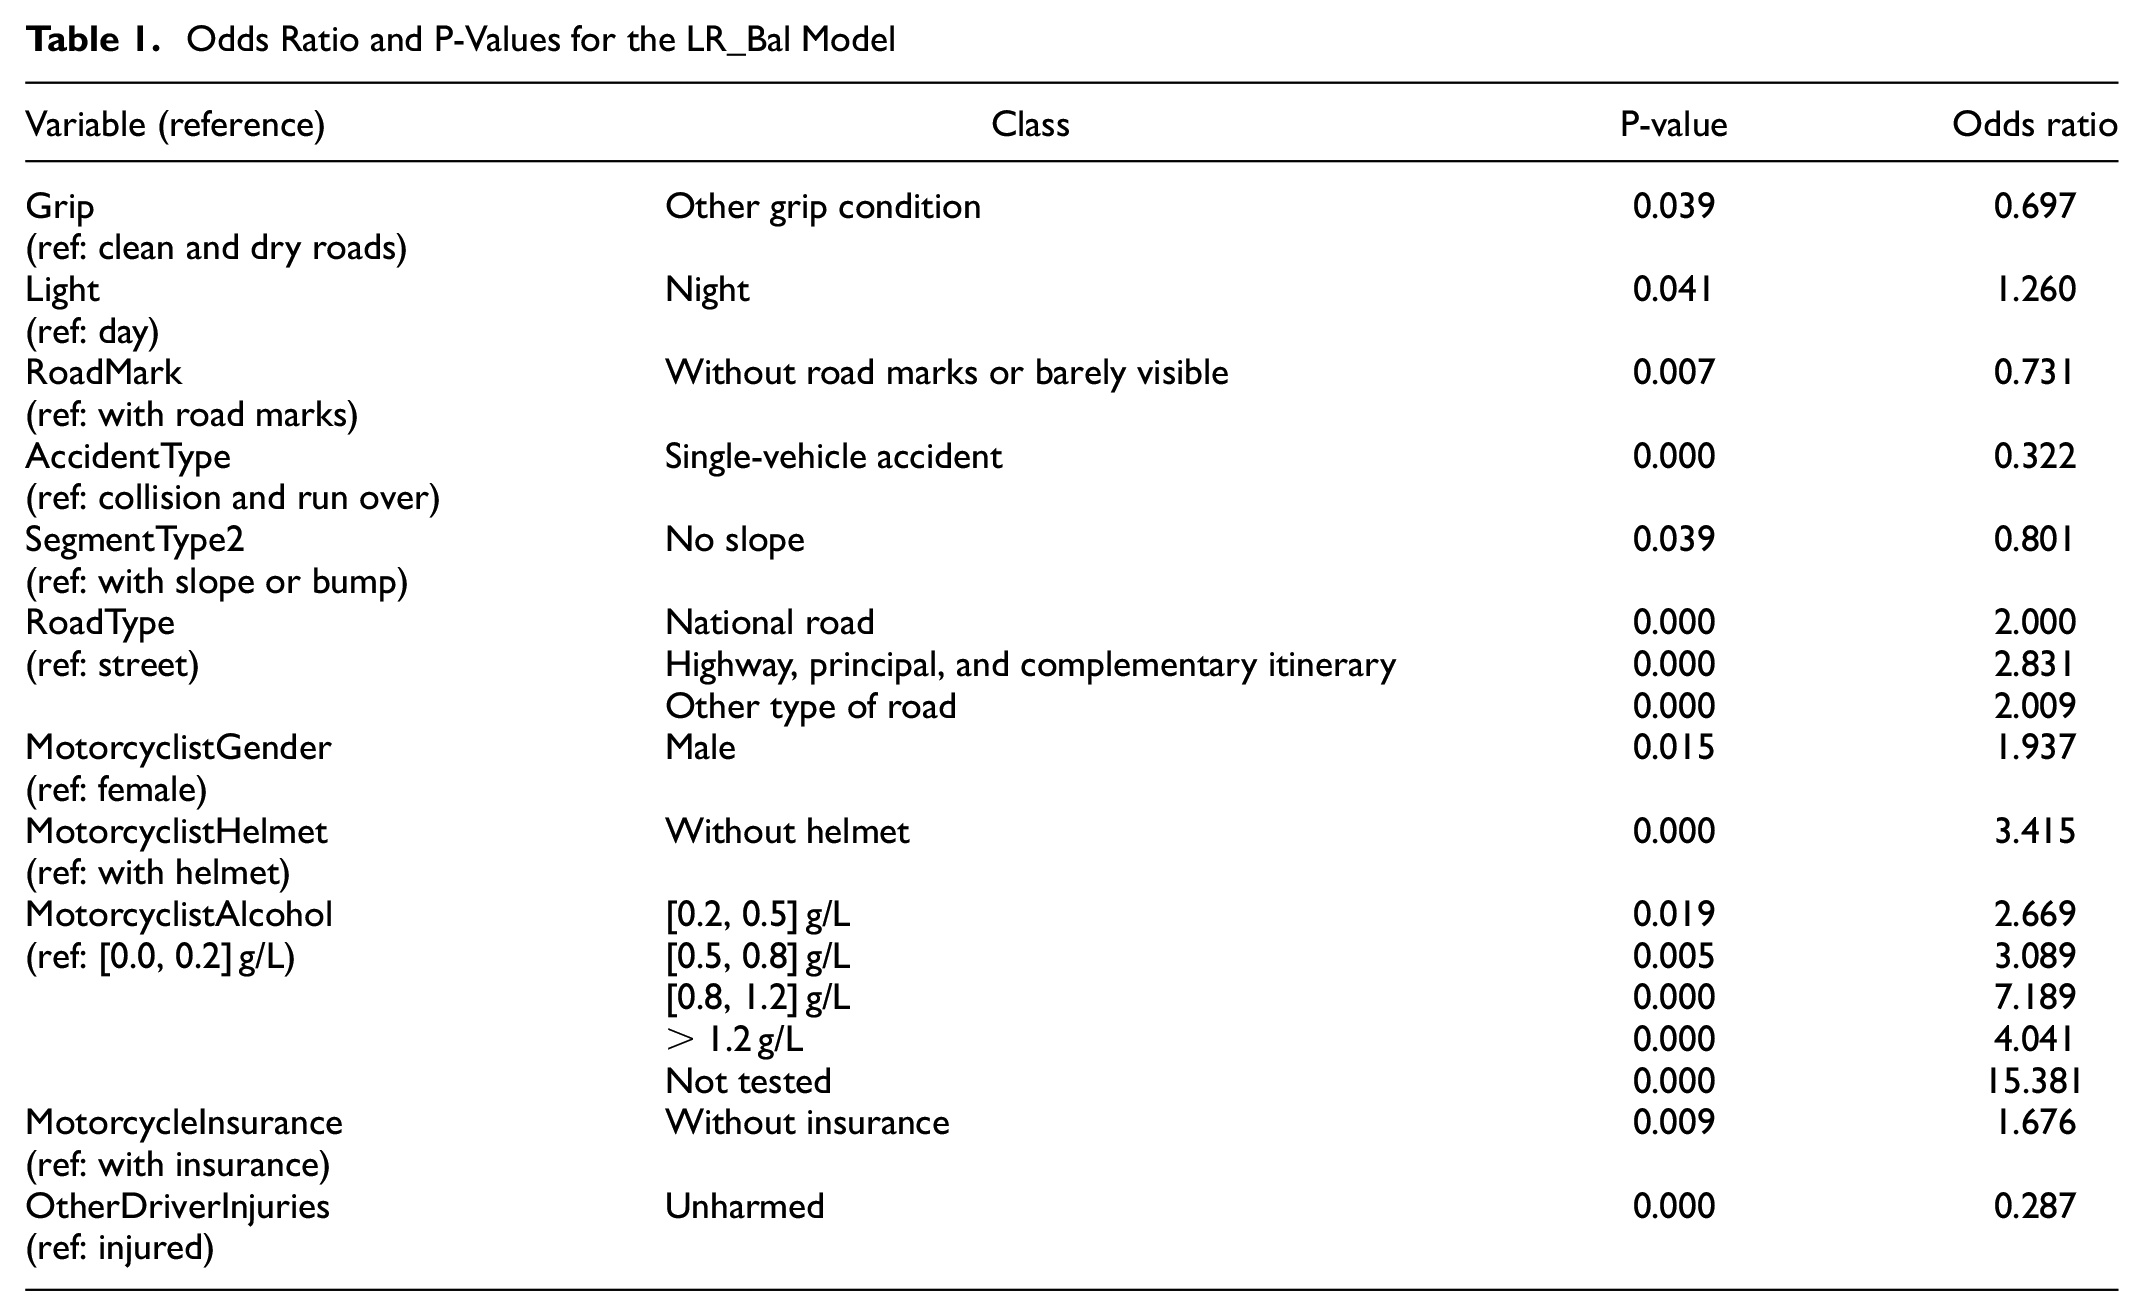
Considering the SHAP values for the RF_Bal model presented in Figure 5 and the results of the LR_Bal model presented in Table 1, the factors associated with the increase in the injuries of a motorcyclist involved in a road accident can be discussed.
Higher blood alcohol content (BAC) was related to a higher risk of fatality (in both models) or more severe injuries (just in the LR_Bal model) of the motorcyclist when involved in an accident. All BAC above the Portuguese legal limit (0.5 g/L) is associated with a higher risk, but a BAC between 0.2 g/L and 0.5 g/L (considered legal) was also associated with an increase in the risk of more severe injuries (more than 166% of the risk compared with the BAC under 0.2 g/L, according to the LR_Bal results). BAC between 0.8 g/L and 1.2 g/L was associated with the highest risk, followed by BAC over 1.2 g/L. All BAC above 0.2 g/L is alarming, as it is associated with at least a 166% increase in the risk of more severe injuries to the motorcyclist. Alcohol consumption was also related to more risk of severe injuries in other studies ( 4 , 10 , 46 ). A motorcyclist with a BAC higher than zero is more likely to be involved in a road accident, as alcohol consumption is related to risky behaviors and a decrease in some human capabilities ( 47 – 50 ).
Considering the type of road where an accident occurs, national roads, highways, principal, and complementary itineraries were associated with a higher risk of fatality or more severe injuries in both models. Compared with streets, roads where it is legal to ride at a higher speed were associated with higher risks of more severe injuries, as concluded also in Montella et al. ( 5 ). Rural areas were associated with more risk of fatalities or severe injuries when compared with urban areas (in the RF_Bal model) which was also concluded by other studies (4–6, 11). In rural areas, the speed limits are generally higher than in urban areas. High-speed riding is associated with an increased risk of accident occurrence and more severe injuries ( 34 , 51 , 52 ).
Through the RF_Bal model, it can be concluded that motorcycles older than 13 years old are associated with accidents with a higher risk of severe injuries. It was not found in other studies in the literature that evaluated the association of a motorcycle’s age to the risk of more severe injuries to the motorcyclist.
Compared with other regions or groups of regions of Portugal, Lisbon was associated with the lowest risk of more severe injuries in the results of the RF_Bal model. A similar result was obtained in Santos et al. ( 4 ).
Roads with road markings were associated with a higher risk of fatality in both models when compared with roads with no or barely visible road markings. To our knowledge, there were no other studies in the literature that examined the relationship between road marks and the risk of more severe motorcycle injuries.
When the driver of the other vehicle involved in an accident (if there is one) sustains injuries, there is a higher risk of more severe injuries to the motorcyclist (through the LR_Bal model). The RF_Bal model allows us to conclude that there is a lower risk of a motorcyclist’s fatality when the driver of the other vehicle involved is unharmed after the accident. The same result was observed by Santos et al. ( 4 ).
A clean and dry road, instead of other grip conditions, was associated with a higher risk of a motorcyclist’s fatality (RF_Bal) and more risk of severe injuries (LR_Bal). This conclusion is in line with the works in Santos et al., and Wahab and Jiang ( 4 , 35 ).
Accidents that occur in an intersection or crossroad, compared with accidents that occur outside an intersection, were associated with a greater risk of severe injuries to the motorcyclist when involved in an accident (result of the RF_Bal model). In Abrari et al., it is also concluded that motorcycle accidents that occur in T-intersections, stop or give-way intersections, and uncontrolled intersections are associated with more severe accidents ( 6 ).
The results of the RF_Bal model indicate that there is a higher risk of a fatality occurring in motorcycle accidents that happen at night rather than during the day. These accidents were related to a higher risk of more severe injuries in the LR_Bal model. The same result was concluded in previous studies ( 4 , 6 , 9 , 53 ).
The RF_Bal model results indicate that motorcycle accidents that occur on rest days (weekends and holidays) are related to a greater risk of occurrence of a fatality or a severe injury to the motorcyclist, as also concluded in other studies ( 4 , 6 , 7 ).
Compared with roads with no slope, motorcycle accidents that occur on roads with a slope or bump were associated with a greater risk of fatality (RF_Bal model result) and a greater risk of more severe injuries (LR_Bal model result). However, the RF_Bal model indicates that accidents that occur on roads with no slope are associated with a higher risk of occurring a severe injury. To our knowledge, no studies were found that evaluated the presence of slopes or bumps in the severity of a motorcyclist’s injuries.
The RF_Bal model indicates that motorcyclists without a proper driving license are associated with a higher risk of suffering a fatality when involved in an accident. Especially in the case of motorcyclists, more focus should be given to driving training, as riding a motorcycle without a proper license is related to a higher risk of fatality ( 54 ).
Both the RF_Bal and LR_Bal models indicate that a male motorcyclist (compared with a female rider) is associated with a greater risk of more severe injuries when involved in a road accident, which is consistent with other studies ( 4 , 5 , 10 ). Young and male riders are more likely to disobey traffic regulations ( 55 ). When it is a male, as a car driver, motorcyclist, cyclist, or pedestrian, mortality is greater ( 56 , 57 ). The RF_Bal model also indicates that, when the other vehicle driver (if there is one) is a male driver, there is also a higher risk of the motorcyclist’s fatality in case of an accident.
A motorcyclist who does not wear a helmet is associated with a higher risk of losing their life when involved in an accident (RF_Bal result). When compared with motorcyclists who wear a helmet, not wearing a helmet is associated with an increase of about 240% in the odds of giving a response that indicates higher levels of the injuries’ severity (LR_Bal results). Wearing a helmet is associated with a lower risk of suffering injuries in the area of the head and neck ( 9 , 58 , 59 ).
This risk analysis provides a necessary basis for the development of an appropriate and targeted sustainable prevention plan for improving road safety. However, not only the estimated risk factors should be used for this purpose, as other important aspects should also be analyzed, for example, traffic data and accident dynamics. Nevertheless, some suggestions can be made using only the determined risk factors. In most European countries, as in Portugal, the BAC limit is 0.5 g/L, with a lower limit 0.2 g/l for novice drivers and professional drivers. BAC legal limits should be revised, as it was seen before that all BAC above 0.2 g/L is alarming.
Accidents that happen in rural areas and in all road types excluding urban streets are associated with a higher risk of more severe injuries of a motorcyclist. These road types or rural areas have higher speed limits. Motorcyclists are more likely to say they enjoy riding fast and, in older motorcyclists, this behavior appears to be connected to daytime riding on rural roads ( 60 ). More speed control should be done by the authorities, especially since Portugal has one of the lowest traffic speeding tickets rates in Europe ( 61 ). This control should take into consideration the periods of the day (nighttime) as well as the locations associated to higher risks (intersections or crossroads). Wearing protective clothing can reduce the injuries of a motorcyclist, in particular abrasions and lacerations, in an accident and so motorcyclists should be alerted and enforced to use them ( 62 ). As mentioned before, more focus should be given to driving training for motorcyclists to be aware of all the risks they take as vulnerable road users ( 54 ).
Conclusion
Of all the developed models, the best performance was achieved with the RF and the LR developed with the balanced dataset. Although the RF, XGBoost, and GB models developed with the unbalanced dataset presented the highest weighted AUC values as well as the best overall performance among all the models, they presented a poor performance in classifying severe injuries (class 2) and fatalities (class 3). The RF and the LR models developed with the balanced dataset presented much better sensitivity values for classes 2 and 3 when compared with the unbalanced models. RF was one of the best-performing methods for both the unbalanced and balanced models, therefore being the best method for the purpose of this study. When conducting a study of this type, an RF and/or an LR model (considering a balanced dataset) are a good starting point.
The significant risk factors associated with the increase in the injuries of motorcyclists involved in accidents were identified. In a general sense, the results obtained confirm the results from previous studies. Risk factors associated with alcohol consumption, road type, road conditions, location, motorcycle age, gender of the rider, and when the accident occurs are related to the increase in the injury severity of a motorcyclist when involved in an accident. BAC above 0.2 g/L, roads with higher speed limits (national roads, highways, principal and complementary itineraries, and rural areas), older motorcycles (>13 years old), roads with road marks visible, the driver of the other vehicle injured (when there is one), clean and dry roads, intersections and crossroads, night light, rest days (weekends and holidays), motorcyclists without a proper driving license, male motorcyclists, other vehicle drivers being male, and not wearing a helmet were some of the determined risk factors.
Supplemental Material
sj-docx-1-trr-10.1177_03611981231172507 – Supplemental material for Analysis of Motorcycle Accident Injury Severity and Performance Comparison of Machine Learning Algorithms
Supplemental material, sj-docx-1-trr-10.1177_03611981231172507 for Analysis of Motorcycle Accident Injury Severity and Performance Comparison of Machine Learning Algorithms by Kenny Santos, Bernardo Firme, João P. Dias and Conceição Amado in Transportation Research Record
Footnotes
Author Contributions
The authors confirm contribution to the paper as follows: study conception and design: K. Santos, J. Dias, C. Amado; data collection: K. Santos, B. Firme, J. Dias, C. Amado; analysis and interpretation of results: K. Santos, B. Firme, C. Amado; draft manuscript preparation: K. Santos. All authors reviewed the results and approved the final version of the manuscript.
Declaration of Conflicting Interests
The author(s) declared no potential conflicts of interest with respect to the research, authorship, and/or publication of this article.
Funding
The author(s) disclosed receipt of the following financial support for the research, authorship, and/or publication of this article: This work was supported by the Fundação para a Ciência e a Tecnologia (FCT) PhD program through grant SFRH/BD/147260/2019. This work was also financed by national funds through FCT through IDMEC, under LAETA, project UIDB/50022/2020, and partially supported by National Funds through FCT and CEMAT, projects UIDB/04621/2020 and UIDP/04621/2020. The authors acknowledge the Portuguese Road Safety Authority (ANSR) for providing accident data.
Supplemental Material
Supplemental material for this article is available online.
References
Supplementary Material
Please find the following supplemental material available below.
For Open Access articles published under a Creative Commons License, all supplemental material carries the same license as the article it is associated with.
For non-Open Access articles published, all supplemental material carries a non-exclusive license, and permission requests for re-use of supplemental material or any part of supplemental material shall be sent directly to the copyright owner as specified in the copyright notice associated with the article.