
Abstract
Open-graded friction courses (OGFCs) are asphalt paving mixes with a higher number of interconnecting air voids to provide advantages with respect to improved drainage, increased dry/wet surface friction resistance, decreased splash and spray, and reduced aquaplaning. However, binder draindown has been a recurring issue during the manufacture, storage, transportation, and service life of OGFC mixtures. The addition of stabilizers in the form of fiber is often used with OGFC mixes to counteract the draindown. Increasing environmental awareness, the depletion of fossil resources, and the rise of global waste problems have necessitated the use of locally accessible natural fibers as an alternative to expensive synthetic fibers. In this study, the banana fiber obtained from the waste pseudo-stem of the banana plant post-harvesting and the sugarcane bagasse fiber obtained from the post-residual after sugar extraction is explored along with a commercial cellulose fiber to evaluate the draindown characteristics of OGFC mixtures. A cone penetration test and fiber absorption test was performed on the fiber-mixed asphalt binder. The draindown characteristics of 168 combinations of OGFC mixes were evaluated considering various parameters, viz. fiber parameters (types, lengths, dosages), binder dosage, binder types (unmodified binder and polymer-modified binder), and time period. Finally, a statistical analysis was conducted to determine the efficacy of different influencing factors. The best performance was exhibited by banana fiber, which had a dosage of 0.45% and a length of 9 mm, followed by sugarcane bagasse and cellulose fiber. All the input factors were found to be statistically significant.
Keywords
Asphalt paving mixtures comprised of a higher number of interconnecting air voids (usually more than 18%) to provide a porous/drainable surface course are typically known as open-graded friction courses (OGFCs). To achieve the necessary number of air voids or drainability/permeability, OGFC mixes have uniform aggregate gradations with 50%–60% of coarse aggregates of similar size. Furthermore, to ensure the required interconnecting air voids, OGFC mixes use a lower proportion of fine aggregates (passing 2.36 mm sieve and retaining 75 μm) and filler material (passing sieve size of 75 μm) ( 1 , 2 ). In comparison to traditional dense-graded asphalt mixes, a higher binder percentage is employed in OGFC mixtures to achieve a four to six-times thicker asphalt film for long-term durability and high moisture damage resistance ( 3 ). These mixes are designed to give a variety of advantages, including enhanced drainage during rainfall, higher wet surface friction resistance, decreased splash and spray, and minimized aquaplaning, as well as lower noise levels and improved night-time visibility of pavement surface marking, especially during rainfall ( 2 , 4 , 5 ). Despite the many advantages of OGFC mixes, there have been persistent challenges during construction and service life that have led to their inconsistent performance with respect to binder draindown, raveling, clogging, and moisture damage.
The unique combination of uniform aggregate gradation, lower filler content, and higher binder content in OGFC mixes led to the phenomenon of draindown. Draindown is defined as the downside propagation of asphalt binders under the influence of gravity during the production, transportation, construction, and service life of OGFC mixtures ( 1 ). Draindown results in an uneven distribution of binder in the mix, leaving certain areas prone to raveling and stripping because of relatively low asphalt percentages, while other areas may have a higher amount of binder that may result in flushed surfaces, causing lowered voids and permeability. In addition, the draindown will result in a thinner asphalt film over the aggregates, as a result, under conditions of moving traffic on the pavement surface, the thinner binder film thickness is insufficient to prevent the disintegration of aggregate particles ( 6 ). Furthermore, the thin binder covering ages more quickly after draindown since the open aggregate structure of the OGFC has more exposure to the environment (ultraviolet rays, high pavement surface temperature), thus aggravating the raveling distress ( 1 ).
The comparatively high binder concentration, a lower amount of finer aggregate, and the requirement to limit binder draindown in OGFC mixtures have necessitated the application of stabilizing additives. Typically, fibers (such as cellulosic, synthetic, and mineral) and modified binders (e.g., polymer and crumb rubber) are employed as stabilizers to control the draindown in asphalt mixtures, and commercially produced cellulose fibers (CLFs) are the most widely employed fiber in porous mixtures ( 4 , 7 ).
Nowadays, increased environmental consciousness, depletion of fossil fuels, expansion of global waste concerns, and the persistence of high crude oil prices have compelled the use of locally available natural/sustainable materials in asphalt mixes ( 8 ). Some studies have explored the possible use of natural fibers (from diverse sources) in different asphalt mixture types, including cellulose, sisal, jute, bamboo, kenaf, coir (coconut), date palm, and hemp ( 1 , 7–10). The utilization of natural fibers has shown appreciable improvement in the asphalt mixture performance with respect to improved durability (high raveling resistance), draindown control, and enhanced tensile strength ( 11 – 13 ). Some studies have also reported that an inadequate combination of fiber parameters (especially their dosage and length) may result in reduced contact between aggregates and may impart detrimental effects on the performance of asphalt mixtures ( 11 , 14 , 15 ). As a result, it is essential to comprehend the impact of components such as fiber parameters (length, content, and type), binder content, binder type, and time period (TP) on the draindown potential of OGFC mixes.
Very limited research has been done on the use of banana and sugarcane bagasse fibers (SBFs) in bituminous mixes, particularly in OGFC mixtures. The banana plant thrives in tropical regions and grows from a bulb or rhizome with a sowing to harvesting duration of 1 year ( 16 ). India ranks first among the top 10 leading banana-producing countries in the world with an annual production output of 30 million tonnes from an area of 0.90 million hectares, which accounts for 26% of the total global annual banana production of 115 million tonnes ( 17 ). Since the banana plant cannot be harvested after one cycle, it becomes waste biomass when the fruit is collected. It has been reported that about 200 tonnes of biomass waste (including the pseudo-stem, leaf, rhizome, rotten fruit, etc.) is generated from each hectare of banana farming in India ( 18 ). Globally, around 1.243 billion tonnes of banana waste are produced from a cultivated area of 5.71 million hectares ( 19 ). The pseudo-stem is the major part of biomass waste from the banana plant, which can be further processed by a decorticator machine to obtain banana fibers (BNFs). Moreover, India was the second largest sugarcane producer in 2020, with a production of 370 million tonnes per year and a total contribution of 20% of the world’s total sugarcane production of 1.87 billion tonnes ( 19 ). Further, India tops the chart of sugar production with a yield of 33 million metric tonnes of sugar, which is about 19% of the world’s total sugar production of 179 million metric tons ( 20 ). The fibrous residue left after the crushing operation during sugar production is called sugarcane bagasse. It has been reported that around 280 kg of sugarcane bagasse is generated for each tonne of sugarcane ( 21 ). The bagasse is the by-product produced during the juice or sugar extraction from the sugarcane stem or stalk.
Typically, these types of agro-wastes (banana pseudo-stem and sugarcane bagasse) are burnt or thrown into lakes, rivers, or open spaces, resulting in the production of hazardous greenhouse gases (GHGs), such as methane and carbon dioxide, thus escalating global warming concerns ( 22 ). Therefore, efficient waste management or reutilization must be addressed, particularly in a developing nation like India. The Intergovernmental Panel on Climatic Change (IPCC) has stated that over one-fourth of the total crop residues/agro-waste are burnt on farms in India. Among different crop residues, rice contributes 43%, followed by wheat at 21% and sugarcane at 19% ( 23 ). Also, the majority of crop residue or agro-waste (a share of about 80%) was burnt during the post-harvesting season, creating an anthropogenic effect on the environment and human health ( 24 ). One of the most sustainable approaches to waste management is the reutilization of these wastes to create value-added products. Recently, the use of plant fibers has been considered to be an eco-friendly source of fiber, and their importance has been emphasized globally ( 22 , 25 ). Banana and sugarcane bagasse fibers are eco-friendly and include useful qualities, notably low density, light weight, high tensile strength, resistance to water and fire, and so on. Therefore, there is a higher potential for this waste to be used for numerous purposes, including in construction and building materials ( 21 , 25 ).
The research plan of the study is illustrated with a schematic flow chart in Figure 1. This research explored the use of natural fibers, namely BNF and SBF, as potential stabilizing agents in OGFC mixes. One commercial stabilizing additive called CLF was also used in this study for comparison purposes. This study investigated the influence of the fiber type (FT), fiber dosage (FD), fiber length (FL), binder dosage (BD), time period (TP), and binder type on the draindown pattern of OGFC mixes at various asphalt binder concentrations. The details of the FDs, FLs, BDs, TPs, and binder types selected in this study are detailed in the next section. All of the OGFC mixture constituents, such as aggregates, binders, and fibers, were characterized for their physical properties to check for their suitability to be used in asphalt mixtures. Both BNFs and SBFs were analyzed for their surface morphology using scanning electron microscopy (SEM). Thereafter, a cone penetration test (CPT) and fiber absorption test were performed on the fiber-mixed asphalt binders (FMABs) to assess their mechanical strength and binder absorption. Further, the draindown characteristics of loose OGFC mixes were evaluated at multiple scales of influencing factors. Further, a statistical analysis was performed to determine the impact and/or relevance of the considered factors on the draindown characteristics of the OGFC mixes.
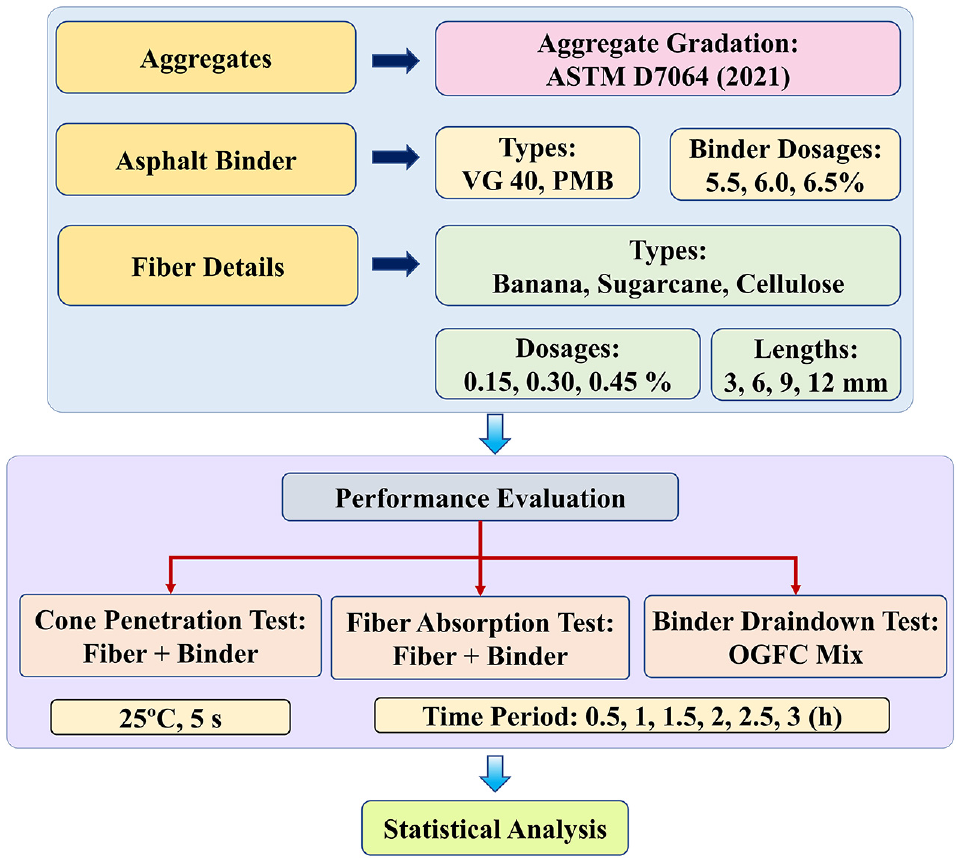
Research program of the study.
Materials and Methodology
Materials
Aggregates
The stone aggregate used in this study was procured from a local stone quarry and was tested for the physical and mechanical properties of the aggregates (presented in Table 1). Figure 2 illustrates the aggregate gradation used for the production of OGFC mixes, which corresponds to the nominal maximum aggregate size (NMAS) of 12.5 mm in accordance with ASTM D7064 ( 26 ).
Physical Properties of Selected Aggregates
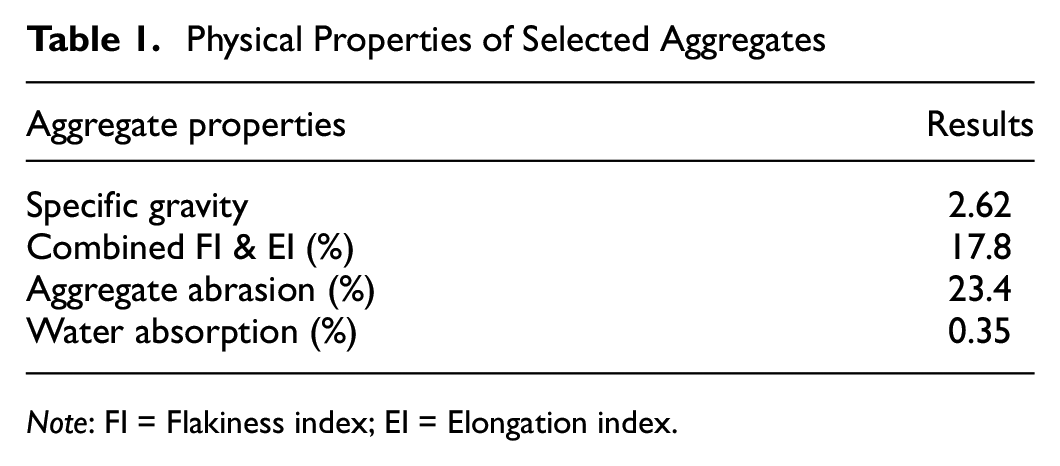
Note: FI = Flakiness index; EI = Elongation index.
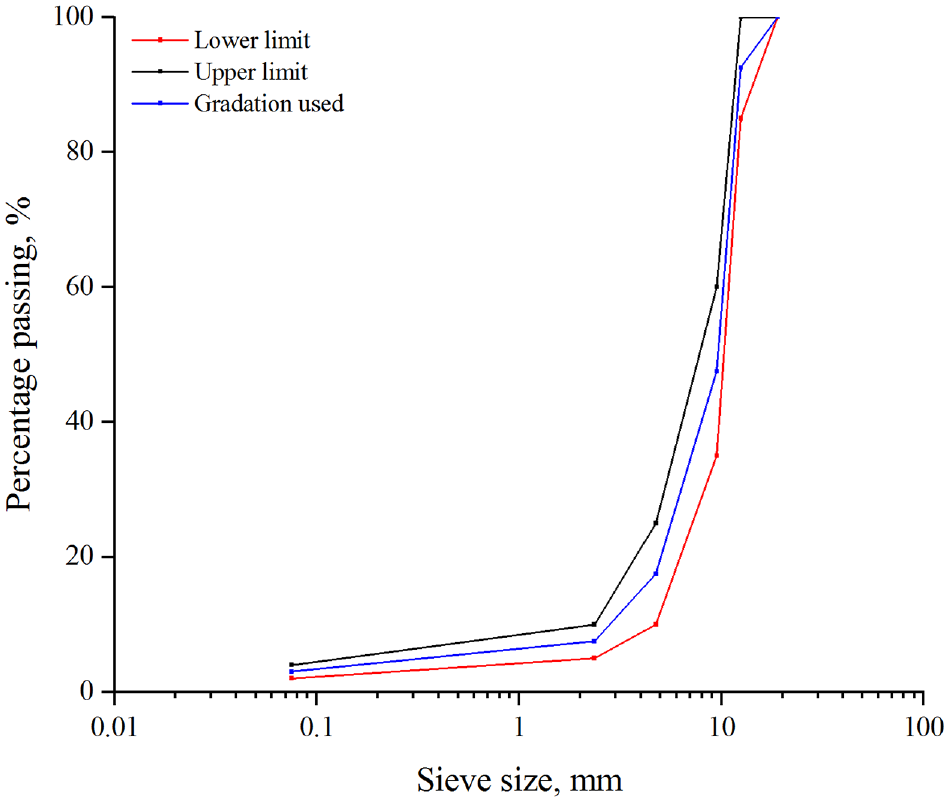
Selected aggregate gradation of the open-graded friction course.
Asphalt Binders
A conventional stiffer neat asphalt binder of viscosity grade 40 (VG 40) and a commercial polymer-modified bitumen (PMB) of grade PG 76-10 were employed in this study. These were procured from Tiki Tar and Shell India Pvt Ltd, India, and met all the specifications outlined in IS 73 ( 27 ) and IS 15462 ( 28 ), respectively. The results for both VG 40 and PMB binders are shown in Table 2.
Physical Properties of Asphalt Binders Used in the Study
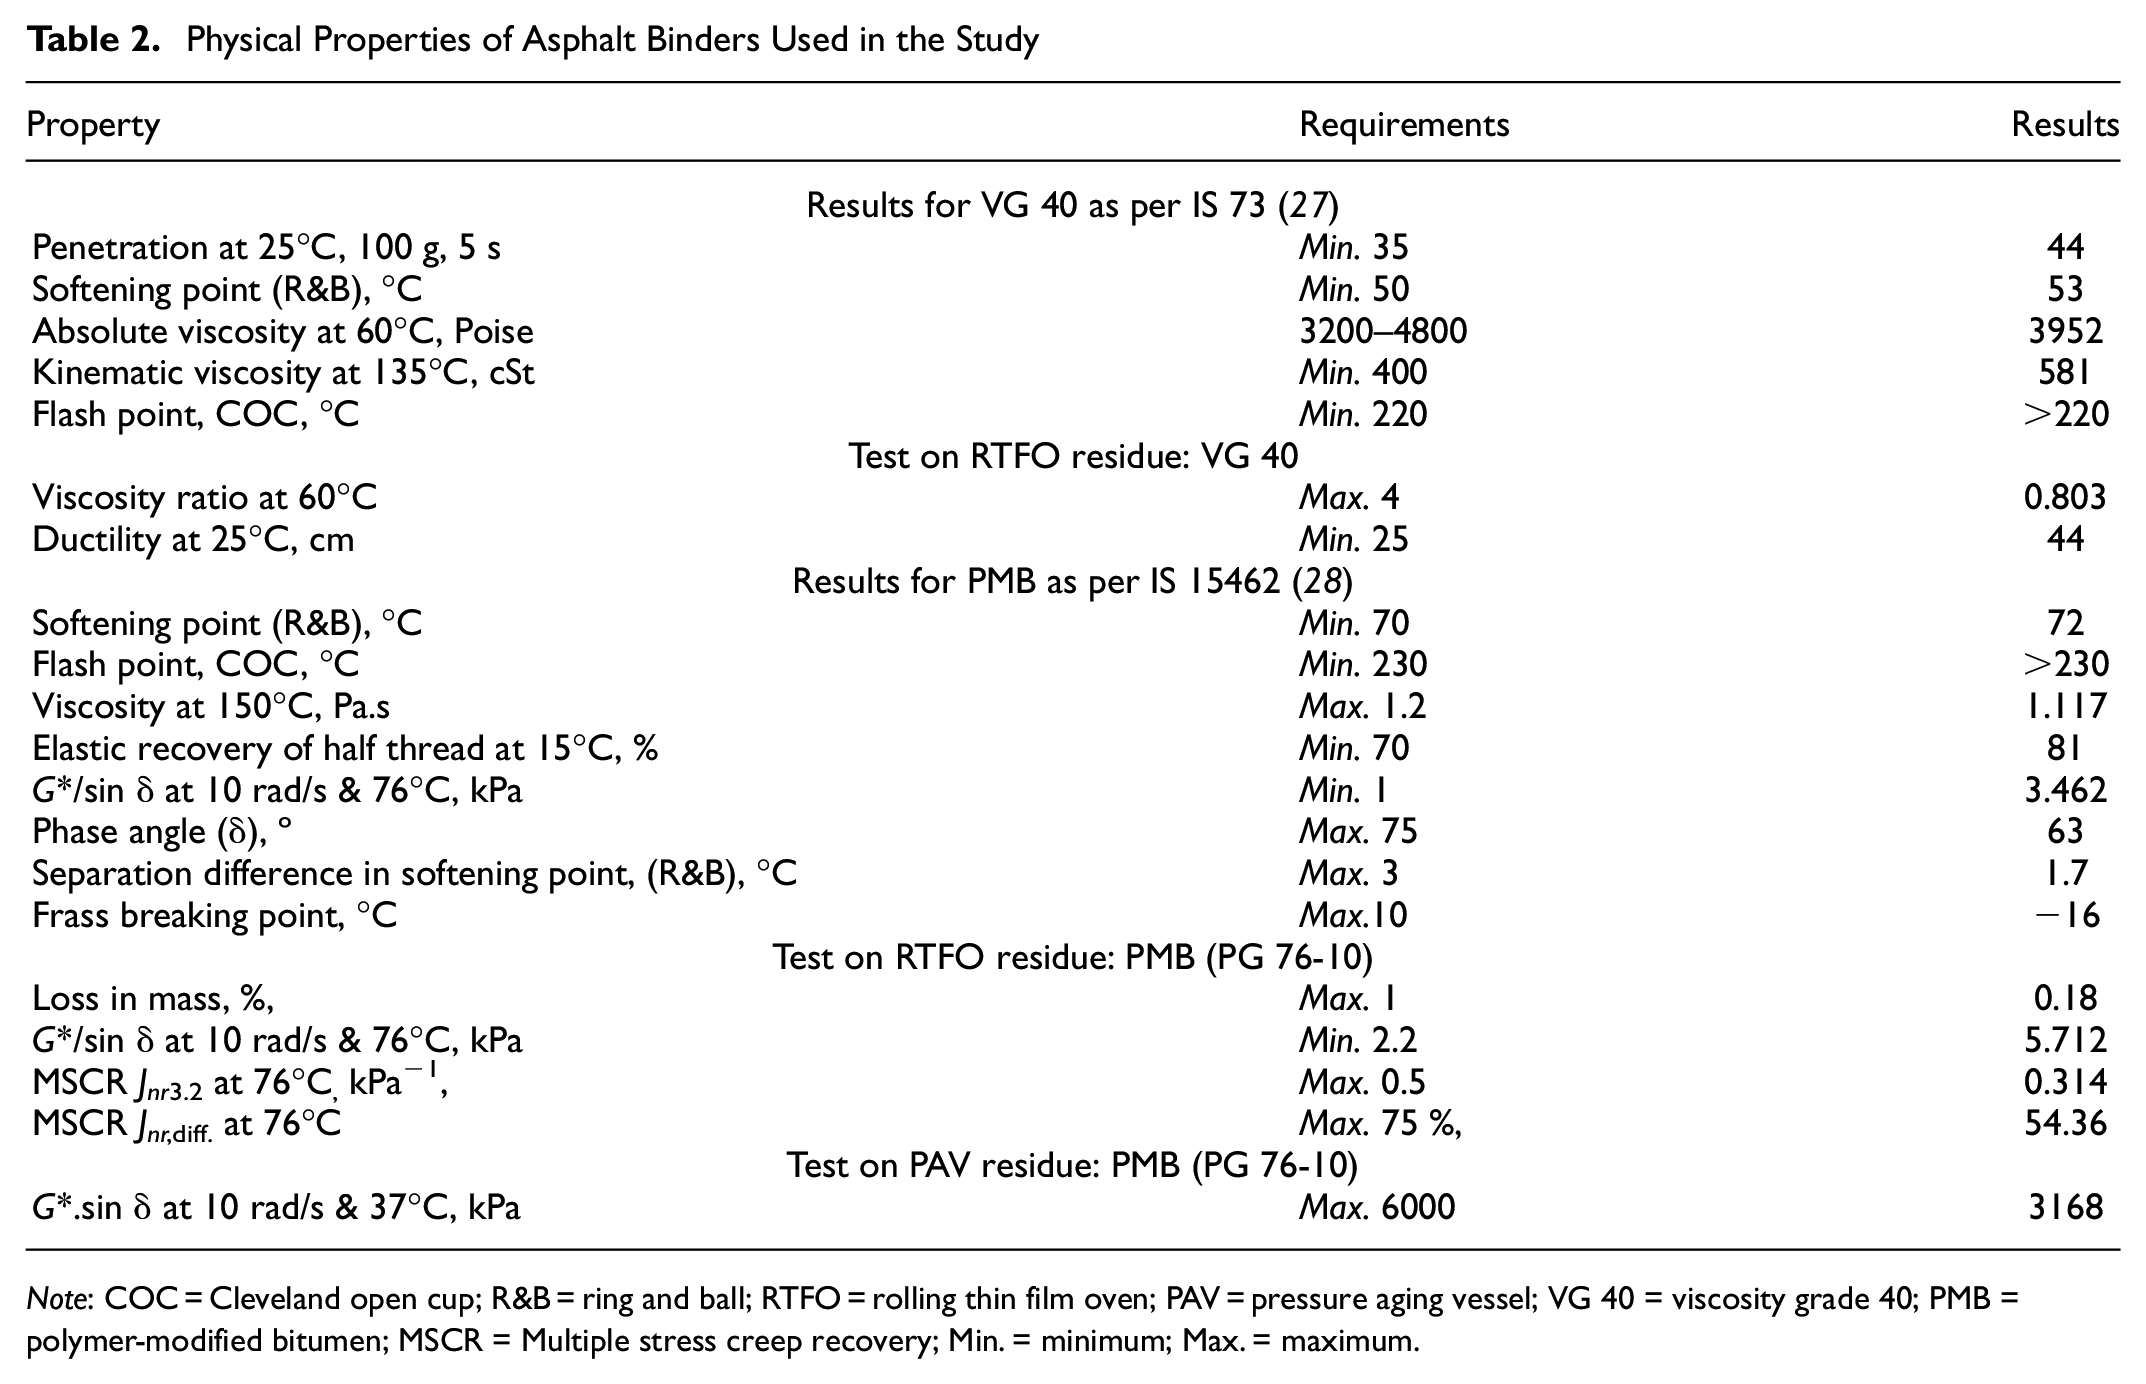
Note: COC = Cleveland open cup; R&B = ring and ball; RTFO = rolling thin film oven; PAV = pressure aging vessel; VG 40 = viscosity grade 40; PMB = polymer-modified bitumen; MSCR = Multiple stress creep recovery; Min. = minimum; Max. = maximum.
Fibers as Stabilizing Additives
Three different types of fibers were used in this study, namely, conventionally used CLF, waste derived BNF, and SBF. Organo Chemical Industries (Mumbai, India) provided the CLF in pelletized form (fiber content: ∼98%, bulk density: 0.42–0.49 g/cm3), while BNFs and SBFs were obtained from GoGreen Products (Chennai, India). Table 3 shows the properties of BNF and SBF natural fibers (provided by the supplier) used in this study as stabilizing additives in OGFC mixes. The diameter of the BNF was larger than that of the SBF, while the SBF had a higher density than that of the BNF. With respect to chemical composition, the cellulose content was much higher in the BNF than in the SBF, whereas the lignin percentage was higher in the SBF than in the BNF. Fibrous material with a lower cellulose percentage and higher lignin content exhibits higher rigidness ( 7 ). SEM images of BNFs and SBFs at 2.0kx magnification are presented in Figure 3. The SEM micrograph shows that the BNF has a greater porous surface than the SBF, and the hollow pores known as lumen in the BNF are elliptical in form, but the lumen in the SBF is irregular in shape; nonetheless, the lumen walls in the SBF are smoother than in the BNF. Furthermore, the lumen diameter of the BNF is larger than that of the SBF. This study utilized a combination of four different FLs (3, 6, 9, and 12 mm) and three FDs (0.15%, 0.30%, and 0.45% by weight of dry aggregate). Figure 4 shows the visual appearance of different sizes of BNFs, SBFs, and CLFs used in the study.
Properties of Natural Fibers
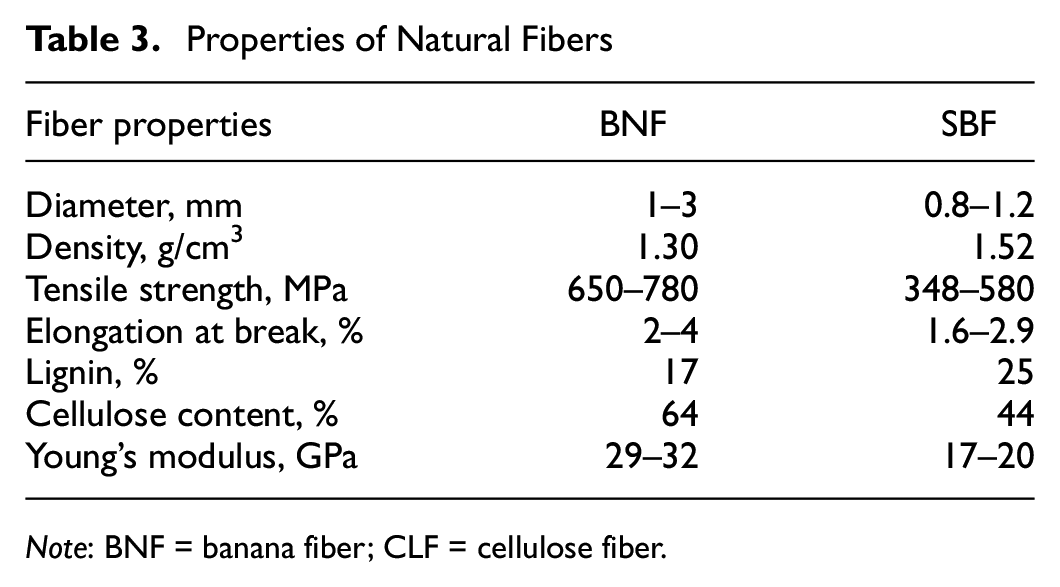
Note: BNF = banana fiber; CLF = cellulose fiber.
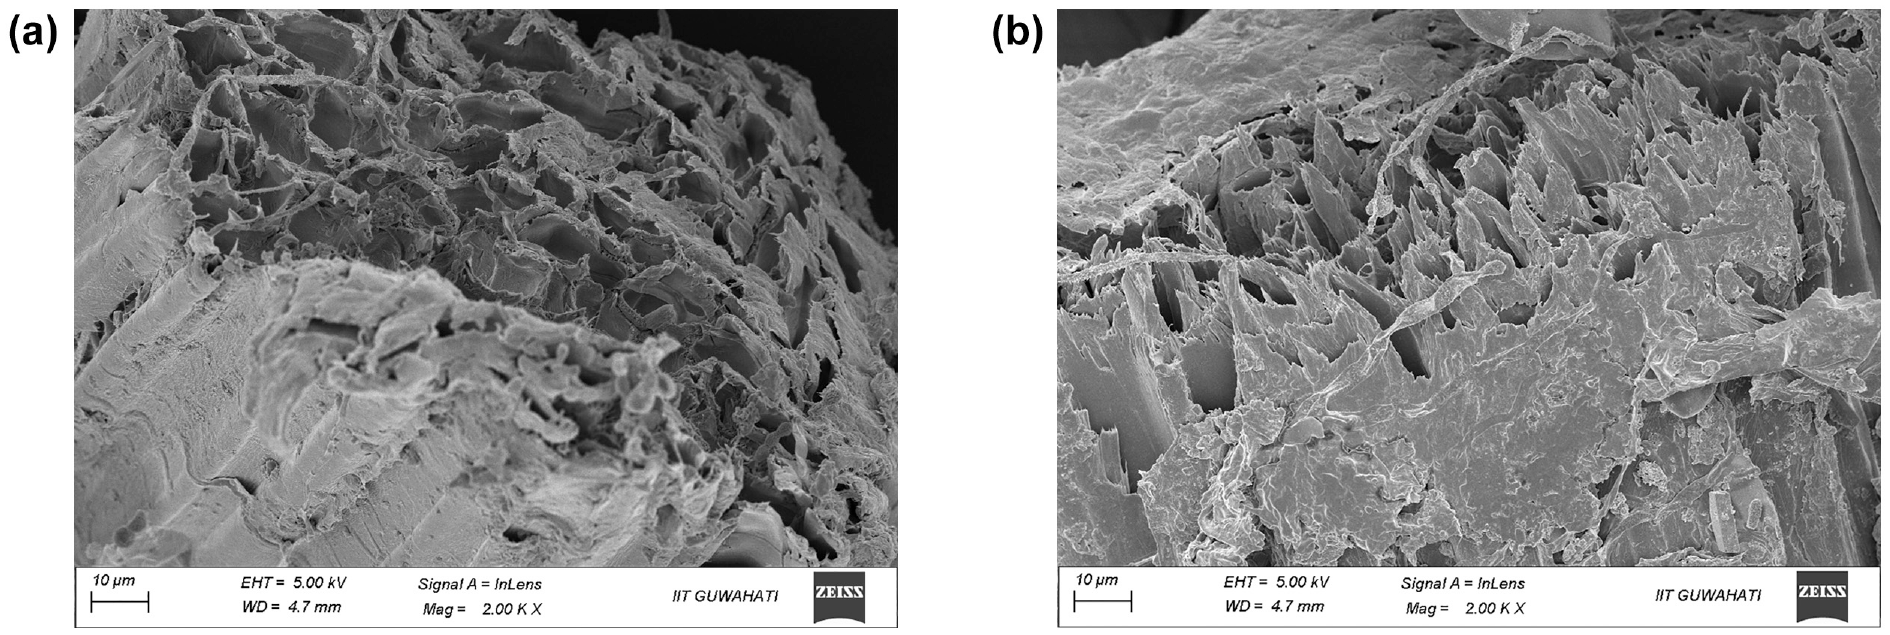
Scanning electron microscopy image of fibers (a) banana fiber and (b) sugarcane bagasse fiber.
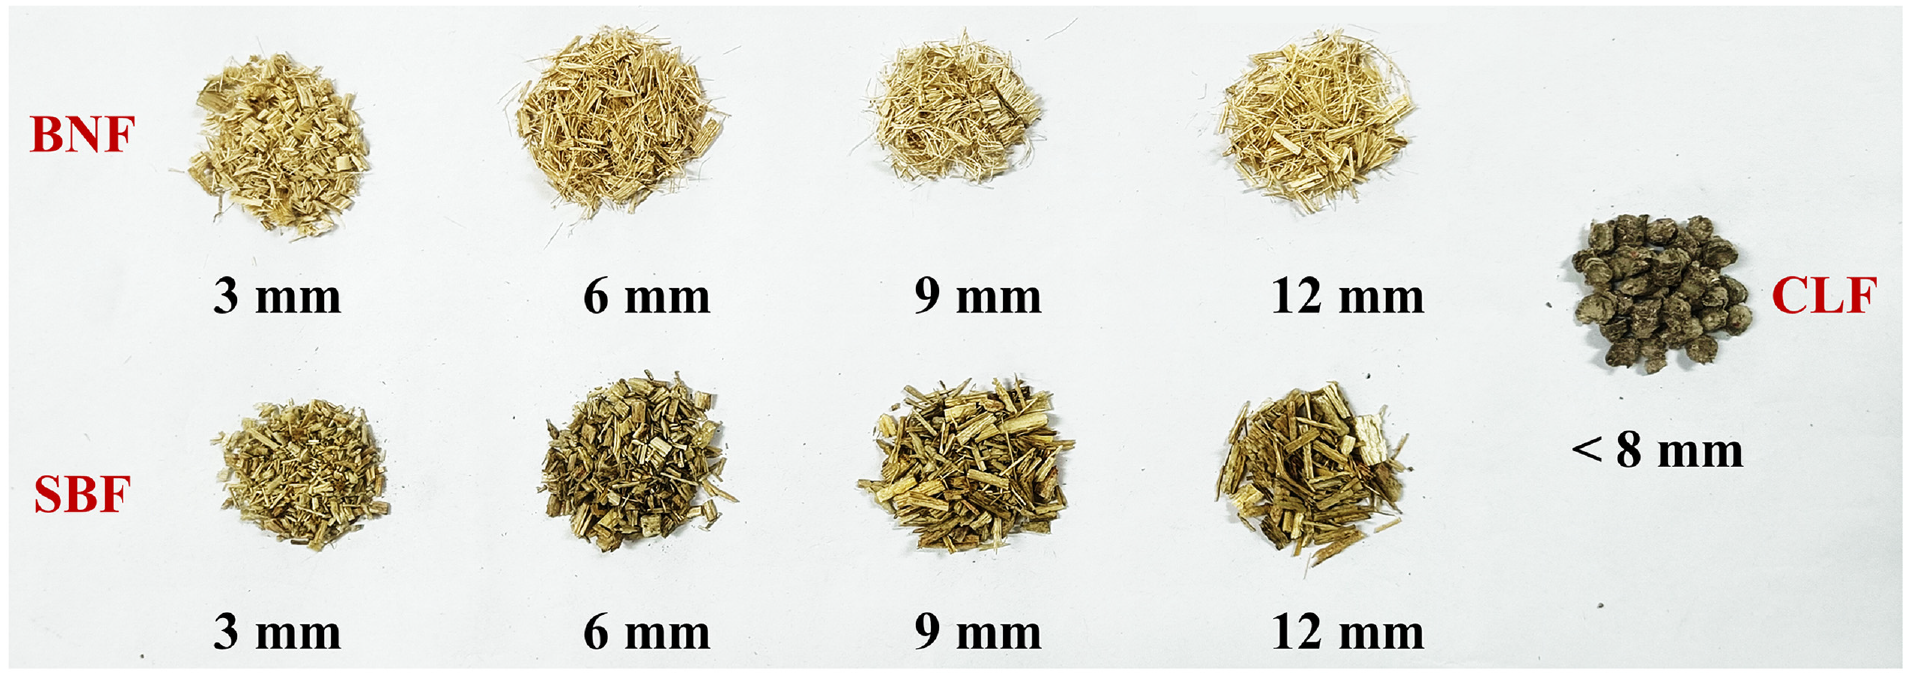
Visual appearance of banana fibers (BNFs), sugarcane bagasse fibers (SBFs), and cellulose fibers (CLFs).
Selection of Binder and Fiber Parameters
In this study, the BNF obtained from the waste pseudo-stem of the banana plant post-harvesting and the SBF obtained from the post-residual after sugar extraction are explored along with a commercial CLF to evaluate the draindown characteristics of OGFC mixtures. Four different FLs (3, 6, 9, and 12 mm) and three different dosages (0.15%, 0.30%, and 0.45% by weight of dry aggregate) were used in this study for the fabrication of OGFC mixes with two binder types (VG 40 and PMB 40) at three variable BDs (5.5%, 6.0%, and 6.5%). The rationale for the selection of the BDs, FDs, and FL is discussed below.
Binder Dosages
Clause 7.1 of standard ASTM D7064 ( 26 ) suggests to take 6.0% and 6.5% as typical trial BDs by mix weight and clause 12.1 suggests to use at least three asphalt contents in increments of 0.5% with the selected aggregate grading during the mix design of OGFC mixes. Therefore, the variable BDs of 5.5%, 6.0%, and 6.5% were selected to see the effect of BDs on the draindown characteristics of OGFC mixes fabricated with VG 40 and PMB 40 (PG76-10) binder and incorporating CLFs, BNFs, and SBFs.
Fiber Dosages
Clause 6.1.4 of ASTM D7064 (26) states “Typically, a fiber dosage rate of 0.3% by mixture mass (or weight of total mix) is used but the draindown target of 0.3% maximum should be the acceptance guideline for the dosage rate of the fiber stabilized additive” and clause 12.8 states “Fiber stabilizers are typically incorporated into the mix at a rate of 0.2 to 0.5% of the total mix mass.” Therefore, the variables FDs of 0.15%, 0.30%, and 0.45% were selected for the fabrication of OGFC mixes in this study.
Fiber Lengths
The use of longer lengths of fiber along with higher dosages within the OGFC mix skeleton may sometimes lead to the formation of lumps to induce the “balling effect,” which imparts a detrimental impact on the mix performance ( 11 , 16 , 34 ). Although ASTM D7064 ( 26 ) does not provide any details on the FL, IRC 129 ( 29 ) suggests to use a FL of around 8 mm. Therefore, the variable FLs of 3, 6, 9, and 12 mm were selected to evaluate the effect of incorporating BNFs and SBFs in OGFC mixes with variable BDs and binder types.
OGFC Mix Preparation
For the fabrication of loose OGFC mixtures to perform the draindown test, firstly, the required quantity of preheated aggregates batched according to the selected gradation was placed in a mixing bowl, followed by the addition of the requisite amount of fiber with the dry method in which fibers were uniformly spread over the aggregates and then mixed well with heated aggregates before the addition of the heated asphalt binder. The asphalt binders were heated to their mixing temperatures, 160°C for VG 40 and 180°C for PMB, and the required amount of binder corresponding to the BDs (5.5%, 6.0%, and 6.5% by mix weight) was added, and the aggregate–fiber–asphalt blend was mixed thoroughly at the mixing temperatures to obtain a homogeneous mixture. A total of 144 distinct combinations of uncompacted OGFC mixes were fabricated for variable components of fiber and binders. Two binder types (VG 40 and PMB), three BDs (5.5%, 6.0%, and 6.5% by weight of mix), four FLs (3, 6, 9, and 12 mm), two FTs (BNF and SBF) and three FDs (0.15%, 0.30%, and 0.45% by weight of dry aggregate) were used during the preparation of the OGFC mixes. Moreover, at the three BDs of VG 40 and PMB, six control mixes without any fiber component and 18 mixes with CLF at three FDs were also prepared as a baseline for comparison. Therefore, OGFC mixes were fabricated for a total of 168 combinations (144 for BNF and SBF + 18 for CLF + 6 without fiber = 168), and three replicates for each category of OGFC mixes were made for the loose mix draindown in accordance with ASTM D6390 ( 30 ). The detailed procedure for the draindown test is described in the subsequent section.
Test Methodology
Cone Penetration Test
The CPT of fiber-mixed asphalt is also conducted in this study to assess the shear and flow resistance of FMABs in the form of the cone sink depth (CSD) and shear stress. In this test, fibers at their adequate dosages (0.15%, 0.3%, and 0.45% by weight of asphalt binder) and lengths (3, 6, 9, and 12 mm) were oven-dried for 24 h at 105°C and were homogeneously mixed with 60 g of asphalt binder (corresponding to 6% BD by the total asphalt mixture weight), heated at 160°C and 180°C, respectively, for VG 40 and PMB binders, and the mixture was blended using a stirrer operating at 500 revolutions per minute (rpm) to prepare the FMAB. Thereafter, the hot FMAB sample poured into the testing mold was kept at ambient temperature for 1 h to cool down and then placed in a water bath tank for the next 2 h at 25°C for conditioning. The mold containing the sample was removed from the water bath after the completion of the conditioning period and carefully kept under the cone of the cone penetrometer device (Figure 5a). The cone weighing 102 g was allowed to penetrate the FMAB specimen in the mold for 5 s, and the CSD in mm was recorded to compute the shear stress in kPa.
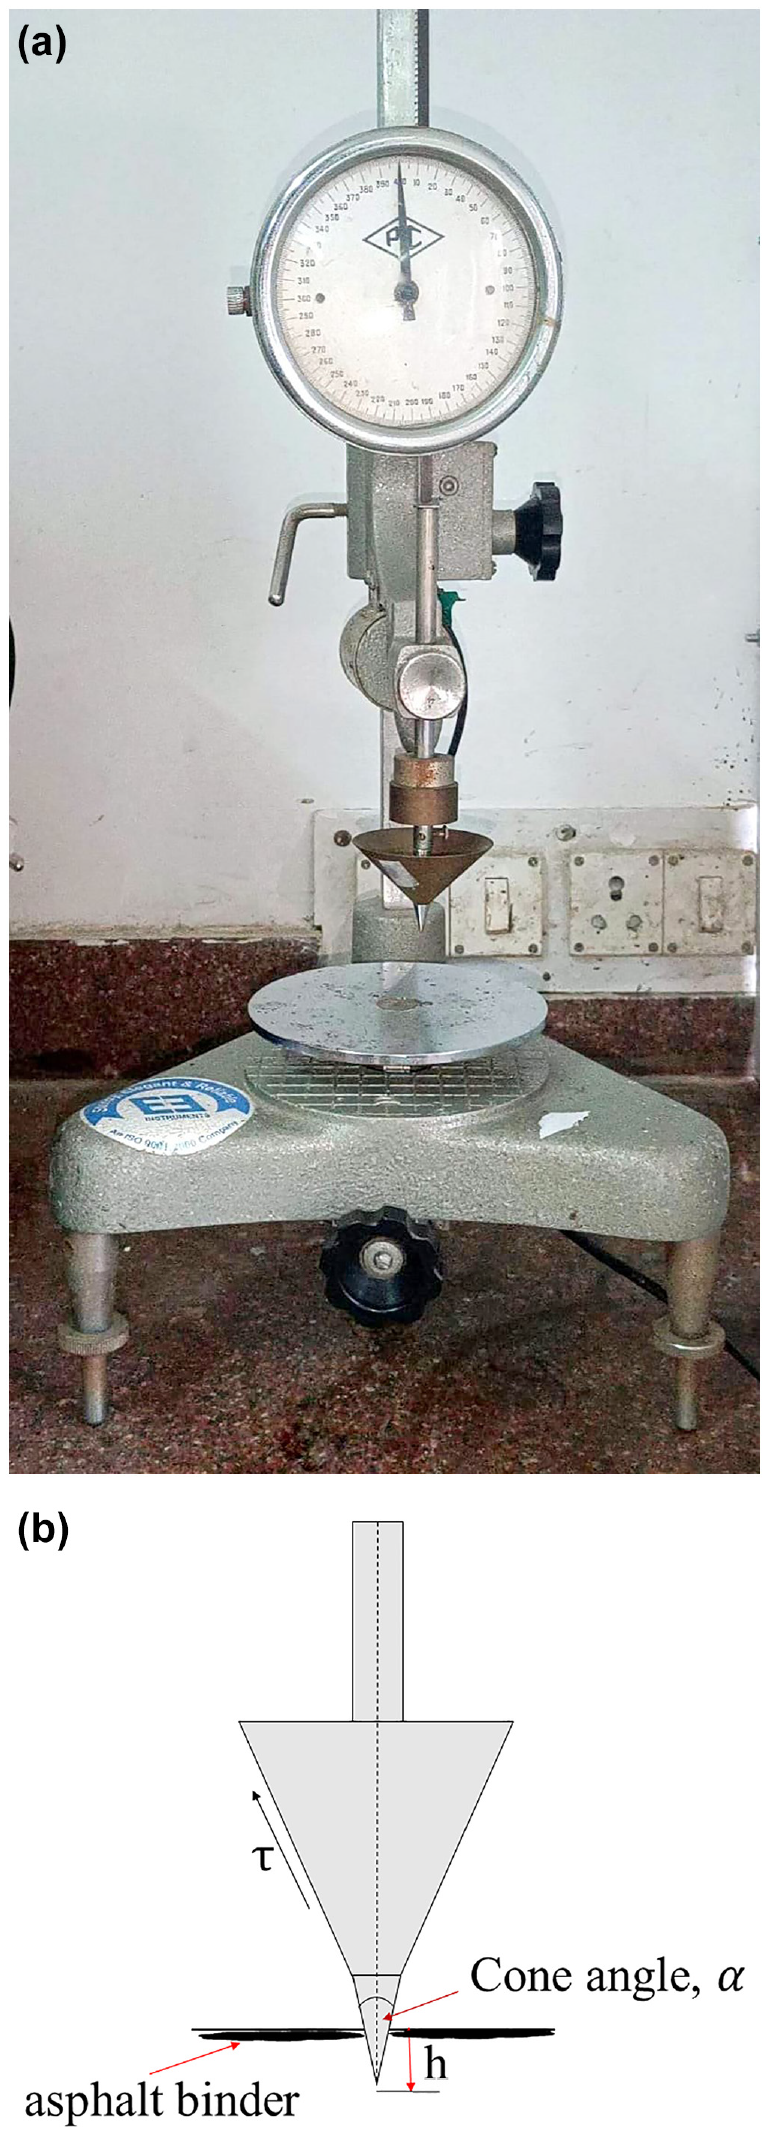
Cone penetration test: (a) instrument and (b) schematic of the shear stress in the cone.
As shown in Figure 5b, based on the force balance concept, the shear stress of the FMAB sample was measured in the tangential direction of the cone’s surface. Equation 1 ( 31 , 32 ) was used to compute the shear stress:

where Q is the weight of the cone, g; h is the CSD, dmm;
Fiber Absorption Test
The fiber absorption capacity is also an important aspect of the stability of the FMAB and its resistance to draindown in the loose asphalt mixture. In this study, the fiber absorption test was performed to analyze the effect of different FLs on the absorption potential of fiber ( 31 , 32 ). The FMAB for this test was prepared at a single FD by adding 3 g of fiber (corresponding to 0.3% FD) with heated asphalt. The preparation protocols for the FMAB remained the same as that mentioned in the previous section for the CPT. The fiber absorption test was carried out by placing a sample of the FMAB on a steel mesh with a size of 250 μm and allowing it remain at room temperature (25°C) for 1 h. Thereafter, the sieve and basket assembly were transferred to an oven. The test was conducted at 160°C for VG 40 and 180°C for PMB binders, corresponding to their mixing temperatures. The schematic employed for the fiber absorption test in the study is illustrated in Figure 6. Equation 2 was used to determine the percentage mass loss at 0.5 h (30 min) intervals for 3 h to evaluate the absorption capacity of the fibers:

where ΔM is the mass loss, %; Mt is the mass loss measured at 0.5 h intervals, from t = 0.5 h to 3 h; and Mi is the initial mass of the FMAB sample
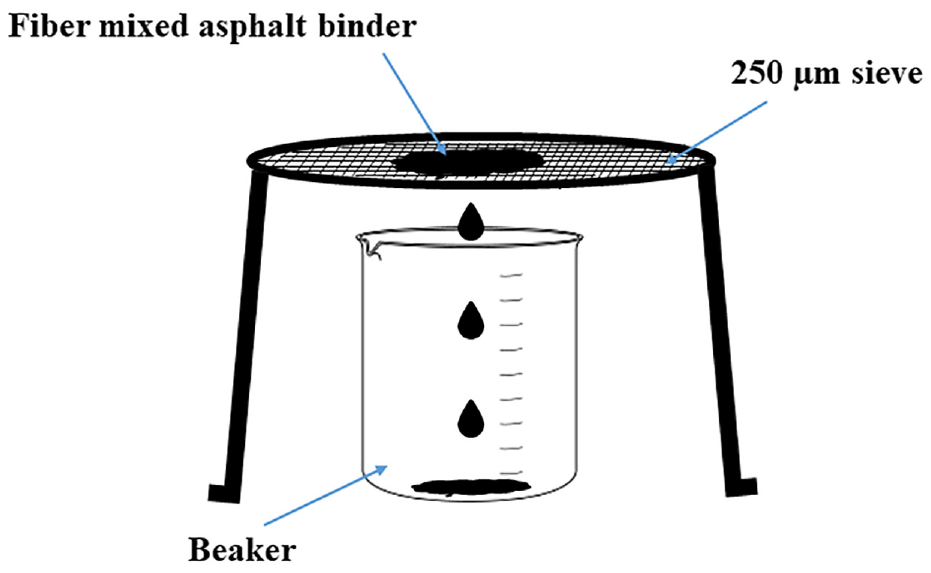
Schematic for the fiber absorption test.
Binder Draindown
The draindown test on the loose OGFC mix was performed in accordance with ASTM D6390 ( 30 ). To conduct the test, firstly, the empty weight of the basket with 6.3 mm mesh size was recorded as A (g), and then the prepared loose OGFC mix was transferred to the basket and the combined weight of the loose mix and the basket was noted as B (g). Thereafter, a plate with a weight of C (g) was placed under the mesh basket to collect the asphalt binder and mastic dripping from the basket openings during the thermal conditioning in an oven at 15°C higher than the mixing temperature. The test temperature was 175°C and 195°C for the VG 40 and PMB binders, respectively. The weight of the drained material, along with the plate, was marked as D (g). ASTM D7064 ( 26 ) stipulates a maximum limit of 0.3% draindown for the mix design of OGFC mixes. In addition to the conventional time of 1 h, the draindown is computed as a percentage at regular intervals from 0.5 for 3 h using Equation 3:

Results and Discussion
Cone Penetration Test
Figures 7 and 8 present the results for the CSD and shear stress of the FMAB, respectively, obtained from the CPT test. As shown in Equation 1, the CSD and shear stress are inversely proportional to each other, and this relationship is confirmed by the opposite trends observed in Figures 7 and 8 between the CSD and the shear stress at each FD and length for each FT. The CSD values for the FMAB prepared with both VG 40 and PMB binders were remarkably lower, while the shear stress was higher when compared with the control binder. The CSD decreased and shear stress increased with increments in the FDs and FLs for each FT. The CSD values (Figure 7b) for the FMAB with PMB were lower, and shear stress (Figure 8b) was higher than that observed for the FMAB with the VG 40 binder in Figures 7a and 8a, respectively. The BNF outperformed the SBF and CLF when accounting for the influence of FT on the CSD and shear stress, demonstrating that the BNF had the strongest resistance against binder deformation.
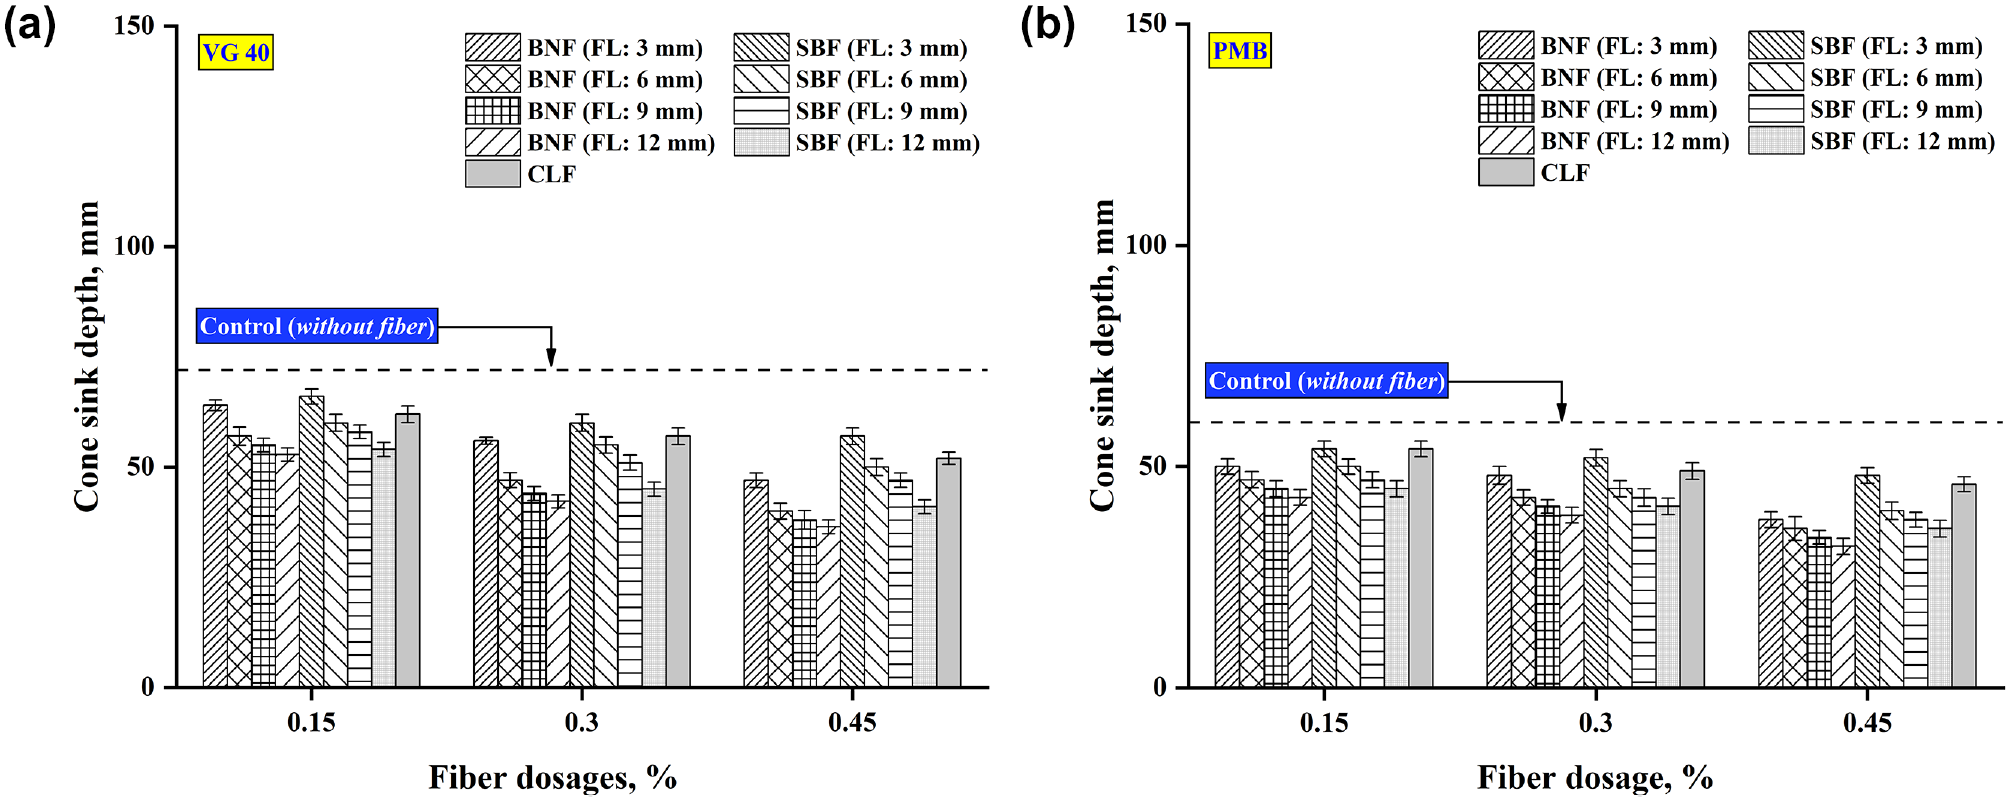
Cone sink depth results for the fiber-mixed asphalt binder with (a) viscosity grade 40 (VG 40) and (b) polymer-modified bitumen (PMB).
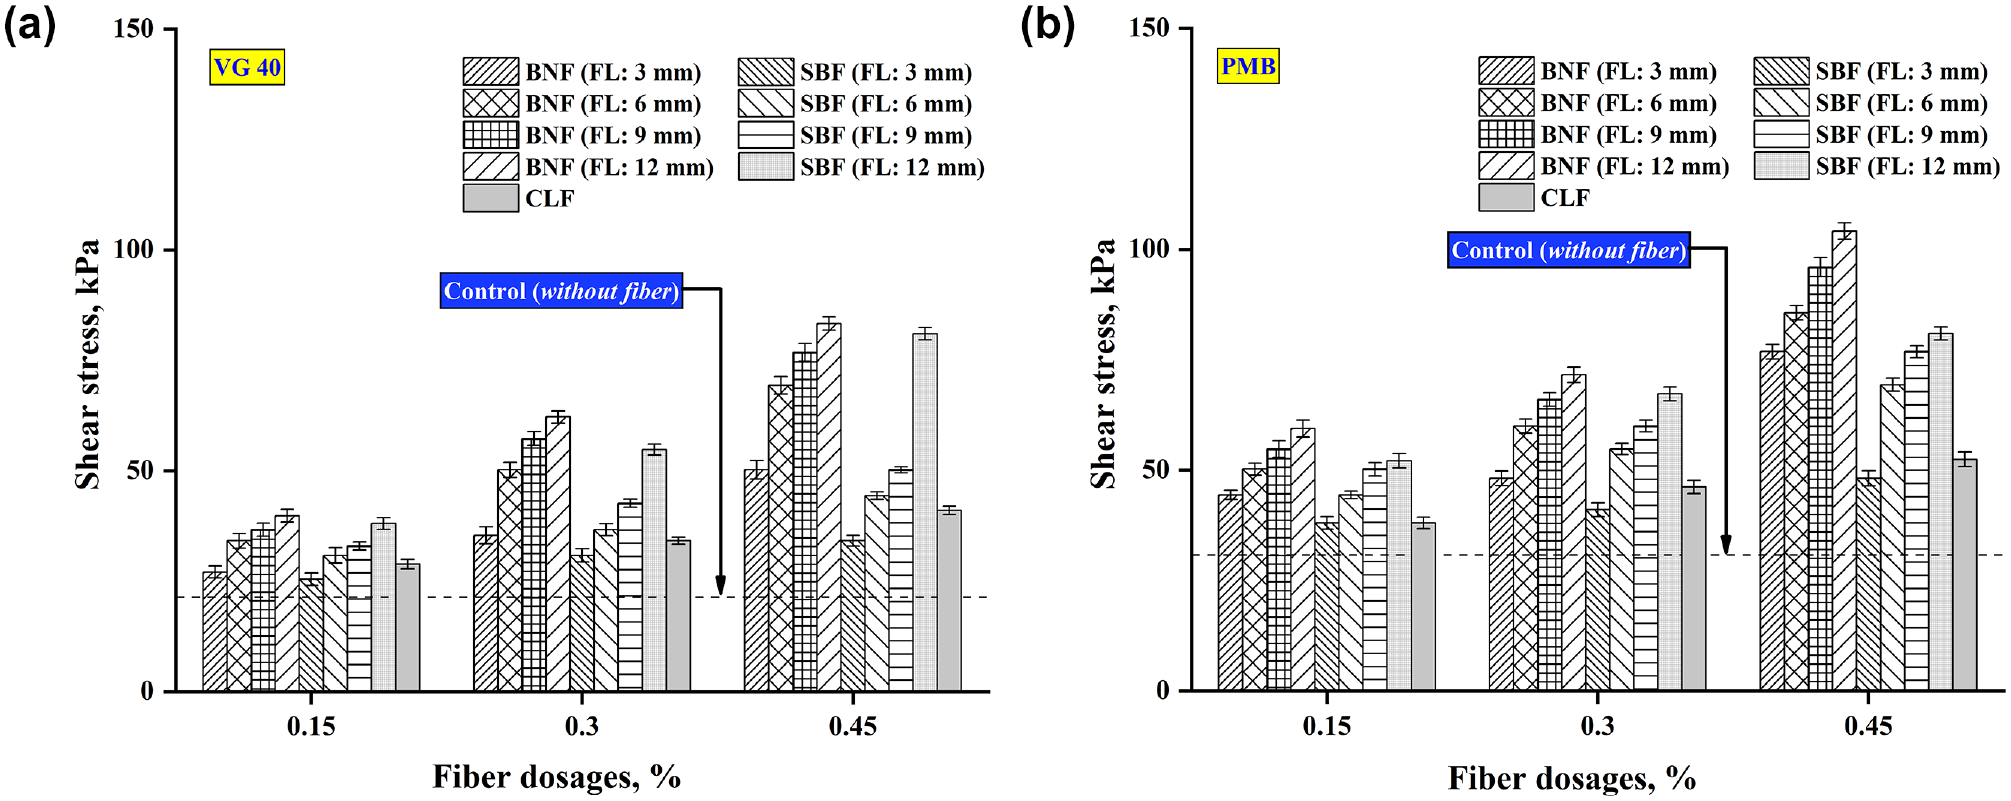
Shear stress results for the fiber-mixed asphalt binder with (a) viscosity grade 40 (VG 40) and (b) polymer-modified bitumen (PMB).
Considering the effect of FL, 12 mm length of fiber showed the lowest CSD and the highest shear stress, followed by 9, 6, and 3 mm for both BNF and SBF. The CSD for BNF was lower, and the shear stress was higher when compared to the SBF at each FL. This observation was attributed to the higher tensile strength of BNF compared with SBF (presented in Table 3), since fibrous materials with higher tensile strength can better hold the binder and also resist deformation under loading ( 33 ). Considering the FD of 0.45%, the CLF showed a reduction of 92% in shear stress with VG 40, and a decrease of 70% with the PMB binder when compared with the control (without fiber). On the other hand, the FMAB with 9 mm length and 0.45% dosage of BNF and SBF yielded reductions of 290% and 179% with VG 40 and 238% and 157% with PMB, respectively, when compared with the control. Although the PMB binder showed higher shear stress than VG 40, it is noteworthy that the percentage improvement in shear stress offered by VG 40 was greater owing to the better dispersion of fibers in VG 40 (unmodified binder) than PMB, which is already a polymer-modified binder with higher viscosity.
Fiber Absorption Test
In the fiber absorption test conducted on the FMAB, the drained material from 250 μm was collected and the cumulative mass loss percentage was computed at intervals of 0.5 h for 3 h. Figure 9, a and b , shows the mass loss results for the FMAB for VG 40 and PMB, respectively, and demonstrate that the mass loss reduced significantly with the addition of fibers when compared to the control sample (which had no fiber additive). Considering the effect of time, the cumulative mass loss rate was greater during the first 1 h in the control binder (without fiber) and for the first 1.5 h in the FMAB for all fibers; thereafter, the mass loss rate was very marginal. Further, Figure 9, a and b , shows that the FMABs prepared with PMB had a lower mass loss than the FMABs prepared with VG 40 owing to the higher viscosity and lower thermal susceptibility of PMB compared with VG 40. When considering the impact of fiber length, the mass loss was reduced the most when using a 6 mm BNF length, followed by 9, 12, and 3 mm. Moreover, the mass loss percentage after 1.5 h for the FMABs with 6 mm length of fibers shows that the BNF had a lower mass loss or higher absorption than SBF or CLF. The BNF gave reductions of 43% and 45% in mass loss with VG 40 and PMB, respectively, while the SBF and CLF showed subsequent decreases of 25% and 33% and 18% and 29%, respectively, when compared with the control. The increased absorption of the BNF compared with the SBF can be ascribed to the porous and hollow surface morphology and thin-walled lumen structure of the BNF, while the SBF had relatively thick-walled lumen and rigid and less porous surface morphology, which were also seen in the SEM images presented in Figure 3.
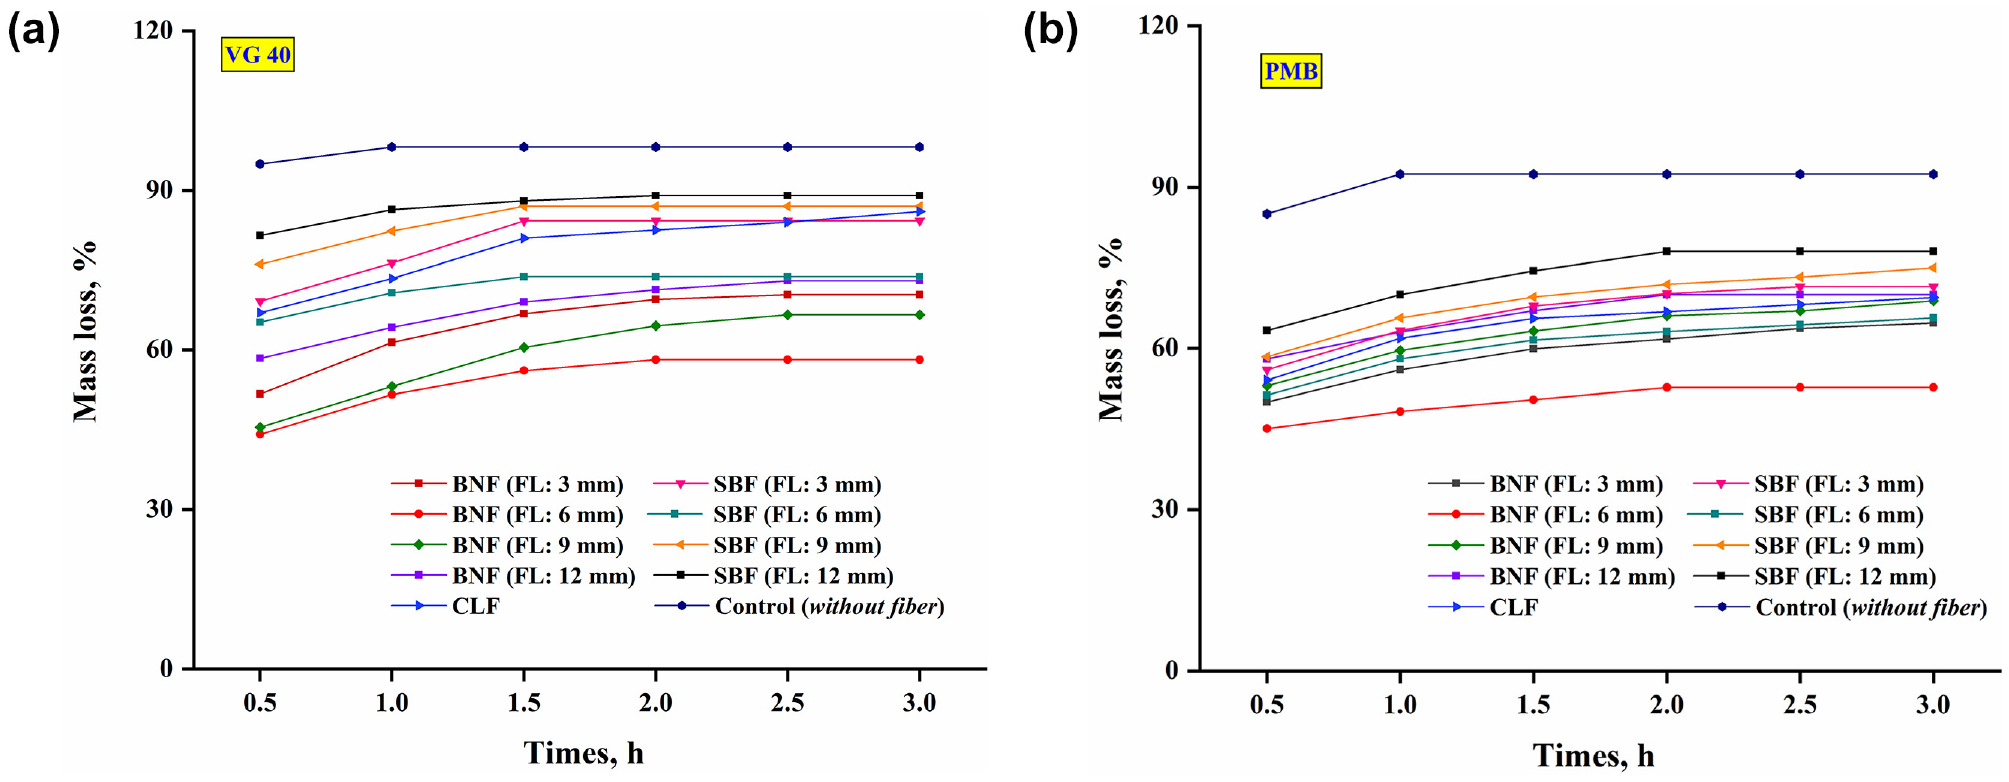
Mass loss results for the fiber-mixed asphalt binder with time for (a) viscosity grade 40 (VG 40) and (b) polymer-modified bitumen (PMB).
Draindown Test
Effect of Fiber Parameters on Draindown
Figure 10 demonstrates the effect of fiber parameters such as FT, FL, and FD on the draindown characteristics of OGFC mixes fabricated with different BDs (5.5%, 6.0%, and 6.5%) of VG 40 and PMB binders. At each BD of VG 40 and PMB binders, the addition of fibers showed a reduction in draindown when compared to the control mix (without fiber). However, the draindown values for the OGFC mix with PMB were lower than those obtained for mixes with the VG 40 binder. The draindown in OGFC mixes reduced as the FDs increased from 0.15% to 0.45% and the FLs increased from 3 to 9 mm for each FT, and then slightly increased for the 12 mm FL. The BNF excelled over the SBF and CLF when focusing on the importance of FT on draindown, highlighting that the BNF provided the highest resistance against binder draindown because of its greater binder absorption, which was also observed in the binder absorption test discussed in the previous section. When FL was taken into account, the fiber with a length of 9 mm exhibited the lowest draindown, followed by fibers with lengths of 6, 12, and 3 mm for both the BNF and SBF. With regard to the 0.45% FD in OGFC mixes prepared with a 6.0% BD, the CLF demonstrated a decrease of 78% in draindown with VG 40 and a reduction of 74% with the PMB binder as compared to the control (without fiber). However, the OGFC mix with 9 mm length and 0.45% dosage of BNF and SBF resulted in decreases of 88% and 83% with VG 40 and 84% and 83% with PMB, respectively, when compared to the control. The availability of more fiber per unit mass, which offers enhanced spectral networking within the mix, can be credited for the decreased draindown with an increase in FD at constant FL. Furthermore, considering 0.45% FD, the 12 mm length induced 54% and 70% increases in draindown with respect to mixes with 9 mm FL for BNF and SBF in OGFC mixes prepared with VG 40, while subsequent increases were 44% and 52% in PMB binders, respectively. The higher dosage and longer length of fiber within the OGFC mix skeleton may sometimes lead to the formation of lumps to induce the “balling effect,” which might impart a detrimental impact on the mix performance ( 11 , 16 , 34 ). The “balling effect” was not observed with the BNF and SBF in the study for the 9 mm FL, showing adequate natural fiber dispersion in the OGFC mixtures.
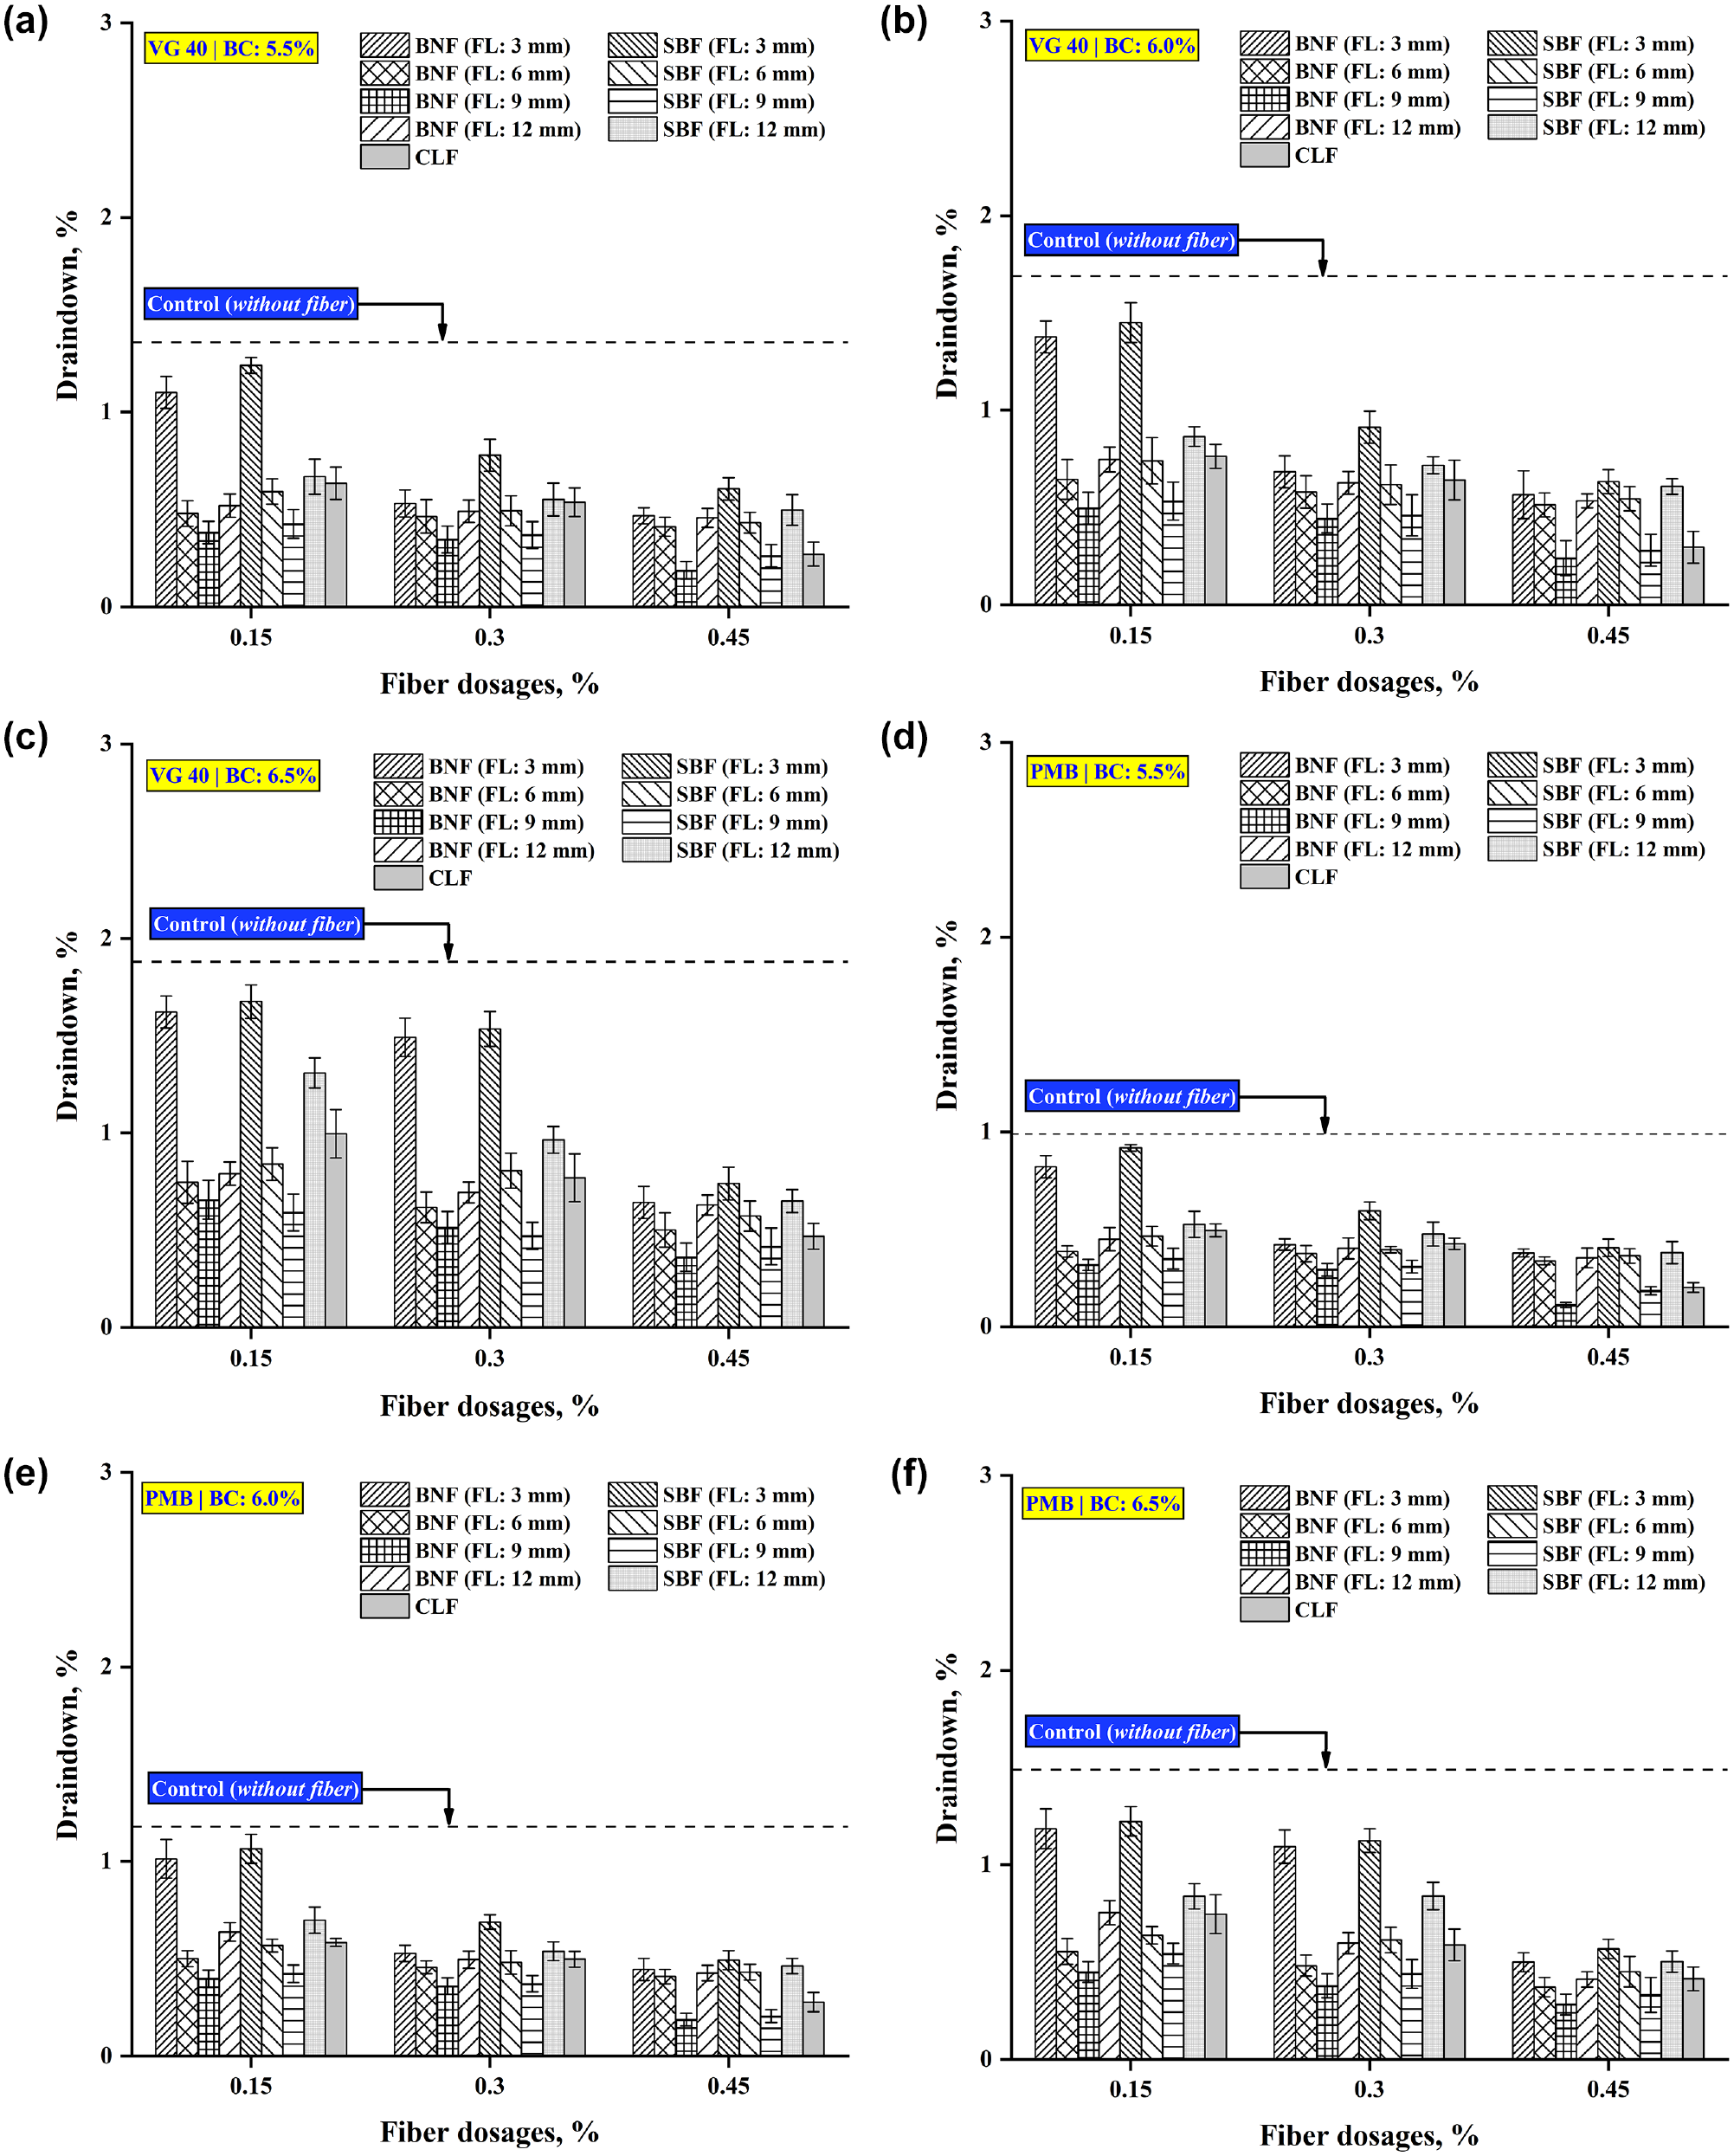
Draindown results for open-graded friction course mixes with viscosity grade 40 (VG 40) at (a) 5.5%, (b) 6.0%, and (c) 6.5%; and with polymer-modified bitumen (PMB) at (d) 5.5%, I 6.0%, and (f) 6.5%.
Effect of Time on Draindown
In an attempt to comprehend how time affects the draindown behavior of OGFC mixes produced with BNF, SBF, and CLF, in addition to the conventional time of 1 h, the draindown test was carried out for 3 h, with observations being recorded for each interval of 0.5 h. In OGFC mixes with both VG 40 and PMB binders, the draindown characterization was carried out at FDs of 0.15%, 0.30%, and 0.45%; the FD of 0.45% demonstrated the highest reduction in draindown for each FT and FL. Therefore, the results of draindown with only 0.45% FD are presented in Figure 11 to eliminate brevity. It can be inferred from Figure 11 that the cumulative binder draindown continuously increased with the increase in time. The rate of binder draindown increased rapidly with time up to 1.5 h; thereafter, the rate of binder draindown was lowered. It is worth mentioning that a higher amount of asphalt binder and mastic dropped from the mesh basket for the initial 1.5 h and the draining of materials ceased afterward for both binder types. Figure 11 shows different draindown profiles for the control mix at each BD and binder type, indicating instability of the mix with the progression of time at elevated temperatures. However, the draindown curve for the BNF and SBF increased until 1 h duration and then became flat, indicating a very marginal increase in cumulative draindown, with the exception of OGFC mixes containing 3, 6, and 12 mm of SBFs at 6.5% binder content of PMB where the draindown curve increased linearly with the progression of time. The CLF also had varying degrees of performance enhancement with different BDs for both binders. An approximately similar observation was also recorded in the fiber absorption test explained in the coming section, indicating that the efficacy of fibers in controlling draindown is highly dependent on the fiber absorption potential.
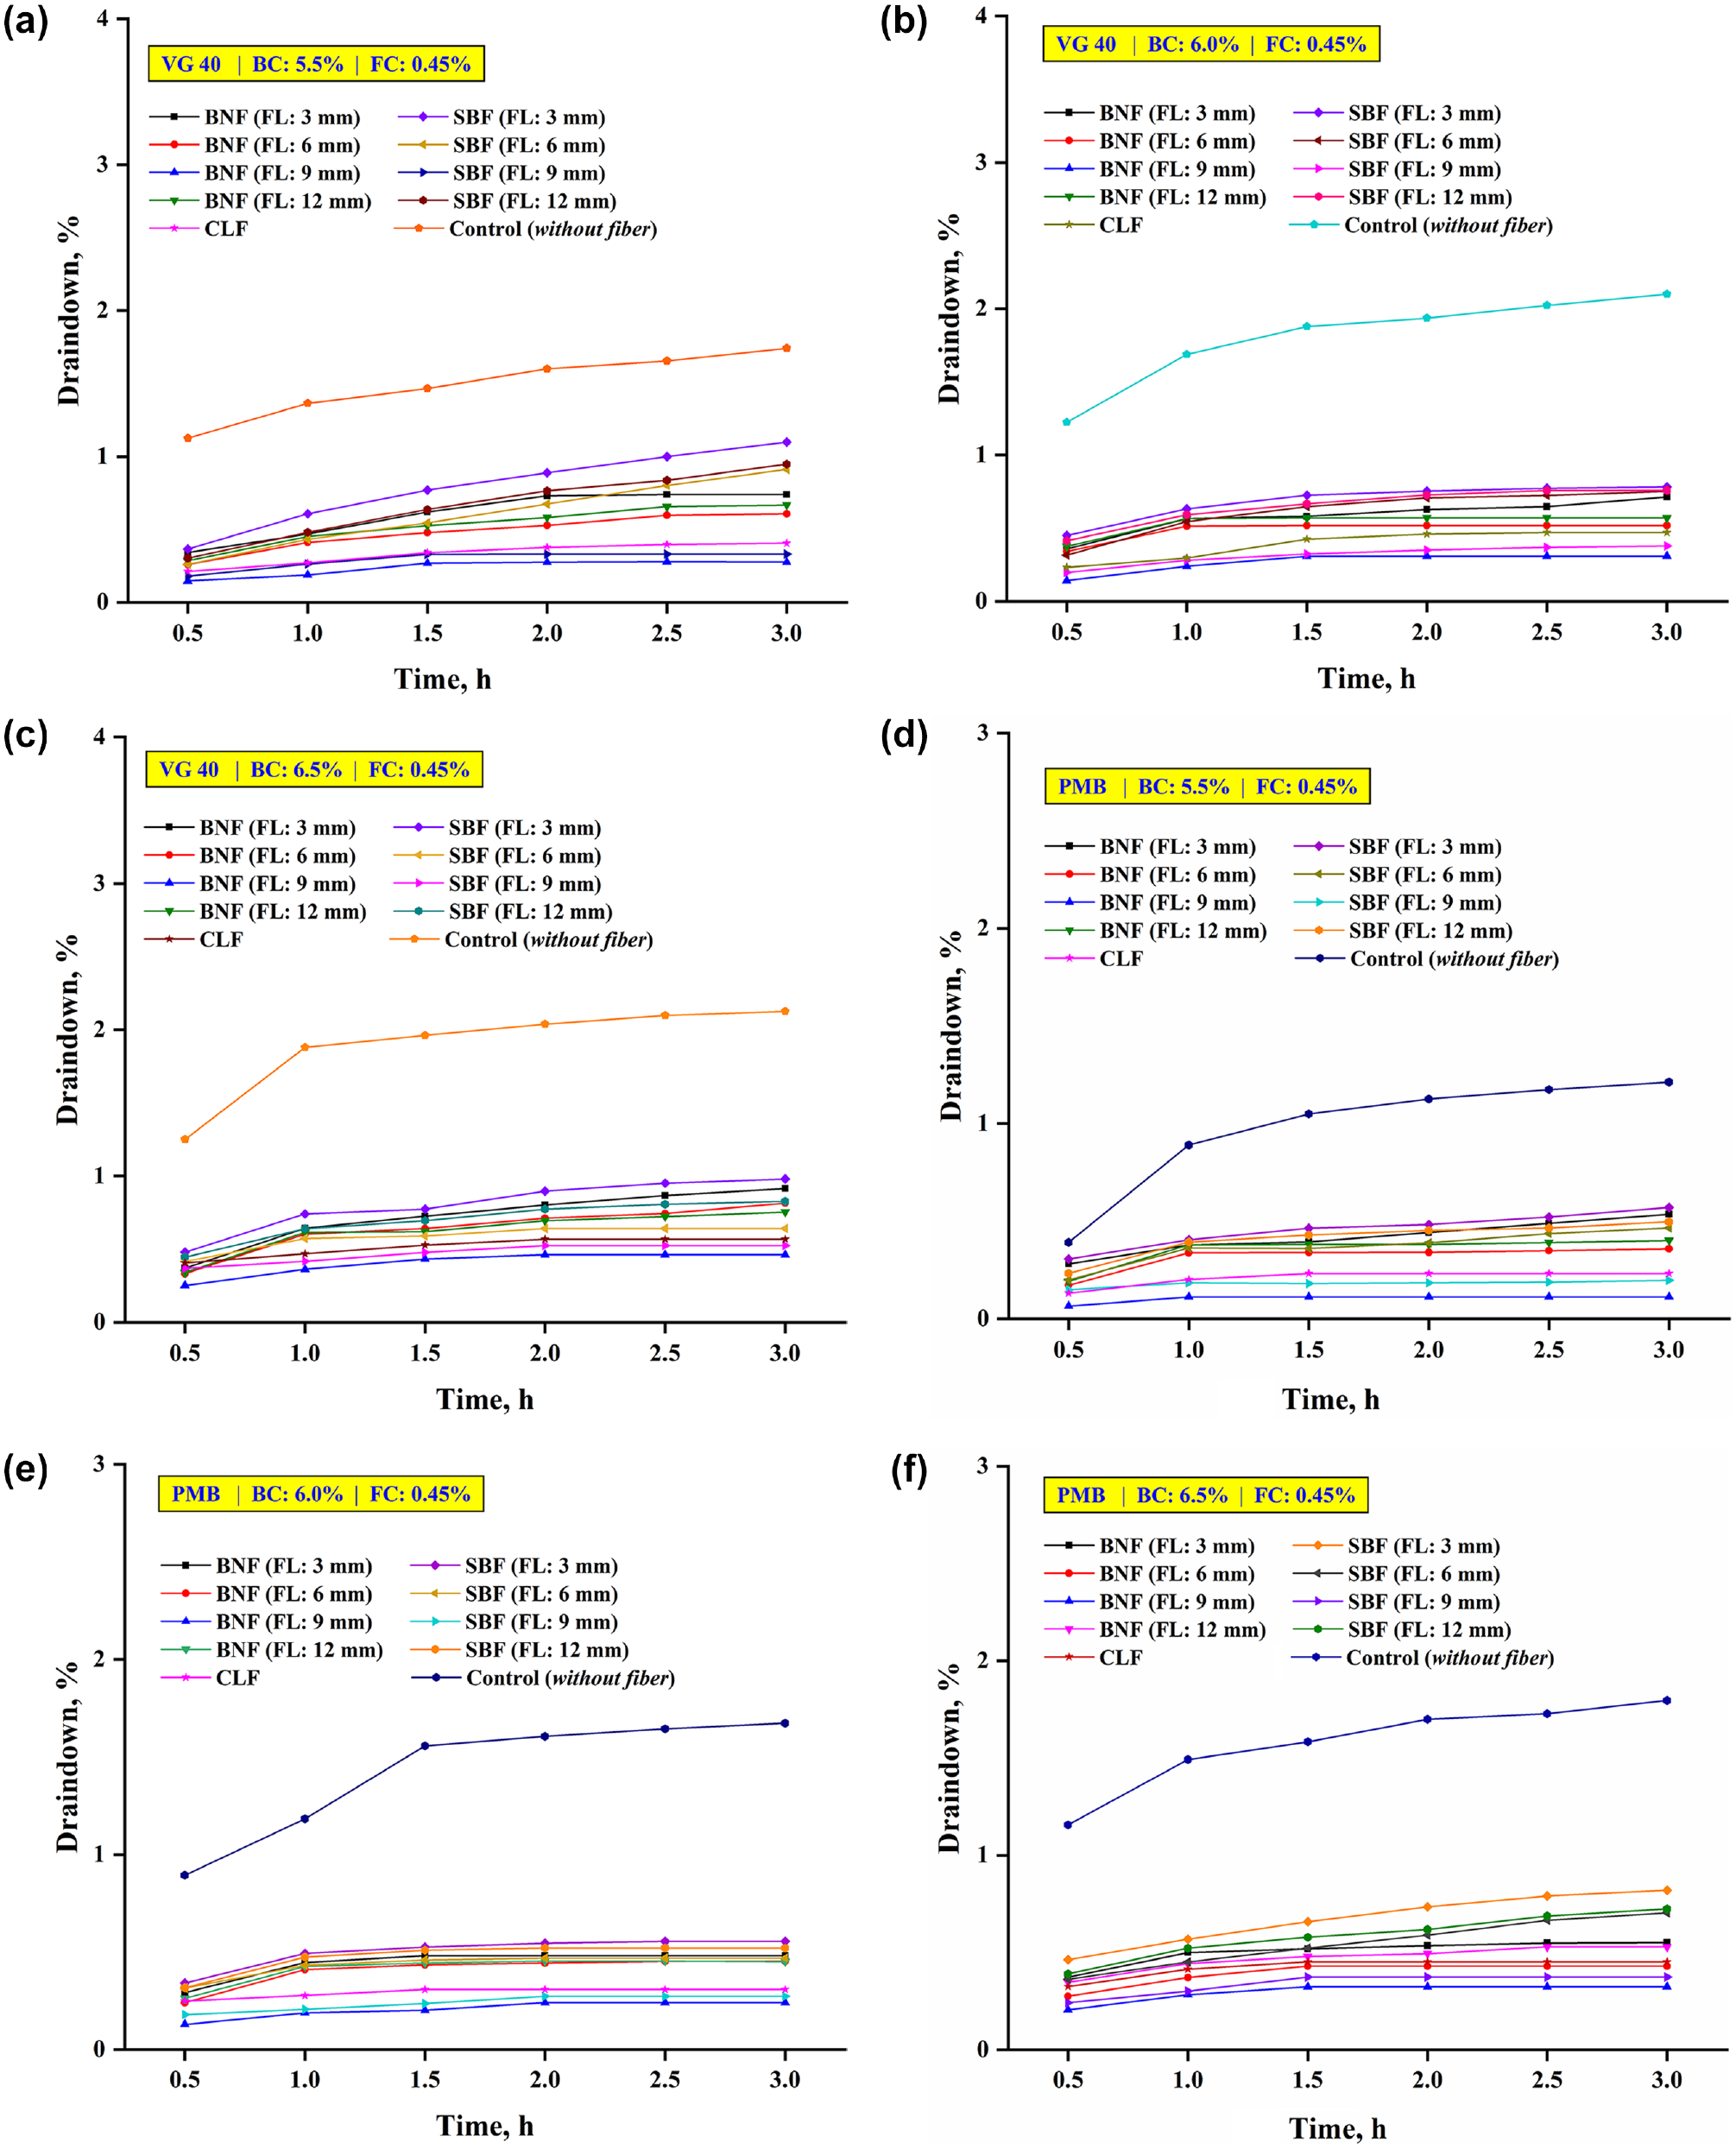
Draindown results for open-graded friction course mixes with varying time: for viscosity grade 40 (VG 40) at (a) 5.5%, (b) 6.0%, and (c) 6.5%; and for polymer-modified bitumen (PMB) at (d) 5.5%, (e) 6.0%, and (f) 6.5%.
Statistical Analysis
An analysis of variance (ANOVA) was used at a significance level of 0.05 to examine the effect of various factors, such as BD, FD, FL, FT, and TP, on the draindown characteristics of OGFC mixes. Table 4 illustrates the ANOVA result for the binder draindown of each binder type.
Analysis of Variance Results for Draindown of Open-Graded Friction Course Mixes
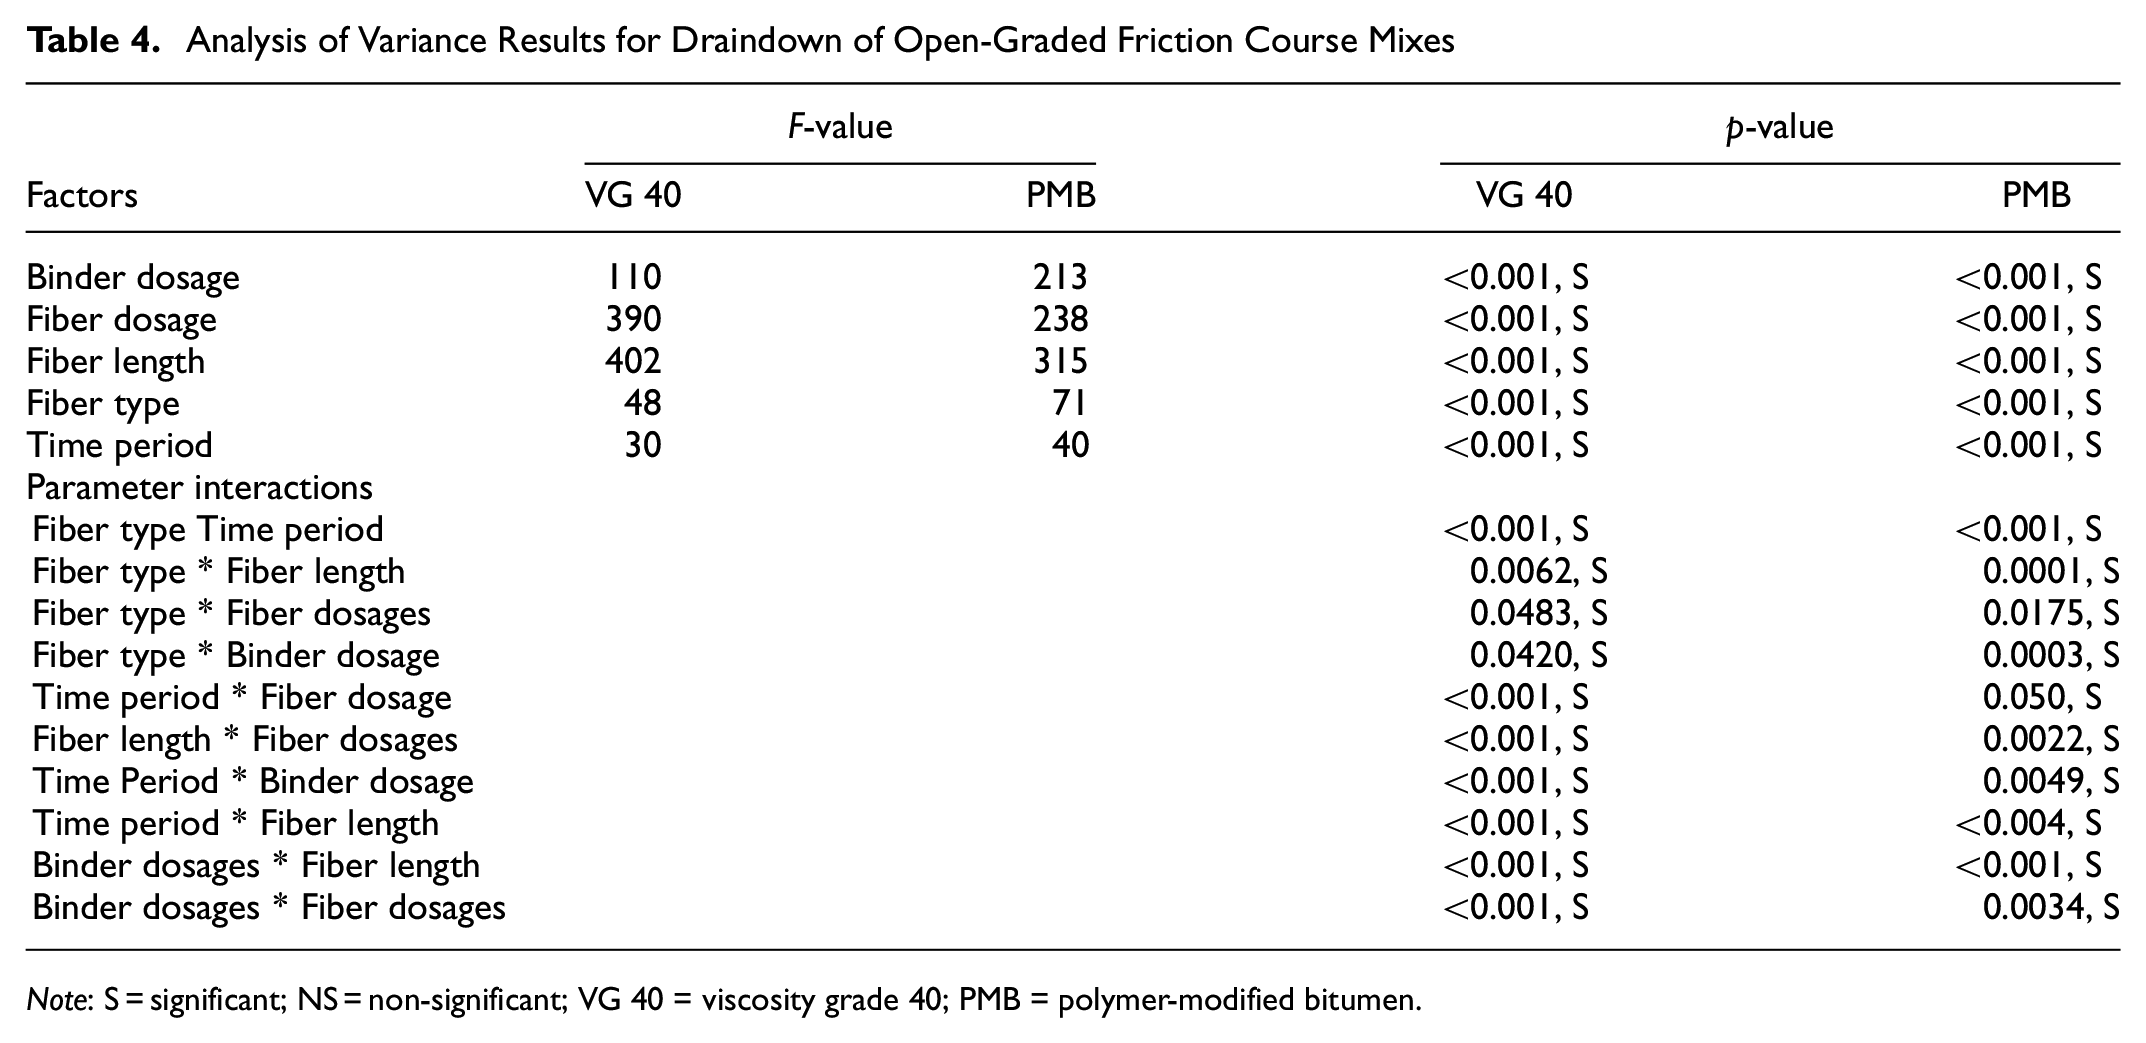
Note: S = significant; NS = non-significant; VG 40 = viscosity grade 40; PMB = polymer-modified bitumen.
The ANOVA findings for the draindown of each binder type are shown in Table 4. Statistically, the binder draindown is shown to be significantly affected by each of the five input parameters (BD, FD, FL, FT, and TP) for both VG 40 and PMB binders. In addition, all the two-way interactions among the chosen input factors are significant, demonstrating that the variance of draindown is constant across various levels of a component. Moreover, the input parameters can be ranked as FL > FD > BD > FT > TP based on high to low F values for OGFC mixes with both VG 40 and PMB binders. Therefore, statistically, it can be inferred that the fiber parameters, particularly length and dosage, impart significant change in the draindown behavior of OGFC mixes.
Conclusions
This study evaluated the use of natural fiber from banana plants and sugarcane bagasse waste as a stabilizing additive to address the draindown in OGFC mixes. OGFC mixes were fabricated with a selected aggregate gradation and two asphalt binder types (an unmodified VG 40 binder and a polymer-modified PG 76-10 binder). Three asphalt BDs (5.5%, 6.0%, and 6.5% by mix weight), four different FLs (3, 6, 9, and 12 mm), and three different FDs (0.15%, 0.30%, and 0.45% by dry aggregate weight) were used for the fabrication of OGFC mixes. A commonly used commercially available CLF was also used for comparison in this study. A total of 168 different combinations of OGFC mixes were studied for draindown characteristics. The draindown of the OGFC mixtures was also carried out for a longer duration of 3 h, with observations being taken at intervals of 0.5 h. The CPT and fiber absorption test were also conducted on the FMABs. The following conclusions are reached in light of the experimental observations in this study.
In the CPT, the CSD decreased, and shear stress increased with an increment in FDs and FLs for each FT. Also, the CSD for the FMAB with PMB was lower, and shear stress was higher than those of the FMAB with VG 40 binder. The BNF offered the highest resistance against binder deformation compared with the SBF and CLF.
The addition of BNF and SBF reduced the draindown of the asphalt binder and thus showed promising results as potential stabilizing additives in OGFC mixes.
The binder draindown in the OGFC mixtures decreased with an increase in FDs, with the lowest draindown obtained at 0.45% FD.
Among all the four different FLs used in the binder draindown evaluation of OGFC mixes, a 9 mm FL demonstrated the highest performance and the lowest asphalt binder draindown at each fiber and BD.
Considering the effect of time, the rate of draindown in the FMAB increased for the first 1.5 h and then became quite constant/stable for both BNF and SBF, indicating a good long-term binder draindown resistance potential.
The best performance was exhibited by the BNF, which had a dosage of 0.45% and a length of 9 mm, followed by the SBF and CLF.
The higher efficiency of the BNF compared with the SBF in resisting draindown is ascribed to the porous and hollow surface morphology and thin-walled lumen structure of the BNF. The SBF had a relatively thick-walled lumen and rigid and less porous surface morphology.
All the influencing factors, including binder content, FT, FD, FL, and TP, were found to be statistically significant for draindown in OGFC mixes fabricated with BNF and SBF as stabilizing additives with both neat (VG 40) and modified (PMB) binders.
The usage of natural fiber derived from the agro-waste of banana plants and sugarcane bagasse would have a socioeconomic advantage and will also serve as a source of additional revenue for the farmers engaged in their production.
Footnotes
Author Contributions
The authors confirm their contribution to the paper as follows: study conception and design: A. Sharma, R. Choudhary, A. Kumar; data collection: A. Sharma, A. Kumar; analysis and interpretation of results: A. Sharma, R. Choudhary, A. Kumar; draft manuscript preparation: A. Sharma, R. Choudhary, A. Kumar. All authors reviewed the results and approved the final version of the manuscript.
Declaration of Conflicting Interests
The author(s) declared no potential conflicts of interest with respect to the research, authorship, and/or publication of this article.
Funding
The author(s) received no financial support for the research, authorship, and/or publication of this article.