
Abstract
Evidence suggests that mobile phone navigation applications (MPNAs) may reduce road traffic safety by causing a visual distraction. This study aimed to (i) identify a list of road safety-related events (RSREs) that could occur while looking at the MPNA, (ii) examine the effect of app-taxFi drivers’ glances at MPNA on missing of RSREs, (iii) develop any potential new indicator in road traffic safety, and (iv) develop a pyramid of traffic incidents. This study investigated 36 app-taxi drivers in real road traffic circumstances. Data were collected by video recording using a double-lens camera. The events that occurred while the app-taxi driver was looking at the MPNA were extracted, recorded, and classified. A time span of less than one second and a new indicator, namely “seeing the event BEFORE visual distraction” (seBvd), were examined. The data were analyzed using descriptive statistics and non-parametric tests with a significance level of 0.05 in SPSS 18. A list of 23 events was identified. The most frequent event was “presence of pedestrians across the road” (including crossing the road and beside the road 36%). The number of glances at the MPNA had a significant correlation with time span ≤1 s (p = 0.001, r < 0.6). The total time of looking at the MPNA had a significant correlation with time span >1 s (p = 0.001, r < 0.6). A pyramid of traffic incidents was developed based on the results. The new seBvd indicator is a binary (positive; negative) surrogate safety measure that can be useful in evaluating the effect of visual distraction on road traffic safety. The introduced pyramid of traffic incidents seems useful in traffic safety.
Keywords
Driving is a complex task that requires the simultaneous utilization of physical, emotional, and mental skills ( 1 ). Throughout an entire journey, drivers constantly receive information from inside and outside their vehicles. They must then process it, make decisions, and implement actions where necessary. Therefore, safe driving requires attention and the engagement of their senses, particularly sight, hearing, and touch ( 2 ).
Driver Distraction
Driver distraction is defined as diversion (intentional or unintentional) of attention away from activities required for safe driving toward a competing nondriving activity. Engaging in an additional task, a so-called secondary task, is the most frequently reported cause of road traffic accidents and near-misses and one of the five main causes of traffic-related deaths ( 3 , 4 ). For example, in 2018, the U.S. National Highway Traffic Safety Administration reported that 8% of fatal crashes were caused by driver distraction ( 5 ). Additionally, 15% and 14% of crashes that only caused injuries and vehicle damage, respectively, occurred as a result of this issue. Iran, a country with a high rate of casualties from road traffic accidents, experienced approximately 17,000 traffic-related deaths in 2019, the majority of which were related to driver distraction ( 6 ). Evidence shows that the performance of novice and even experienced drivers is adversely affected by driver distraction ( 2 ).
There is a huge body of literature on various aspects of driver distraction, including taxonomy and models ( 7 ), epidemiology ( 8 ), mechanisms ( 9 ), detection and monitoring ( 10 – 12 ), measurement and assessment ( 13 ), and prevention and mitigation ( 14 ) of driver distraction. For example, Regan et al. (2009) provided a list of 53 driver actions as potential sources of distraction based on a literature review. They allocated the actions into six categories: things brought into the vehicle; vehicle systems; vehicle occupants; moving objects in the vehicle; internalized activity; and external objects, events, and activities ( 15 ). Other studies have shown that in-vehicle distractors are the most destructive ( 16 ). Therefore, this major issue needs to be considered in further detail.
In another categorization, distraction is divided into visual, cognitive, biomechanical, and auditory types. However, multiple types typically co-occur in the use of mobile phone navigation applications (MPNAs) while driving.
Visual Distraction
As most traffic stimuli are received visually ( 17 ), eye (and head) movement plays an important role in a safe driving. Visual scanning of objects or information not related to the driving task, inside and outside of the vehicle, may result in missing vital information required for safe driving ( 1 ). Visual distraction is therefore considered the most dangerous during driving ( 18 ). There are many different sources of visual distraction. Looking at conventional or electronic roadside advertising billboards ( 19 , 20 ), and checking mobile phones are among the most frequent contributing causes of visual distraction. Eyes off the road and gazing (longtime steady look at objects) are examples of visual scanning impairments while driving. Many algorithms have been proposed and developed to detect these impairments; most of them use advanced analysis of basic data logged from the driver. Facial features, head pose, eye corners, and iris and pupil status are some basic data ( 21 – 23 ). The algorithms are used to detect dangerous driver behavior, however, it is difficult to know, for example, whether all gazes while driving are dangerous or not. Maralappanavar et al. ( 23 ) developed an algorithm to detect the gaze with the help of the face, eye, pupil, and eye corners. They reported the gaze detection accuracy of their algorithm achieved 75%.
Road navigation is a major challenge for all drivers. Specifically, they should choose the shortest, quickest, and least-congested route to reach their destination. Using road navigation technologies while driving is a growing source of visual distraction. Previous studies, including those on in-vehicle navigation systems (including MPNAs), have investigated the adverse effects of visual distraction on traffic safety ( 24 – 26 ).
Road Navigation Systems and Navigation Behavior
The use of assistive in-vehicle technologies is becoming more prevalent, including the global positioning system (GPS) ( 27 , 28 ). GPS has been publicly available since 1993, and it is increasingly being used in various fields. Advancements in this technology have also facilitated the provision of novel solutions for traffic control in recent years. As a resultant, road safety and user satisfaction have improved, while delays, costs, fuel consumption, and environmental pollution have simultaneously reduced ( 29 , 30 ). One example of innovative technology is MPNAs, which are utilized by the majority of drivers following the transition to touchscreen smartphones and the consumer preference for large screen sizes.
Navigation systems are a group of driver-assistant technologies that help drivers to find the fastest and less congested route. Conventional in-vehicle navigation systems and MPNAs are the most common. The preference for the use of these devices is not the same. Wang and Ju ( 31 ) investigated the tendency of some drivers to use MPNAs and in-vehicle navigation systems. They showed that the majority of participants use an MPNA as their primary navigation system. On the other hand, in-vehicle navigations systems are not embedded in most typical vehicles in Iran, and the drivers use smartphone navigation applications.
Accident Pyramids
The concept of accident pyramid was coined by Herbert William Heinrich in his book, Industrial Accident Prevention, A Scientific Approach ( 32 ), published in 1931, almost a century ago. This concept introduced the unequal ratio of different types of risky situations that may lead to fatal accidents. The pyramid indicated that fatal accidents are announced by incidents with slight or ignorable consequences (near-misses) ( 32 ). A near-miss—which is also called near hit, close call, narrow accident, narrow escapes, near-crash, air miss, airprox, and so on—is defined as an unplanned event that could have resulted in loss but actually did not. As a result, near-misses are largely ignored ( 33 ). History has shown frequently that these kinds of events often precede loss-producing events. Recognizing and reporting these events can provide opportunities for a better understanding of the safety level of systems ( 34 ).
However, the values used in Heinrich’s pyramid, for example, a fatal accident for every 300 near-misses, have been questioned for the lack of sufficient evidence ( 35 ). Whatever the numbers, it is accepted that the wider the lower layers of the pyramid (more near-misses), the safer the conditions ( 36 ). In other words, increasing the ratio of accidents to near-misses indicates a decrease in compliance with safety precautions; consequently, more severe accidents are expected to occur. Thus, an accident pyramid can play a role as a warning in the system.
Some studies in the field of transportation systems have criticized Heinrich’s pyramid and suggested that the values used are not reliable ( 37 ). Several researchers, including Glauz and Migletz ( 38 ) and Hydén ( 39 ), have independently developed crash hierarchies for unsignalized intersections, not in relation to distraction.
It should be mentioned that recognizing whether a near-miss happened differs for various domains. In aviation, for example, a near-miss can be determined based on the opinion of a pilot or air traffic services personnel ( 40 ). In traffic safety, however, surrogate safety measures are considered for this purpose.
Surrogate Safety Measures
The frequency and severity of crashes are universally accepted as two essential indicators to directly evaluate the safety performance of a countermeasure, design, or system. Nevertheless, these kinds of events are rare. The potential effects of implementing a new traffic strategy (e.g., a newly installed traffic sign) take time to be revealed in the real world by the frequency and severity of crashes. Therefore, crash history data are not the best option for assessing traffic strategies. It may even be to some extent against ethics. To address this issue, SSMs have increasingly become popular solutions. Compared with accidents, there are substantially more traffic conflicts ( 41 ).
Research on surrogate safety measures (SSMs) can be traced back to 1968 and the work by Perkins and Harris, at General Motors Research Laboratories, to examine the difference between General Motors vehicles and other vehicles. Over time, significant efforts have been made to develop different SSMs. Currently, SSMs are increasingly being applied by practitioners and researchers to apprehend the safety implications of new traffic plans using direct or indirect (recorded videos) observational methods ( 41 ).
Traffic conflicts (near-misses), with no crashes, are observable events in which interactions among several road users at a given place and time can pose a collision risk if they do not change their courses of movement ( 41 ). A conflict is etiologically linked to a crash because it indicates a failure (e.g., road user failure, vehicle failure, or road failure) that can lead to a crash if the failure is not adequately corrected ( 42 , 43 ). Given this causal relationship, the indicators which can identify traffic conflicts and determine their severity can be considered SSMs.
In the literature, two well-known SSMs, TTC (time to collision), and PET (post-encroachment time), have been repeatedly mentioned. TTC refers to the time that remains until a collision between two vehicles would have occurred if they continue their current driving maneuvers (i.e., speed or lane). It has usually been applied to evaluate the risk of rear-end collision ( 44 ). PET represents the time span (TS) between a road user leaving the area of encroachment and a conflicting road user entering the same area. PET is utilized for the proximity of right-angle collisions ( 45 ). Goyani et al. ( 46 ) suggested that SSMs such as PET should be employed in crash pyramids.
Purpose of This Study
Taxis, as a crucial part of urban transport systems, also make use of MPNAs. Specifically, drivers of “app-taxis” have increasingly been using MPNAs ( 47 ). Despite many advantages of MPNAs, these applications appear to alter driving behavior by visually distracting drivers, especially in urban areas ( 28 ). Off-road glances, for example, looking at an MPNA, increase the risk that the driver will not notice vital road events and information ( 17 ). While MPNAs can also provide audio navigation (verbal directions), this feature is often deactivated because it can be bothersome for the driver and their passengers.
Despite the findings on the effects of gazing while using MPNAs, little attention has been paid to the real effect of gazing on safe driving: missing road information. In other words, it is interesting to know what events occurred on the road while drivers are visually searching for the best route on their smartphones.
The majority of studies have been conducted in simulated environments with individuals who were not professional drivers ( 48 – 50 ). Yet, it is known that professional drivers, such as taxi drivers, demonstrate different strategies in cruise management ( 51 ). In particular, they preferentially choose low-traffic routes. Also, behavioral differences have been shown between professional and non-professional drivers based on their compensatory strategies, risky driving, and stress reactions ( 52 , 53 ).
Similarly, there are few real-world studies on app-taxis (as a large group of MPNA users), and they lack any quantitative measurements of traffic events resulting from drivers using this technology ( 54 , 55 ). Consequently, the effect of driver distraction on road safety-related events (RSREs) is not well reported.
Moreover, it is generally accepted that using mobile phones while driving is dangerous. Currently, about 70 countries have banned the use of mobile phones while driving ( 56 ). In Iran, among 191 offenses related to driving violations, mobile phone use is ranked 14th ( 57 ). While using MPNA is essential for app-taxi drivers, the level of distraction induced by this technology may not differ from using a phone for calling. Solving this contradiction calls for conducting several studies, just one of which can be determining the RSREs a driver may fail to notice when using the visual navigation feature of an MPNA in a real traffic environment.
Available algorithms attempt to detect visual distraction based on tracking the head, face, and eye data. The main limitation of these algorithms is that they do not take the current traffic situation into account to decide on the level of distraction and the need for intervention. Ahlström and Kircher ( 58 ) reviewed the existing algorithms and concluded that further research is needed to develop technology to be able to measure the current traffic situation and traffic environment.
Notably, it would also be useful to identify different of RSREs and their relative probabilities of occurring. This information could be used in planning preventive measures as well as research studies because events of different levels of severity often result from the same cause. Thus, when investigating different RSREs, it is necessary to undertake the systematic observation and record various events to obtain a rich database of causal relationships ( 59 ). These RSREs could also be ranked for more detailed understanding. It should be mentioned that there is no incident pyramid to demonstrate at least one of the cognitive processes in relation to RSREs.
The information provided above motivated the authors to develop a list of traffic events that may occur while using the visual navigation feature of an MPNA and introduce a related incident pyramid. It is intended that this could be used to identify possible outcomes in a real environment.
Materials and Methods
This was a naturalistic observational (video recording) study in Tehran (the capital of Iran), which investigated the use of the visual navigation feature of an MPNA by app-taxi drivers. According to the Field Operational Test Support Action (FESTA) handbook, it can be considered a field operational test, which is “undertaken to evaluate a function or functions under normal operating conditions in environments typically encountered by the host vehicle (s) using quasi-experimental methods” ( 60 ).
Ethical Considerations
This research was approved with the Grant Number of IR.ZUMS.REC.1398.144 in the Ethics Committee of the Zanjan University of Medical Sciences. In regard to the Ethics Committee codes, all the participants took part in the study only after receiving a description of the study objectives and signing informed consent. Also, the participants were informed about the confidentiality of their identities and the right to withdraw at any time. In addition, the ride charges were paid to the participants. The ride charges of the drivers who received the descriptions of the study and expressed unwillingness to participate in the work were paid, too.
Study Design
A 3×3 table was used to present the spatial-temporal design of the study, with three routes for three time periods (08:00–10:00, 12:00–14:00, and 16:00–18:00). Four drivers were recruited for each cell. Data were collected by recording RSREs in front of the vehicle for one ride of each of the drivers. The same MPNA was used in all the rides. Several stages of the study are depicted in Figure 1.

The study method.
Participants
Very few app-taxi drivers in Tehran are female; therefore, only male drivers were invited to participate in the study. In total, the participants were 36 male app-taxi drivers who were aged 30 to 50 years and had at least one year of experience in app-taxi driving and in using MPNAs while driving.
Route and Time for the Rides
Attempts were made to select three routes to provide relatively similar times and lengths for all rides. Several routes with different origins and destinations in Tehran were examined at different hours, resulting in the selection of three routes with medium and flowing traffic. Each origin–destination pair was examined by the same MPNA at different time periods (08:00–10:00, 12:00–14:00, and 16:00–18:00) on different days to ensure that the MPNA-suggested route was almost the same at the intended hours (Figure 2). Routes were also selected such that the ride time would be estimated to be nearly 30 min by the MPNA and all the rides were almost the same length. Because of the characteristics of the routes, the speed of app-taxis was 50–60 km/h. Each driver participated in the study only once and just for one route.
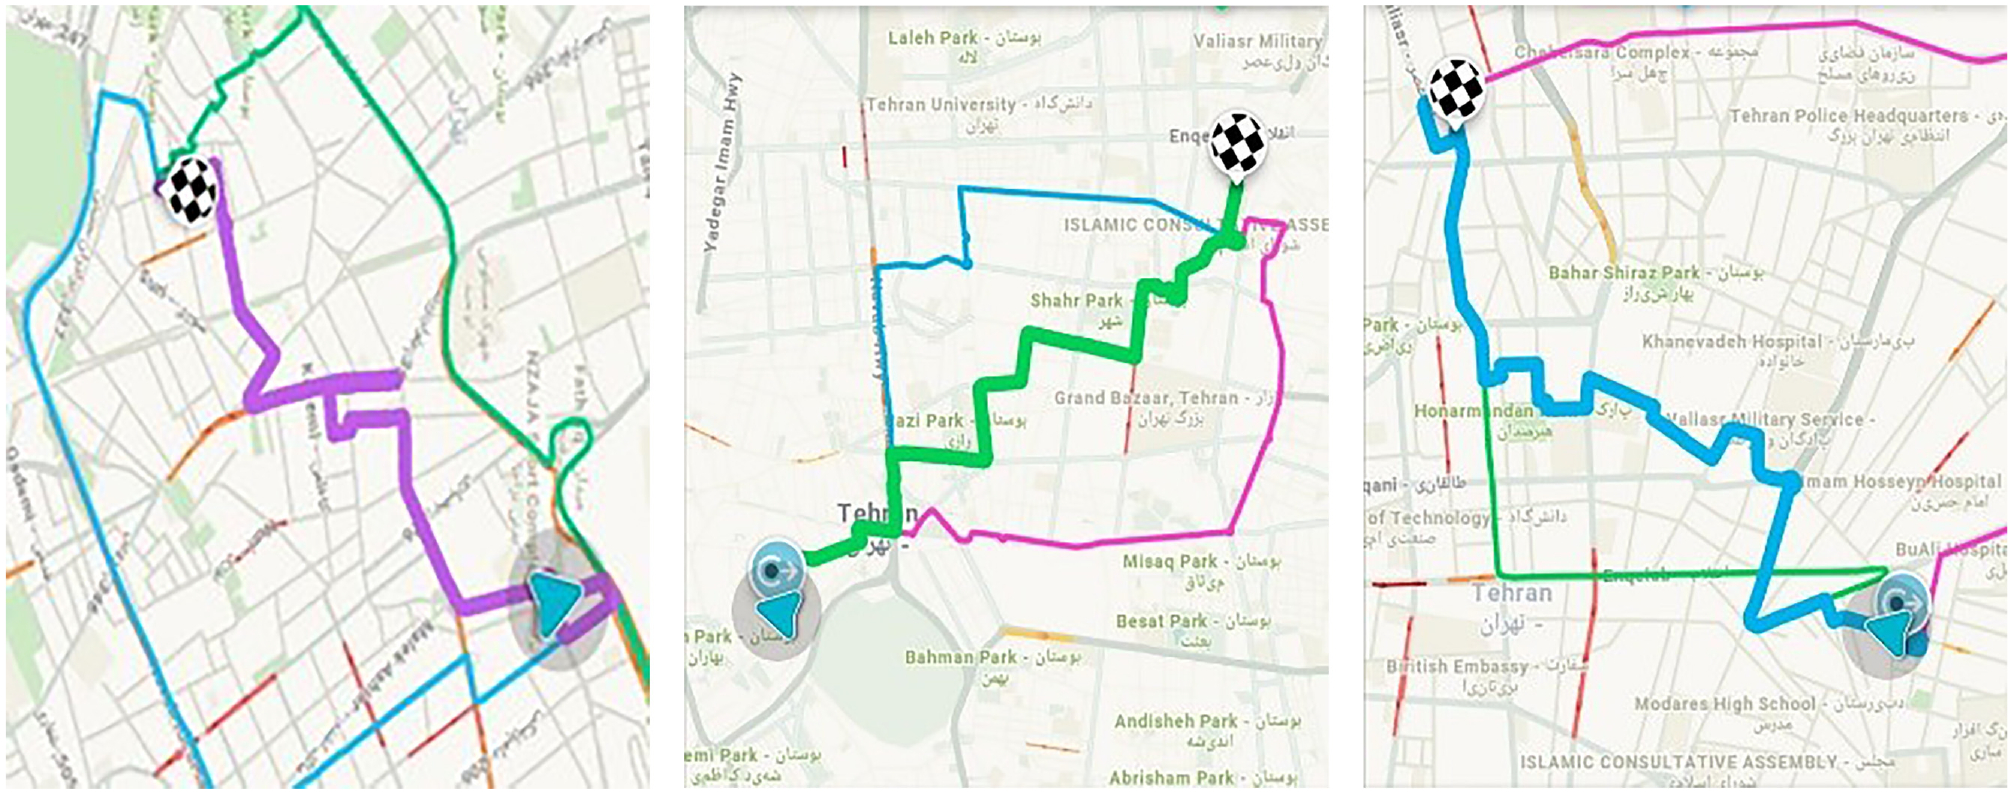
The routes: (a) 1 (purple), (b) 2 (green), (c) 3 (blue).
In addition, it was to be ensured that the drivers would frequently use MPNA while consistently managing the cruise. To achieve this, two criteria were considered. The first one was related to the characteristics of the road. Each selected route included at least 10 intersections ( 61 ). For some of them, the driver needed to turn right or left. The second criterion referred to the driver. The summoned taxi driver was called to ask if he had driven the route before. Notably, the driver could only be included in the study if he was not familiar with the route and was willing to participate; otherwise, the ride would be paid and canceled.
Requesting a Ride
The procedure for requesting a ride from an app-taxi company appears to be fairly standardized globally. However, a brief description is provided for full transparency. In Iran, requesting a ride starts when a passenger selects the origin and destination on the taxi application screen. When the ride is accepted by the driver, the passenger is provided with the details of the taxi driver including his full name, phone number, photograph, vehicle brand/type, and license plate number. Similarly, the driver is notified of the name and phone number of the passenger through the application. The passenger and driver can also have a phone conversation before the ride if required.
Positioning of the Camera and MPNA
After receiving a driver’s informed consent for participation in the study, a dual-lens WRD-Video CAR DVR camera with a resolution of 1,080 and a viewing angle of 170 degrees that could simultaneously record in two opposite directions (inside and outside the vehicle) was positioned on the windshield (Figure 3). The driver was also asked to position his mobile phone (with the MPNA installed) close to the camera on the lower, central part of the windshield in a fixed position and only to use the visual navigation feature of the application.
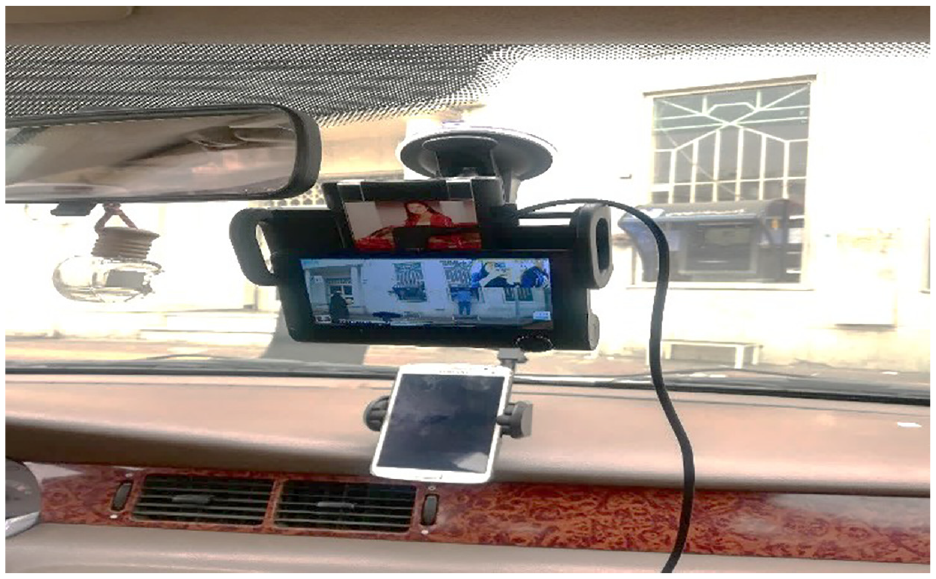
Positions of the mobile phone and camera on the windshield.
As soon as the taxi commenced the route, the camera and the MPNA were activated to simultaneously record the inside and outside of the vehicle cabin throughout the journey. The internal camera lens could record any glances the driver made at the MPNA, while the external camera lens recorded the RSREs (Figure 3). Furthermore, an observer was present in the vehicle during the ride to ensure that drivers only used the visual navigation feature of the application and that they followed the MPNA-suggested route. The observer also ensured the immobilization of the camera and mobile phone and that the camera was recording.
Video Preparation
At the end of each ride, recorded videos (inside and outside the vehicle) were transmitted from the camera memory to a laptop. Double-lens camera videos were synchronized and rendered as a side-by-side single view using Corel VideoStudio software. Therefore, it became possible to determine the coincidence of the road event with the driver’s glances at the MPNA (Figures 4a and b ).
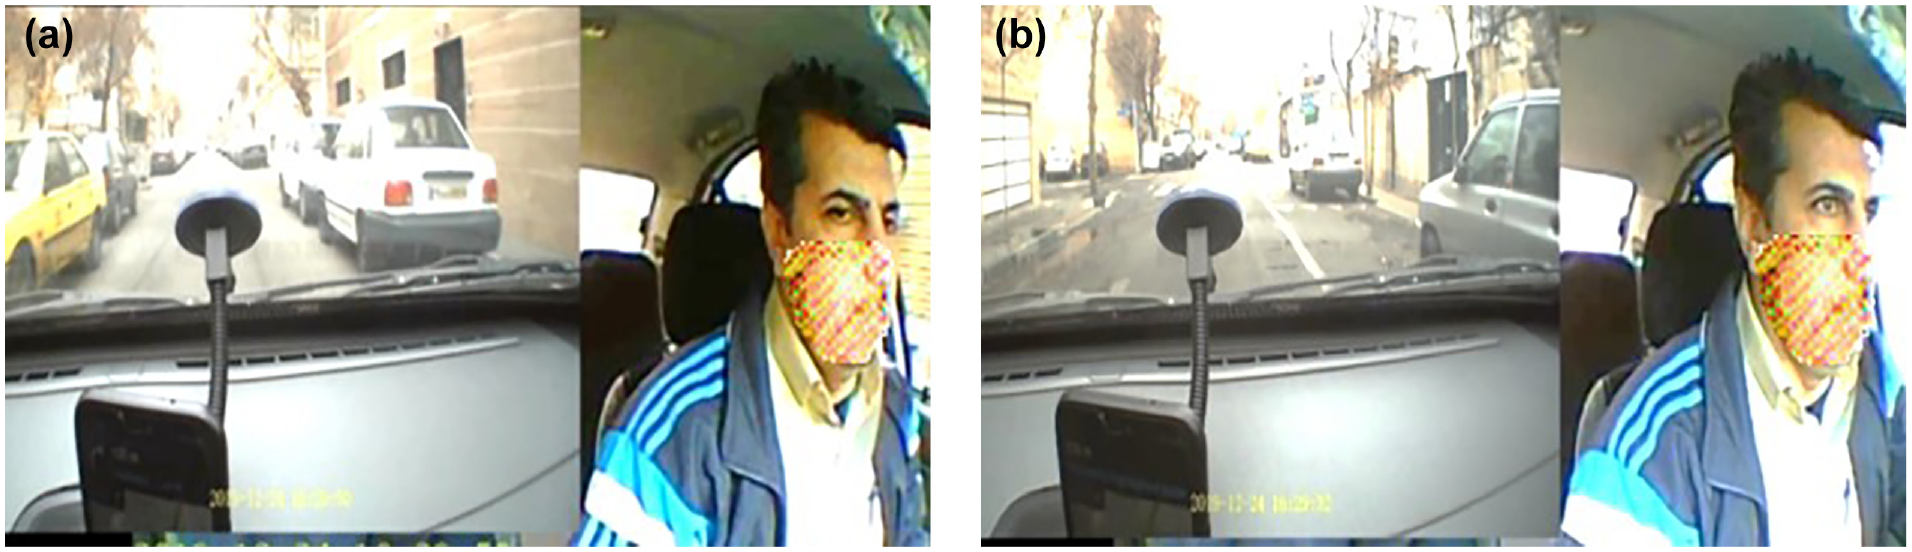
Simultaneous video recording from inside and outside the car: (a) the driver looks at the road, and (b) the driver looks at the mobile phone navigation application.
Data Extraction and Accuracy
The videos were reviewed three times to record: a list of RSREs and their frequencies in front of the vehicle; the number and duration of the driver’s glances at the MPNA; and the possibility of traffic conflicts. All the videos were re-watched to compensate for any possible errors made by the observer. Additionally, a random selection of half the videos was reviewed by a research assistant to minimize observation errors and ensure that the data were recorded correctly.
Safety Evaluation Criteria
As Goyani et al. ( 46 ) suggested, PET was considered for safety evaluation in this study. In urban areas, PET value of one second or less implies the possibility of a critical (evasion-based) situation ( 62 ). In the recorded videos in this study, however, no critical situation was observed. Therefore, we borrowed the criterion of TS of one second or less (without evasion) between the app-taxi and the RSREs to evaluate relatively unsafe situations while the driver was gazing at the MPNA. For this purpose, if the driver saw the event before taking his eyes off the road, a positive seBvd (PseBvd) was recorded. Similarly, a negative seBvd (NseBvd) was recorded when he was looking at the MPNA at the moment the event occurred.
Statistical Tests
Data were analyzed by SPSS 18 software (IBM Corp., Armonk, New York, USA). Descriptive results are presented as: number, percent, median, and interquartile range. The quantitative results were not normally distributed, so the non-parametric Kruskal-Wallis test was employed to identify the relationship between the duration of the MPNA glances and road components. Additionally, the statistical Kendall’s tau-b correlation coefficient was administered to assess the correlation between variables: education, driving history, app-taxi job history, habit using MPNA, pre-app-taxi accident history, post-app-taxi accident history by total MPNA glance number, total MPNA glance duration, TS, seBvd. Spearman correlation coefficient was used to show a pairwise correlation between age by MPNA; age, total number of MPNA glances, and total duration of MPNA glances by TS. In all the tests, a significance level higher than 0.05 ( 63 ) and a correlation coefficient of 0.6 were assumed to be significant ( 64 ).
Results
Data Accuracy
As previously mentioned, the videos were reviewed by a research assistant to validate the data. Since each video had already been re-watched three times, the research assistant’s results were consistent with the previous results.
Relationships of Road Features, Ride Time, and Personal Driver Characteristics with Glances at the MPNA
It was necessary to ensure that no significant differences occurred between road features and personal driver characteristics for glances at the MPNA. In Table 1, it is apparent that the road type and ride time had no significant effect on the number and duration of glances at the MPNA (p > 0.05).
Relationship Between Road Features and Driver Glances at the Mobile Phone Navigation Application (MPNA)
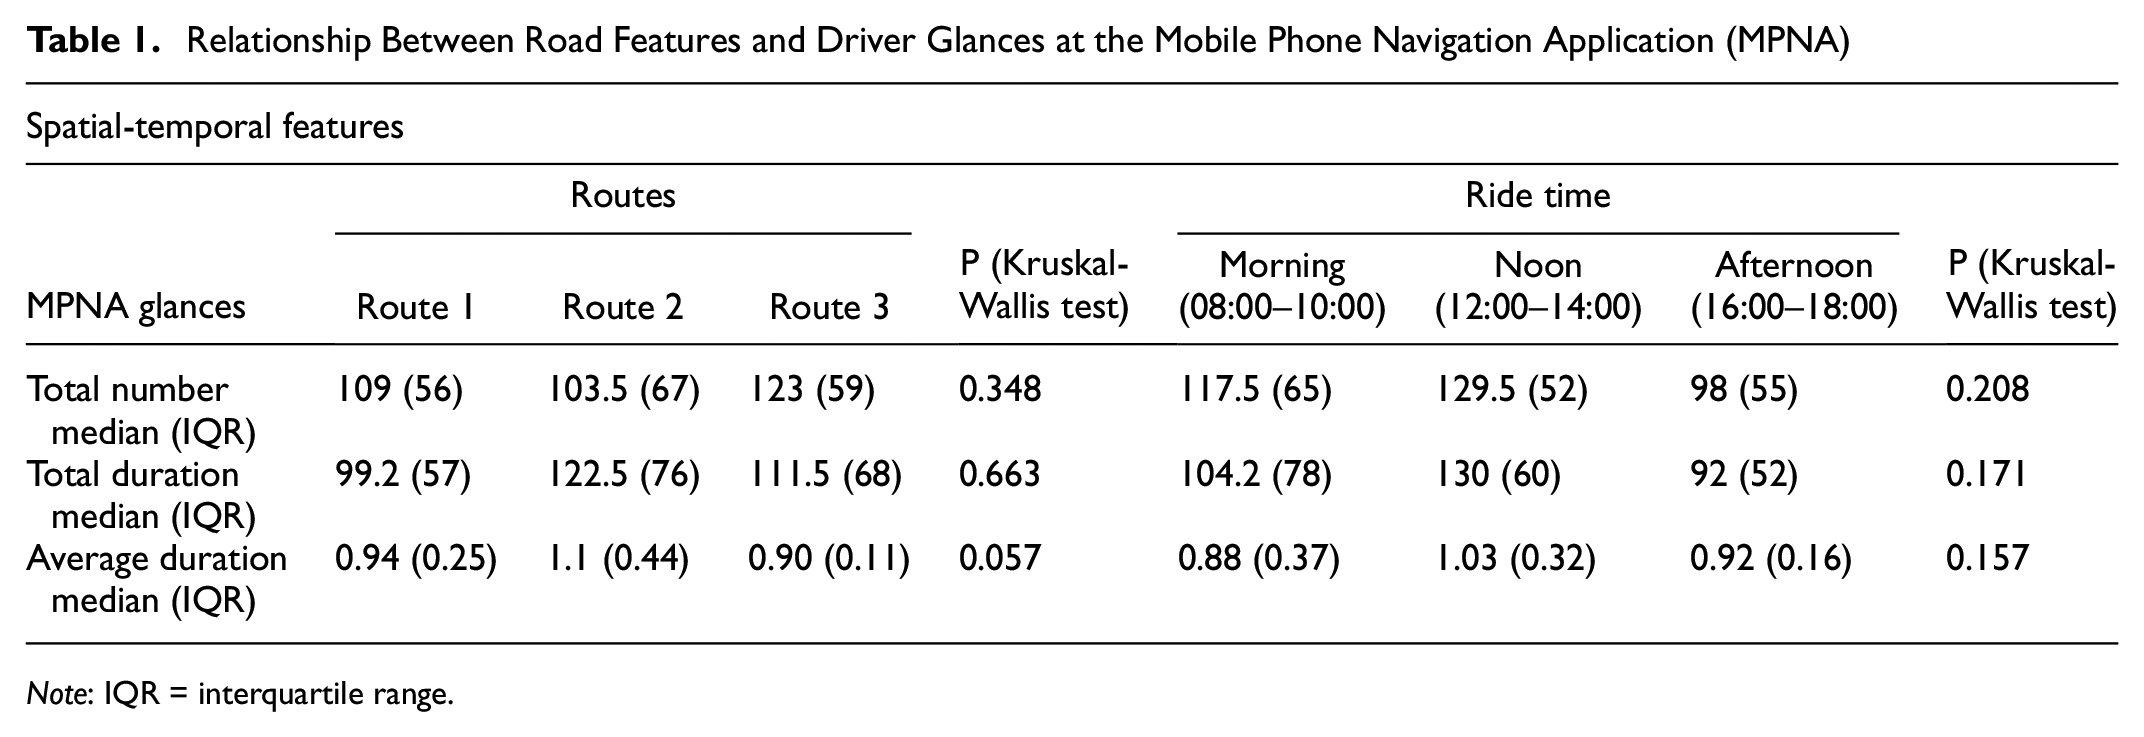
Note: IQR = interquartile range.
Table 2 also shows that there was no relationship between the drivers’ characteristics and number and duration of glances at the MPNA (p > 0.05).
Relationships of Drivers’ Characteristics with Number and Duration of Drivers’ Glances
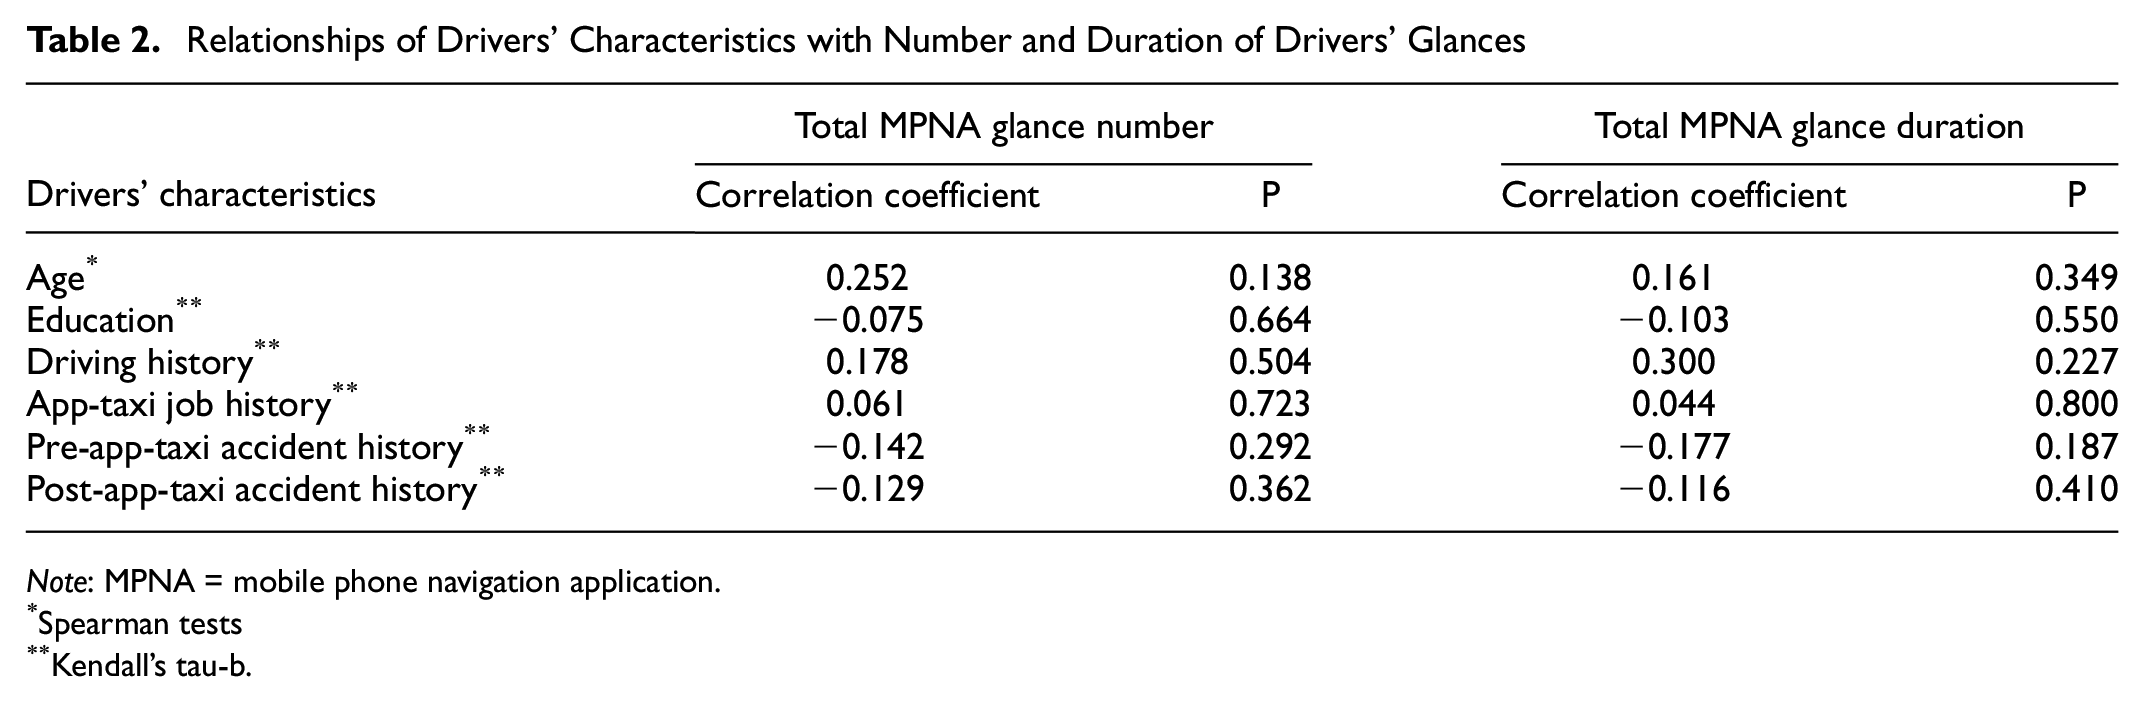
Note: MPNA = mobile phone navigation application.
Spearman tests
Kendall’s tau-b.
Therefore, the number and duration of MPNA glances in this study remained acceptably independent of characteristics of path, time, and driver.
MPNA Glance Number and Duration
Across the 36 routes, there was a combined total of 4,074 glances at the MPNA for 4,181 s. The average MPNA glance lasted 116 s. Tables 2 and 4 show the number and duration of MPNA glances.
List of RSREs
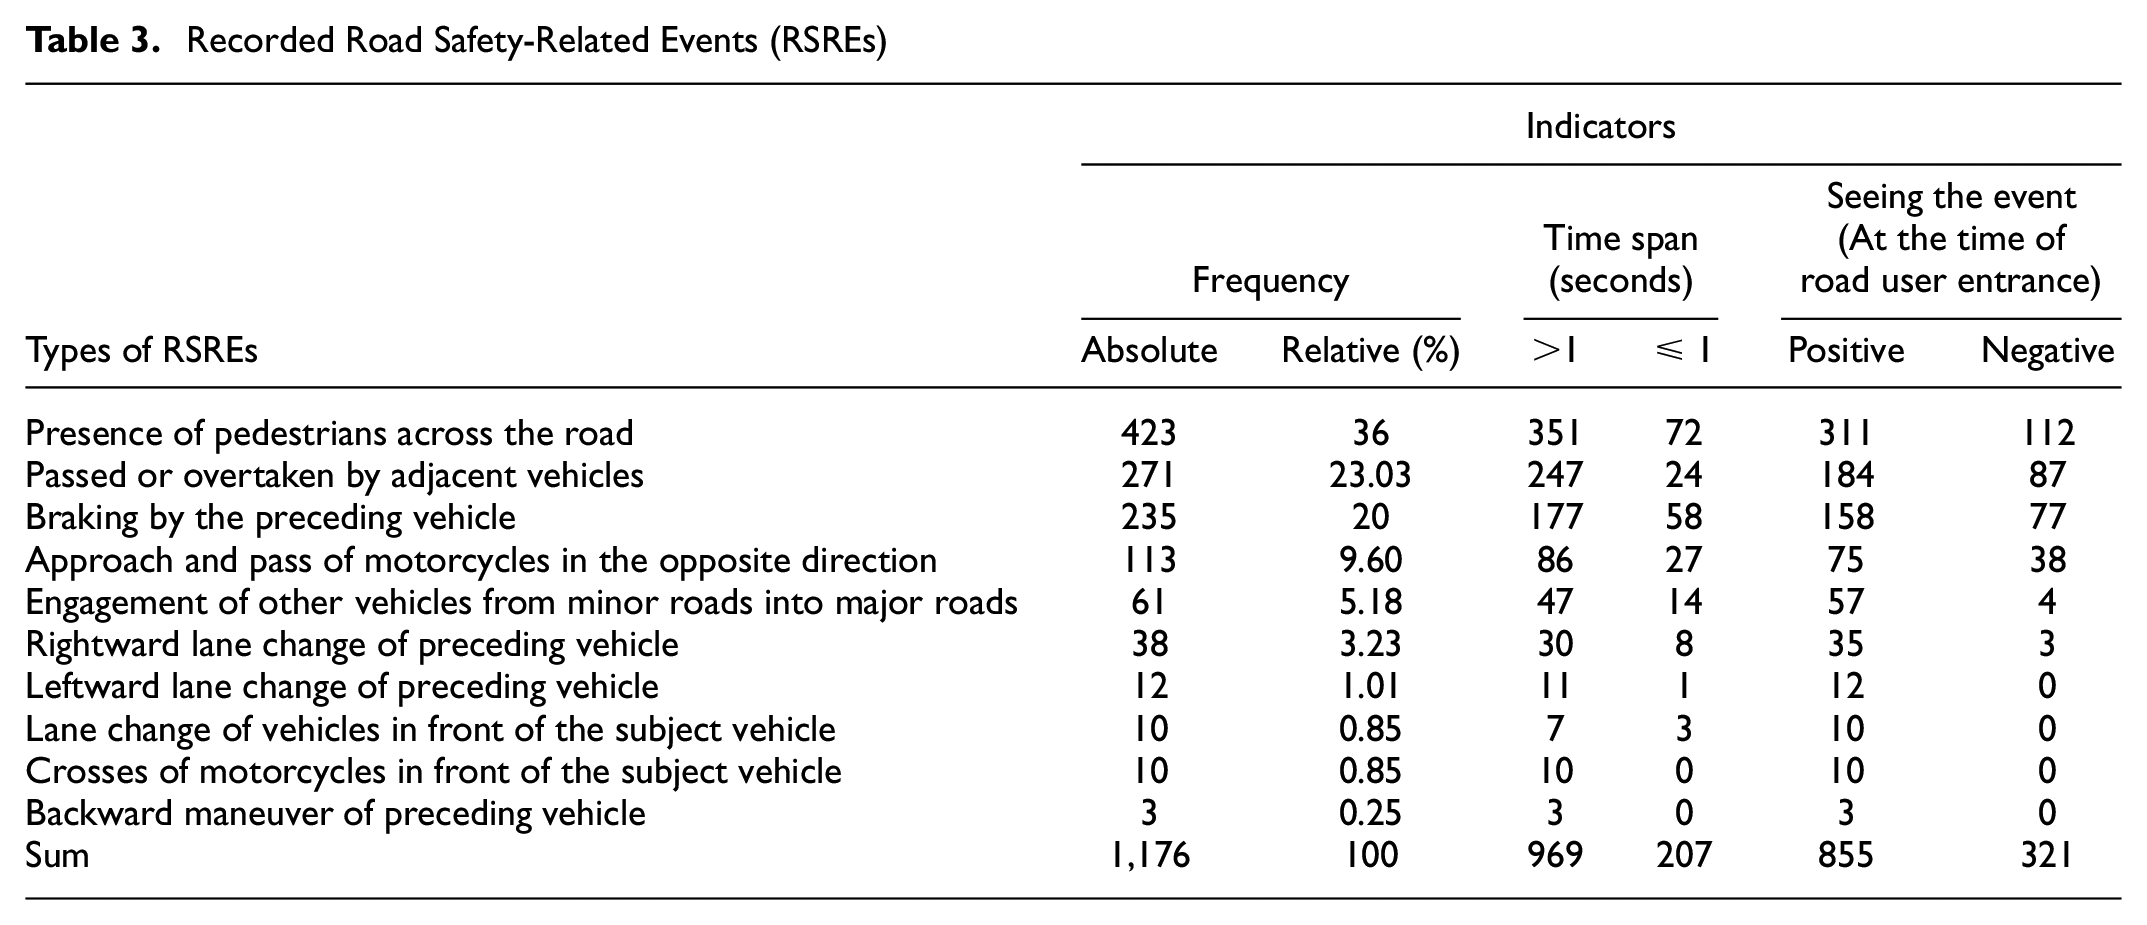
As reported in Table 3, in 36 studied routes, 1,176 events were recorded including 10 kinds of RSREs. The most and least repeated RSREs were “presence of pedestrians across the road” and “backward maneuver of preceding vehicle,” respectively.
Recorded Road Safety-Related Events (RSREs)
Relationships of TS and Seeing the Event with Drivers’ Personal Characteristics
The correlation of drivers’ characteristics with NseBvd and PseBvd was not confirmed (p > 0.5, r < 0.6). It was the same for the correlation of the number of MPNA glances, as well as the number of MPNA glances with NseBvd and PseBvd (Table 4).
Relationships of Time Span (TS) and seBvd with Driver Characteristics and MPNA Glances by Correlation Test
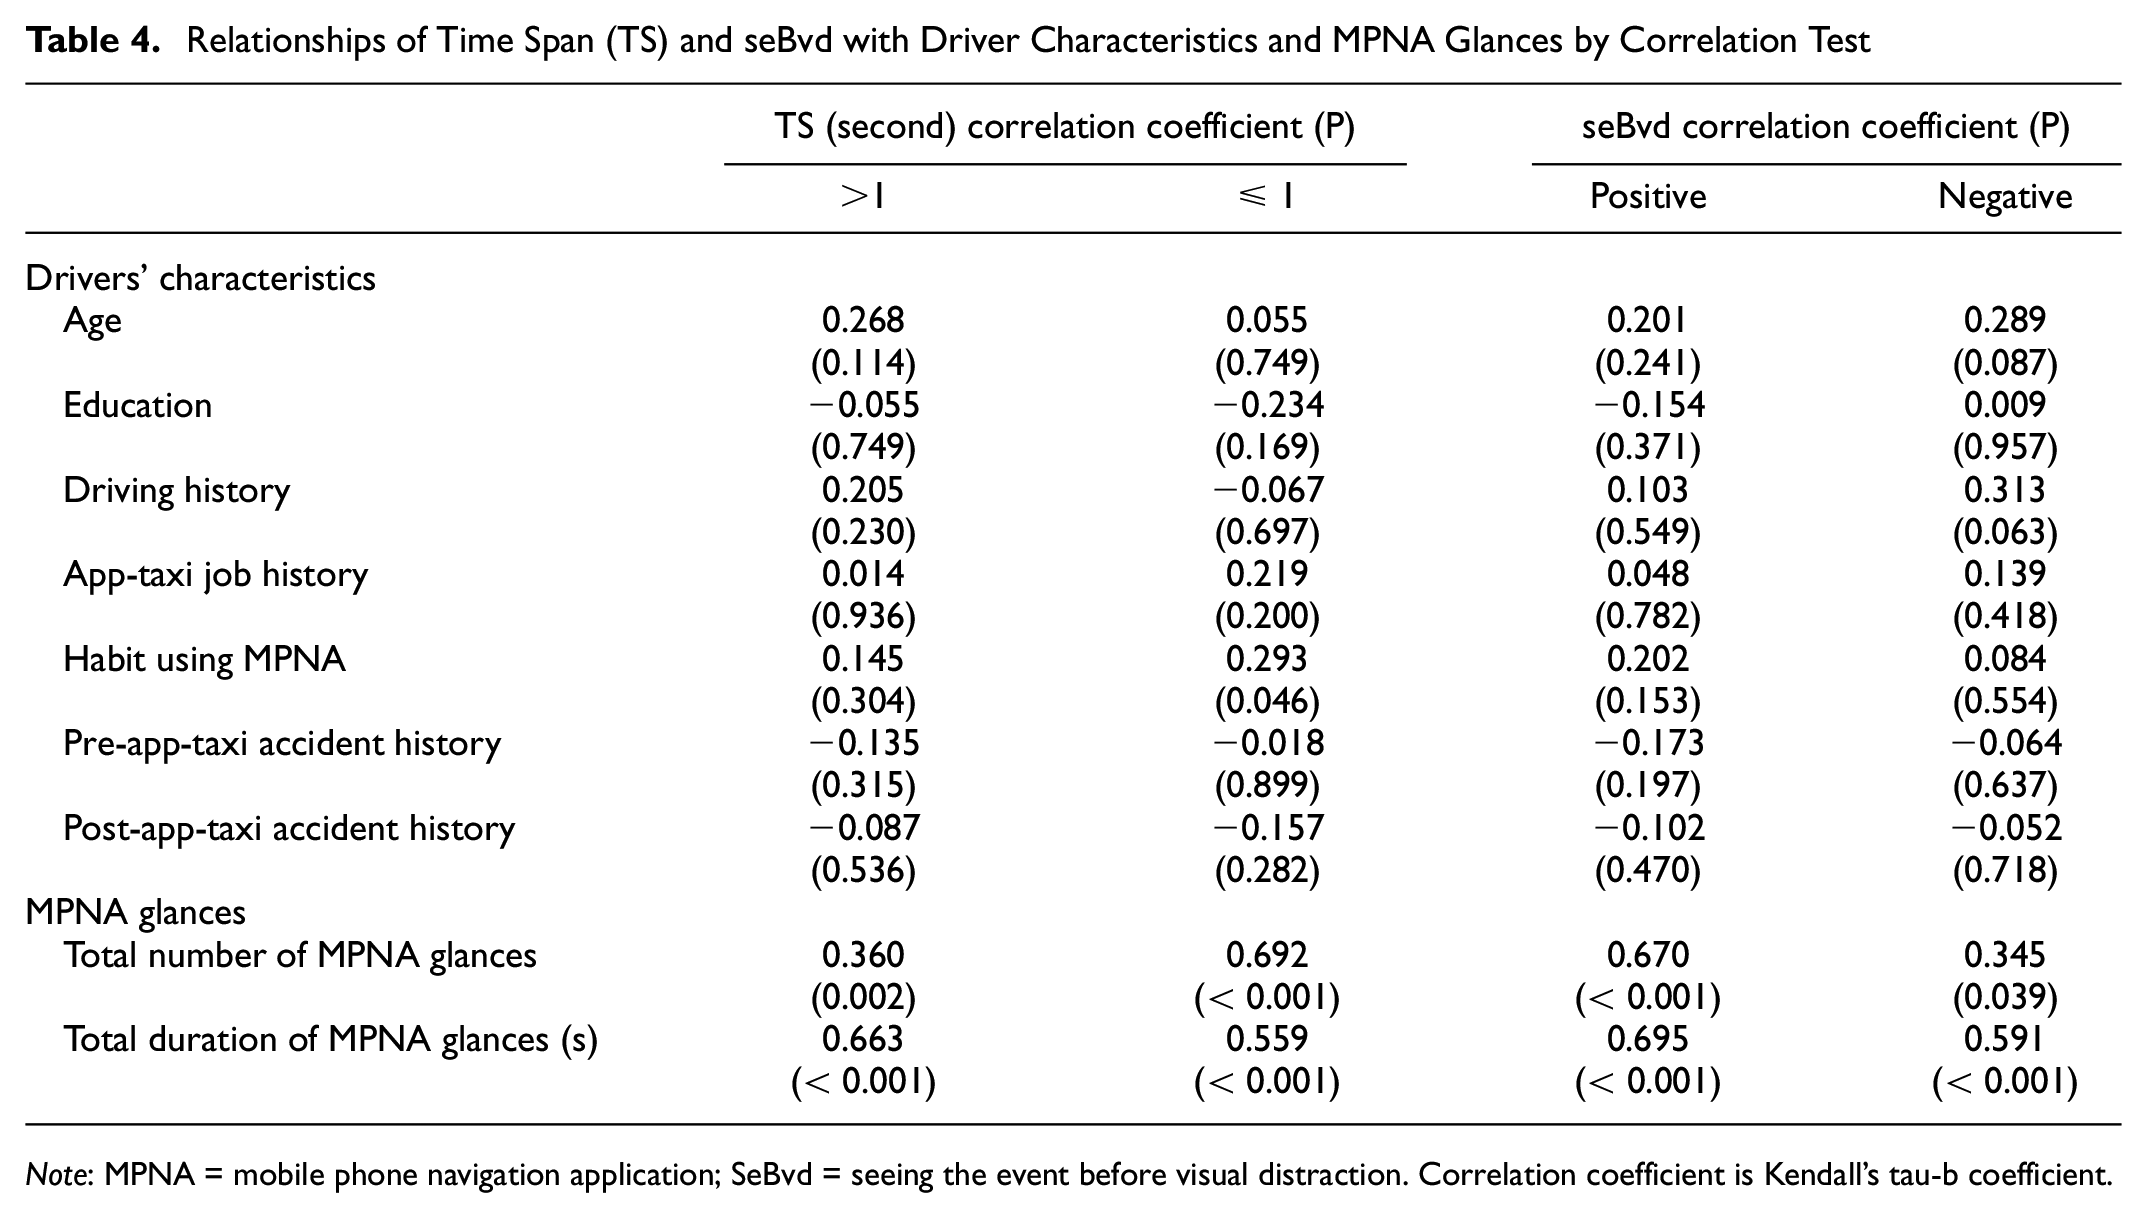
Note: MPNA = mobile phone navigation application; SeBvd = seeing the event before visual distraction. Correlation coefficient is Kendall’s tau-b coefficient.
The correlation of drivers’ characteristics with NseBvd was not confirmed (p > 0.05, r < 0.6). However, the number and duration of the MPNA glances had a significant correlation with PseBvd (p = 0.001, r > 0.6). The number of MPNA glances also had a significant correlation with TS ≤ 1 s (p = 0.001, r < 0.694). Finally, the total duration of MPNA glances had a significant correlation with TS > 1 s (p = 0.001, r = 0.653).
Proportion of Critical RSREs and the Incident Pyramid
While using MPNA, as mentioned in Safety evaluation criteria, a TS equal to one second or below between app-taxi and RSREs, as well as negative esBvd (NesBvd), were considered the critical RSREs. The ratio of critical events to the entire RSREs was then used for an easier understanding of the safety aspects of MPNA.
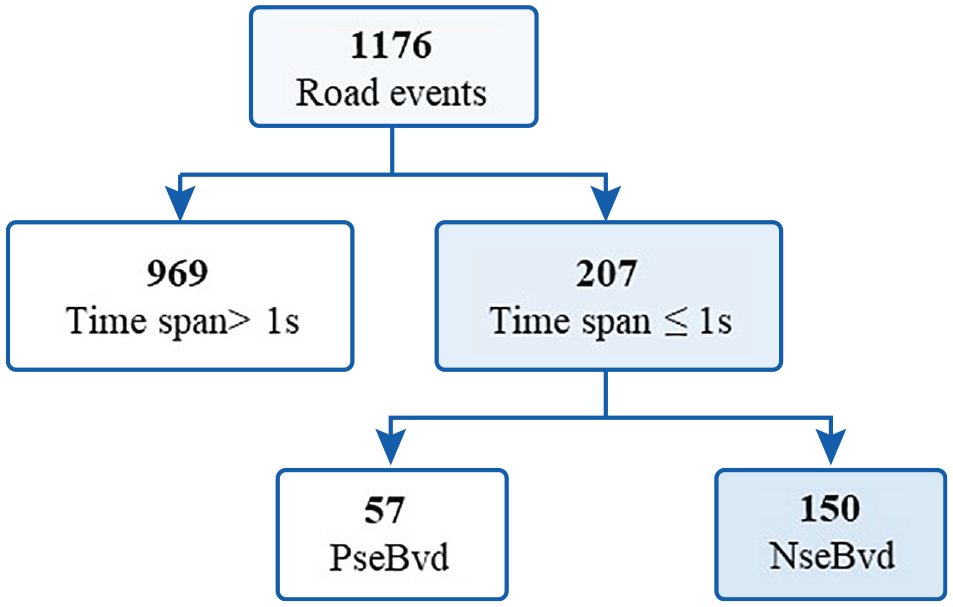
For less than 18% of RSREs, the TS between other road users and the app-taxi was less than or equal to one second. More than 70% of the drivers’ glances were at the MPNA at the time of road user entrance. However, the RSREs with TSL1 (TS ≤ 1 s) and NseBvd included only 21 events which were of three kinds (Figure 5): 1. Thirteen events of braking by the preceding vehicle 2. Six events of passed or overtaken by adjacent vehicles 3. Two events of the presence of pedestrians across the road.
Inspired by the previous accident pyramids ( 32 , 39 ), a new pyramid of safety-critical traffic events related to MPNA was introduced. By dividing the number of TSL1 by the number of NseBvd, and the same division for 1,176 RSREs, the number of safety-critical traffic events can be depicted in an order that forms a pyramid (Figure 6). This pyramid represents the ratio 8:1.4:1, which indicates the number of RSREs, TSL1, and Nsebvd to each other. No near-misses or crashes were observed.
Comparison of the frequency of road safety-related events (RSREs) while using mobile phone navigation application (MPNA) (based on TS ≤1 and seBvd).
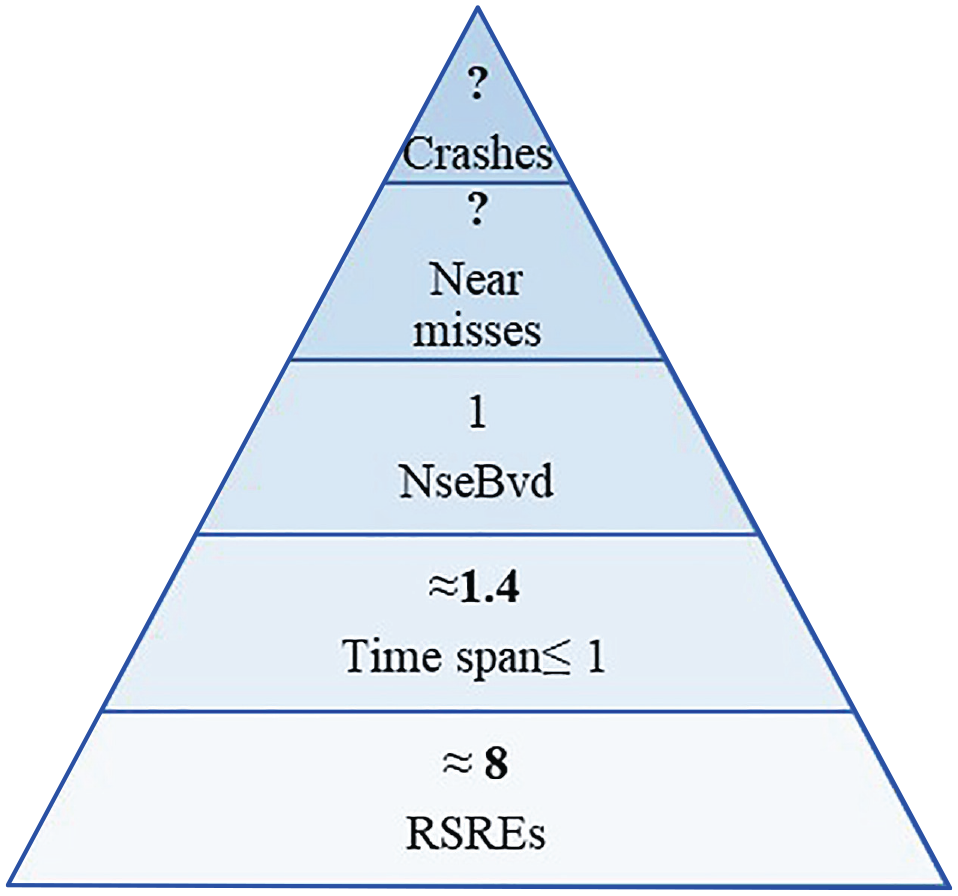
Traffic incident pyramid while using mobile phone navigation application (MPNA).
Discussion
This study aimed to achieve four goals. Since MPNA glances have been identified to be the most important off-road glance factor ( 65 ), the first goal was to have a list of RSREs that occurred while app-taxi drivers were glancing at MPNAs. Several studies have published lists of both internal (in-cabin) and external distraction factors ( 66 – 68 ). However, no list has been published on the simultaneous use of assistive visual navigation and RSREs. Hence, the proposed list in this study should prove useful for future studies.
Recorded observations showed a total of 1,176 RSREs in 10 kinds of events, with different frequency distributions (Table 3). Four types of these events encompassed about 90% of total RSREs: the presence of a pedestrian on the side of the street, passing or overtaking by an adjacent vehicle, braking by the vehicle in front, and approaching or passing a motorcycle in the opposite lane. These events are the most dangerous safety-related traffic events, which were repeatedly mentioned as sources of crashes ( 69 – 71 ). More specifically, the result revealed more than one-third of RSREs involved pedestrians. Since pedestrians are classified as vulnerable road users ( 72 ) and also considered the most unpredictable road users ( 73 ), this finding could be regarded as an alarming indicator of more fatal accidents occurring from using MPNA while driving.
As the second aim, following the first, the authors comprehended that a new indicator, an SSM related to cognitive processes, could be beneficial in analyzing the data. Given that safe driving requires looking at the route before looking at the MPNA, it can be expected that the opposite action may involve the driver in a dangerous traffic situation. Thus, the present study proposed the “seeing the event BEFORE visual distraction” (seBvd) indicator to determine the experience of RSREs for drivers at risk of visual distraction. Specifically, this indicator measures whether the driver saw the event before glancing at the MPNA, which is critical to maintaining the driver’s situation awareness. According to Kaber et al. ( 74 ), situation awareness depends on the driver’s perception of the elements of the road, their meaning to driving purposes, and the state of the vehicle, as well as the ability to anticipate short-term conditions of the road environment. Therefore, seBvd can be applied as a cognition-related SSM. This SSM is a binary indicator, so it does not require a cut-off point; therefore, it improves the likelihood of correct judgment of a dangerous situation, which is represented by NseBvd.
The third goal was to examine the effect of app-taxi drivers’ glances at MPNA on them missing RSREs. Therefore, it was necessary to ensure that the drivers’ distractions from using the visual navigation feature of the MPNA could not be attributed to the route, ride period, or driver characteristics. The results indicated that the route type and ride time period had no significant effect on the MPNA glance number and duration (Tables 1, 2, and 4).
The number of MPNA glances had a significant correlation with TS ≤1 s. However, it had no significant relationship with the total duration of MPNA glances. Despite this, the MPNA glance duration had a significant correlation with TS >1 s. Thus, it can be concluded that even though the frequency of MPNA glances increased at TS ≤1 s, the MPNA glance duration was short because of closeness to the event. However, when the event was at a TS longer than one second, the MPNA glance duration was longer (Table 3). This may be because the driver was unsure that he could make a timely response to the event if the interval approaching time decreased; that is, he chose a longer distraction time when he estimated a longer distance to an event. Using the Tobit model, Ahmed et al. ( 75 ) showed that if the driver’s distraction lasts from zero to two seconds, the loss of driving stability is close to 0.21. At a speed of 48.3 km/h, the probability of an accident varies by 8% to 12.47% in relation to changing the distraction time from less than one second to greater than or equal to three seconds. It seems the drivers in this study showed the same understanding, intuitively. The number and duration of MPNA glances increased as PseBvd increased. Thus, it can be concluded that most drivers took off-road glances when they were relatively assured that there would be no critical event. However, the generalization of the results may require further investigation.
As the fourth aim, a traffic incidents pyramid was proposed. This pyramid is a metaphor that illustrates the silent layer (RSREs) versus the voiced layer (accidents) in driving safety. As Rebbitt wrote ( 76 ), no image has been depicted more than the pyramid in the safety field. The notion of accident pyramids is not new and dates back nearly one century in occupational safety. The layers of occupational safety pyramids are separated based on the severity of human injuries (minor to fatal injuries), which conveys the concept that the repetition of incidents with no injury will eventually lead to severe accidents. To prevent a fatal injury, therefore, precautions should be taken against minor injuries. Although there is no agreement on the rate of occurrence of these layers relative to each other, the ratio of 300:29:1 is a well-known ratio ( 76 ). In traffic accident pyramids, for example, Hayden’s pyramid, with a similar concept, the severity of incidents was considered to distinguish the layers: traffic conflicts, near-misses, and crashes ( 77 ). The proposed pyramid added RSRE (silent layer) and NseBvd (a mediator SSM) to the previous traffic pyramids and extended the boundaries of knowledge for using MPNA in this field. This study also revealed a ratio of 8:1.4:1; that is, 1.4 out of every eight events may be one second or less interval between app-taxis and other road users. But this is not similar for TSL1 and NseBvd. There is a NseBvd event against only every 1.4 TSL1. This little difference between NseBvd and TSL1, again reminds us that the TSL1 is dangerous. Since no near-misses or crashes were observed in this study, the two top layers (near-misses and crashes as the voiced layer) remained with no number. To our best knowledge, no ratio has been published for other traffic accident pyramids.
Conclusion
This study provided a list of RSREs that occur during glances at the MPNA for app-taxis. The most frequent RSRE was the presence of pedestrians across the road. It implies that at least one of the reasons for the high rate of pedestrian injuries may relate to using MPNA. However, at least a part of the high contribution of pedestrian-related events can be explained by the present study being conducted on urban roads rather than highways or freeways.
Driver situation awareness, an important key to safe driving, will be destroyed in the absence of in-time input (seeing RSREs). Therefore, seBvd could be useful as an indicator to show in-time input.
None of the app-taxi driver characteristics (for example, age, driving history, app-taxi years of experience, and education) were found to influence the MPNA glance duration (p ≥ 0.138). It may be hasty to conclude that it does not seem necessary to control for these characteristics when considering the eligibility criteria of app-taxi drivers. However, because of the few participants in this study, more studies are needed to form a rigorous conclusion. Before that, more caution should be taken about these criteria.
Overall, the visual navigation feature of MPNAs may reduce road traffic safety. Moreover, while this study focused on MPNAs, it seems that the results might be extended to other distraction causes that result in an off-road glance duration of two seconds or less.
The present study obtained a list of events occurring in front of the vehicle during in-vehicle visual distraction of app-taxi drivers by the MPNA. A database of RSREs could be used to estimate how many near-collisions, NseBvd, damage, and injury crash events would occur for each fatal crash.
Limitations and Future Studies
The present study is one of the few real driving, on-road studies in this research field. Therefore, there are several limitations that could be considered in future studies, including the following: • There were a few participants, all of whom were male. Future studies should include more participants, including females. • The impact of the Hawthorne effect should be considered because of an observer being present in the taxis. This effect might lead to biased glance numbers and durations. Because of the same condition for all drivers, however, its impact on the proportions of events in the pyramid was most probably negligible. Nevertheless, future studies should limit any possible Hawthorne effect. • Only driving in urban streets was assessed. Future studies could consider other types of roads, including highways and freeways. • App-taxi services have been present in Tehran for seven years, at the time of writing. Future studies may evaluate app-taxi drivers with more experience or how greater experience over time affects the results. • There was no example of a near-miss or an accident following visual distractions in this study, so the top cell of the pyramid could not be judged. Future studies should ensure there are sufficient data to provide examples of all different types of accidents. • The events do not all represent equivalent levels of risk. For further research, it is recommended to notice the risk level of any type of event.
Footnotes
Author Contributions
Samira Zaidi: data collection, draft manuscript preparation. Mostafa Pouyakian: study concept and design, interpretation of results. Kourosh Kamali: study design, analysis and interpretation of results. Shirazeh Arghami: study concept and design, interpretation of results. All authors: reviewed the results and approved the manuscript.
Declaration of Conflicting Interests
The author(s) declared no potential conflicts of interest with respect to the research, authorship, and/or publication of this article.
Funding
The author(s) disclosed receipt of the following financial support for the research, authorship, and/or publication of this article: This article was extracted from a thesis titled Investigating the Events (in Front of the Car) While Internet Taxi Drivers Using A Digital Navigator, which was financially supported by Zanjan University of Medical Sciences with grant number IR.ZUMS.REC.1398.144.
Availability of data
The data used to support the findings of this study are available from the corresponding author on reasonable request.