
Abstract
The asphalt community is focused on the paradigm shift in mixture design from volumetrics to an optimization procedure based on performance tests called balanced mixture design (BMD). Laboratory performance tests are being assessed for their relationship to binder properties and field performance. However, existing BMD practice does not account for long-term oven aging (LTOA). This gap limits the appropriateness of thresholds and the potential of BMD for improving pavement performance. The Federal Highway Administration’s Asphalt Materials Research Program has launched a three-phase study to provide insights into relevant performance testing. Phase I compared seven cracking performance tests after short-term aging, whereas Phase II evaluated the sensitivity of selected performance tests to LTOA. Phase III, in which seven loose mixtures collected from Montana, Vermont, Ohio, and Florida were subjected to LTOA, is presented in this paper. The indirect tensile cracking, Illinois Flexibility Index, dynamic modulus, and cyclic fatigue tests were employed before and after two proposed LTOA conditioning protocols. Additionally, chemical, rheological, and fracture properties were obtained from extracted binders to obtain a better understanding of the impact of binder properties on mixture performance indices. Results illustrate that LTOA is critical for a comprehensive BMD framework and, thus, some of the testing protocols, indices, and thresholds need to be refined further.
Keywords
Fatigue cracking has always been a challenging issue for asphalt pavements. It is one of the primary distresses and occurs because of repeated loading on the pavements. Aging in asphalt pavements has been recognized and studied for almost a century. Hubbard and Reeve ( 1 ) published the results of an initial study that examined the effects of a year of outdoor weathering on the physical (weight, hardness, etc.) and chemical (solubility) properties of paving-grade asphalt cements. Subsequent studies confirmed their basic finding that oxidation and not volatilization alone is responsible for changes that occur in asphalt properties because of exposure ( 2 – 4 ). Further oxidative aging of asphalt is a long-held area of both curiosity and concern for material engineers. As the asphalt materials age, the cracking susceptibility of these mixtures changes over time. More recently, several researchers have proposed that asphalt mixtures should be long-term aged in the loose state ( 5 – 9 ). The rate of oxidation increases at higher temperatures and, thus, many researchers have proposed loose mixture aging at 135°C as an efficient alternative to the AASHTO R 30 aging protocol ( 8 ). It is also mentioned that chemical changes occurring when loose mixtures are aged at 135°C can lead to significantly different cracking performance results compared with materials testing and pavement simulations for aging at 95°C ( 5 ). Thus, the National Cooperative Highway Research Program (NCHRP) has initiated research and investigated loose mixture aging versus compacted specimen aging, oven aging versus pressure aging, and a 95°C aging temperature versus a 135°C aging temperature ( 5 ). Based on the results, conditioning loose mixture in the oven at 95°C is proposed as the long-term aging (LTA) procedure for fabrication of asphalt mixture performance test specimens ( 5 , 10 ).
The Federal Highway Administration (FHWA) has started a three-phase project called the Mixture Performance Test Comparison Study, in which Phase I focused on an objective evaluation of intermediate temperature performance tests after short-term oven aging (STOA), which is included in current balanced mixture design (BMD) frameworks. Phase II focused on comparing aging approaches, particularly whether equivalence between LTA procedures exists, and on highlighting the sensitivity (or lack thereof) of common laboratory mixture performance tests. In this paper, the results from Phase III of the project are presented. Phase III is intended to investigate the impact of LTA on mixture performance, and plant-mixed, laboratory-compacted mixtures from four states were subjected to long-term oven aging (LTOA). Three commonly discussed cracking performance tests from Phases I and II were applied in Phase III: the asphalt mixture performance tester (AMPT) cyclic fatigue test; the Illinois Flexibility Index test (I-FIT); and the indirect tensile asphalt cracking test (IDEAL-CT). The tests were selected after reviewing the results from Phases I and II and the technical input from stakeholders.
Literature Review
This section consults the literature for details relevant to the experimental plan and results. Of importance for subsequent discussion are topics such as the development of laboratory aging procedures, considerations in relation to asphalt chemistry, emerging BMD tests and indices, and the sensitivity, or lack thereof, of the various mixture cracking indices to LTOA conditioning procedures.
Mixture Laboratory STOA and LTOA Procedures
Currently, AASHTO R 30 is the standard method for LTOA of asphalt mixtures. In this method, mixtures in the loose state are conditioned at 135°C for four hours to simulate STOA. This application is specified when performance testing will be required. Following this, STOA mixtures are compacted, and for some test methods specimens are cored and cut to required dimensions and then placed in a forced draft oven. The long-term field aging simulation is conducted at 85°C ± 3°C for 120 ± 0.5 h. The current method has various drawbacks: it requires the same conditions regardless of temperature history and climatic region of the pavement of interest; it underestimates LTA levels in surface mixtures and warmer climates; and because of its compacted orientation it may lead to the development of an oxidation gradient from the specimen’s center to its periphery ( 6 ). The existence of such a gradient violates the representative volume element requirement for performance testing ( 6 ). More recently, several researchers have proposed that asphalt mixtures should undergo LTA in the loose state ( 6 – 9 ). Loose mixture aging produces uniform aging and expedites the oxidation rate because it promotes oxygen exposure to a larger surface area of the material. Studies have shown that LTOA mixtures can be compacted with no adjustment to the compaction temperatures ( 6 ). It is still expected that a laboratory loose mix oven aging protocol will have its own limitations, and it is not a perfect simulation of field aging.
Many researchers have proposed aging of loose mixture at 135°C as an alternative to the AASHTO R 30 aging protocol ( 8 ). However, it is well documented in the literature that the use of aging temperatures above 100°C can alter reaction kinetics, disrupt polar molecular associations, lead to further oxidation of sulfoxides to sulfones, and possibly degrade polymers ( 5 , 9–12). Moreover, these studies have shown that the impact of aging at 135°C on reaction kinetics is highly dependent on binder chemistry. Furthermore, the chemical changes that occur when loose mixtures are aged at 135°C can lead to significantly different cracking performance results compared with the material testing and pavement simulations for aging at 95°C ( 5 , 9 ). Thus, NCHRP Project 09-54 recommended aging of loose mixtures at 95°C to avoid potentially unfavorable alterations to binder oxidation chemistry and its possible impact on laboratory mixture performance ( 5 , 10 ).
Mixture Performance Tests after Laboratory LTA Conditioning
This section will use the literature to discuss the various mix performance procedures and their sensitivity, or lack thereof, to oxidative aging.
IDEAL-CT
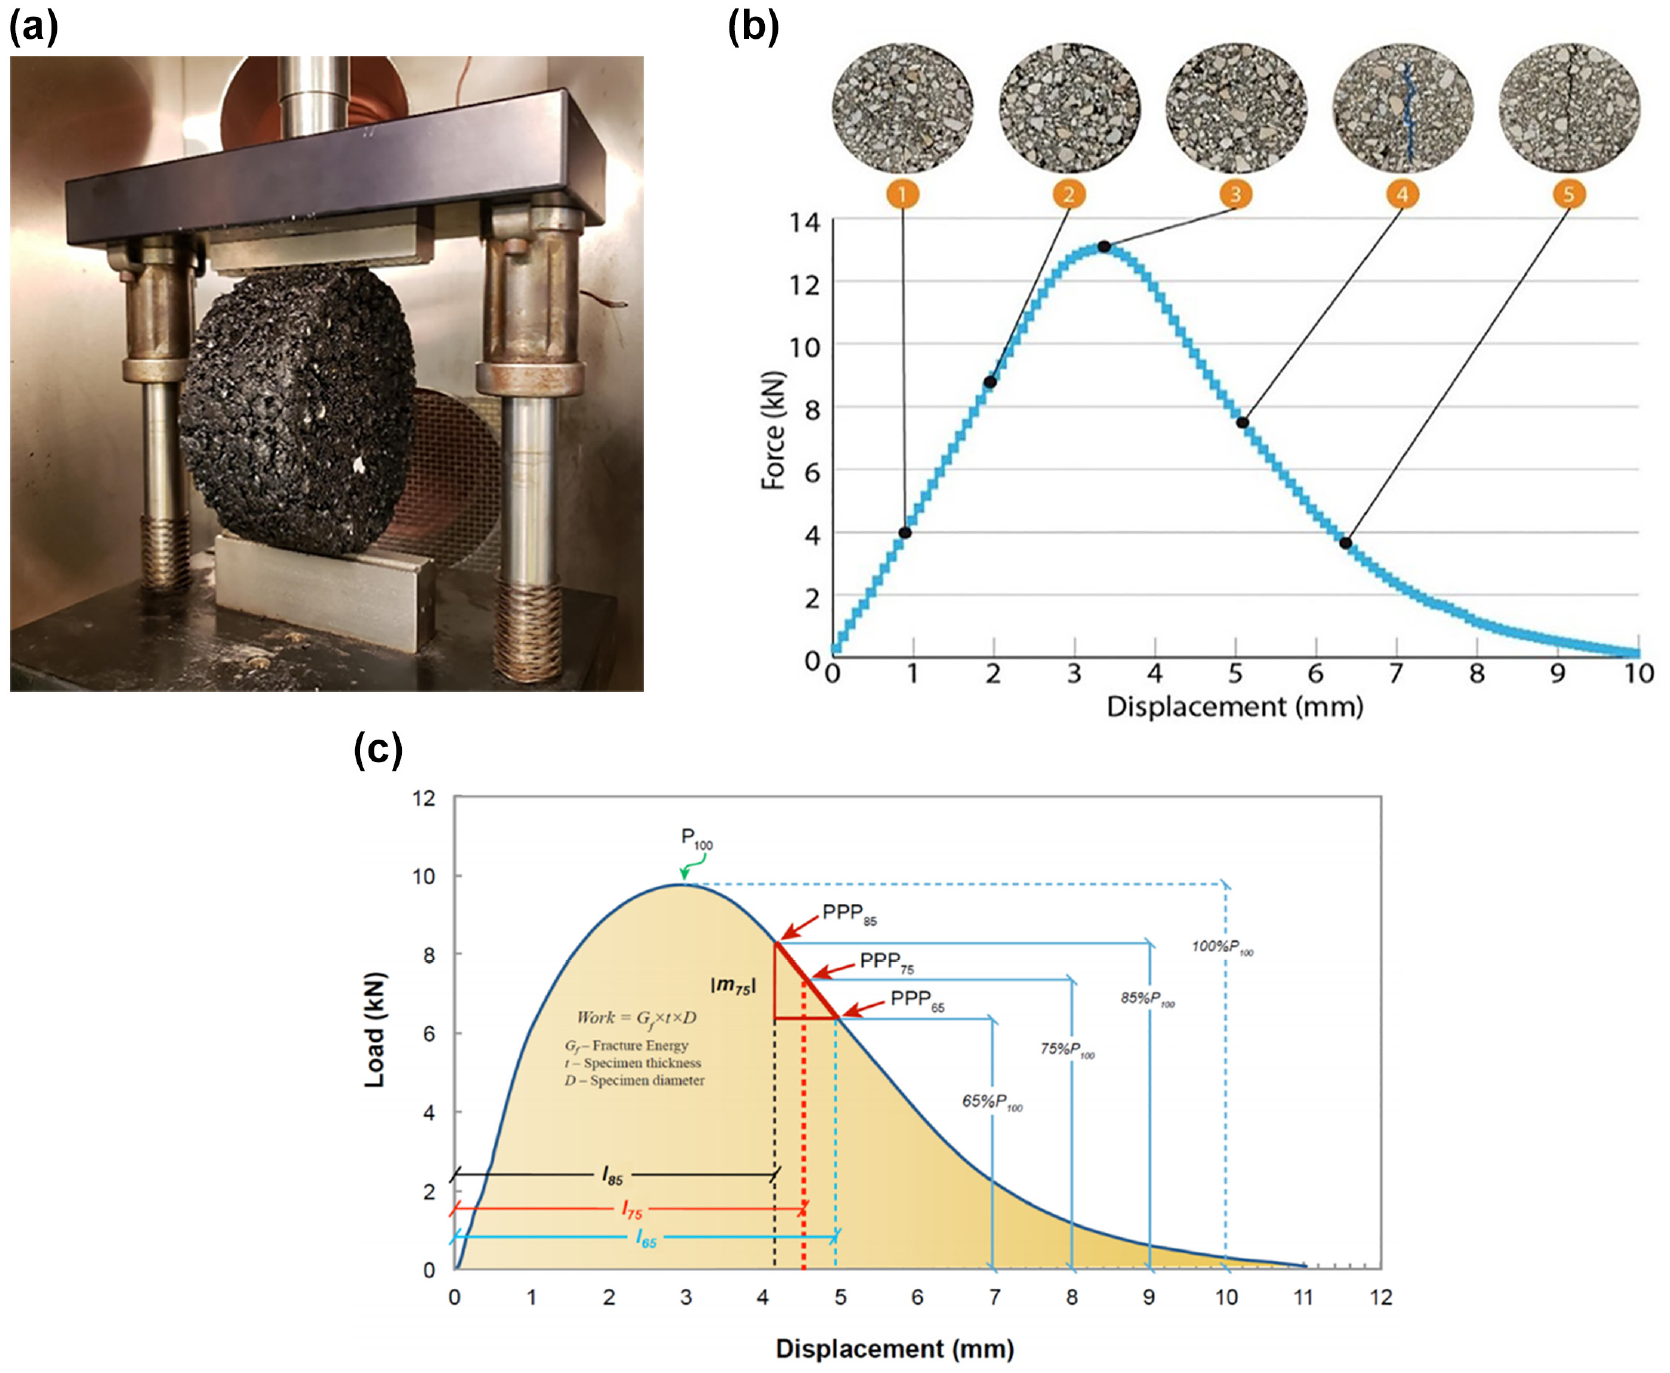
Researchers at the Texas Transportation Institute (TTI), Zhou et al. ( 13 ) have developed the IDEAL-CT for asphalt mixtures. This test is performed in accordance with ASTM D8225 on specimens 62 mm thick at 25°C with an actuator displacement rate of 50 mm/min to obtain the cracking tolerance index (CTIndex). A universal servohydraulic loading machine was used for this test, see Figure 1a. Note that ASTM requires a compliance correction when this type of equipment is used. The CTIndex is calculated from the failure energy, the post-peak slope of the load-displacement curve, and the deformation tolerance at 75% of the peak load, as shown in Figure 1b. The |m75| term is expressed as the slope from the strain tolerance at 85% of the peak load downward to the strain tolerance at 65% of the peak load. The PPP75 term can also be expressed as the deformation at 75% of the peak load (l75) divided by the specimen diameter (D) as shown in Figure 1c. The equation without thickness correction is provided in Equation 1. A higher CTIndex value is intended to represent greater cracking resistance of asphalt mixtures.

In relation to the index sensitivity to aging, results from Phase II of the FHWA’s research project showed that STOA has a higher cracking resistance index compared with LTOA at 95°C and 135°C ( 14 ).
I-FIT
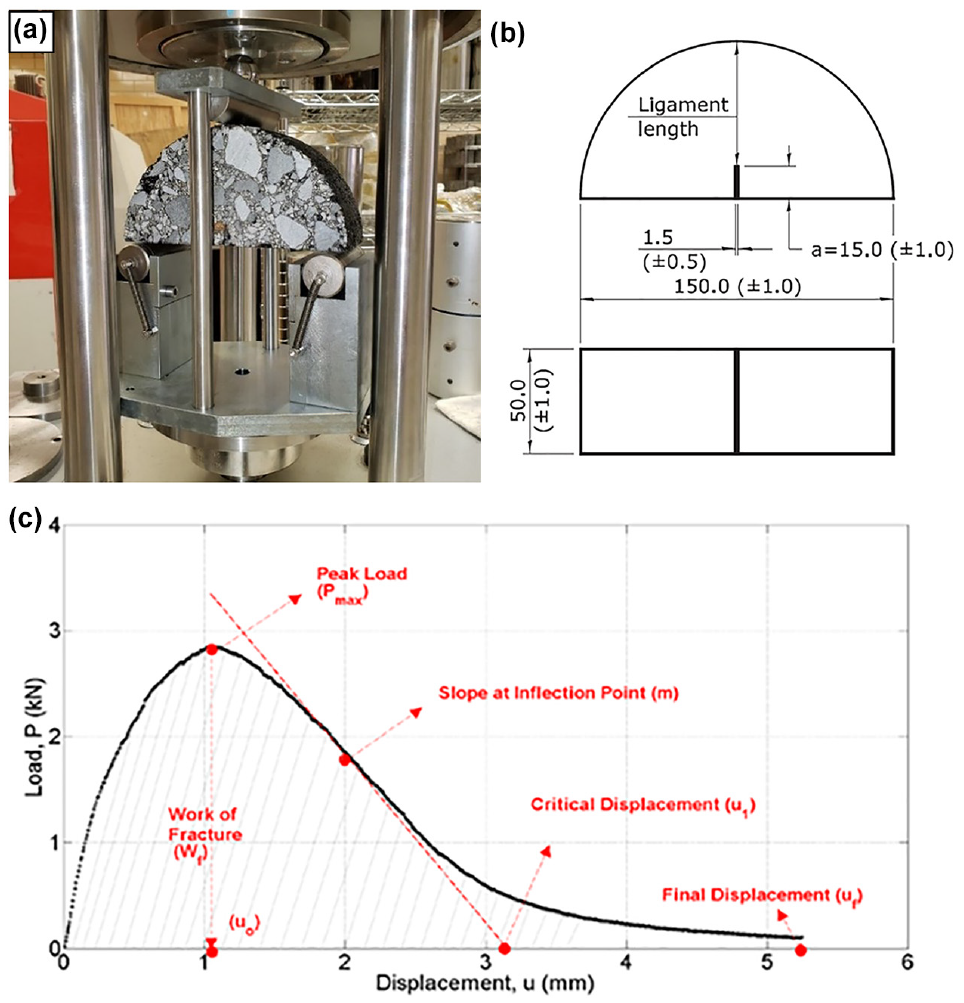
The I-FIT was developed in collaboration with the Illinois Department of Transportation to assess the resistance of asphalt mixtures to crack propagation using the Flexibility Index (FI), an index that was first introduced in Al-Qadi et al. ( 15 ). In this study, the I-FIT was conducted in accordance with AASHTO TP 124. The research team used a 50 mm-thick semicircular specimen tested at 25°C and a load-line displacement rate of 50 mm/min using the AMPT, as shown in Figure 2, a and b . This test utilizes the fracture energy, Gf, (area under load-line displacement curve divided by ligament area) in combination with the slope of the inflection point of the post-peak portion of the load-displacement curve (|m|). Figure 2c shows the schematic derivation of the FI and Equation 2 is used to calculate the index ( 15 ). A higher FI value is intended to represent greater cracking resistance.

The results from NCHRP Project 09-58 showed that the FI decreased by 50% or more in most test cases when comparing STOA (2 h, 135°C) and LTOA (5 days, 85°C on compacted specimens) ( 17 ). Another study by Ling et al. ( 18 ) showed strong sensitivity of the FI when comparing 4 and 12 h of aging at 135°C in a loose mixture state. Materials in this study included many different aggregate sources, filler contents, and asphalt contents for multiple intended traffic levels. Phase II of FHWA’s research project showed that STOA has a higher cracking resistance index value compared with LTOA at 95°C and 135°C ( 14 ).
AMPT Dynamic Modulus Test
Dynamic modulus (|E*|) is a fundamental property that defines the strain response characteristics of asphalt concrete mixtures as a function of loading rate and temperature that can be achieved by running the dynamic modulus test using the AMPT as recommended by NCHRP Project 9-19 ( 19 ) and developed in NCHRP Project 9-29 ( 20 ). |E*| testing is performed according to AASHTO T 342, T 378 (100 mm-diameter test specimens), and AASHTO TP 132 (38 mm-diameter test specimens). Both specimen types are cored and cut from gyratory-compacted samples. This study utilized AASHTO TP 132 for testing |E*| for small specimens. Additionally, some research has been conducted to evaluate |E*| and mixture phase angle (δ) in degrees as performance indices, particularly because they relate to cracking resistance. The incorporation of linear viscoelastic (LVE) properties offers the potential for understanding stress relaxation, an important influence on cracking susceptibility.
AMPT Cyclic Fatigue Test
The AMPT cyclic fatigue test is one of the fatigue cracking tests that has recently received attention from the pavement community. This test employs viscoelastic continuum damage principles to characterize a material’s fatigue resistance and is intended to represent the impact of both stiffness and toughness on mixture performance ( 21 , 22 ). Apparent damage capacity (Sapp) is the cyclic fatigue cracking test index used in this study. The AMPT cyclic fatigue testing was executed in accordance with AASHTO TP 133, which utilizes 38 mm-diameter and 110 mm-height cylindrical specimen geometry. The tests were run in a pull-pull actuator displacement-controlled fashion at 10 Hz loading rate and the testing temperature (determined as the average climatic performance grade [PG] temperature—3°C, according to AASHTO TP 133). Three test specimens at different on-specimen strain targets were used for each mixture. Users need to conduct cyclic fatigue tests to understand the initiation and progression of damage as well as dynamic modulus tests to capture the LVE response. Coupling the two tests allows for calculation of the Sapp, as shown in Equation 3, as well as inputs for structural response modeling (out of scope of this effort). A higher index value should translate to greater cracking resistance of the mixture.

where
Sapp = apparent damage capacity,
α = material constant derived from slope of relaxation modulus master curve in log-log scale,
aT = time-temperature shift factor from dynamic modulus master curve,
DR = average reduction in pseudostiffness per cycle,
C11, C12 = damage characteristic curve fit coefficients, and
|E*| = dynamic modulus at reference temperature and 10 Hz, kPa.
The Sapp index is sensitive to changes with loose mixture aging ( 10 – 23 ). The Phase II results from FHWA’s study show that, in general, STOA has a higher crack resistance index value compared with LTOA at 95°C and 135°C ( 14 ).
Findings from Recent National Studies
In a collaborative study by the National Center for Asphalt Technology (NCAT) and the FHWA, Chen et al. ( 24 ) evaluated four surface mixes in the NCAT top-down cracking experiment to validate two candidate laboratory protocols of loose LTOA for 5 days at 95°C and 8 hours at 135°C. Specimens were tested using I-FIT, IDEAL-CT, and the small-specimen AMPT cyclic fatigue test. The study concluded that the two LTOA conditions had a significant impact on reducing the fatigue and cracking resistance of asphalt binders and mixtures. The I-FIT results showed no significant difference between the two aging conditions (5 days at 95°C and 8 h at 135°C). The IDEAL-CT results reached a general consensus that the 8 h, 135°C aging was more severe and detrimental than the 5-day, 95°C aging. However, the opposite trend was observed for the majority of the cyclic fatigue test results. Additionally, the cyclic fatigue and double-edge notched tension (DENT) test results showed a more significant deterioration in the fatigue and cracking resistance of mixture S6 (containing the HiMA binder) after aging at 135°C for 8 h compared with aging at 95°C for 5 days ( 24 ). These results suggest that styrene–butadiene–styrene (SBS) polymers are more susceptible to thermal degradation when exposed to higher conditioning temperatures. Therefore, caution should be exercised when using the 135°C loose mix aging protocol for polymer-modified mixtures.
Mensching et al. (
14
) evaluated five mixtures with different base binders and reclaimed binder ratios from reclaimed asphalt pavement (RAP) and reclaimed asphalt shingles (RAS) at a reheated state (STOA) and using two emerging LTOA procedures. Four intermediate temperature performance indices were captured in the laboratory. Comparisons were made between the LVE aging index log (
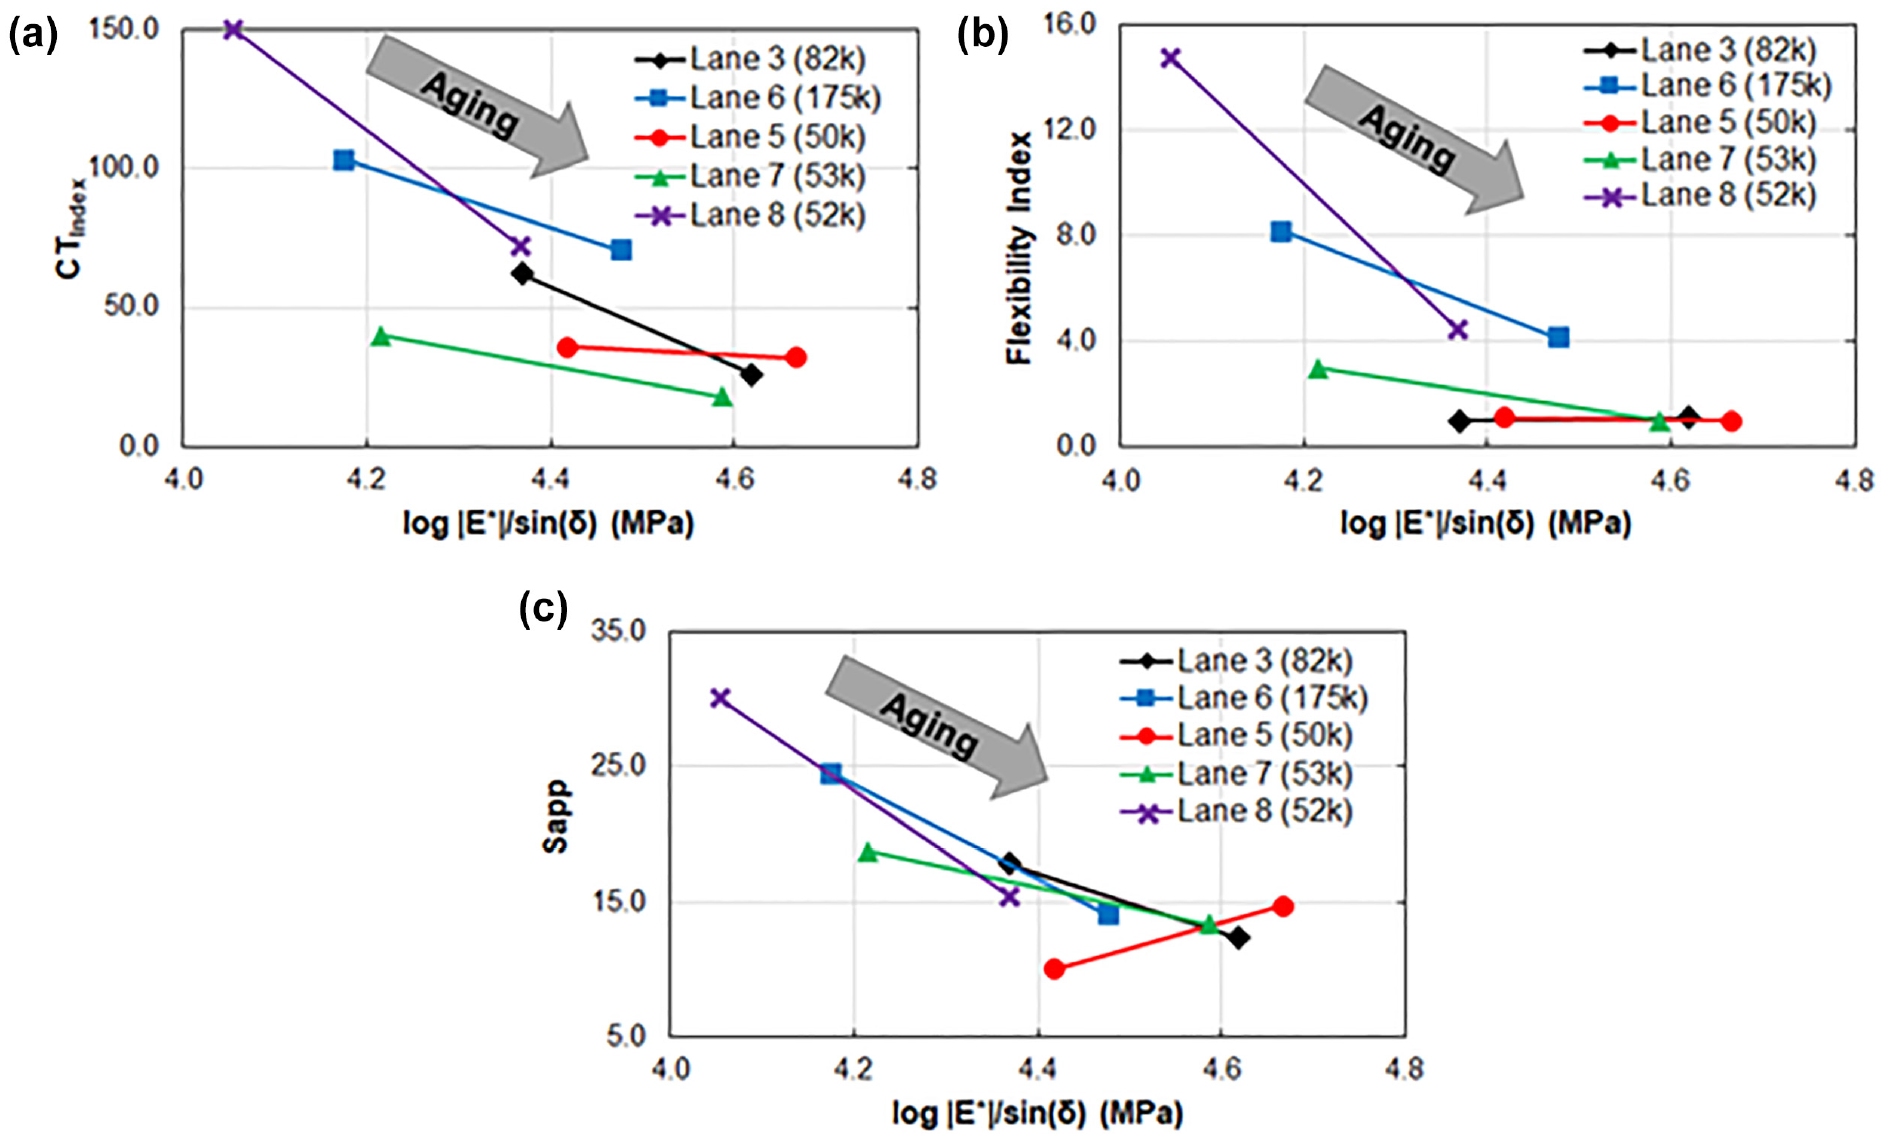
Relationship between cracking test indices and log |E*|/sin(δ) for (a) CTIndex, (b) FI, and (c) Sapp.
The aforementioned studies provided useful insights. However, further efforts are needed to confirm current observations reported in the literature using new pavement sections, material types and sources, mix designs, recycled materials, and additives. This paper summarizes continued efforts underway at the FHWA’s Turner–Fairbank Highway Research Center in relation to mixture performance tests.
Objective and Scope
This study evaluates the sensitivity of BMD indices to binder properties and laboratory LTA conditioning protocols. The objectives of this study are summarized as follows:
highlight the need to consider LTOA conditioning for a comprehensive BMD framework;
evaluate the sensitivity of various cracking performance tests and indices to LTOA conditioning;
demonstrate the application of aging duration maps for LTOA at 95°C for BMD and the impact of altered LTOA kinetics at temperatures above 100°C on cracking performance indices; and
understand the impact of binder type and properties on mixture cracking performance indices.
Data highlighted in this work were gathered as part of Phase III of the FHWA’s Mixture Performance Test Comparison Study. The objective of this parent study is to provide information to the community with regard to intermediate temperature performance tests and their relationships to known field performance. In an effort to reduce variability resulting from multiple operators, one technician prepared all mixture specimens, and another technician tested all specimens. Both technicians have approximately 35 years of experience in an asphalt materials research laboratory.
Experimental Program
Materials
The investigation’s mixture specimens are plant-mixed, laboratory-compacted materials from Florida, Montana, Ohio, and Vermont. The mixtures represent different nominal maximum aggregate sizes (NMAS) and various RAP percentages, as shown in Table 1. Each mixture is labeled as State–NMAS–%RAP. For example, FL12.5R00 reads as the mixture from the state of Florida, with a 12.5 mm NMAS and 0% RAP.
Mixture Details and Volumetric Properties
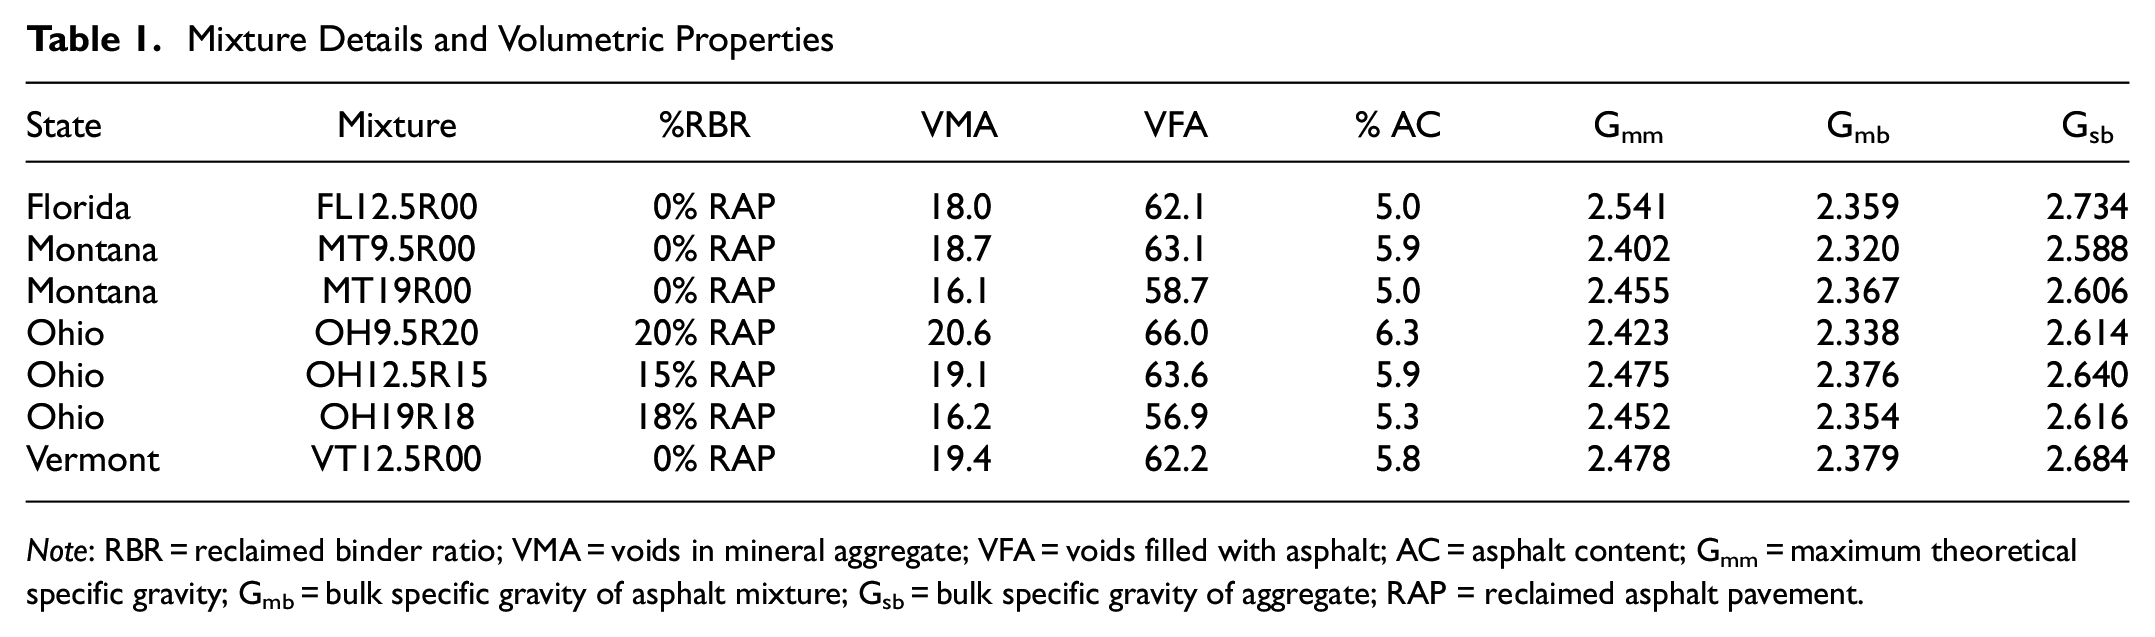
Note: RBR = reclaimed binder ratio; VMA = voids in mineral aggregate; VFA = voids filled with asphalt; AC = asphalt content; Gmm = maximum theoretical specific gravity; Gmb = bulk specific gravity of asphalt mixture; Gsb = bulk specific gravity of aggregate; RAP = reclaimed asphalt pavement.
Laboratory LTA Conditioning Procedures
In this study, plant-produced mixtures were reheated before LTA. No further short-term conditioning was required for plant-produced mixtures. Two loose LTOA procedures were employed after stakeholder input was gathered.
Selected Laboratory Aging Duration Maps at 95°C
The first procedure is from NCHRP Project 09-54, which relies on oven conditioning at 95°C. Elwardany et al. ( 11 ) generated a series of maps detailing the LTOA duration to simulate conditions across the U.S.A. for various target service times and depths from the surface. Based on the Climate Aging Index, as detailed in NCHRP Report 871 ( 5 ), loose mixture aging durations at 95°C required to match 8 years of field aging at a depth of 20 mm below the surface are shown in Figure 4. A depth of 20 mm is reasonable for the evaluation of surface layer asphalt mixtures because it is a better reflection of bulk behavior of the top 2 in. of the pavement structure. This approach can be stated simply as a lower-temperature, longer-duration aging method for loose mixture. Based on Figure 4, the research team selected the following durations at 95°C to match 8 years of field aging at 20 mm below pavement surface: 7 days for Florida mixtures, 4 days for Ohio mixtures, and 3 days for Montana and Vermont mixtures.
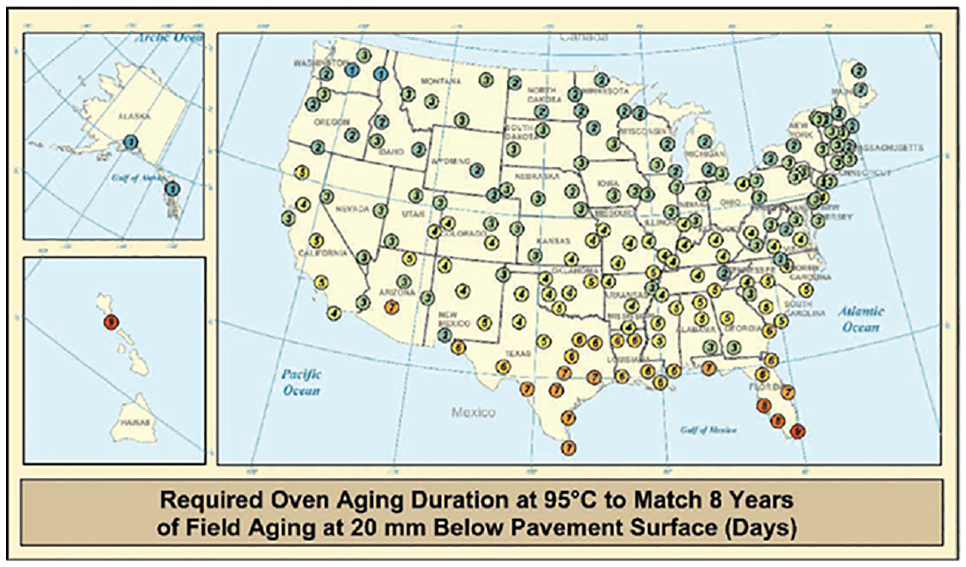
Required oven aging duration at 95°C to match 8 years of field aging at 20 mm below the pavement surface ( 11 ).
Aging at 135°C Procedure
Conversely, a higher-temperature, shorter-duration aging technique was also utilized. This approach was generated through work at the TTI and later at the NCAT, with an oven conditioning temperature of 135°C and a duration of 8 h ( 24 ). The premise behind this method is that different cumulative degree-days will be simulated by the oven conditioning based on the field location.
The same pans were used for 95°C and 135°C aging with the same amount of material in each pan regardless of test procedure. The work was conducted in an AASHTO-certified laboratory using calibrated equipment. Materials were randomly selected for testing at short-term aging (STA) and LTA conditions.
Asphalt Mixture Testing Procedures
As mentioned, four different mixture performance tests were conducted on the aged materials. In all cases, specimens were compacted to an air void level of 7 ± 0.5%.
Dynamic Modulus Testing in the AMPT
As denoted previously, |E*| testing was conducted on 38 mm-diameter by 110 mm-height specimens in general accordance with AASHTO TP 132. The deviation from AASHTO TP 132 is exclusively related to the temperature and frequency combinations used and microstrain target of 100. Testing was conducted in an AMPT at 4.4, 21.1, 37.8, and 45°C at frequencies of 25, 10, 5, 1, 0.5, and 0.1 Hz.
IDEAL-CT
The IDEAL-CT was conducted in accordance with ASTM D8225 on specimens 62 mm thick at 25°C with an actuator displacement rate of 50 mm/min. A universal servohydraulic loading machine was used for this test.
Semicircular Beam Test
The I-FIT was conducted in accordance with AASHTO TP 124, which calls for a 50 mm-thick semicircular specimen tested at 25°C and a load-line displacement rate of 50 mm/min. Testing was executed in an AMPT. Readers should note that I-FIT’s AASHTO TP 124 provisional standard has since been moved to full standard status, with designation AASHTO T 393.
Uniaxial Cyclic Fatigue Cracking Test
The AMPT uniaxial cyclic fatigue testing was executed in accordance with AASHTO TP 133, which utilizes 38 mm-diameter and 110 mm-height cylindrical specimen geometry. The tests were run in a pull-pull actuator displacement-controlled fashion at 10 Hz loading rate and the testing temperature (determined as the average PG temperature—3°C, according to AASHTO TP 133). Three test specimens at different on-specimen strain targets were used for each mixture.
Binder Extraction, Recovery, and Testing Procedures
Asphalt Binder Extraction and Recovery Procedure
The binders from each of the seven mixtures used in the study were recovered from reheated materials (STOA) and from LTOA materials. A total of 21 recovered binders were extracted in enough quantities to perform a series of rheological and failure tests at intermediate temperatures. The asphalt binders were extracted following ASTM D8159 using trichloroethylene, and recovered according to ASTM D5404 in an automated extraction instrument. The recovery was carried out at 135°C. The last three hours of recovery were carried out under a 500 mm Hg vacuum to remove all traces of solvent. About 3.5 kg of mixture was used to produce about 150 g of recovered binder. Recovered binders were tested by Fourier transform infrared (FTIR) to ensure full recovery from solvents following a similar method described in Farrar et al. ( 25 ).
DENT Test
The DENT test was performed according to the AASHTO TP 113 standard. Specimens with three different ligament lengths (5, 10, and 15 mm) were loaded in direct tension with a monotonic displacement rate of 100 mm/minute at 25°C until failure, as shown in Figure 5. This testing configuration allows for the approximate calculation of binder critical crack tip opening displacement (CTOD), a measure of binder strain tolerance.
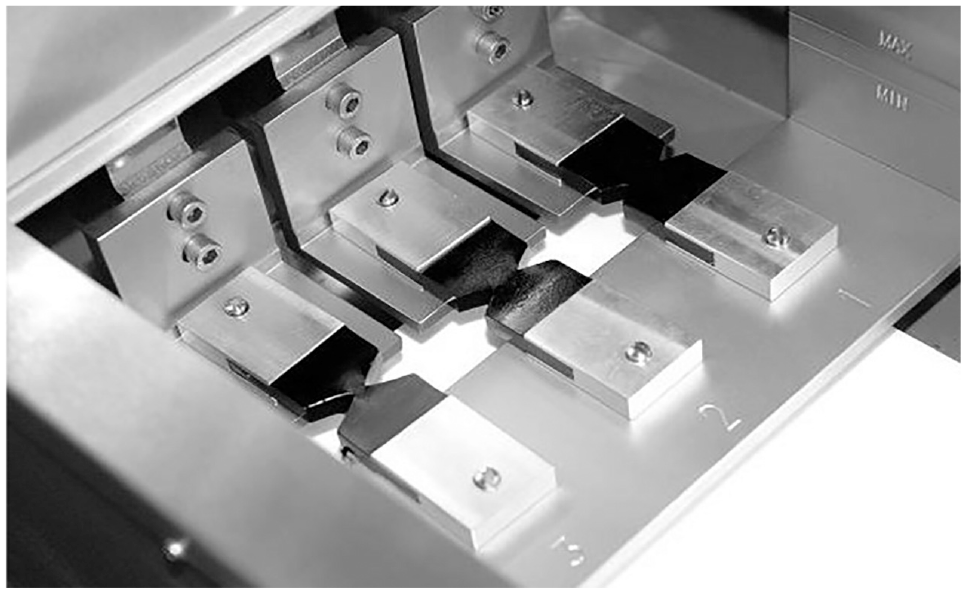
Image of the ductility instrument loading area during a double-edge notched tension test.
Figure 6 summarizes the experimental program of the validation study.
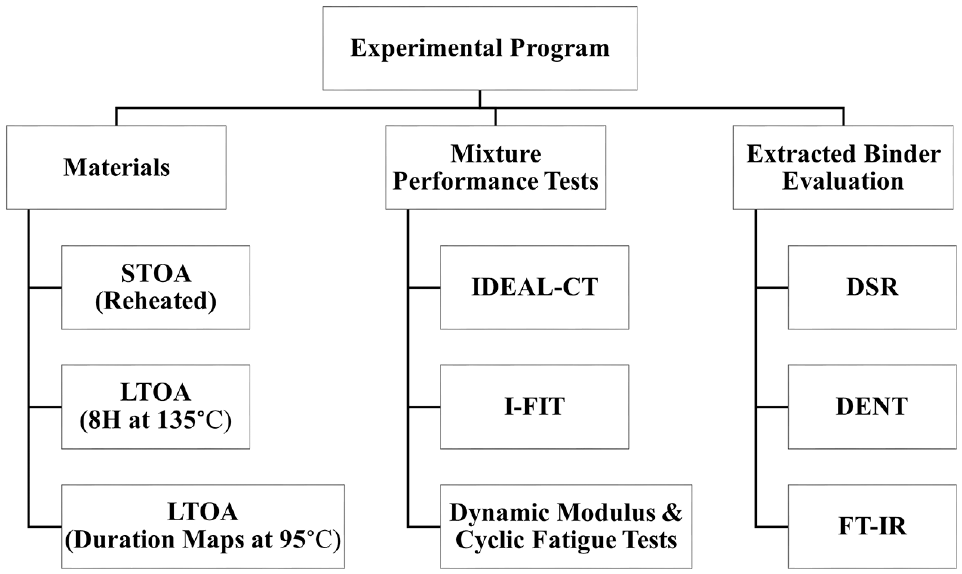
Experimental program.
Results and Discussions
Mixture and binder data are presented and discussed at the various aging levels. Error bars used in the following figures represent one standard deviation of replicates from the respective test methods. Each subsection shows the results for all seven mixtures at three aging conditions. In addition, DENT results obtained from extracted and recovered binders were compared with mixture results to ascertain behavioral similarities or differences. To determine whether there was any significant difference between the test results, the Student’s t-test was used. This can determine if there is a significant difference between the means of two groups, but it does not indicate where those differences lie. The null hypothesis is that the means are equal. Significance was established at a 95% confidence interval.
Aging Index Based on LVE Measurements
Figure 7 shows results from the log |E*|/sin(δ) parameter, which is used in this project as an aging index. From previous work, LTOA conditioning for 8 h at 135°C was found to be approximately equivalent to LTOA at 95°C for 5 days ( 24 , 26 ). Therefore, it makes sense that log |E*|/sin(δ) after the LTOA at 95°C for 7 days, used for FL12.5R00, will indicate a higher aging level and, therefore, stiffer behavior compared with LTOA for 8 h at 135°C. For Ohio mixtures (LTOA for 4 days at 95°C) and Montana and Vermont mixtures (LTOA for 3 days at 95°C), a less aged response compared with LTOA for 8 h at 135°C is expected. However, data in Figure 7 suggest that both aging methods fall within the test variability for most of the mixtures. Unexpectedly, higher stiffness is observed after LTOA at 95°C for OH9.5R20 and OH12.5R15 mixtures, which may have a complex behavior after aging because of the presence of RAP and the interaction between virgin and recycled binder during LTOA conditioning. This needs further investigation.
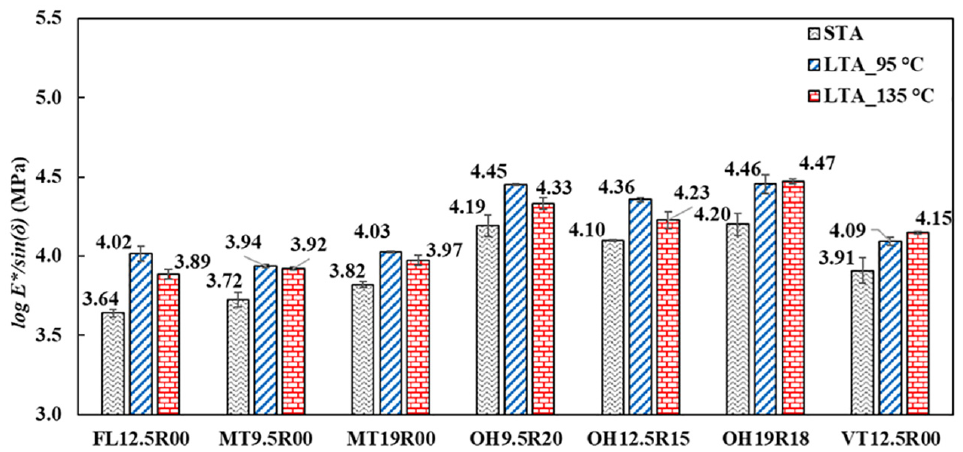
Log E*/Sin(δ) at STOA and LTOA levels for all mixtures at 20°C.
IDEAL-CT Results
Figure 8 shows the CTIndex values for all seven mixtures from the IDEAL-CT. Figure 8 represents three replicates from the test at each aging level. The CTIndex is higher at the STOA level and the value reduced after LTOA conditioning. In a comparison between STA and LTA, the CTIndex value dropped approximately 50% or more after LTOA at 95°C. In addition, the CTIndex value is always higher at 135°C when compared with 95°C, but in many cases they both fall within the test variability. MT9.5R00 and MT19R00 showed higher crack resistance compared with other mixtures. This is partly because of the softer binders used in these two mixtures, which was reflected in log E*/sin(δ) and later confirmed by binder data. Analysis shows that there is a statistically significant difference between STOA and LTOA. Additionally, in some cases, the two LTOA methods were found to be statistically significantly different based on the Student’s t-test and a 95% confidence interval, as was found for FL12.5R00, MT19R00, OH9.5R20, and OH19R18.
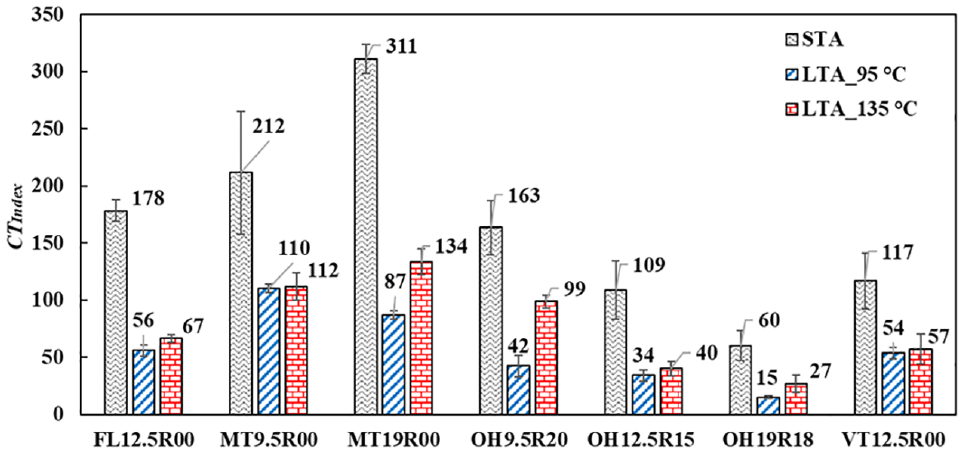
The CTIndex at STOA and LTOA levels for all mixtures at 25°C.
I-FIT Results
Figure 9 shows the FI values from all seven mixtures at STOA and LTOA conditions, and represents the average of three replicates from the test at each aging level. Figure 9 shows that the FI dropped after LTOA conditioning, which reflects the same trend observed with IDEAL-CT results. Montana FI results displayed higher variability than mixtures from other states. When LTOA was compared with STOA, the FI value dropped approximately 50% or more. Montana mixtures also showed a higher crack resistance compared with the other mixtures, similar to the CTIndex trend. Analysis shows that there is a statistically significant difference between STOA and LTOA in most cases. Additionally, the two LTOA methods were found not to be significantly different except for VT12.5R00.
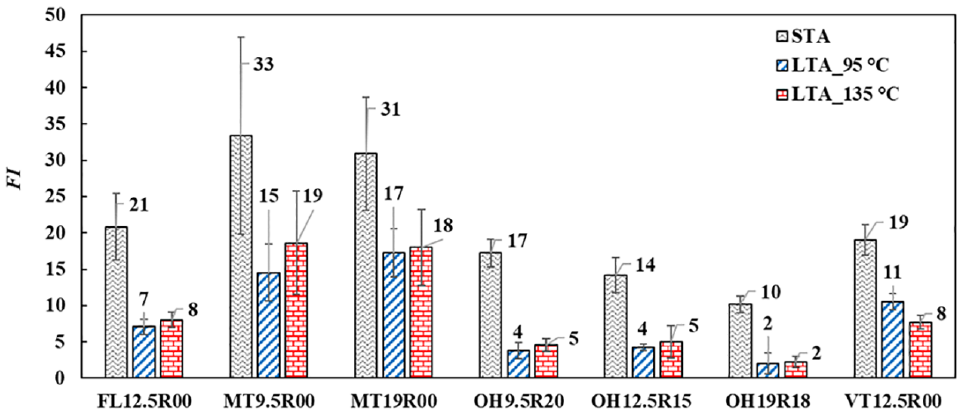
FI at STOA and LTOA levels for all mixtures at 25°C.
Uniaxial Cyclic Fatigue Test Results
The Sapp results from the AMPT cyclic fatigue test are shown in Figure 10 for all seven mixtures at both the STOA and LTOA conditions. The Sapp values are calculated at their respective testing temperatures based on climatic PG. Figure 10 represents four replicates from the test at each aging level. The Sapp values show different trends compared with IDEAL-CT and I-FIT results for some mixtures. The Sapp value is higher during STOA and the value is reduced during LTOA, except for FL12.5R00 data. Unexpected trends surrounding an increase in the Sapp values after LTOA in some situations have been reported previously in the literature ( 14 , 23 ). Future research efforts are needed to understand the theoretical and experimental causes behind these unexpected and uncommon trends. Chemomechanical characterization of materials exhibiting this trend may be useful in such investigation.
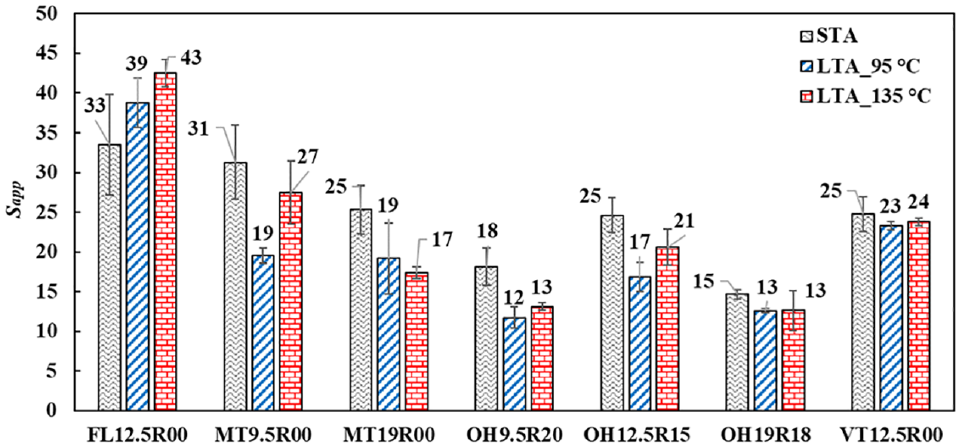
Sapp at STOA and LTOA levels for all mixtures at fatigue testing temperature based on climatic performance grade.
MT19R00, OH12.5R15, and VT12.5R00 displayed the same Sapp value at the STOA condition, but the index value dropped differently after aging depending on the mixture and binder composition and propensity to aging. Results show that the VR12.5R00 mixture may be less prone to aging and maintain its fatigue resistance over service life. This needs further investigation, and it highlights the need to consider LTOA conditioning as part of a comprehensive BMD framework. The FL12.5R00 Sapp falls within the testing variability at the STOA condition, but its Sapp value after LTOA conditioning was significantly higher than all other mixtures. In some cases, the observed trends and ranking between the various mixtures and aging levels, based on the Sapp values in Figure 10, do not agree with the I-FIT and IDEAL-CT results. It is worthy of note that the later test methods were conducted at 25°C, whereas the uniaxial fatigue test was conducted based on the climatic PG of each mixture (i.e., average climatic PG temperature—3°C, according to AASHTO TP 133). These test methods and subsequent indices are based on different models such as fracture mechanics for the FI and continuum damage mechanics for the Sapp index. Analysis shows that based on the Sapp, there is no statistically significant difference between STOA and LTOA in many cases, which is contrary to the observed trend for the other mixture performance test methods. Additionally, in some cases, the two LTOA methods were found not to be statistically different except for MT9.5R00.
Summary of Mixture Results
Table 2 shows the summary of all the index values at test temperatures as well as the coefficient of variance (COV) percent values for each index value. Because log E*/sin(δ) is a logarithmic value, corrected COV was calculated based on the formula shown in Equation 4, suggested by Canchola et al. ( 27 ), for log-transform data.

where
COV = coefficient of variance, and
σ = standard deviation.
As mentioned before, I-FIT displayed higher variability compared with the other testing methods. LVE measurements are generally more repeatable compared with failure tests based on either fracture or continuum damage mechanics. However, LVE measurements can be used to track oxidative aging but are not necessarily used as a reliable tool to predict performance.
Summary of Index Values from the Seven Mixtures at Various Aging Levels
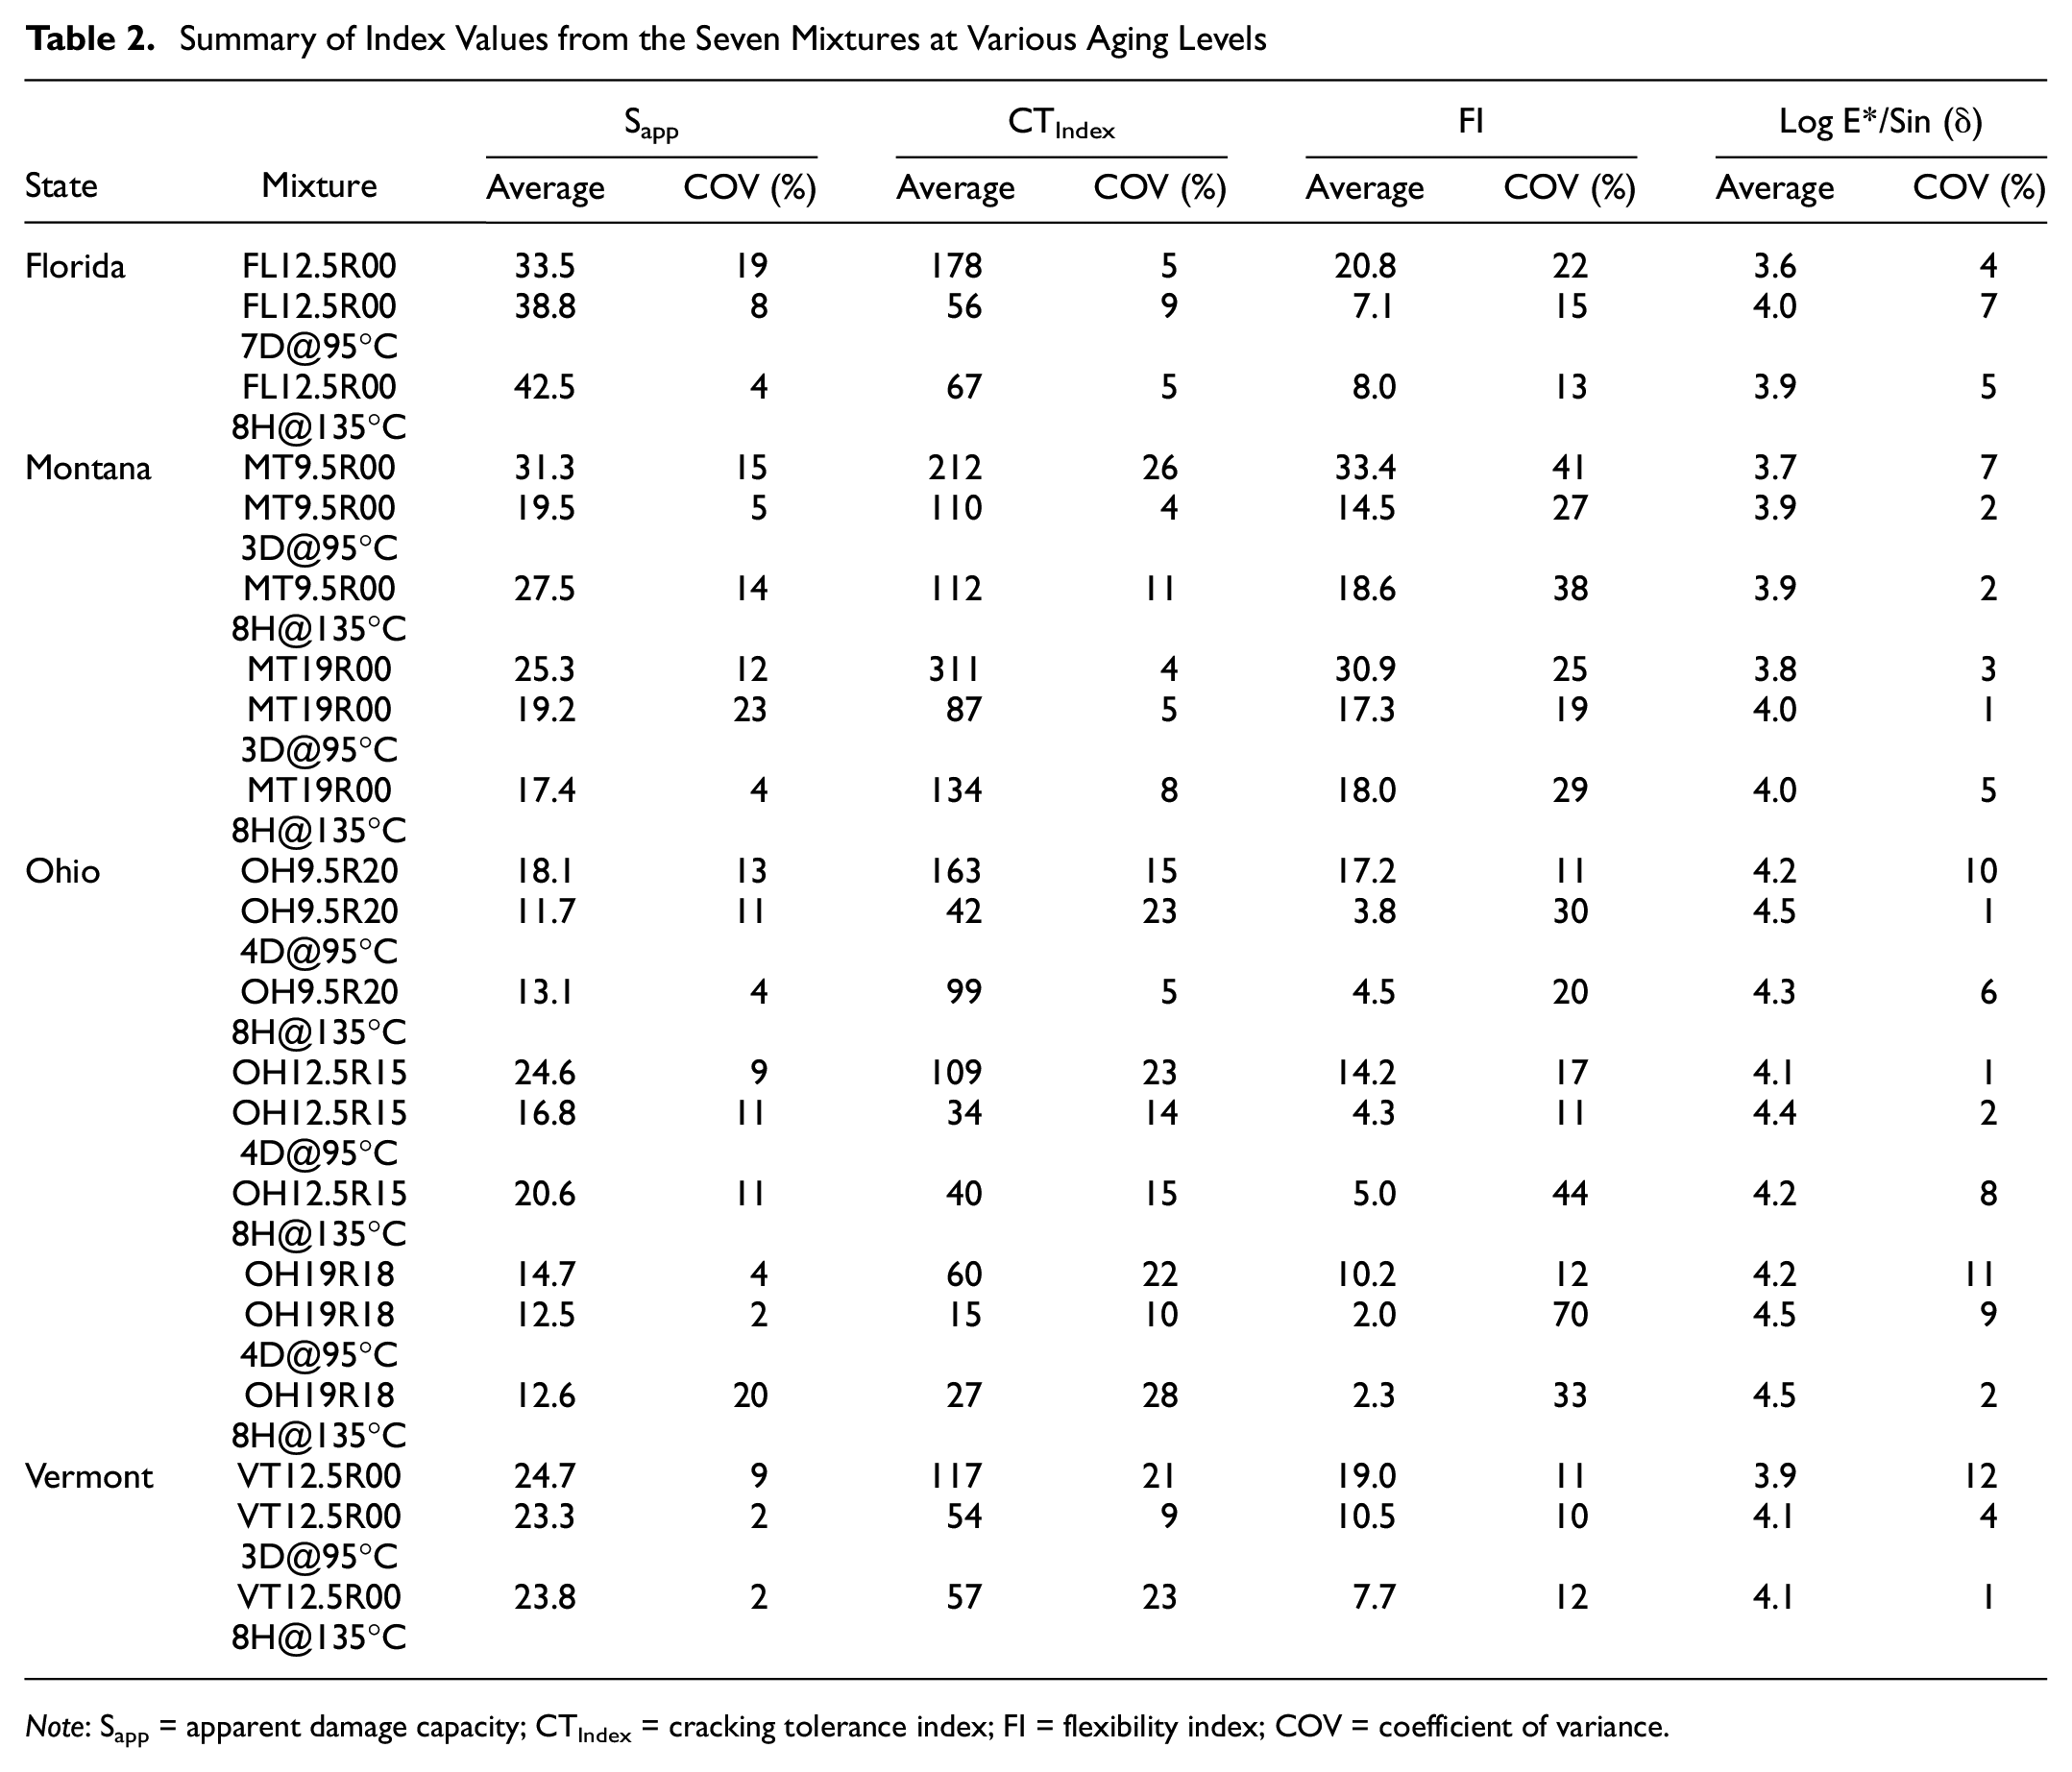
Note: Sapp = apparent damage capacity; CTIndex = cracking tolerance index; FI = flexibility index; COV = coefficient of variance.
Mapping the LVE Aging Index against Cracking Tests for STOA versus LTOA
The commentary in this section revolves around Figures 11 and 12, which show the LVE index plotted against the three cracking test indices. Each mixture is represented on the plot by two points. From Figure 11, the first point with the smaller log value
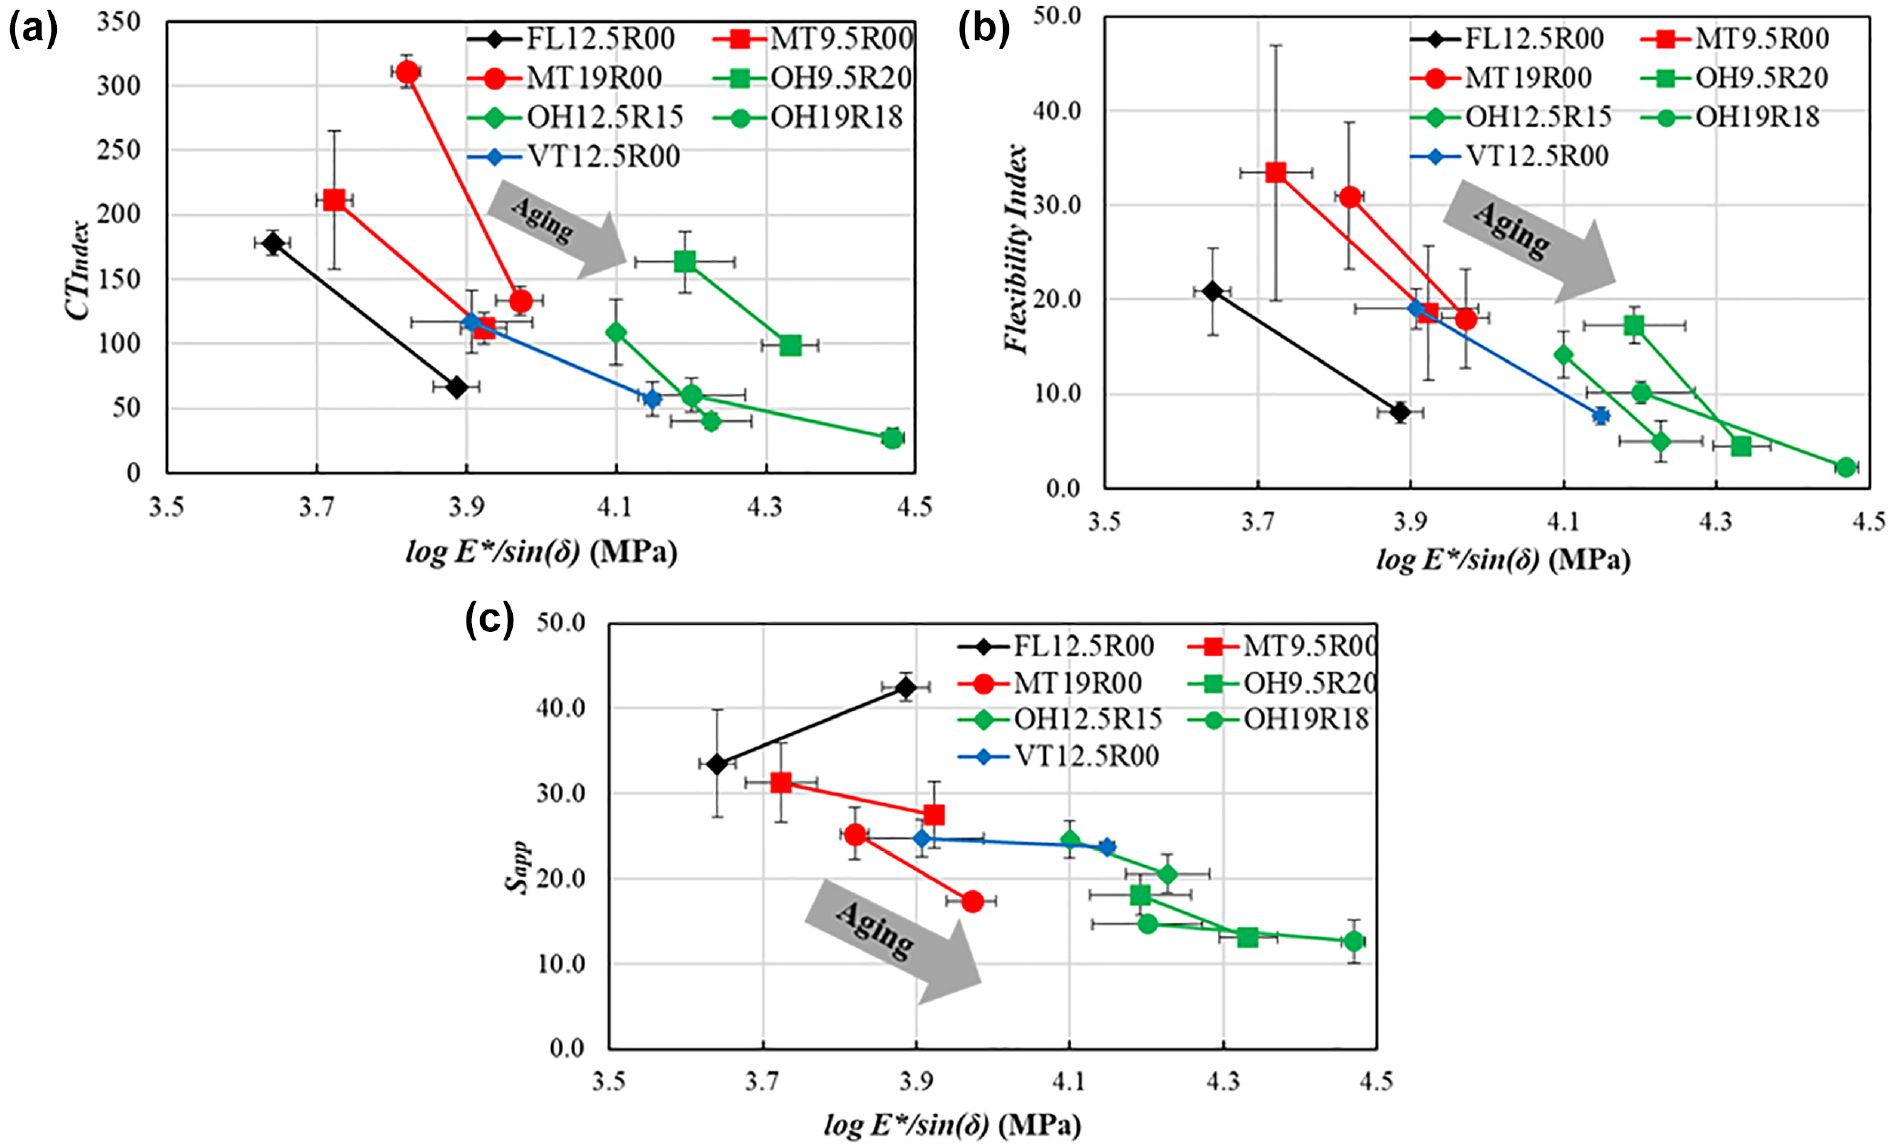
Relationship between aging index (log E*/sin(δ)) and the various mixture cracking indices after LTOA at 135°C for 8 h: (a) CTIndex, (b) FI, and (c) Sapp.
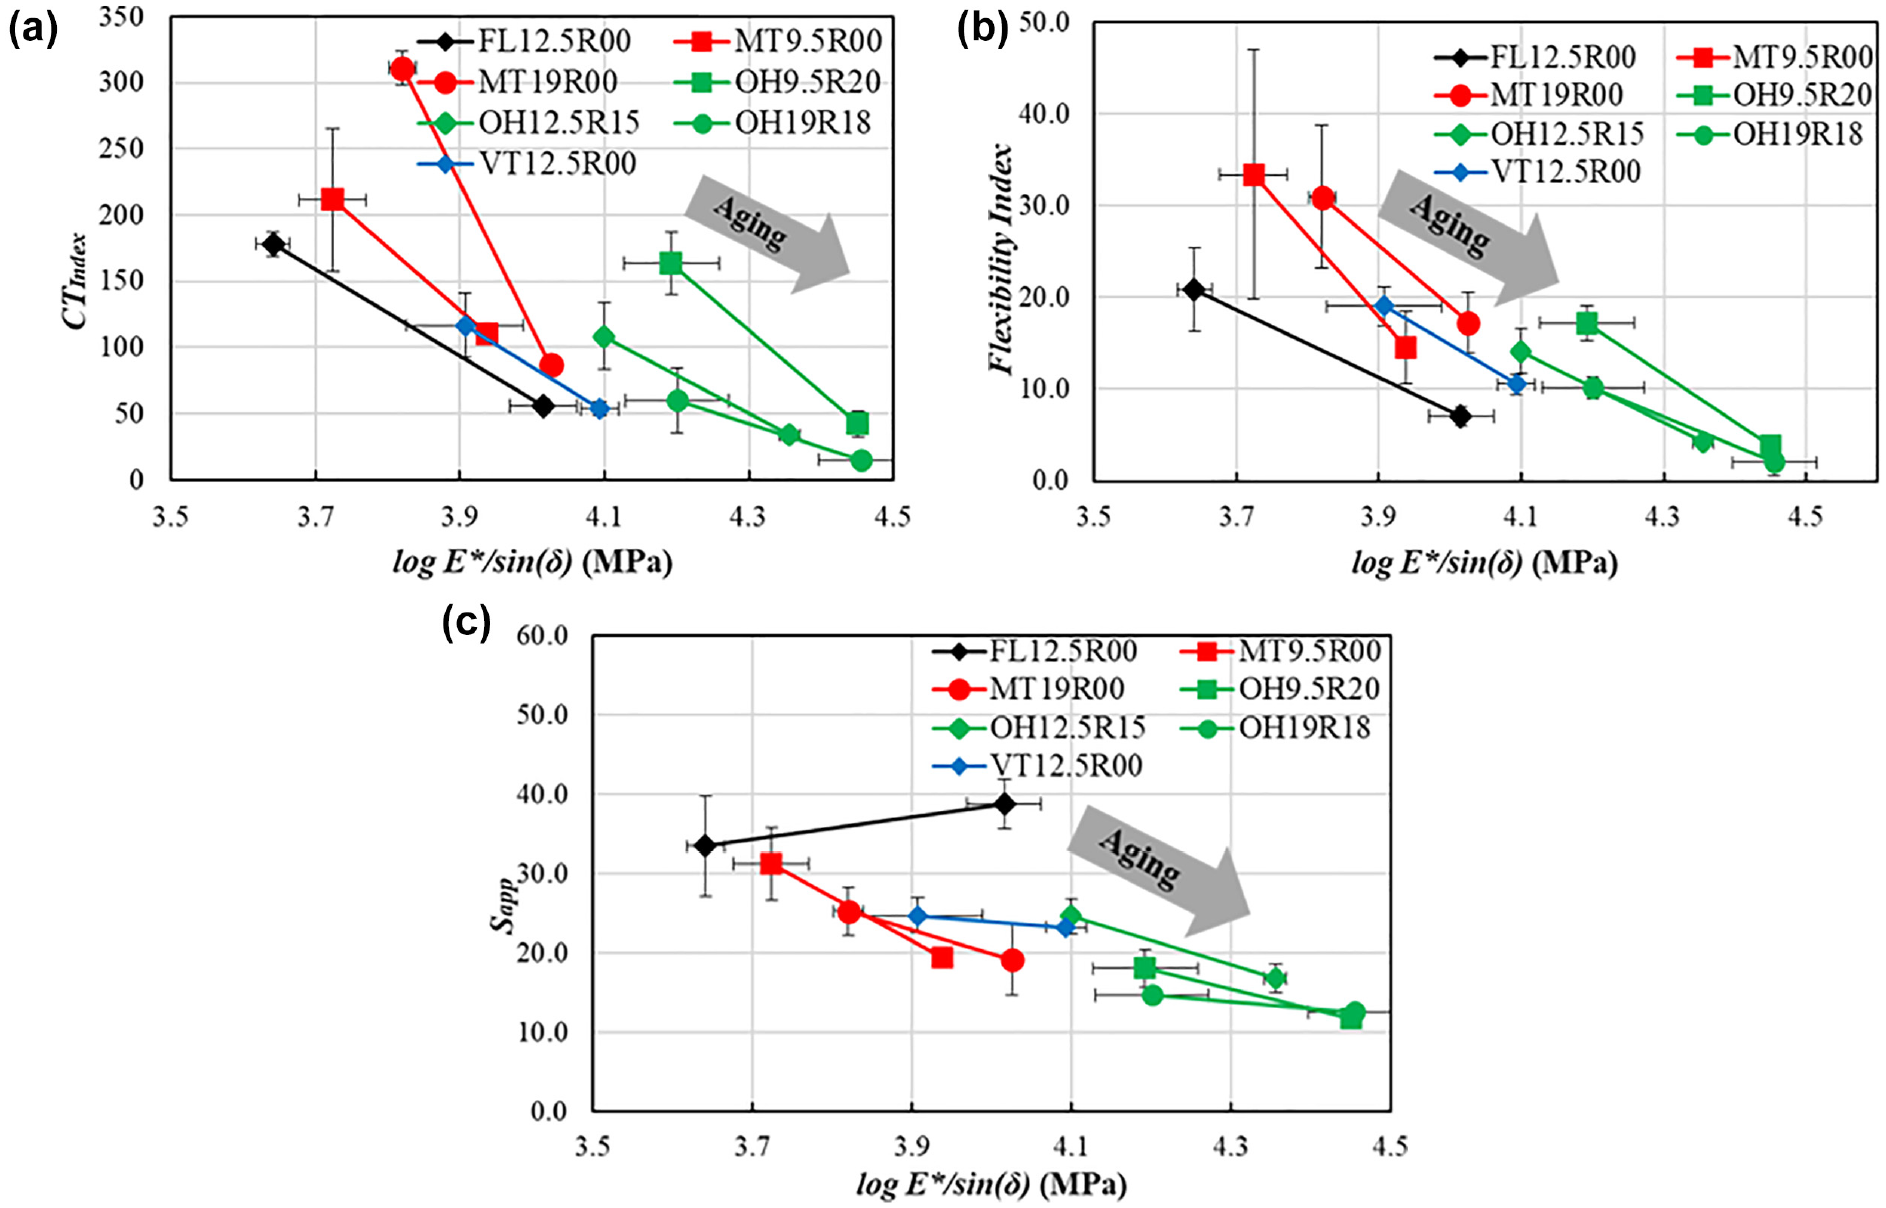
Relationship between aging index (log E*/sin(δ)) and the various mixture cracking indices after LTOA at 95°C and durations based on the aging duration maps: (a) CTIndex, (b) FI, and (c) Sapp.
Binder Properties and Mixture Indices
CTOD is a parameter that is obtained from the DENT and has correlated well in the past with fatigue resistance ( 28 ). A soft material or polymer-modified binder, especially, for example, elastomeric polymers such as SBS, typically absorb a larger plastic deformation energy before failure, whereas the amount of energy involved in material separation can be pursued at lower strengths during larger deformation spans. From this perspective, Figure 13 shows that the recovered binder from mixtures at STOA condition from FL12.5R00, MT9.5R00, and MT19R00 may be considered top performers. This observation is consistent with the trend observed based on the FI, and to some extent the CTIndex. It may be partly explained by two things: all three test methods were conducted at 25°C; and both I-FIT and DENT are based on the principles of fracture mechanics.
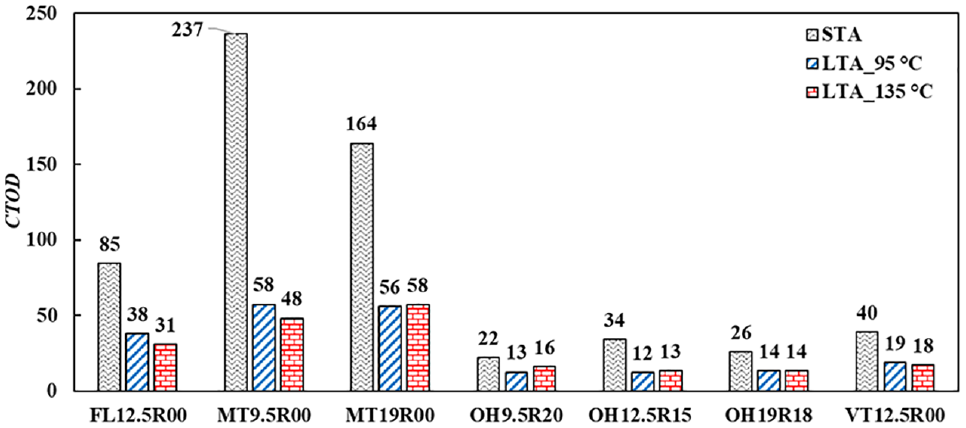
CTOD at STOA and LTOA for extracted binders at 25°C.
CTOD also captures the drastic effects of LTOA conditioning on binder failure properties. The top performers (FL12.5R00, MT9.5R00, and MT19R00) maintain the top ranking after LTOA. For these materials, the decrease in CTOD on aging is 55% to 80% compared with much more modest decreases for the rest of the binders. In addition, the FI and CTIndex parameters decreased after LTOA conditions for these corresponding mixtures by approximately 50% or more from the STOA state. This behavior (in both binder and mixture materials) indicates that the binder aging characteristics in the mixtures can be captured with success through fracture mechanics testing.
Summary of Findings and Conclusions
In this study, the impact of LTOA on mixture performance was investigated. Seven mixtures from Florida, Montana, Ohio, and Vermont with various RAP contents, NMAS, and binder sources were studied at the STOA state and after two emerging LTOA conditioning methods to understand the sensitivity, or lack thereof, of three proposed mixture cracking performance tests to LTOA. Furthermore, chemical, rheological, and fracture properties were obtained from extracted binders to obtain a better understanding of the impact of binder properties on mixture performance indices. Based on the findings from this study, the following conclusions are offered:
The use of
All of the three cracking test indices (Sapp, FI, CTIndex) showed a higher crack resistance index value at STOA, and in most cases the value dropped during LTOA (95°C and 135°C). However, the Sapp index did not show a statistically significant difference between the STOA and LTOA conditions for 50% of the cases.
I-FIT results displayed higher variability compared with the other testing methods. LVE measurements are generally more repeatable compared with failure tests based on either fracture or continuum damage mechanics.
The strongest agreement between binder and mixture results was observed between the FI and CTOD and could be partly explained by two things: both test methods were conducted at 25°C; and both of them are based on fracture mechanics principles.
Mixture cracking test indices often collapse with the introduction of LTOA, whereas the log
This paper and the three phases of the project in question are part of the overall research efforts being conducted at the FHWA’s Turner–Fairbank Highway Research Center to achieve more durable and sustainable pavement systems.
Footnotes
Acknowledgements
The authors would like to thank Mr. Scott Parobeck, Mr. Frank Davis, and Ms. Bethel La Plana of SES Group and Associates, LLC for fabricating specimens and performing the testing required in this study. The technical input provided by Dr. Eshan Dave of the University of New Hampshire, Dr. Andrew Hanz of Mathy Construction, Dr. Nam Tran of NCAT, Dr. Leslie McCarthy of FHWA, Mr. Ross “Oak” Metcalfe of Montana Department of Transportation, and Mr. Howie Moseley of Florida Department of Transportation helped in the formulation of the testing matrix and thanks are extended to each individual.
Author Contributions
The authors confirm contribution to the paper as follows: study conception and design: M. Elwardany, V. Veginati, A. Andriescu, D. Mensching; data collection: M. Elwardany, V. Veginati, A. Andriescu, D. Mensching; analysis and interpretation of results: M. Elwardany, V. Veginati, A. Andriescu, D. Mensching; draft manuscript preparation: M. Elwardany, V. Veginati, A. Andriescu, D. Mensching. All authors reviewed the results and approved the final version of the manuscript.
Declaration of Conflicting Interests
The author(s) declared no potential conflicts of interest with respect to the research, authorship, and/or publication of this article.
Funding
The author(s) received no financial support for the research, authorship, and/or publication of this article.
The contents of this paper reflect the views of the authors, who are responsible for the facts and the accuracy of the data presented here. The contents of this paper do not necessarily reflect the official views or policies of the sponsor at the time of publication.