
Abstract
This study seeks to contextualize the literature related to the urban transport of people and health. The methodology consisted of a systematic literature review, considering papers published between 2016 and 2021. Some 438 articles were selected for the initial analysis. It was observed that the most recurrent themes were analyses on transportation accessibility and health, and the impacts of active transportation and the built environment on health. Some 173 articles on travel behavior impacts were thoroughly analyzed. The most commonly evaluated health determinants were level of physical activity and obesity. Some studies applied standard questionnaires for health self-assessments. The analyses showed that mental/psychological well-being can have multiple dimensions. Most studies evaluated health determinants using statistical tools, specifically regression models and structural equation models. Health impact assessment was also applied recurrently in the analyzed articles. This study presents theoretical and practical implications, contributing to the state-of-the-art by theoretically deepening understandings of the relationships between transport and health. We also highlighted health aspects, methods, and data collection instruments that could be used in future studies. A better understanding of these relationships can also aid in developing public transportation strategies and policies that help move people and promote social-economic development, while also positively affecting individual physical and mental well-being.
Keywords
Introduction
Transportation systems play a fundamental role in economic and social development within cities, since transportation allows people to interact with each other and participate in society, while also moving both people and goods efficiently to support the economy ( 1 ). Transportation is important for society because it provides access to essential services, facilities, and activities, including employment, healthcare, education, shopping, and social networks, all of which affect the quality of life ( 2 ).
However, current transportation systems are not entirely sustainable ( 3 ), mainly given locomotion patterns based on motorized modes of transportation ( 4 ), generating various urban environment externalities, such as traffic accidents, noise, air pollution, and mobility restrictions for certain population groups ( 5 , 6 ). Faced with these problems, many authors have recognized that measures and policies for the transportation sector can contribute to city sustainability ( 4 , 7 ).
A sustainable system of transportation is characterized by providing services and infrastructure for mobilizing goods and people for economic and social development, improving quality of life, and competitiveness. Transportation services and infrastructure should provide safe, reliable, economical, efficient, and equitable mobility while mitigating negative impacts on health and local and global environments, over the short, medium, and long term, without compromising development for future generations ( 4 , 8 , 9 ). The definition of sustainable transportation highlights the need for considering health aspects in planning, and many studies recognize transportation as a key factor that influences populational health ( 2 , 3 , 10–12).
One reason for this association is pollutant emissions in urban areas coming from transportation, for example, particulate matter, nitrogen dioxide, carbon monoxide, and other volatile organic compounds. It is estimated that 23% of all greenhouse gas emissions worldwide come from the transportation system ( 10 , 13 , 14 ). These pollutants are commonly related to developing certain diseases, such as lung cancer, cardiovascular diseases, chronic respiratory diseases, and so forth ( 1 , 10 , 15 ).
Other authors have highlighted dependence on motorized modes of transportation, which leads to increased sedentary behaviors and lower levels of physical activity ( 12 , 14 ). In many countries, these levels are lower than the levels recommended by the World Health Organization (WHO). A lack of physical activity is related to problems such as being overweight, obesity, diabetes, high blood pressure, and so forth ( 12 , 14 , 16 ). Thus, encouraging active transportation (AT) use, walking, and cycling as a means of mobilization can be an efficient way of reducing the risks of developing some of the aforementioned problems. Some authors have emphasized the importance of built environment characteristics, for example, sidewalks, bike paths, bicycle lanes, and bicycle racks, in modifying people’s behavior and encouraging them to use AT to promote health ( 2 , 11 , 17 ).
Although AT is one of the most popular modes of transportation for promoting health, some authors also highlight public transportation (PT) use for this purpose ( 10 , 14–16), since PT is relatively less polluting compared to individual transportation, resulting in less harm to health ( 10 ). PT is also safer and results in fewer traffic accidents and deaths ( 3 , 15 ). PT users also engage in more physical activity compared to car users, because they walk between destinations, from transportation stops and their destinations ( 2 ). Another direct impact of the transportation system on health is injuries and deaths related to traffic accidents. According to WHO data, traffic accidents were the eighth leading cause of death worldwide in 2016 ( 18 ). Transportation systems also have indirect impacts on population health because transportation is a way of accessing places to buy healthy foods, engage in recreation, exercise, and access healthcare, thereby promoting healthy lifestyles ( 19 ).
Although the relationship between transportation and health has already been addressed in the literature, this relationship is now even more important because of the COVID-19 pandemic, given that mobility promotes contact among people, and consequently disease spreading ( 20 , 21 ). Transportation systems, especially PT systems, have been identified as major players in spreading this disease ( 22 ). Furthermore, city configurations have also been identified as contributing to the spread of this disease. Adequate infrastructure in the form of sidewalks and bike paths that promote micro-mobility can help people move while eliminating close contact among them ( 21 ).
It is observed that there is a relationship between transport and health, and that the former can act either as a booster or a hindrance to public health. This present paper seeks to contextualize the literature related to urban passenger transport and health. The relationship between the two themes is complex and broad. A lack of studies that systematically addressed it in a broader sense was identified. In the consulted literature, no work was found that sought to identify some important points related to the consequences of passenger transport on health. Literature reviews that deal with this relationship focus, mainly, on a single mode of transport, active transport, or the impact of the built environment. Examples of these applications can be found in Piatkowski and Bopp ( 23 ), Chen et al. ( 24 ), Smith et al. ( 25 ), Gelb and Apparicio ( 26 ), and Fraser and Lock ( 27 ). Gelb and Apparicio ( 26 ), in particular, focused on a single health effect: cyclists’ exposure to air and noise pollution. Egan et al. ( 28 ) analyzed studies on transportation sector interventions and their impacts on health. Marquart and Schuppan ( 29 ) used a systematic literature review (SLR) to verify the extent to which mobility apps provided health-related information to influence mobility behavior. Thondoo et al. ( 30 ) conducted a SLR to verify the use of health impact assessment (HIA) methodologies in developing countries.
A deeper understanding of the subject is needed. This work seeks to fill this gap, identifying important points that still need to be better understood about the relationship between transport and health. More specifically, the work seeks to identify health determinants commonly related to mobility, the main modes of transportation addressed in the studies, different types of applications, and the research methods and instruments used for data collection. To this end, a systematic search of articles published between 2016 and 2021 was conducted in the Science Direct and Scopus databases. Subsequently, the selected articles were analyzed to identify how transportation systems affect physical and mental health. It is important to mention that the articles, analyzed in detail, focused on the direct impact of the transport system on people’s physical or mental health. It is not within the scope of the review to analyze adverse effects that may have an indirect influence on health. Another limitation of the study is that it will only address the relationship between health and the transport of people, and will not discuss the issue of goods transportation. A theoretical deepening of this theme can aid in decision-making processes, and help in transportation planning, focusing on international applications, while contributing to future research.
This study is divided into four sections. The introduction is given in the first section. The methodology and results are given in the second and third sections. The conclusions are given in the final section, followed by the acknowledgments and references.
Methodology
The SLR method was used to contextualize the literature related to transport and health themes. The SLR is a research methodology that collects and evaluates available evidence related to a topic ( 31 ). This review is built around a central question, representing the investigative core, consisting of a secondary study of primary source studies. Researchers must follow a sequence of well-defined methodological steps according to pre-established SLR protocols. According to Brereton et al. ( 32 ), a SLR consists of three main phases, that is, planning, execution, and reporting. The research question is stated in the first phase, along with the protocol for choosing the studies. Relevant studies are identified in the second stage, then selected and evaluated, to extract data. In this step, data synthesis is performed. The results based on document analysis are offered in the last step. Figure 1 shows the procedure adopted in the SLR.
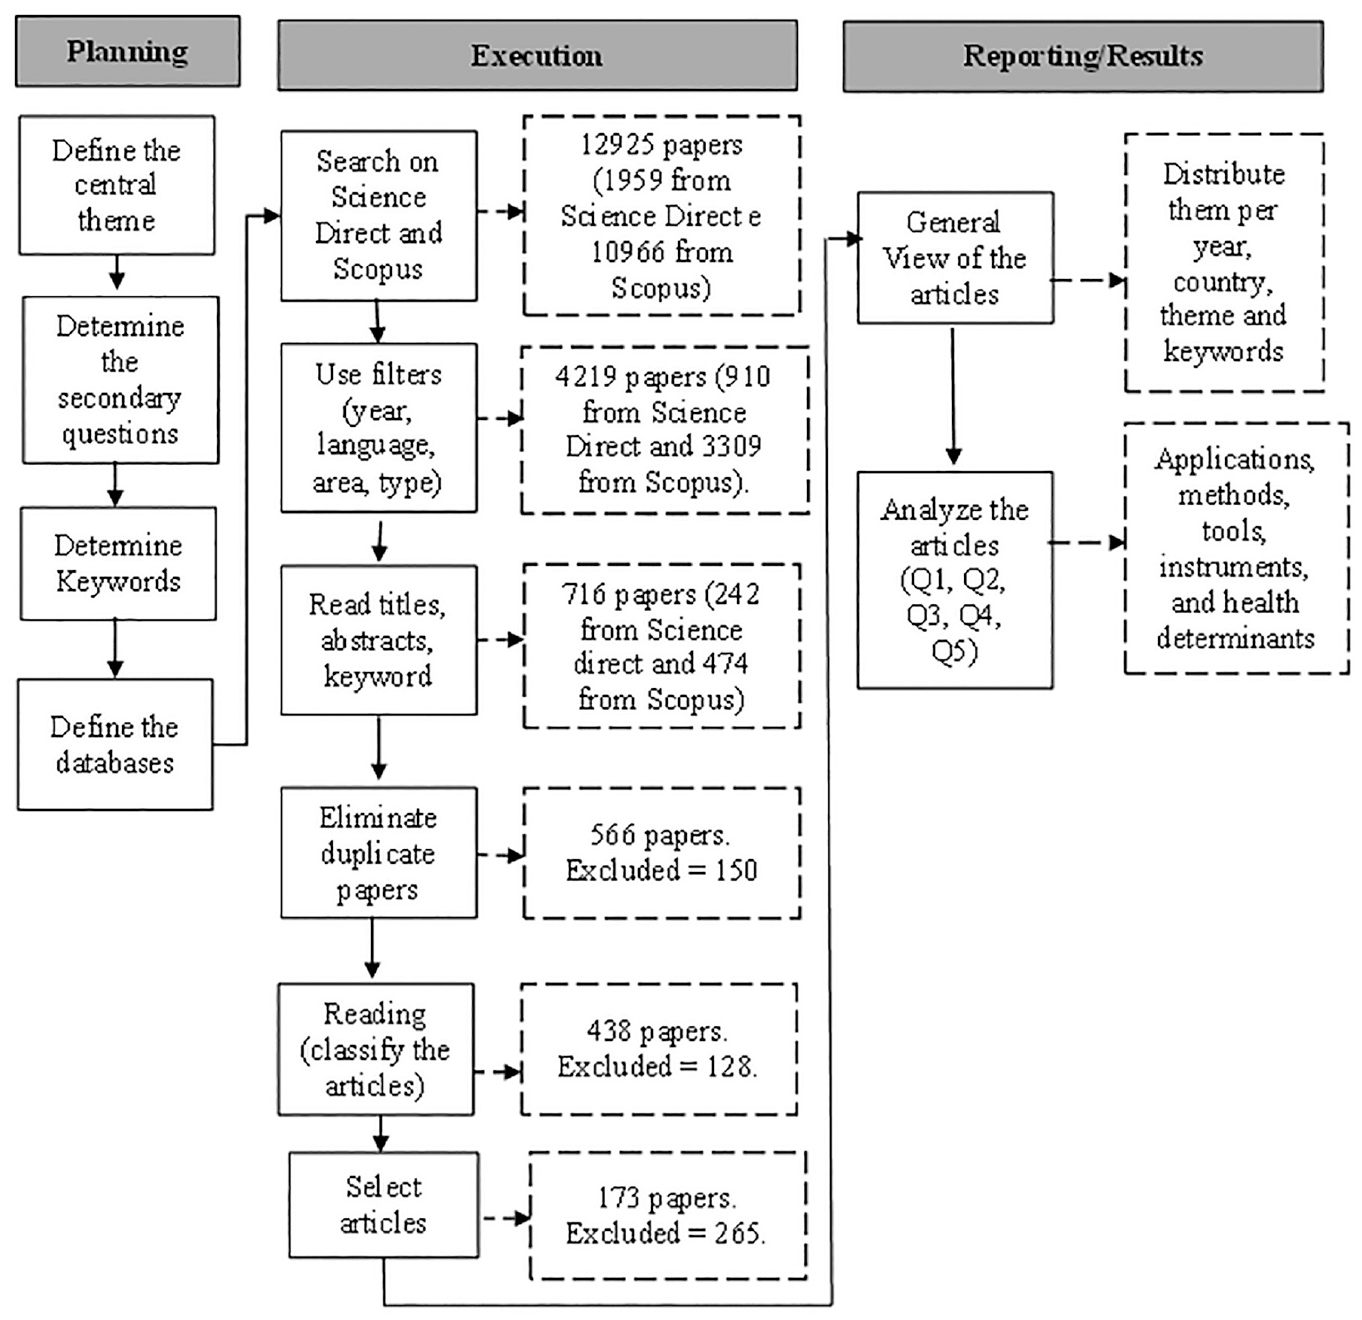
Methodological procedure.
The SLR helped us better understand the relationship between transport and physical and mental health and, more specifically, to understand how travel behavior influences people’s health. The guiding research question was “How do the urban passenger transport systems affect people’s health?” Additional questions were developed to search for the information.
Q1- What applications have been carried out on the urban mobility/transportation and health themes?
Q2- What are the main journals that published these articles?
Q3- What are the main modes of transportation covered in the studies?
Q4- What are the methods and tools used in the analyses?
Q5- What are the main diseases or health determinants associated with passenger mobility?
After defining the objective and the guiding questions, the keywords related to the transport, health, and urban environment themes were determined. The search was conducted in article titles, abstracts, and keywords, combining the terms as follows: (“Urban mobility” OR “transport” OR “travel”) AND (“health”) AND (“city” OR “cities” OR “urban”). The Science Direct and Scopus databases were used to collect studies published in the last 5 years between 2016 and 2021. The relationship between transport and health is broad and extensive. The choice for the period of 5 years was made with the aim of contributing to the most recent state-of-the-art, giving an overview of what has been researched at the present time. Some inclusion criteria were defined to choose the articles, as follows: (a) demonstrated clear alignment to the purpose of the review; (b) only studies directly addressing the relationships between passenger transportation and health (physical, mental, or well-being); (c) articles with some application with practical methods and results; (d) published in English or Portuguese and between 2016 and 2021. Many studies emphasize the importance of the transportation system for health, in the abstract, but their applications did not focus on the relationship between the two themes. These studies were discarded. Reviews and studies related to agriculture, the biological sciences, dentistry, chemistry, the arts, and so forth that were not related to our analyses were also excluded. The search was carried out in February 2021.
Some 1959 articles were found in the Science Direct database, and 10,966 articles were found in Scopus using the Expert Search option and searching for the terms. After applying the inclusion criteria filters, 910 articles from the Science Direct database and 3309 articles from Scopus remained. Subsequently, all titles, abstracts, and keywords were read to select the articles for analysis. As mentioned, many articles highlight the importance of the transport system for health. However, they do not present an application related to this relationship. Thus, by reading the titles, abstracts, and keywords, articles that did not show a direct application of this relationship were excluded. In this initial analysis, 242 articles remained from the Science Direct database and 474 articles from Scopus after this stage. Mendeley was used to check for duplicate articles, leaving 566 articles for analysis. The abstracts, introductions, and conclusions were read to identify whether the articles directly addressed the relationships between transport and health. Some 128 articles were eliminated in this step, resulting in 438 articles for analysis. A preliminary analysis of these articles was conducted, extracting information on the year of publication, journal, and article classification per the theme. The classification according to the theme was made by reading the titles, abstracts, and keywords. The articles that aimed to assess how travel behavior influences health (mental and physical) were then selected, leaving 173 articles. The articles were then analyzed based on the questions established in the planning phase of our SLR.
Results
Overview
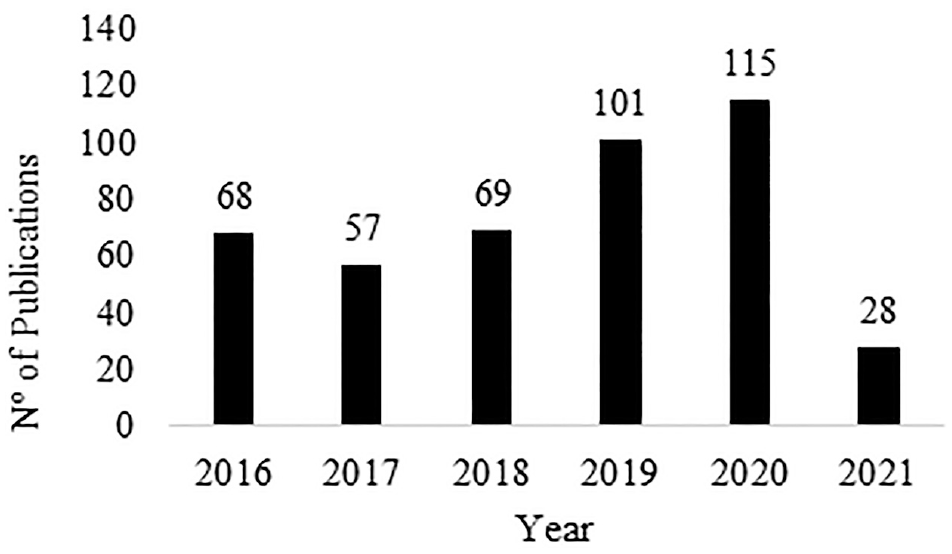
The 438 selected articles dealt with applications on the relationships between transport and health, which were published between 2016 and 2021. The time distribution of the publications is shown in Figure 2. Our search was carried out in February 2021, so the number of articles for 2021 was relatively smaller than for the other years. The year 2020 had the most publications (25% of all articles), perhaps because of the coronavirus pandemic, which is commonly spread in PT settings.
Time distribution of publications between 2016 and 2021.
Figure 3 shows the main keywords found in the articles and the links between them. Some 1469 keywords were identified, 57 of which were found in more than five articles. “Physical activity” was the most cited (54 articles), and was linked to words such as “walking,”“active transportation,”“active mobility,”“built environment,”“cycling” or “bicycling,”“walkability,”“obesity,”“health impact assessments,” and so forth. “Air pollution” was the second most cited keyword (35 articles). This was associated with “health impact assessments,”“particulate matter,”“mortality,” and so forth. “Building environments,”“walking,”“transportation,” and “accessibility” were all recurrent terms in the articles.
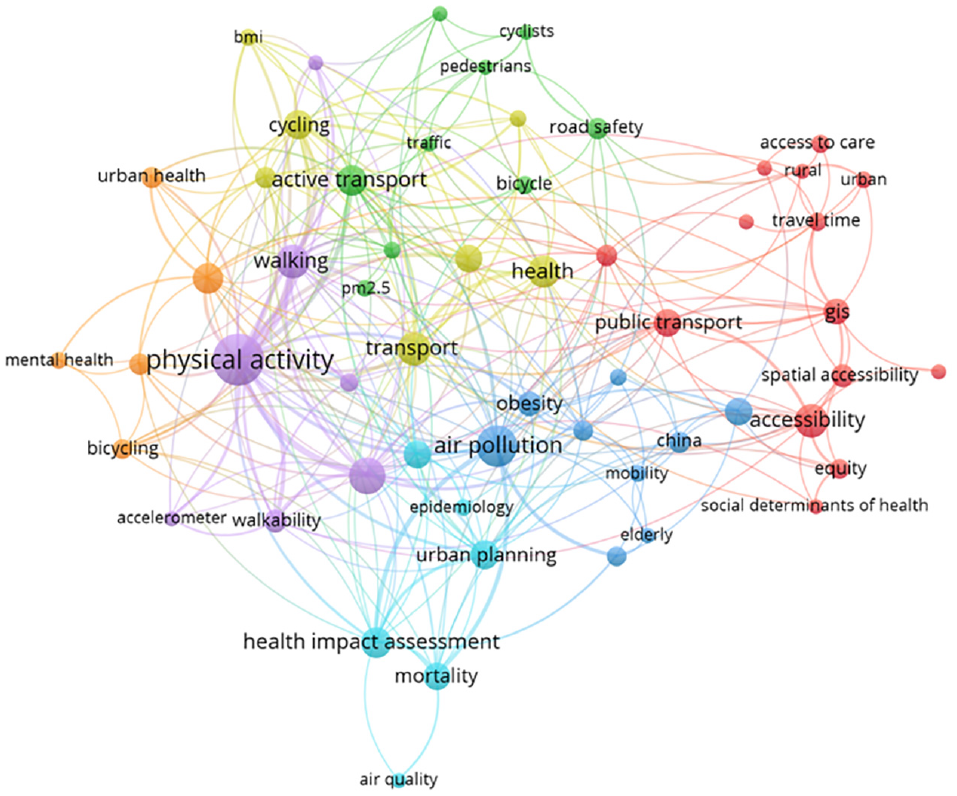
Keyword and link mapping.
Figure 3 shows seven clusters based on the keywords and the links between them. The first group of words was related to the influence of transportation on healthcare accessibility. Words such as “travel time,”“spatial analysis,”“equity,”“social health determinants” and “GIS” can be found in this group. Two groups have “air quality” or “atmospheric pollution” in common. In one of these groups, the term “Health impact assessments” is highlighted. The HIA is a tool used to verify health impacts from policies, programs, or project implementations. Along with this term are also “urban planning,”“mortality,” and “public health.” Four groups focus on words related to “active transportation,” but from different perspectives. One is related to road safety, including words such as “road safety,”“pedestrians,”“cyclists,”“risk analysis,”“traffic,” and “urban mobility.” Two groups relate AT with physical activity level. One is more geared toward walking, while the other is more geared toward cycling. The first includes the words “walking,”“walkability,”“active mobility,”“accelerometer,” and “built environment.” The second includes words such as “cycling,”“health,”“transportation,”“environment,”“body mass index,” and “active transportation.” The last group comprises words related to AT and mental health.
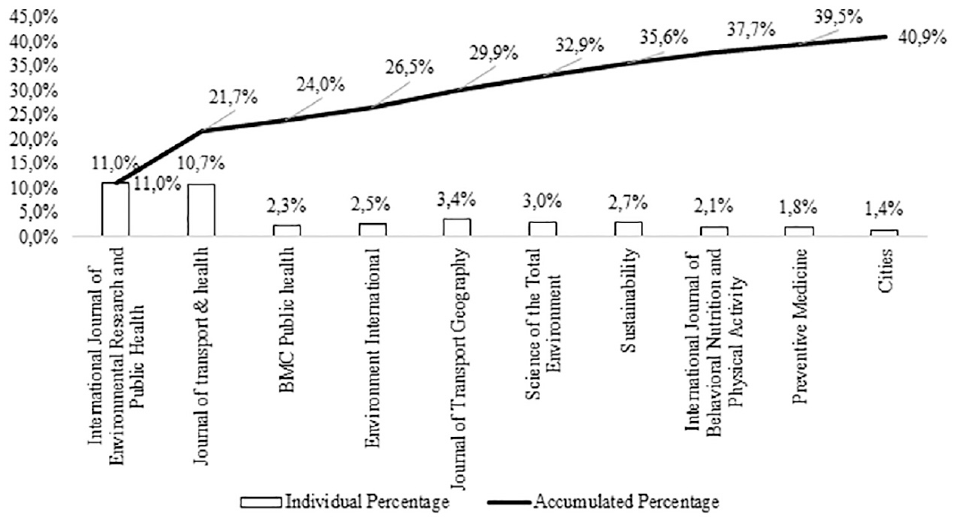
The 438 articles were published in 174 journals. The 10 journals with the most articles (Figure 4) accounted for 40.9% of all articles. Approximately 22% of all articles were published in two journals, that is, the International Journal of Environmental Research and Public health, with 48 articles, and the Journal of Transport & Health, with 47 articles.
Journals with the most publications.
Article similarity was determined by reading the titles, abstracts, and keywords, allowing them to be classified according to themes. Eight main theme groups were found in studies related to passenger transport and health, as per Figure 5. Most studies (24%) analyzed how transportation systems affect access to healthcare facilities. Some studies verified differences in access among people residing in urban and rural areas. Others explored how modes of transportation or travel time influence access. A GIS (geographic information system) was usually used as an analysis tool. The second group of articles (22%) contained studies that analyzed the negative and positive impacts of AT and health impacts. Pollutant emission impacts on health per mode of transportation were analyzed in 13% of all studies. Mathematical models were developed to estimate pollutant emissions. The same number of publications addressed transportation system impacts on traffic accidents. Some 8% of the studies analyzed impacts on people’s mental health or well-being, while 7% of the studies evaluated how transportation systems spread contagious diseases. The year 2020 had the most studies of this type because of the severity of the coronavirus pandemic, which is spread in PT settings. Some 4% of the 438 articles study health impacts on people working in the passenger transportation sector, such as bus drivers, taxi drivers, and app drivers and 5% of the studies focused on PT impacts on health, while 5% of all articles studied “other applications,” encompassing studies with broader objectives that did not focus on a single mode of transportation, but rather on travel behavior as a whole, along with urban planning and general planning impacts within transportation systems.
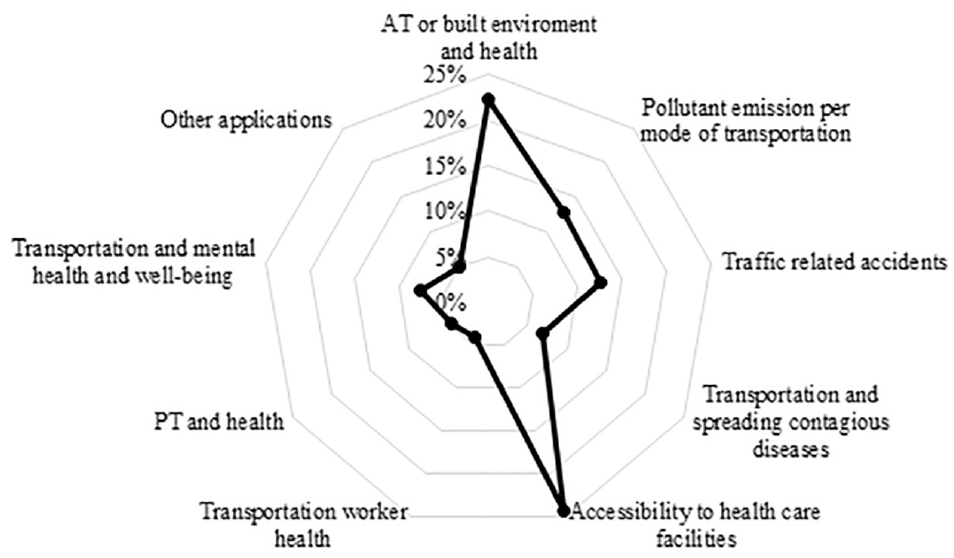
Application types in the studies.
Our study analyzed in more detail the articles that verified the effects of travel behavior on the health (physical or mental) of the population. Other studies that focused on the health impact of projects implemented in the area of transport were also included in the analyses, such as the impact of the implementation of a new public transport line or the expansion of a bicycle lane. In this sense, it is necessary to differentiate travel behavior or mode choice and the types of transport available. The first refers to the decisions and actions that people make when traveling from one place to another. Travel behavior is related to the choice of transportation mode, route, time of day, and purpose of the trip. The availability of transport refers to the different modes of transportation that can be used for travel. These modes of transportation have different characteristics, advantages, and disadvantages, which can influence the traveler’s decision on which mode to use. It is important to say that transport availability is influenced by transport planners’ decisions. The difference between travel behavior and the types of transport available is that the former is a human-centered approach that considers the individual’s preferences, while the latter is a transport-focused approach that considers the different modes of transportation available for use.
Thus, the articles analyzed in more detail in this work were those belonging to the following groups: active transport or built environment and health; public transport and health; transportation, mental health, and well-being; and other applications, which corresponded to 173 articles. These articles were applied in 57 countries. Some studies were applied in more than one country. Of the 57 countries, 9 had more than 10 publications, that is, the U.S.A., the U.K., China, Canada, Spain, Australia, Brazil, Italy, and Sweden. The U.S.A. had the most publications (28), followed by the U.K. (20) and China (19). A concentration of publication in European countries was observed, focusing on the U.K. and Spain, with more than 16 publications. Publication predominance in higher-income countries was evident. These countries tend to promote more sustainable means of transportation, positively affecting populational health. In South America, Brazil had the most publications, with 12 articles.
Relationship Between Active Transportation and Health
The first group deals with studies that analyze AT or built environment impacts on health; 22% (97 articles) of the papers were includes in this group. Lack of physical activity is associated with chronic non-communicable diseases, such as heart disease, diabetes, obesity, heart attacks, hypertension, and some types of cancer ( 33 – 38 ). Despite this, an estimated 31% of the world’s population is physically inactive ( 39 , 40 ). The situation is even more serious for low- and middle-income countries. Chronic non-communicable diseases are responsible for 80% of all diseases in these countries, with insufficient physical activity contributing to premature mortality there ( 38 ).
Using AT (walking and cycling) is one way of getting daily exercise ( 39 , 41 ), and therefore contributes to populational health. Many studies analyzed the association between using AT and health, for example, physical activity, obesity, blood pressure, heart disease, diabetes, and so forth. Normally, statistical tools are used to verify differences between groups and prove the significance of associations between variables in these types of analyses. For example, regression models, analysis of variance (ANOVA), the chi-square test, factor analysis, structural equation models, generalized linear mixed models, and so forth, are all used. Examples of these types of applications can be found in Bartley et al. ( 37 ), Berglund et al. ( 42 ), Buck et al. ( 43 ), Buehler et al. ( 44 ), Castro et al. ( 45 ), Cohen et al. ( 46 ), Flint and Cummins ( 47 ), Frömel et al. ( 48 ), Khan et al. ( 49 ), Lee et al. ( 50 ), Liao et al. ( 51 ), Luan et al. ( 52 ), Martínez-Martínez et al. ( 53 ), Mendoza et al. ( 54 ), Mitáš et al ( 55 ), Passi-Solar et al. ( 56 ), Raser et al. ( 57 ), Schantz ( 58 ), Schlosser et al. ( 59 ), and Smith et al. ( 60 ).
Analyzes of the relationship among built environment attributes, AT use, and health aspects were also verified. GISs are used to objectively measure environmental attributes with statistical tools. Several built environment variables can be used in these analyzes, varying from the macro to the micro scales, for example, examining neighborhood characteristics. According to Stefansdottir et al. ( 61 ), the most widely used variables are mixed land use, residential density, utilities located close to residents, sidewalk availability, street connectivity, recreational facility availability, for example, parks and trails, and safety and aesthetics. Furthermore, some studies analyze the effect of implementing specific infrastructures, such as bike paths or pedestrian signs. The Walk Score was also frequently used in some studies ( 62 – 65 ). This tool is available online and assigns a score to measure the walkability of a given address based on its proximity to certain places, and connectivity around that location ( 64 ). The assessments of built environment can be subjective, by considering resident opinions from different locations. The Neighborhood Environment Walkability Scale (NEWS) questionnaire was used in some studies ( 66 – 69 ). It seeks to assess people’s perception of 67 items, organized into nine subscales representing land-use mix diversity, neighborhood recreation facilities, residential density, land-use mix-access, street connectivity, walking/cycling facilities, neighborhood aesthetics, pedestrian and road traffic safety, and crime safety ( 69 ). Perez Barbosa et al. ( 33 ), Adlakha et al. ( 34 ), Adlakha and Parra ( 38 ), Panter et al. ( 41 ), Stefansdottir ( 61 ), Collins et al. ( 62 ), Koohsari et al. ( 63 , 64 ), McCormack et al. ( 65 ), Brüchert et al. ( 66 ), Pimenta et al. ( 67 ), Sun et al. ( 68 ), Noonan et al. ( 69 ), Algoday et al. ( 70 ), Amini et al. ( 71 ), Borchardt et al. ( 72 ), Cain et al. ( 73 ), Cerin et al. ( 74 , 75 ), Crane et al. ( 76 ), Delisle Nyström et al. ( 77 ), Fitch et al. ( 78 ), Fortune et al. ( 79 ), Jeon et al. ( 80 ), Kärmeniemi et al. ( 81 ), Kartschmit et al. ( 82 ), Kriit et al. ( 83 ), Lee ( 84 ), Levasseur et al. ( 85 ), Mäki-Opas et al. ( 86 ), Marquet and Miralles-Guasch ( 87 ), Mohsen and Ahmadieh ( 88 ), Mouratidis ( 89 ), Nordh et al. ( 90 ), Oliver et al. ( 91 ), Sallis et al. ( 92 ), Su et al. ( 93 ), Tewahade et al. ( 94 ), Yang and Zhou ( 95 ), Yang et al. ( 96 ), and Žaltauskė and Petrauskienė ( 97 ) analyzed the associations among built environment characteristics, AT use, and health aspects.
Some 62 articles in this group related passenger transportation with some illness or health aspect.
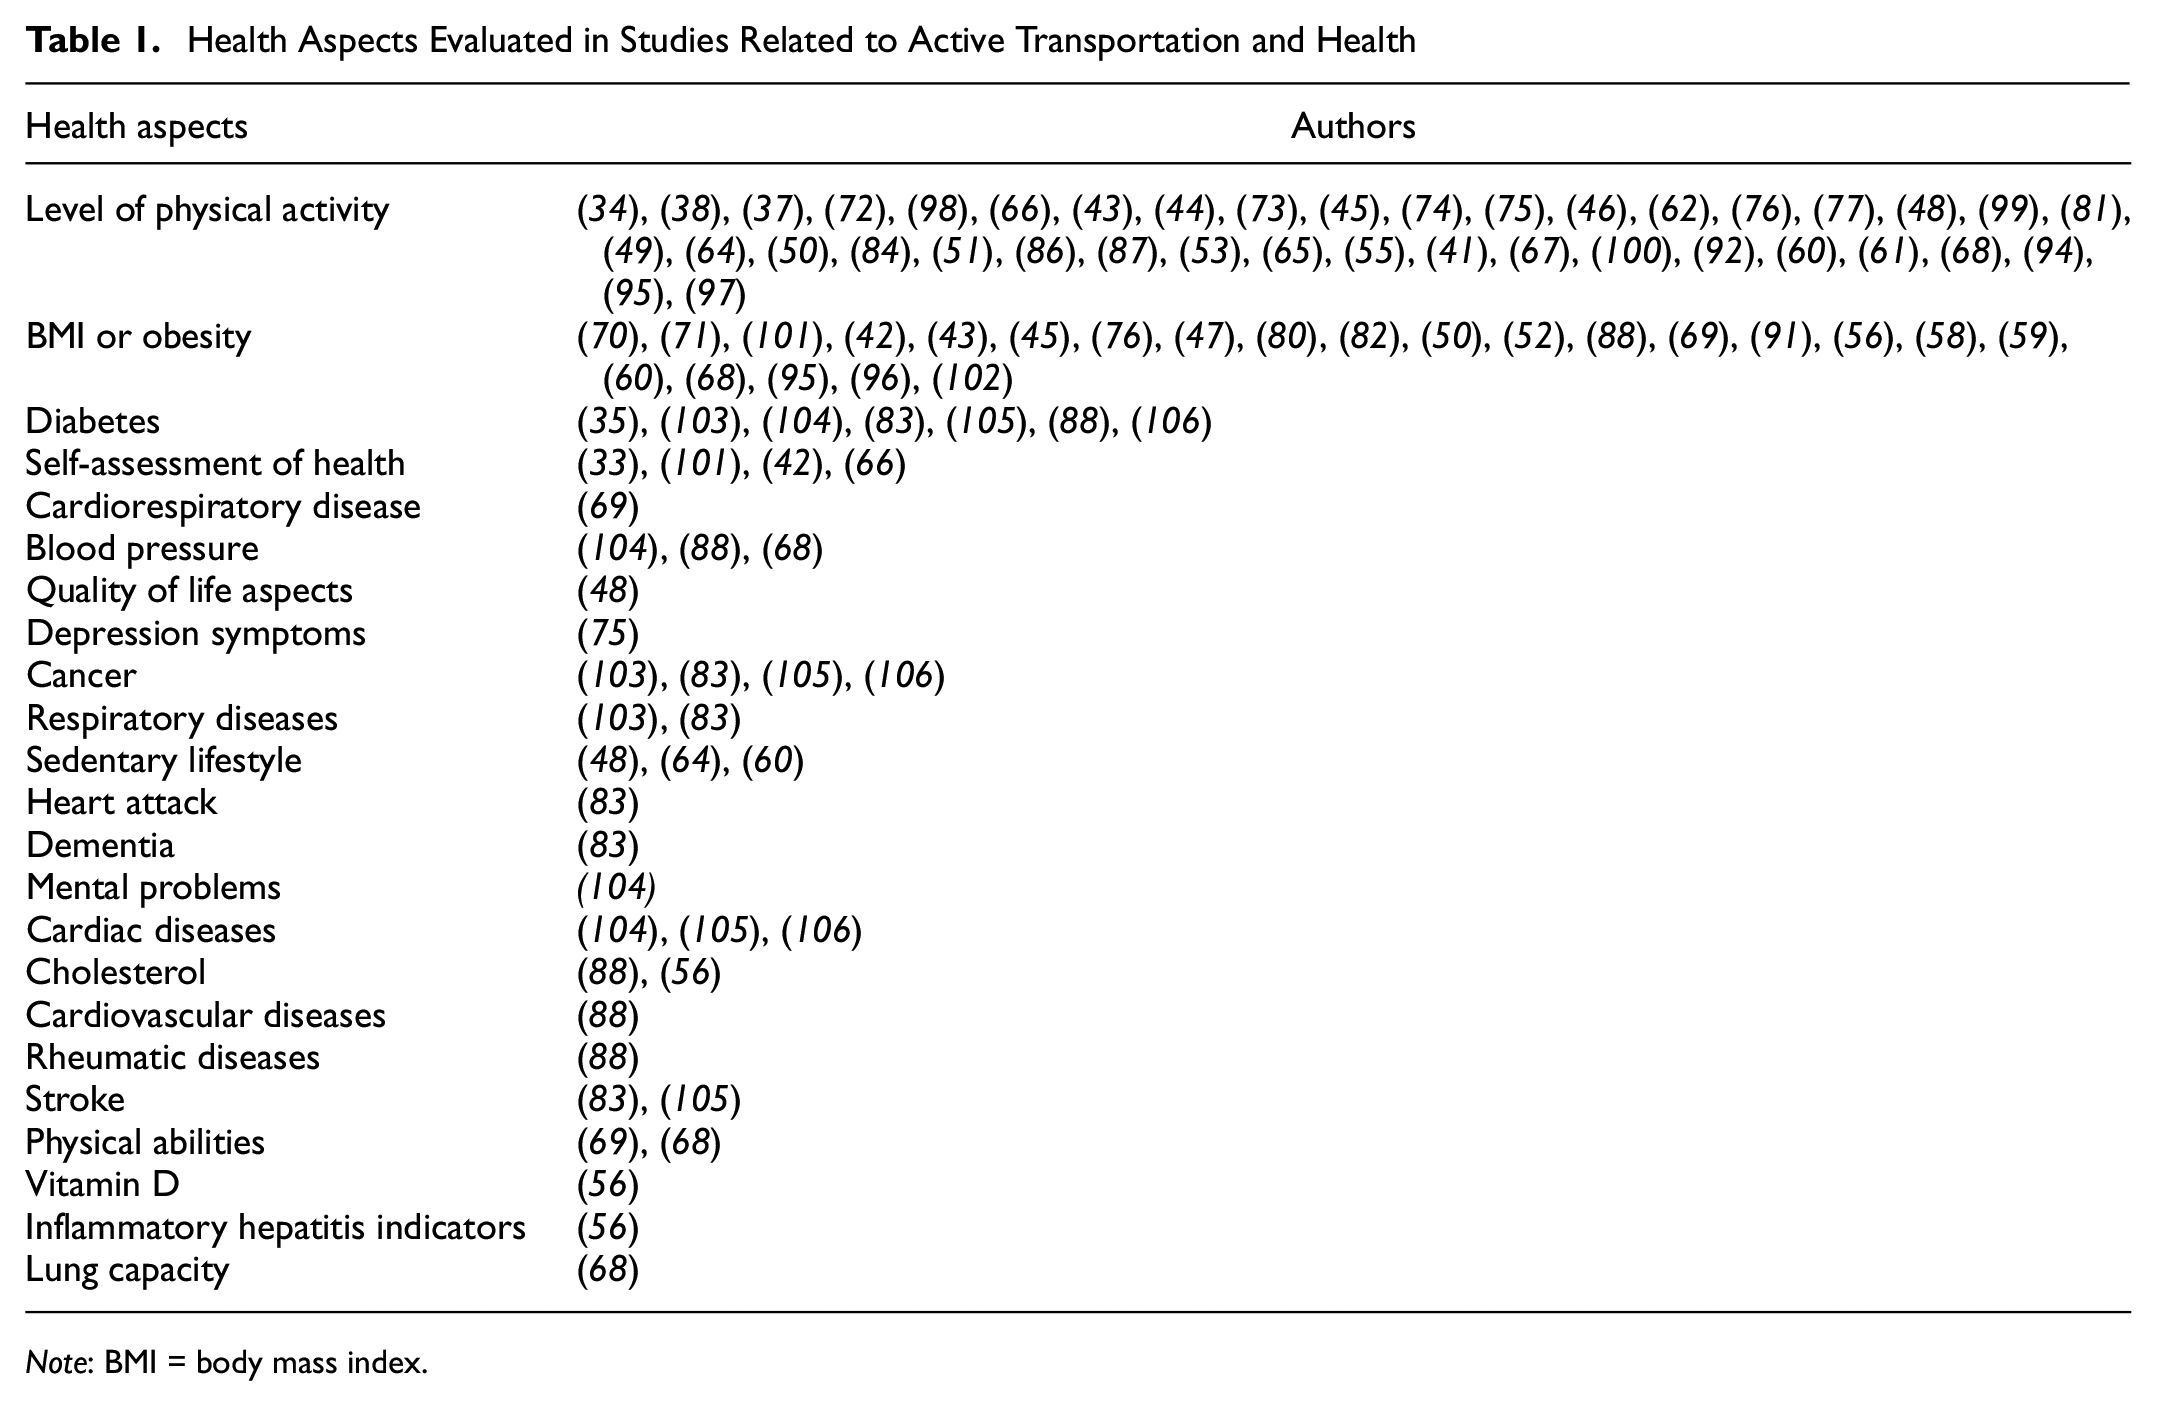
Table 1 presents the health aspects and the articles in which they were analyzed, contributing to the identification of health determinants associated with passenger transport. It is noteworthy that this table presents the determinants related to active transport and, therefore, many articles analyzed issues such as physical activity, body mass index (BMI), and diabetes. The association with other determinants, such as some cardiovascular and respiratory diseases, has still been little explored, showing a possible field of research.
Health Aspects Evaluated in Studies Related to Active Transportation and Health
Note: BMI = body mass index.
Figure 6 shows the frequency with which these aspects were addressed in the articles. The most evaluated factor (62%) was the level of physical activity, followed by obesity, or BMI, and body fat (37%). It was observed that the level of physical activity can be measured both subjectively and objectively. Subjectively, study participants reported on their activities, frequency, and duration in questionnaires. For this purpose, the International Physical Activity Questionnaire has been applied repeatedly ( 34 , 48 , 51 , 55 ). Objectively, the level of physical activity is assessed using accelerometers and the Global Positioning System (GPS). Some authors highlight the scarcity of studies using objective evaluations, and that the use of questionnaires can result in result bias ( 36 , 39 ). Bartley et al. ( 37 ), Buck et al. ( 43 ), Lee et al. ( 50 ), Martínez-Martínez et al. ( 53 ), Mendoza et al. ( 54 ), Koohsari et al. ( 63 ), Cain et al. ( 73 ), Lee ( 84 ), and Kang et al. ( 99 ) all used devices to measure physical activity levels.
Health outcomes.
The way of measuring sedentary behavior also varied between the studies that carried out this analysis. The study by Frömel et al. ( 48 ) evaluated the association among AT, well-being, level of physical activity, and sedentary behavior in adolescents. Data to assess sedentary behavior were taken from the International Physical Activity Questionnaire, considering the time spent in passive displacements and the total time sitting. In Koohsari et al.’s study ( 64 ), participants reported their time spent in TV viewing and car driving in the past week. Smith et al. ( 60 ) used accelerometers to measure the sedentary level of children.
The SF-36 health survey was used for data collection on health self-assessments in some studies. The questionnaire encompasses 36 items, which measures health perceptions, divided into eight domains: (1) physical activities; (2) body pain; (3) functional limitations from physical health problems; (4) limitations from emotional problems; (5) overall mental health; (6) social functioning; (7) energy/fatigue; and (8) general health. This questionnaire was used by Perez Barbosa et al. ( 33 ).
It should be noted that most studies used cross-sectional data in their analyses. Few studies used longitudinal data, with emphasis on Buck et al. ( 43 ), Collins et al. ( 62 ), McCormack et al. ( 65 ), and Crane et al. ( 76 ). Longitudinal studies are needed, mainly, to investigate the causal relationship between interventions in the urban transport sector and health aspects.
The HIA methodology was also used in the studies. The HIA is the main research approach and practice for determining policy-making impacts on health determinants and outcomes ( 107 ). This was used by Giallouros et al. ( 108 ) to estimate the combined risks of exposure to air pollution and physical activity for all causes of mortality in active passengers (people who cycle or walk to work) in six countries (Finland, England, Brazil, U.S.A., China, India). The analysis considers changes to travel behavior when using AT versus PT, or simulated active passengers working from home on days with high levels of PM2.5 pollutants. Mueller et al. ( 109 ) verified the health impacts caused by expanding cycling networks in European cities in England, Italy, Spain, Switzerland, and Belgium. Scenarios were proposed to increase cycling, decrease car use, and promote PT use. They estimated the impacts on all causes of mortality, physical activity levels, air pollution, and traffic accidents. They also presented a cost–benefit analysis (CBA), where they estimated the costs for expanding cycling lanes and the economic benefits of reducing premature deaths. Otero et al. ( 110 ) conducted a similar study, analyzing the health impacts of shared bicycle systems in Belgium, France, Germany, Italy, Poland, and Spain. They estimated the number of deaths (increased or reduced) from increased physical activity, reduced traffic accidents, and reduced exposure to pollution from substituting cars for shared bicycles. Tainio et al. ( 111 ) used HIA to verify the extent to which physical activity benefits from using AT would outweigh the harm from exposure to air pollution. The authors concluded that the benefits outweigh the negative effects in most cases.
Lozzi and Monachino ( 107 ) also highlighted several tools originating from the HIA methodology, such as the Health Economic Assessment Tool (HEAT), the Integrated Transport and Health Impact Modeling Tool (ITHIM), Transportation, Air pollution, and Physical Activities (TAPAS), and the Urban and Transport Planning Health Impact Assessment (UTOPHIA). The HEAT is used to verify economic benefits from transportation policy investments. Ilie et al. ( 112 ) used this methodology to verify the advantages and disadvantages of non-motorized commutes compared to motorized commutes in Spain and Romania. Kriit et al. ( 83 ) performed economic health analyses on urban cycling infrastructure investments in Stockholm, Sweden. Pérez et al. ( 113 ) estimated the economic health benefits of policies encouraging AT in Barcelona, Spain. Rodrigues et al. ( 106 ) assessed the economic health impacts from making changes away from cars to bicycles in Porto, Portugal. They proposed three scenarios with different rates of changes to travel patterns, and calculated reduced deaths from five diseases: colon cancer, breast cancer, diabetes, heart disease, and cerebrovascular diseases. With respect to economic analyses, a CBA was used by Brey et al. ( 114 ), who sought to estimate the social and economic returns from investments in Seville, Spain, from building bicycle paths. Chapman et al. ( 103 ) conducted a similar study to estimate the health-related and emission-related cost-effectiveness for two AT interventions in New Zealand.
The aforementioned studies highlight the importance of AT for improving populational health. However, some studies analyze certain negative impacts, such as cyclist exposure to atmospheric pollution and noise pollution. For example, Apparicio et al. ( 115 ) evaluated cyclist exposure to air pollution and noise pollution in Canada, and identified local factors that influence pollution exposure, such as temperature, humidity, wind, and time of day. Bertrand et al. ( 116 ) verified air quality with respect to CO pollution in cycling paths in different urban areas of a city in Australia. A sensor was used to detect pollutants seven days a week at different times of the day. Using the data, the researchers calculated the pollutant dose inhaled by cyclists and showed the differences between the studied areas using spatial analysis. Qian and Wu ( 117 ) analyzed pollutant PM2.5 exposure among bike-sharing users in underserved communities in Chicago, U.S.A. Wang et al. ( 118 ) proposed a bi-objective route model to minimize travel times and pollutant exposure.
Relationship Among Transportation, Mental Health, and Well-Being
In addition to the impacts on physical health, the transport system also influences people’s well-being, and 8% (33) of the selected articles analyzed this association.
Well-being is a multidimensional concept encompassing positive physical, mental, and social states, as opposed to the absence of disease (or disability), which is related to social and physical environmental experiences among individuals ( 119 ). Transportation systems are related to physical well-being, mental well-being, social well-being, and financial well-being ( 120 ). The authors define physical well-being as an individual’s physical fitness level, energy, and the absence of disease or physical dysfunctions. Transportation is related to this dimension both positively, by encouraging physical activity, and negatively in the form of pollution exposure and traffic accidents. Mental well-being is defined as psychological health, positive mood, and positive self-perception. Transportation systems also influence this dimension despite not being very well documented, mainly in the form of travel times, which can be a source of stress. Social well-being refers to the quality of a social support network, via family or personal relationships, and levels of community involvement. Mobility and accessibility are the transportation system drivers that influence social well-being, since the more difficult it is to travel, the more difficult it is to develop social connections. Furthermore, traffic can also inhibit social connections, making activities less pleasant, or resulting in physical barriers to social interaction. Transportation systems also influence economic well-being, for example, financial resources and access to employment opportunities. Increased mobility can improve access to both employment opportunities and other services, which can improve perceptions on quality of life.
This group focused on the transportation system’s impact on mental well-being and social well-being. In addition, some studies analyzed subjective well-being and aspects related to individual levels of satisfaction (satisfaction with commuting or general satisfaction), which also affect individual well-being.
Many studies have focused on elderly well-being, since older people tend to face more mobility difficulties and cannot drive, leading to social exclusion and a lack of access to certain important health and well-being-related destinations ( 121 ). Social exclusion is defined as a process by which a person or a group of people cannot effectively participate in society, given poor accessibility or mobility. This affects health, quality of life, social cohesion, and social equity ( 122 ). Transportation systems are also important for life satisfaction levels, and for reducing loneliness among the elderly ( 123 ). Curl and Mason ( 121 ), Al-Rashid et al. ( 122 ), Bergefurt et al. ( 123 ), Barnett et al. ( 124 ), Cuignet et al. ( 125 ), He et al. ( 126 ), Lane et al. ( 127 ), Lättman et al. ( 128 ), Spinney et al. ( 129 ), and Štefan et al. ( 130 ) studied elderly well-being.
Some authors highlight the importance of commuting among adults ( 131 ), which is one of their primary activities ( 132 ), and has a strong influence on the quality of life and well-being. Commute time is a relevant factor, since people have less time to devote to other activities, such as exercising or connecting with others ( 133 , 134 ). According to Wang et al. ( 135 ), choosing a mode of transportation influences worker mental health in different ways. Stress from traffic, uncertainty from delays, and long travel times were the most cited factors among drivers. Mental health impacts were provoked by service reliability, personal safety, and comfort for PT users. The authors also provide examples of studies that show that using AT and PT are more beneficial for mental health than individual modes of transportation. Wild and Woodward ( 136 ) explored why cyclists are more satisfied with commuting, and listed four main reasons: a greater degree of control with respect to transportation and the reliability of arrival time; greater opportunities for social interaction; “feeling better” from moderate-intensity exercise; and pleasurable levels of sensory stimulation.
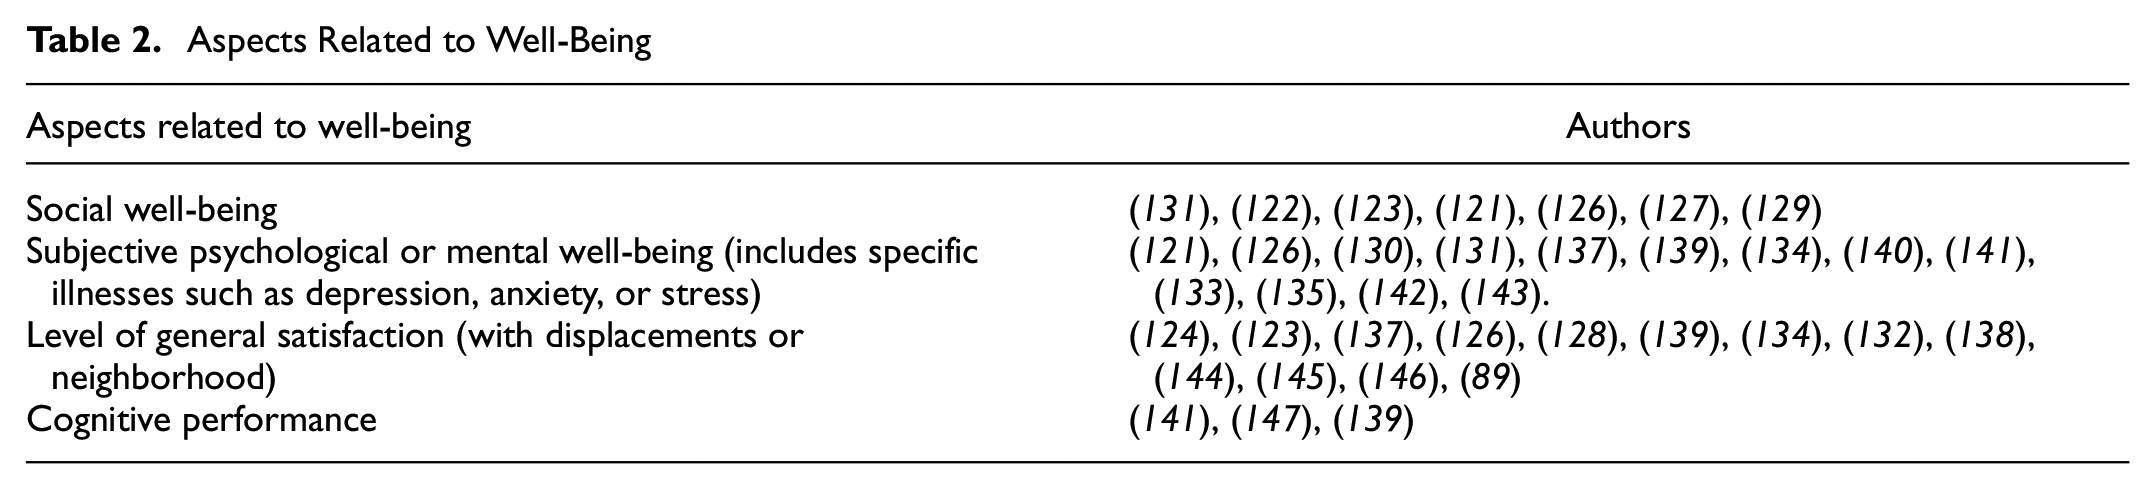
Wellness is a multidimensional concept, and each study approached it differently. Table 2 corroborates this finding and shows the aspects related to well-being and the respective works in which they were addressed. The possibility of analyzing more than one dimension jointly was noticed. Psychological issues and those related to the level of satisfaction were the most analyzed. The survey of dimensions related to well-being allowed one to identify possible ways to evaluate and measure them, which can contribute to future research in the area. Levels of satisfaction encompass people’s general level of satisfaction related to the way they feel about their lives. Assessments can be made directly, by asking about how satisfied a person feels, for example, Lättman et al. ( 128 ) and Chng et al. ( 137 ), or by measuring the level of life satisfaction using the Life Scale tool, which evaluates five statements: “I am satisfied with my life”; “So far I’ve achieved the important things that I want in my life”; “My life is close to ideal in most respects”; “The conditions of my life are excellent”; and “If I could live my life over again, I wouldn’t change anything.” Each statement is rated on a five-point scale, ranging from strongly disagree to strongly agree. This scale was used by Bergefurt et al. ( 123 ) and Sha et al. ( 133 ). Some studies assess specific levels of satisfaction related to neighborhoods ( 124 ), displacement, or modes of transportation ( 126 , 132 , 138 ). The “Satisfaction with Travel Scale” tool can be used for displacement or modes of transportation ( 138 ).
Aspects Related to Well-Being
Some studies analyze passenger transportation systems and mental health using standard questionnaires. As in the item referring to the impact of AT on health, the use of the SF-36 health survey questionnaire was also verified in this group. This questionnaire assesses mental health and was applied by Cuignet et al. ( 125 ), Kent et al. ( 134 ), and Zijlema et al. ( 148 ). Kent et al. ( 134 ) used a shortened version of the questionnaire called the SF-12 health survey. Chng et al. ( 137 ) used the “General Health Questionnaire.” Sha et al. ( 133 ) used the Chinese Health Questionnaire-12. Štefan et al. ( 130 ) used Kessler’s six-item test, and Curl and Mason ( 121 ) used the Warwick-Edinburgh Mental Wellbeing Scale. The Warwick-Edinburgh Mental Wellbeing Scale determines the frequency of 14 statements on subjective happiness and psychological well-being over the past two weeks. Makarewicz and Németh ( 140 ) used the Personal Wellbeing Index for subjective well-being, consisting of seven subjective questions representing life domains that contribute to general subjective well-being, that is: standard of living; physical health; personal relationships; community engagement; personal security; future security; and fulfillment. Wang et al. ( 135 ) studied the associations between commuting patterns and depression symptoms in 11 Latin American cities. The authors used the “ten-item Center for Epidemiologic Studies (CESD-10) scale” for data collection, where participants rate how often (over the past week) they had felt items listed in a questionnaire. A similar questionnaire was also used by Zhang et al. ( 143 ) (the Center for Epidemiological Depression Studies [CES-D] scale) to assess the association between built environment attributes and depression. Some aspects related to transportation were considered in the analysis, such as access to utilitarian places, street connectivity, and physical activities for commuting.
The study developed by Avila-Palencia et al. ( 131 ) used longitudinal data to evaluate the association between the use of different transport modes and several health and social contact measures. The participants from seven different European cities answered the questionnaire in two different moments of the research, allowing one to verify if there were changes in the choice for mode of transport. The results showed that cycling was associated with good self-perceived health and with all measures of mental health. Walking was associated with good self-perceived health, higher vitality, and more frequent contact with friends/family. Lastly, car use was associated with fewer feelings of loneliness
Jimenez-Vaca et al. ( 139 ) explored how stress and cognitive performance are affected by commuting via PT and cycling in Bogotá. This study surveyed seven participants, evaluating both stress and cognitive performance using tests before and after trips. Stress was analyzed via cortisol levels in saliva, and cognitive performance was analyzed using the Stroop test, or color test. Group comparisons were made using the ANOVA test. The authors found no significant difference for either test. It is important to highlight that this result was based on the analysis of seven participants, which may have influenced the non-significance of the difference between the two groups. Despite this limitation, the study contributes with possible ways to assess cognitive performance objectively.
Most studies used statistical techniques to verify associations between displacement variables and aspects of well-being. Table 3 shows the most frequently used methods, that is, regression models (linear, logistic, binary, ordinate, Poisson) and structural equation models, especially the path analysis method, which is a special case structural equation model. This method allows multiple direct and indirect relationships between independent and dependent variables to be tested simultaneously ( 123 ). The identification of methods applied in the studies is relevant to guide other researches with similar objectives.
Methods Used in Studies on Transportation and Well-Being
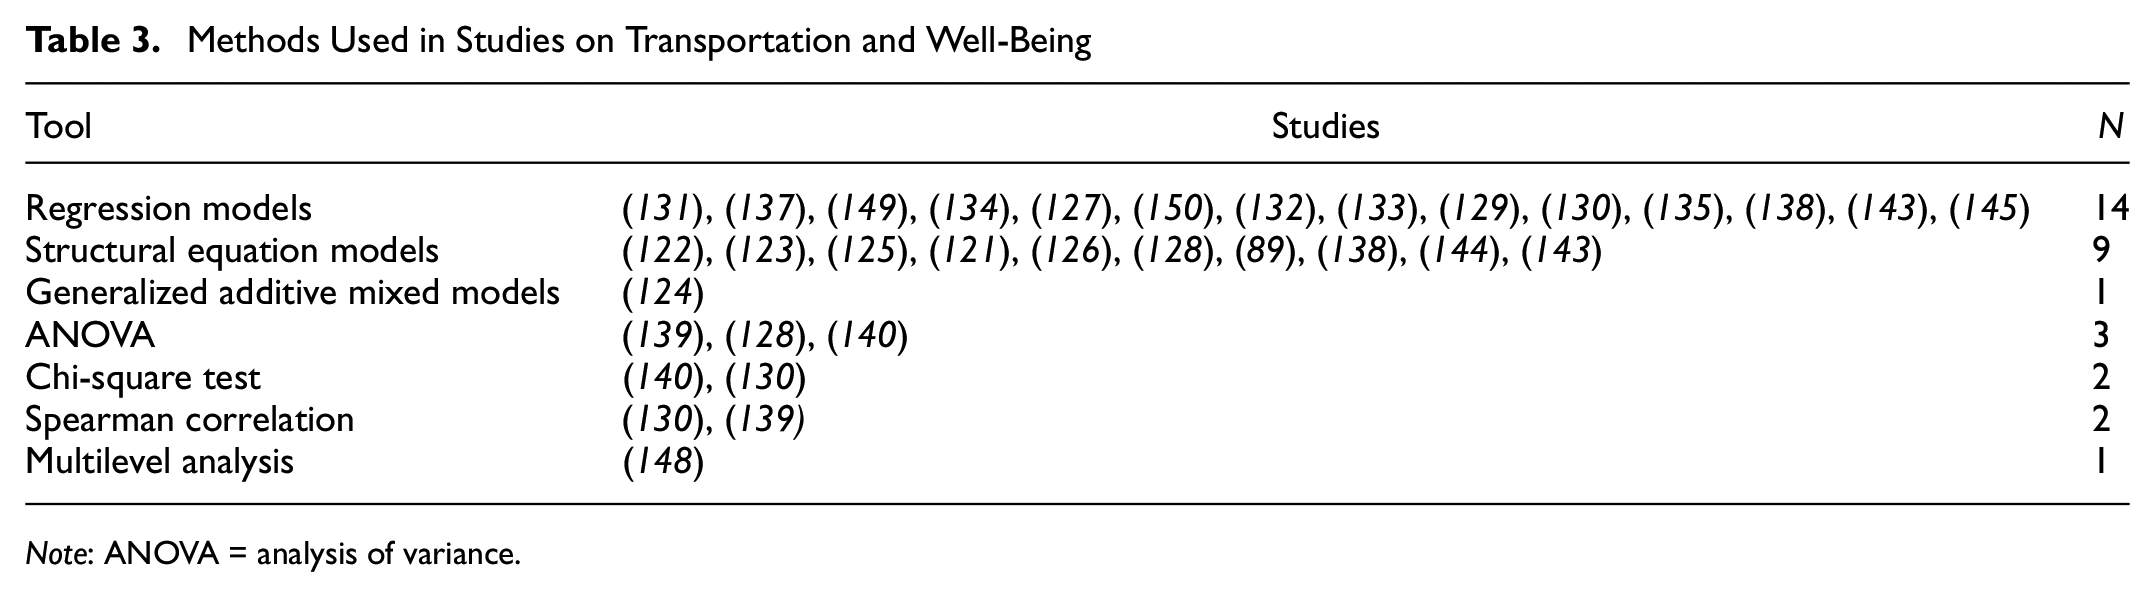
Note: ANOVA = analysis of variance.
Relationship Between Public Transportation and Health
PT can affect individual health in several ways and 5% (22 papers) of the studies evaluated this association. Some authors stated that using PT can result in physical activity since people need to walk to access points and stations, which is important for health ( 151 , 152 ). Wong et al. ( 153 ) state that commuting via PT is convenient, economically advantageous, and less stressful for passengers, compared to commuting by car. According to the authors, PT also reduces traffic, leads to shorter travel times, and improves productivity. However, PT users may be more affected by the high pollution concentrations and have adverse health effects. Therefore, PT can affect populational health both positively and negatively.
A set of studies in this group assessed how PT use can lead to increased physical activity related to transportation. Bartels et al. ( 151 ), for example, evaluated differences in the physical activity levels of bus rapid transit (BRT) users and non-users in South Africa using logistic regression models. Walking was the most common way of getting to/from the BRT station, and few users used motorized modes of transportation for this. Most users lived more than 500 m from a station. BRT users also accumulated more general and transport-related physical activity than non-users. Lemoine et al. ( 154 ) also evaluated associations between BRT use and physical activity in Colombia. The “International Physical Activity Questionnaire” was applied to a sample of 1000 people, and accelerometers were given to a subsample of 250 people. The variable associations were verified using logistic regression models and generalized additive models. The authors also concluded that BRT users tended to walk more than non-users. Objective data from accelerometers also showed that users accumulated more minutes of moderate/vigorous physical activity. In the U.S.A., Knell et al. ( 155 ) subjectively and objectively evaluated the relationship between PT use and physical activity using questionnaires and accelerometers. Data from the questionnaires showed that primary PT users (those who use PT as their main form of transportation) accumulate more moderate/vigorous physical activity than other participants. Accelerometer data, on the other hand, showed that older people, people who lived far from a PT station, and individuals with higher BMI values, had lower physical activity levels. The logistic regression model developed with the self-reported data showed that PT users are 7.3 times more likely to meet sufficient physical activity requirements than non-users. Lachapelle and Pinto ( 156 ) found a similar result in Canada. The authors used data from a national survey and a logistics regression model to assess the relationship between PT and AT use. The results indicate that more PT users reached recommended physical activity levels. Chaix et al. ( 152 ) presented a new methodology for measuring displacement walking among PT users. The study was carried out in France. The authors concluded that both the distance walked and the number of steps were superior when using PT compared to displacement walking alone.
PT use is also associated with other health aspects. Brown et al. ( 157 ) verified whether changes in passenger numbers from implementing a light rail (LRV) line were associated with the BMI in Salt Lake, U.S.A. Self-reported measurements on displacements and objective GPS measurements were used. Both data showed associations with the BMI. For objective measures, it was observed that old users tended to increase BMI and new users showed a downward trend. The self-reported data analyses showed similar results. However, for new users, the association had a non-significant effect. Chiatti et al. ( 158 ) evaluated the associations between self-perceived health among older adults and public mobility services in three cities in Sweden. They used the SF-12 questionnaire, which addresses questions on physical and mental health. The results showed that people in good physical and mental health tended to walk more than 500 m at least once a week, had access to, and often used cars, lived near bus stops, and frequently used PT. The multivariate analysis showed that the elderly who lived between 200 and 500 m from a bus stop had worse mental health than those who lived less than 200 m away. Not using PT was associated with worse mental health. Wang et al. ( 159 ) also analyzed self-perceived health relative to long-distance commuting and using high-speed trains in China. Overall, more respondents perceived negative associations between mode of transportation use and physical and mental health. However, people who had previously traveled long distances using other modes of transportation and then switched to high-speed trains tended to report more positive experiences for their health effects. Participants who started traveling long distances after implementing high-speed trains tended to view the association negatively. Furthermore, people who accessed trains via walking or cycling also had more positive views than people who accessed PT by car. In Brazil, de Saboya Lenzi et al. ( 160 ) investigated the signs and symptoms of carpal tunnel syndrome patients who used PT. The authors stated that some patients cited paresthesia in their fingers after using PT because of the vibrations. Some 205 patients were studied, and the only significant variable was displacement time. After 15 min, patients started to develop symptoms.
Tétreault et al. ( 161 ) used the HIA methodology in Canada. They sought to quantify health benefits and harms up to 2031. They simulated a scenario considering all planned PT infrastructure for the Montreal region, and the results were compared with a no-infrastructure scenario. They estimated travel demands, traffic flows, and NO2 emissions. The HIA was performed considering total mortality, mortality caused by cardiovascular diseases, breast cancer, colorectal cancer, asthma, and diabetes. The proposed scenario resulted in more PT trips and increased walking to access PT. There were small reductions in NO2 pollutant emissions. Increased PT use reduced 104 disability-adjusted life years lost, mainly because of increased physical activity and reduced road traffic accidents. Despite the gains, the authors emphasized that the planned PT project scenario in Montreal did not drastically reduce vehicle and transport infrastructure attributed to diseases, resulting in low and localized impacts on the regions that benefited from the projects.
Three studies analyzed the influence of PT access on health aspects, that is, Badland et al. ( 162 ) and Brown et al. ( 157 ), in Australia, and Wang et al. ( 163 ), in China. The first developed a conceptual model showing how access to PT impacts a region’s transportation system, individual behavior, and health outcomes. The study was applied to a sample of 9495 adults, studying accessibility to different modes of PT, level of vehicle ownership in each region, the level of traffic exposure, travel time, sitting time per day, and health self-assessments (physical and mental) using a five-point Likert scale. Variable associations were verified using regression models. The results showed that living outside the ideal PT access area corresponded to higher vehicle ownership levels and greater traffic exposure. These two variables were associated with a longer commute and sitting time. Longer sitting times are associated with worse self-rated health. Brown et al. ( 157 ) verified how PT accessibility improvement scenarios would affect physical activity, obesity, and traffic injuries. The authors found health and economic gains to be related to improved accessibility. Wang et al. ( 163 ) verified how PT accessibility perceptions influence physical activity levels. Three mixed-effect regression models were developed. The first model was not adjusted, while the other two were adjusted to individual characteristics and place of residence (residential density and green areas). All models showed that everyone who had a better perception of accessibility was more likely to meet the necessary physical activity requirements.
Gastelum-Arellanez et al. ( 164 ), Gong et al. ( 165 ), Jia et al. ( 166 ), Nogueira et al. ( 167 ), Tang et al. ( 168 ), and Wong et al. ( 153 ) studied the effects of exposure to pollution when using PT, that is, high concentrations of different pollutants in closed places. Triguero-Mas et al. ( 169 ) verified a relationship among PT strikes in Spain, number of hospitalizations, and mortality rates from cardiorespiratory diseases. The authors sought to verify whether this association was mediated by increased air pollution caused by increases in individual motorized transportation use. The results suggested increased respiratory disease events on strike days. However, they concluded that this association was not mediated by increased air pollution.
Table 4 gives a summary of the types of applications between PT and health, and the tools used in each application. The analysis of the articles in this group identified four main subgroups: (1) use of public transport and practice of physical activity; (2) use of public transport and other health aspects; (3) influence of access to public transport on health; (4) exposure to air pollution and health impacts from using public transport. The latter was the most representative subgroup with respect to number of searches found, followed by the subgroup use of public transport and practice of physical activity. Few studies that addressed different health aspects associated with the use of public transport were found. Research that expands this range of analyses would contribute to the literature on the impact of this mode of transport on health.
Applications and Methods for Public Transportation (PT) and Health
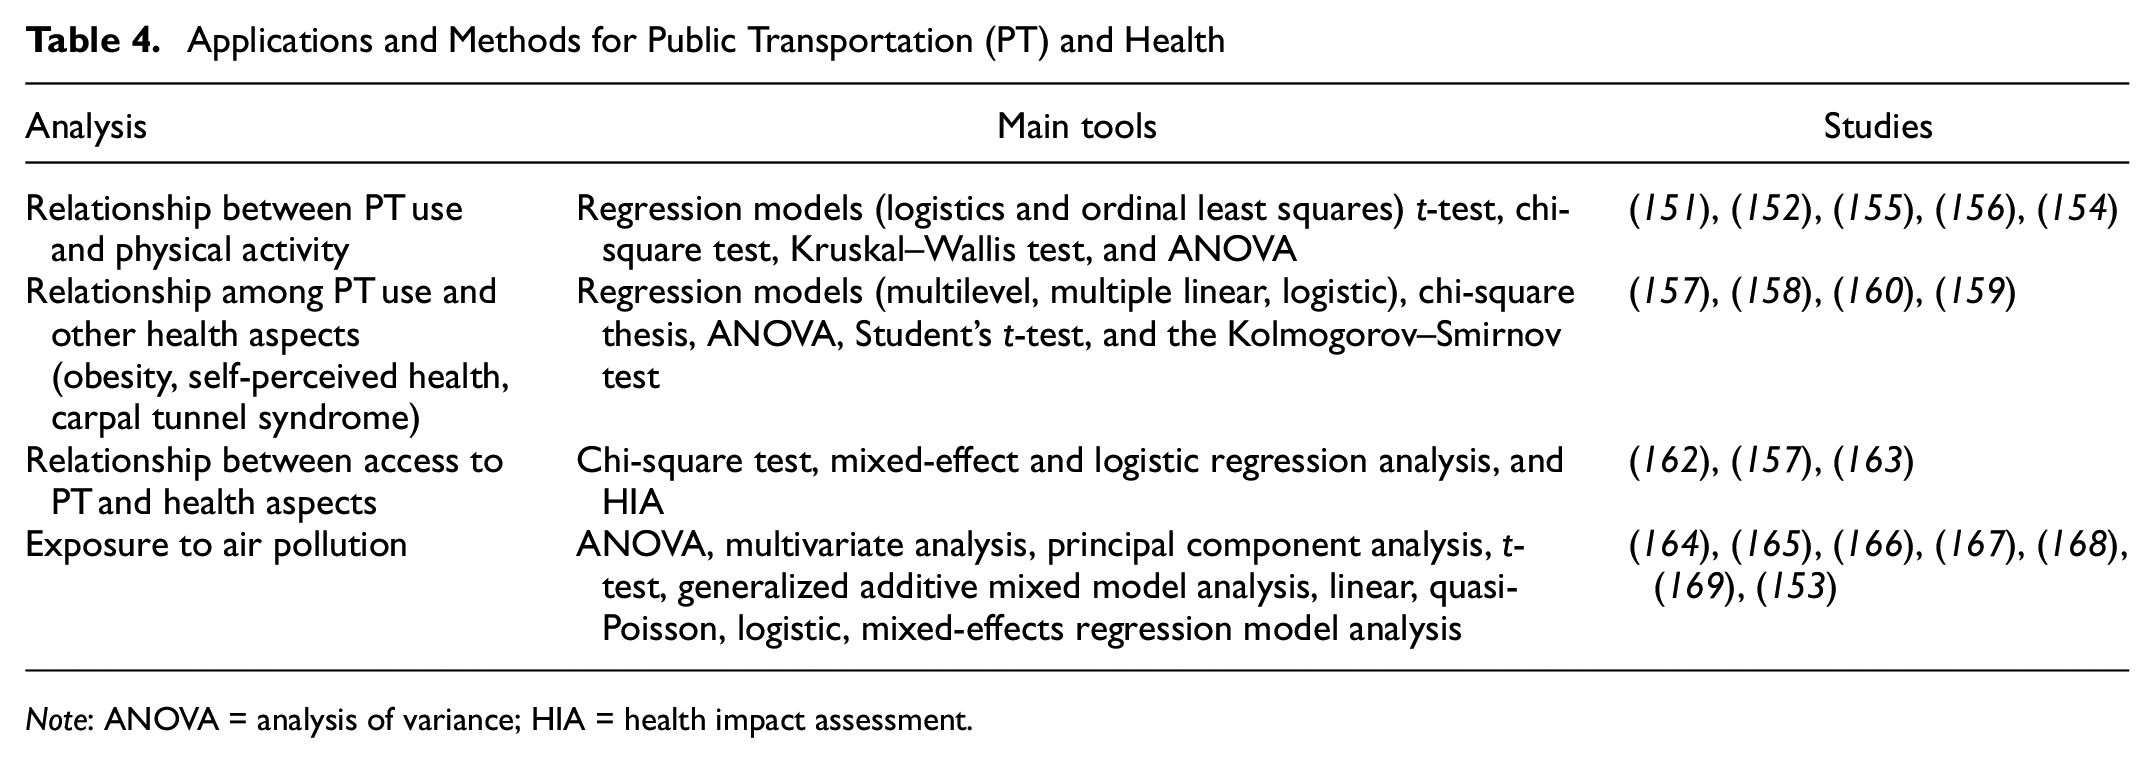
Note: ANOVA = analysis of variance; HIA = health impact assessment.
Other Applications
The “other applications” group included articles that analyzed travel behavior health impacts in general, considering several modes of transportation simultaneously and urban planning impacts, more specifically transportation system planning. Twenty-two articles were analyzed within this group, 11 of which used the HIA methodology, for estimating policy-making impacts on health determinants and outcomes ( 107 ).
The methodology was used to estimate premature mortality caused by non-compliance with international requirements for air pollution and noise exposure, and access to green spaces, physical activity, and heat in a city in Austria ( 170 ). The authors concluded that 8% of premature deaths were attributed to non-compliance with exposure levels, 76% of which were caused by air pollution exposure and insufficient physical activity. Furthermore, they also concluded that people residing in lower purchasing power areas had a higher risk of premature death from NO2 pollutant exposure, noise pollution, heat, and less access to green spaces. Similarly, Mueller et al. ( 171 ) also considered international recommendations for the same transport-related factors (air pollution, noise, access to green spaces, heat, and physical activity), in Barcelona, Spain, to estimate offset morbidity and disability-adjusted life years. They used the UTOPHIA tool, which originated from the HIA methodology. The authors stated that there are many morbidities and lost days of life because of disabilities since Barcelona does not reach recommended exposure levels, with 36% of all disease loads caused by noise exposure.
Another study carried out in Barcelona estimated the health impacts of implementing a new urban model ( 172 ), called the super blocks model, consisting of an innovative urban and transportation planning strategy to recover public spaces, reduce motorized modes, promote sustainable mobility and healthy lifestyles, provide green spaces, and mitigate the effects of climate change. The authors showed that 667 deaths could be avoided annually by implementing the proposed model. Most deaths could be avoided by reducing NO2 emissions, followed by reducing noise, and by developing green spaces. Increased physical activity from changes to walking habits could prevent 36 deaths annually, and 198 days of life expectancy could be gained, on average, for people aged 20 and over. Reducing 667 premature deaths would result in 1.7 billion euros per year in economic impacts.
Mueller et al. ( 173 ) estimated mortality burdens associated with current exposure levels in the U.K. to multiple factors related to urban planning and transportation. The study sought to investigate mortality burden distributions among the population, focusing on socioeconomic status. The authors used the UTOPHIA method and calculated the number of premature deaths from exposure to physical activity levels, noise levels, air pollution levels, and access to green spaces. They found that half the population was not sufficiently active, and that the PM2.5 pollutant and noise levels exceeded recommended levels. Some 18% of the population did not live within the recommended distance for access to green spaces, and 375 annual premature deaths could be avoided if the U.K. complied with international recommendations for the analyzed factors. The highest proportion of avoided deaths would be from physical activity, followed by access to green spaces and noise reductions. Finally, the authors found that residents in lower-income areas and ethnically diverse areas were at greater risk of exposure to the aforementioned factors.
Nadrian et al. ( 174 ) carried out a HIA in a city in Iran on transit and transportation initiatives using mixed methods. Several data sources were used, for example, focus groups and semi-structured interviews with residents and informants linked to the transportation area. The authors also carried out field observations of city traffic. A questionnaire called Urban Traffic-related Health Determinants was applied to 500 people in community interviews, which included eight domains: physical environment; social environment; public services and accessibility; family circumstance; public policies; substance use; social welfare services; and air quality. The impact of each transport-related variable on health and quality of life was verified using statistical tools such as the t-test, one-way ANOVA, and linear regression. Both quantitative and qualitative data showed that traffic in the city had a direct and indirect impact on physical health. The most significant impacts were increased mortality, disease morbidity, and traffic-induced fatigue, which can affect the life expectancy of the population. The most affected populations in the study were in direct exposure to congestion, particularly PT drivers. Indirect impacts included delays in emergency care caused by congestion, morbidity, mortalities from air and noise pollution illnesses, mortalities/disabilities from traffic accidents, physical inactivity, and obesity from vehicle dependence. Older residents were most indirectly affected because of vulnerabilities to air/noise pollution and pedestrian accidents. Another result pointed out by the study was that PT drivers and their families had the most negative impacts on mental health. It should be noted that the impact on the health of public transport drivers is not limited to the impact on mental health. As shown in Figure 5, the occupational health of workers involved in the transport sector is a field of research. These studies were not analyzed in detail as they were not part of the scope of the SLR.
The HIA methodology allows researchers to verify health impacts by considering different scenarios, for example, a study by Nicholas et al. ( 175 ), who sought to determine health impacts related to three future travel behavior scenarios in Los Angeles, U.S.A. More specifically, the ITHIM methodology was used to model the impacts of the Los Angeles 2035 mobility plan. The scenarios considered the three main transport infrastructure elements of the Mobility Plan: expanded vehicle network (adding vehicle lanes on designated lanes); expanded public transport network (converting vehicle lanes into dedicated bus lanes on designated lanes); and expanded bike lane network (converting vehicle lanes into bike lanes on designated lanes). Outcomes were described relative to cardiovascular diseases, diabetes, illnesses from air pollution, and road traffic injuries. Health-related costs for each scenario were also presented. An estimated 71 cardiovascular disease deaths could be avoided, relative to the baseline scenario, in the most conservative scenario, and 191 deaths could be avoided in the higher AT scenario. Twelve diabetes-related deaths could be avoided, relative to the baseline scenario, in the most conservative scenario, and 30 deaths could be avoided in the higher AT scenario. Pollution exposure diseases did not change significantly. An increase in serious injuries and deaths from road traffic accidents was projected in all three scenarios.
The ITHIM was applied in Brazil to create alternative scenarios for São Paulo city to understand the magnitude of the health impacts resulting from changes to populational travel patterns ( 176 ). The comparison scenario considered populational travel patterns according to 2012 mobility survey data. This scenario was compared with four other scenarios: the travel behavior of residents in downtown São Paulo; London travel patterns (high PT use and walking); California travel patterns (high levels of motorization); and travel behavior based on the São Paulo 2040 city plan: “The city we want.” The latter projects a São Paulo with higher levels of walking and cycling and lower levels of car and motorcycle use. Furthermore, this plan states that any destination must be reachable within a maximum of 30 min, that walking should be the main mode of transportation for both genders and for all ages, and that PT should be prioritized. Health impacts were modeled considering relative risks for diseases such as stroke, ischemic heart disease, type 2 diabetes, colon cancer, dementia and Alzheimer’s, depression, and other cardiovascular and circulatory diseases. The SP California scenario resulted in health damages, while other scenarios showed benefits for both men and women. Some 406 deaths could be avoided annually in the 2040 mobility plan scenario.
Thondoo et al. ( 177 ) assessed the health impacts of different travel pattern scenarios in a city in Mauritius, Africa. The authors analyzed three scenarios: bad (double the number of car trips and reduced walking, motorcycle, and PT use); good (a half reduction in car trips, and a consequent increase in walking, motorcycle, and PT use), and ideal (reduce car and motorcycle trips and increase walking and PT use). The study consisted of participatory evaluations of baseline data collection, transportation policy scenario co-validation with stakeholders, and quantitative health impact modeling. The impacts were calculated by analyzing air pollution, accidental deaths, and physical activity determinants. The ideal scenario resulted in 13.72 fewer premature deaths per year and economic gains of the order of 23 million dollars. Furthermore, the authors recommended using participatory approaches for quantitative health impact analyses to ensure that contextual specificities are considered. Rossi et al. ( 178 ) estimated health benefits from implementing speed limits in a city in Switzerland under different scenarios that consider noise and accident exposure. Impacts were calculated for cardiovascular diseases, diabetes, irritation, sleeping problems, and traffic accidents. The scenario with speed limits for the whole city resulted in significant mortality and injury reductions from traffic accidents.
Tobollik et al. ( 179 ) quantified the benefits of greenhouse gas mitigation policies in Rotterdam, the Netherlands. Two targets were set for the city, that is, a 10% reduction in miles traveled by private motor vehicles in the city center and 50% electric car use in the city by 2020. These scenarios were compared with a more realistic baseline scenario. The effects of these policies were assessed by comparing the disease burdens from air pollution and traffic noise in 2010 (baseline). PM2.5 and carbon emissions were considered to model health effects for all scenarios. Noise pollution was considered in the models in addition to pollutant emissions. Health impacts were measured considering all-cause mortalities, ischemic heart disease, lung cancer, irritation, and sleeping problems. A 21-year life expectancy reduction from disabilities caused by irritation and a 35-year life expectancy reduction from disabilities caused by sleeping disorders were estimated for the first goal. The 50% electric car goal showed slightly higher results. Both interventions had marginal effects on air pollution.
Stevenson et al. ( 180 ) studied urban planning effects by estimating health impacts from land-use policies and transportation policy initiatives in Melbourne, London, Boston, Copenhagen, São Paulo, and Delhi. The changes were made based on compact city concepts. The compact city scenario (higher density and diversity, and shorter distance to PT) resulted in health gains in all cities. Cities with a high rate of motorization, such as Melbourne, London, and Boston, showed small increases in road traffic injuries for cyclists and pedestrians. The other studies in this group (11 articles) had different objectives, and are shown in Table 5, which also describes the objectives, tools, and health determinants addressed in the studies.
Articles in the “Other Applications” Group
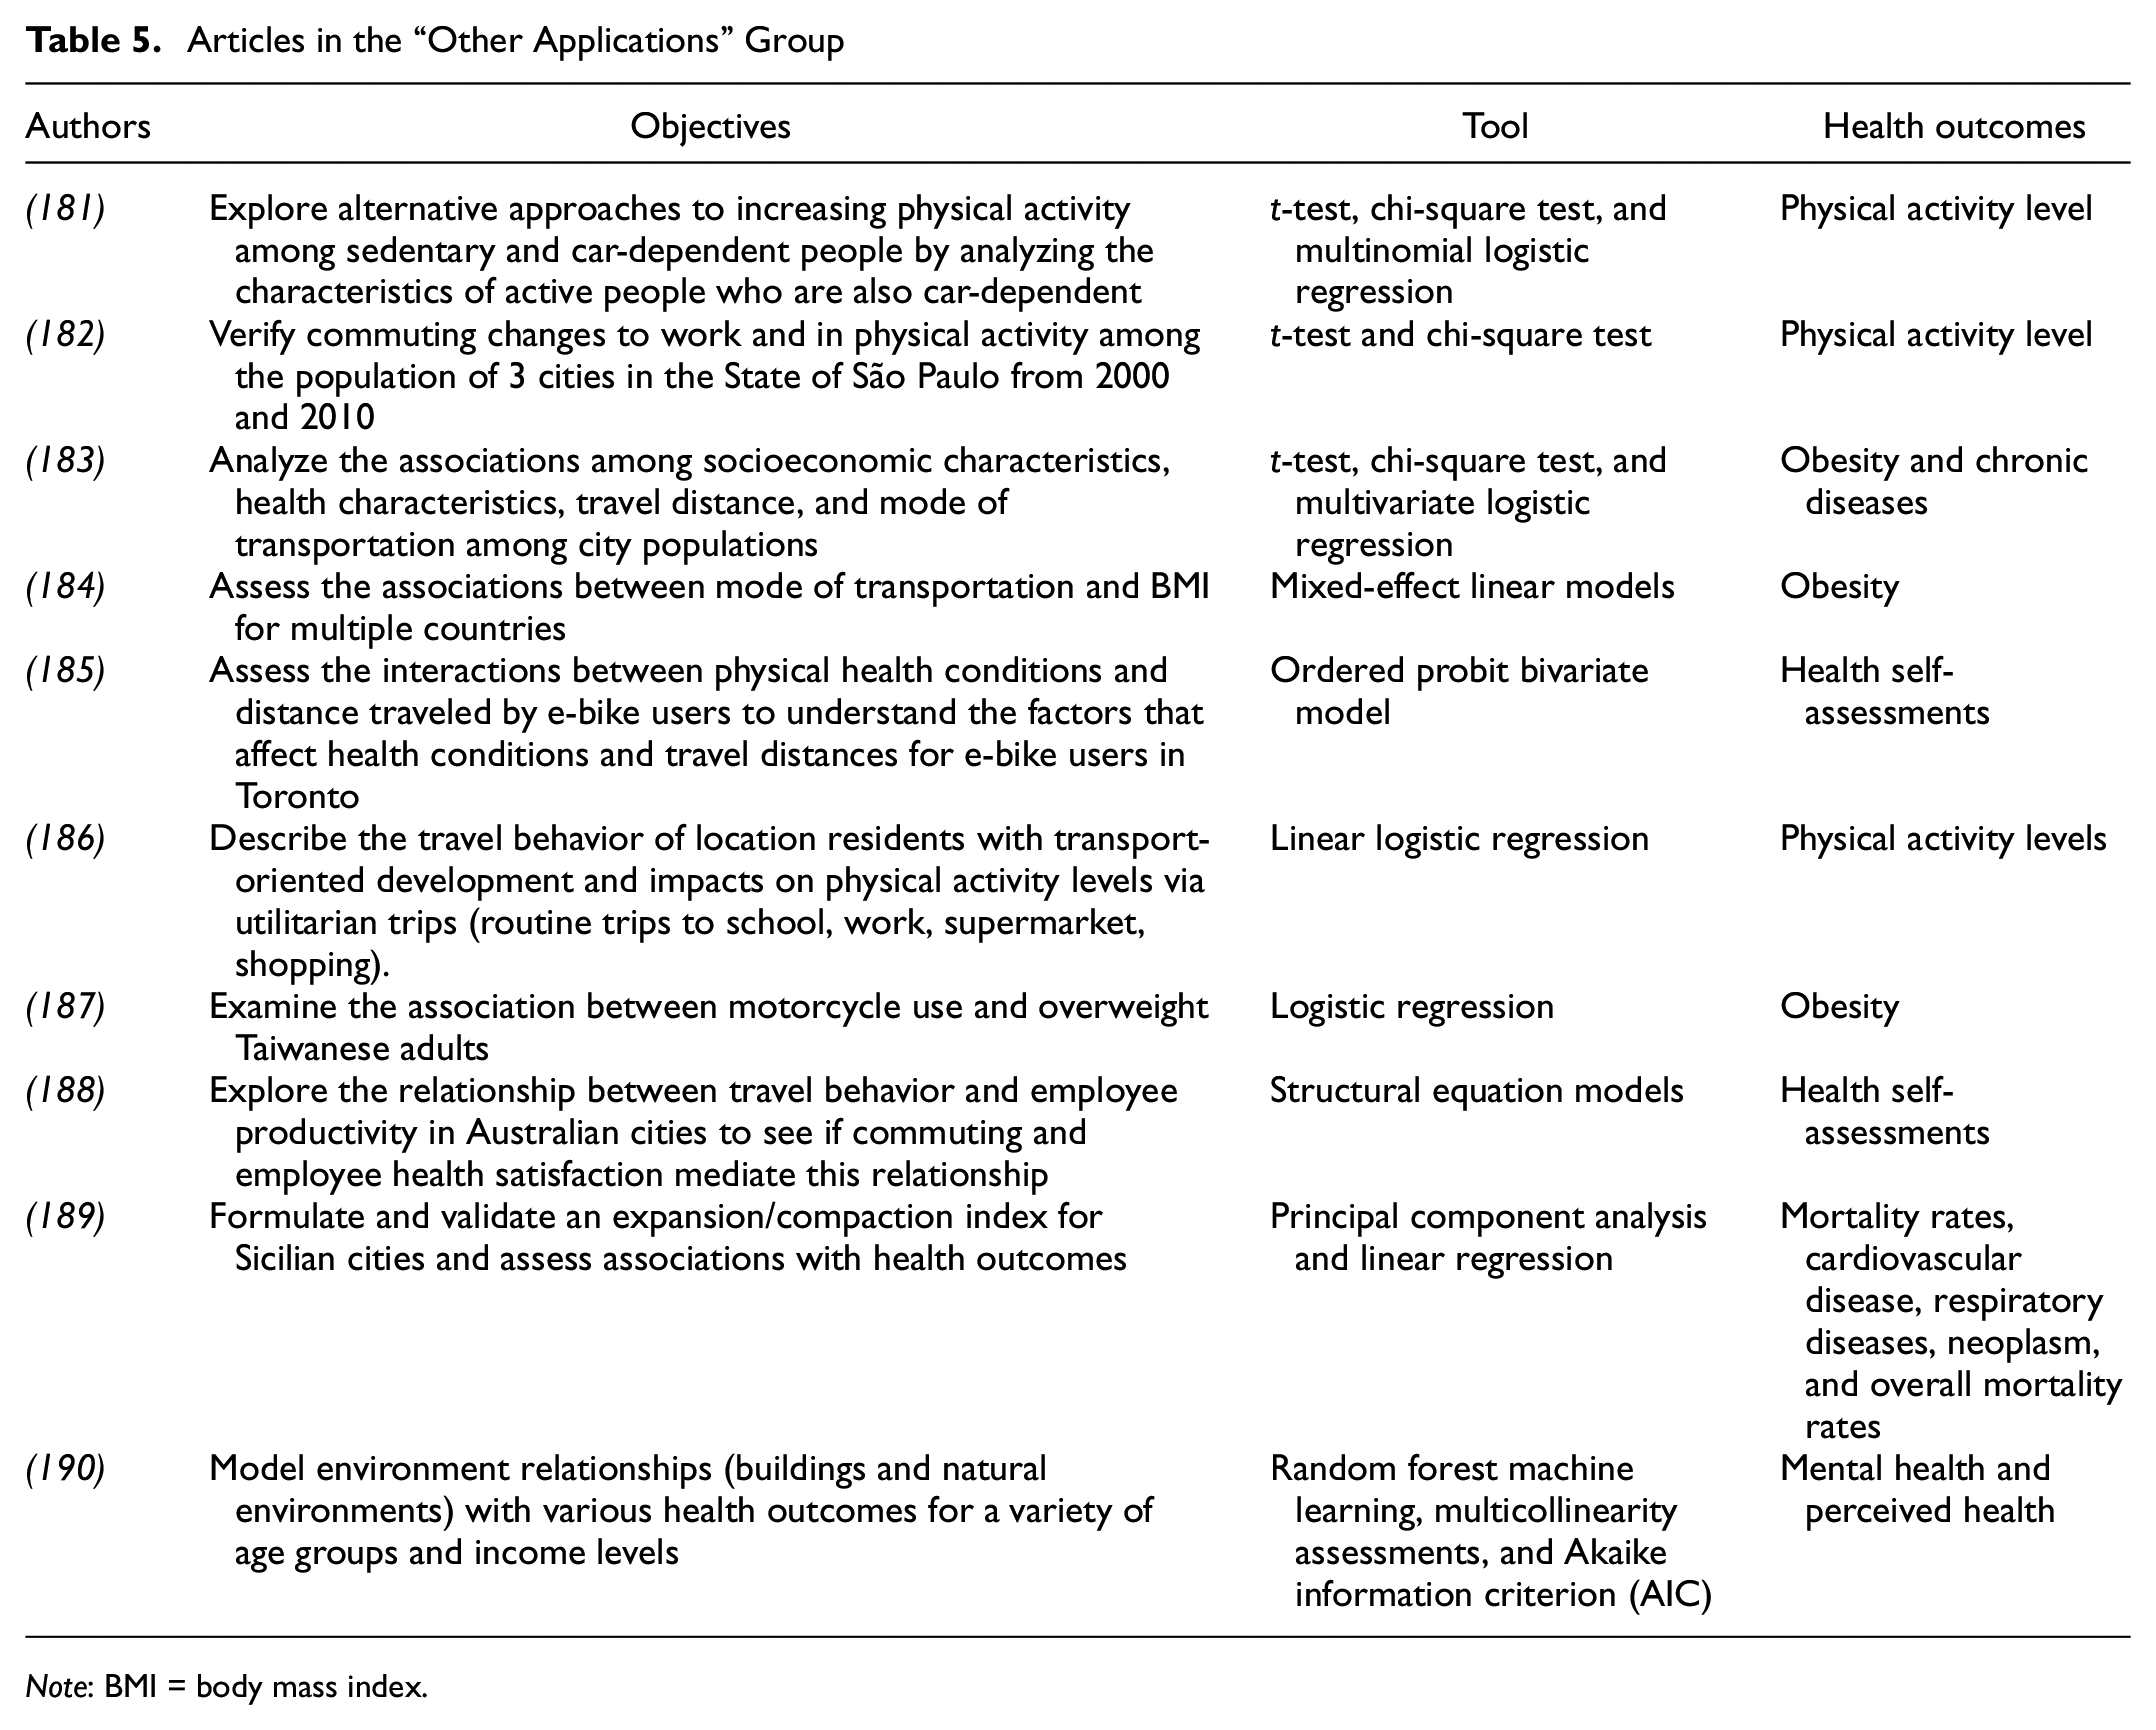
Note: BMI = body mass index.
Despite the different objectives of the articles, statistical tools were used in most studies, especially regression models and correlation tests. The articles analyzed the relationship of commuting variables with the level of physical activity ( 181 , 182 , 186 ), obesity ( 183 , 184 , 187 ), and self-rated health ( 185 , 188 , 190 ), as the main health determinants.
Chakrabarti and Shin ( 181 ) found that people who have access to a car are more inactive on average. Car-dependent and active people tend to work fewer hours per day and live in places with more land-use diversity. Similar results were found by Langlois et al. ( 186 ). The authors stated that people who use cars for feeling free tended to have lower physical activity levels. The highest levels were associated with living in transport-oriented places, with better walkability and cycling access. Dons et al. ( 184 ) reported an increase of 0.027 km/m2 in BMI for each additional day of car use per month using cross-sectional data to measure obesity. A significant association was found for car use (increased BMI), bicycle use (decreased BMI), and motorcycle use (increased BMI). The fully fitted model suggested a gradual BMI relationship, that is, bicycle < walking < PT < motorcycle or moped < electric bicycle < car. The BMI of frequent cyclists was lower than those of non-cyclists and occasional cyclists. The results of the longitudinal data showed no significant associations between changes in BMI and changes in the mode of transportation in the fully adjusted model. However, results from the other adjustments suggest that BMI decreases with increased cycling frequency and increases with increased car use. Furthermore, the results suggest that PT use increases BMI. Cyclists who stopped cycling had increased BMIs. Lin et al. ( 187 ) found that longer motorcycle use was also related to obesity. Dėdelė et al. ( 183 ) showed that men with lower BMIs who travel shorter distances use bicycles more.
Conclusions
Transportation systems are an important element for economic and social development within cities. Furthermore, they can both positively and negatively affect the individual health of people living in urban areas. Our study sought to contextualize the literature related to themes addressing urban passenger transportation and health. A SLR was conducted to do this. Some 173 articles were analyzed in detail. This method was effective, allowing us to answer all our established research questions as per the planning phase of this review.
The initial SLR allowed us to identify the main applications in the literature (first question), with emphasis given to transportation access impacts relative to healthcare, AT, and build environment impacts on health. The second research question refers to the main journals in which the articles are published. Overall, two journals stood out among the rest, that is, the International Journal of Environmental Research and Public health and the Journal of Transportation & Health. The review also sought to assess the modes of transport most discussed in studies that analyze the impact of passenger transport on health (third question). AT was discussed most among the analyzed studies. Most of the time, they analyzed the positive impacts coming from physical activities and the resulting well-being from using these modes of transportation. Some studies addressed negative aspects, such as pollution exposure. Less recurrently, applications were verified related to PT use and health impacts for different modes of transportation simultaneously.
The application of several methods in the analyzed studies was verified (question 4). Statistical tools, especially regression models and structural equation models, were the most used. HIAs were also frequently used. This method is used to verify health impacts from policy, program, or project implementations. Possible data collection instruments that were used recurrently were also identified, such as the International Physical Activity Questionnaire to assess physical activity levels, the SF-36 or SF-12 used for health self-assessments, and the NEWS to assess people’s perception of the environment. The identification of methods and data collection instruments is relevant to help future research that intends to analyze the impact of travel behavior on health. Finally, the review also sought to verify the main health determinants related to travel behavior. Physical activity levels were evaluated mostly as health determinants in the studies, followed by the BMI or obesity. It was also verified that well-being is a multidimensional construct, which can be viewed with respect to social and mental well-being, or with respect to cognitive performance and general level of satisfaction.
The bibliographic review also allowed the identification of research gaps, which can be filled in the future. There was a prevalence of applications in higher-income countries, such as the U.S.A., the U.K., and China. Studies in lower-income countries were not very common. This may be because higher-income countries are more concerned with sustainable mobility issues, and because they have greater resources for implementing policies and actions to analyze impacts. Researching developing countries constitutes a significant literature gap. These countries have specific contextual characteristics, for example, more precarious PT systems and few incentives for AT. Therefore, this reality can bring relevant results to the academic area. The impact on health of some modes of transport has still been little explored, such as electric cars, electric bicycles, autonomous vehicles, and scooters. This theme also consists of an important field of research. Few studies have addressed other health determinants, such as some heart problems, different types of dementia, and some types of cancer. This shows that there are still research fields related to travel behavior with these other aspects. From a methodological perspective, a prevalence of studies using cross-sectional data was noted. Few studies used longitudinal data in their analyses. This finding highlights the need for more studies that carry out such analyses, seeking to verify mainly the causal influence of interventions made in the area of transport. Some papers also showed the lack of studies that objectively assess health issues. Most studies use data from questionnaires and participants’ self-perception. This can generate bias in the responses. Therefore, works that manage to evaluate aspects objectively, through devices, exams, and tests, can represent contributions to the literature.
The work has some limitations. The literature on the relationship between transport and health is extensive. For the development of this SLR, two databases were used, Scopus and Science Direct. It is known that the articles that address the relationship between transport and health are not limited to those presented in this review. However, the databases are two of the largest databases of articles published in reputable, peer-reviewed journals. In addition, the articles analyzed allowed the research questions to be answered. This literature review is a representative and comprehensive body of scientific literature on the relationship of transport and health. Another limitation of this study is that the articles related to access to health facilities, modeling of emission of pollutants, traffic accidents, contamination by contagious diseases, and health of employees linked to the mobility sector were not analyzed in detail. It should be noted that the review focused on the impact of travel behavior on mental or physical health, making it meaningless to evaluate such articles. It is recommended as future work to carry out a more detailed analysis of the articles belonging to these groups.
This study has theoretical and practical implications. Firstly, it contributes to the state-of-the-arts by offering a theoretical deepening of relationships between transportation and health, by pointing out the main health issues, methods, and data collection instruments that could be used in future studies. The resulting analyses on applications shows how public authorities and organizations could help improve mobility and promote health. Results from several studies have shown the benefits of using active transport for both physical and mental health. One specific study even showed that the benefits outweigh the harm caused by the exposure of active passengers to pollution. Thus, one of the implications of this review for public authorities refers to the need to encourage active transport. This can be done through improvements to the built environment. The literature review pointed out some characteristics that facilitate this mode of transport, such as mixed land use, residential density, utilities located close to residents, sidewalk availability, street connectivity, and recreational facility availability. In addition to these, active transport can be encouraged by expanding cycle lanes and bicycle racks and improving public and road safety. These features of the built environment should be priorities in urban planning. Another implication for public authorities refers to the possibility of using tools, normally used in the academic field, to aid in decision-making. The Walk Score and some easy-to-administer questionnaires stand out. All of these tools and questionnaires have already been validated and can be assisted by public operators. The automobile incentive, as already discussed in the literature, causes several damages to health. The results of the articles analyzed in the review reaffirmed these findings. In addition to the damage to physical health, the expansion of roads and construction of structures that facilitate the use of individual motorized transport can lead to greater social isolation, one of the dimensions of well-being. Thus, public agents carrying out construction and transport projects must also consider this aspect.
Footnotes
Author Contributions
The authors confirm contribution to the paper as follows: study conception and design: J.B. Santos, J.P. Lima; data collection: J.P. Lima, J.B. Santos; analysis and interpretation of results: J.B. Santos, J.P. Lima; draft manuscript preparation: J.B. Santos, J.P. Lima. All authors reviewed the results and approved the final version of the manuscript.
Declaration of Conflicting Interests
The author(s) declared no potential conflicts of interest with respect to the research, authorship, and/or publication of this article.
Funding
The author(s) disclosed receipt of the following financial support for the research, authorship, and/or publication of this article: This work was supported by the Coordination for the Improvement of Higher Education Personnel (CAPES), the Foundation for the Promotion of Science of the State of Minas Gerais (FAPEMIG), and the Brazilian National Council for Scientific and Technological Development (CNPq) for the financial support given to the projects that supported the development of this work.
Data accessibility statements
Data sharing not applicable to this article as no datasets were generated or analyzed during the current study