
Abstract
To reveal the complex impact of the road grade on heavy-duty diesel truck (HDDT) emissions, the dynamic coupling relationships among the road grade, vehicle operation, and emissions were quantified based on portable emission measurement system data from 24 HDDTs in Chongqing, China. The results showed that the average emission factors of nitrogen oxides (NO x ) and carbon dioxide (CO2) of China IV HDDTs were the highest among all tested HDDTs, and NO x emissions often exceeded their corresponding standard limit values. Next, the coupling relationships of road grade, speed, and emissions were studied. Graded roads caused a 4%–44% decrease in the average vehicle speed, resulting in a coupling effect on emissions. For all pollutants and vehicle emission standards, the HDDT emissions on uphill roads were much higher, while those on downhill roads did not deteriorate significantly owing to the increased acceleration operation. Overall, ignoring the road grade led to estimation errors of between −99.14% and 291.30% for CO2 and between −99.21% and 247.73% for NO x . Speed was less correlated with emissions on downhill roads (≤−3%). For uphill roads (>0%), the joint effect of road grade and speed caused a significant increase in CO2 and NO x emissions up to 21.26 and 17.29 times compared to idling emissions. A Sigmoid function successfully modeled the coupling relationship (average R2 = 0.95), and grouped S-shaped mapping curves were revealed for between −8% and 7% road grade and emissions. The model can estimate the influence of road grades on emissions at different speeds, thus providing support for emission reduction control.
Heavy-duty diesel trucks (HDDTs) play an important role in road transportation and promoting economic development. HDDTs often have larger gross weights, are powered by diesel engines, and run for long-distance trips, leading to their nitrogen oxide (NO x ) and carbon dioxide (CO2) emission levels being significantly higher than those of other vehicles. In China, HDDTs contribute 76.1% of vehicles’ NO x emissions ( 1 ), and almost 30% of vehicles’ CO2 emissions ( 2 ). Although HDDTs account for only a small proportion of on-road traffic, their contribution to NO x and CO2 emissions is significant. This phenomenon has also been observed at different regional scales such as in Chongqing ( 3 ), Foshan ( 4 ), Bogota ( 5 ), England ( 6 ), and Europe ( 7 ). HDDTs pose a major threat to urban air pollution and hamper efforts to achieve carbon peaking and carbon neutrality goals (known as the “dual carbon target”) in China. Thus, controlling HDDT emissions is the key objective of fine-grained air pollution prevention and control and achieving the “dual carbon target.” However, on-road HDDT emissions still lack effective supervision, and exceeding legal limits is common ( 8 ).
The vehicle emission inventory helps to depict the total vehicle emission and its spatio-temporal distribution, while high-resolution and accurate emission inventories are conducive to the effective supervision of on-road emissions. The road grade is a critical factor that influences engine load and fuel consumption; thus, it has a strong correlation with vehicle emissions. When a vehicle is moving uphill, the displacement in the vertical direction requires extra engine power, leading to increased fuel consumption and vehicle emissions. In contrast, when a vehicle is moving downhill, gravity, as a power complement, helps reduce fuel and emissions. The road grade affects the speed–acceleration distribution and is statistically correlated with the vehicle specific power (VSP) (9–12). These are the parameters in the emission model (e.g., MOVES and IVE). Therefore, ignoring the road grade can cause calculation errors in emission models for fueled vehicles. That is, the emissions have been underestimated on uphill roads and overestimated on downhill roads, whereas the influence of road grades on emissions on these roads was asymmetrical ( 13 , 14 ). Therefore, the road grade plays an important role in vehicle emission inventories, especially in mesoscale and microscale inventories ( 15 ).
There has been some research on the impact of the road grade on vehicle emissions (Table 1 and references therein). In general, the impact of the road grade on emissions varies with vehicle type, fuel type, and pollutant type ( 12 , 16–21). Research on the impact of the road grade on on-road emissions in China started relatively late, and there are few studies on HDDTs. Dhital et al. ( 22 ) pointed out that the impact of the road grade on CO2 and NO x emission factors is more significant for larger trucks. Moreover, existing research studies consider the road grade as an independent factor for vehicle emission changes, leading to different conclusions. Gallus et al. ( 18 ) reported that CO2 and NO x emissions from two diesel vehicles both linearly increased with the road grade from −6% to 6%. Costagliola et al. ( 17 ) also tested two diesel vehicles, indicating that the NO x and road grade could be explained by a second-order polynomial function for the road grade range from −4% to +5%. Most importantly, the vehicle operation is sensitive to road grade changes, which are directly related to emissions. The relationship between the road grade and emissions is dynamic with the change in vehicle operation, but this complex coupling relationship remains poorly understood. On the other hand, the integration of the impacts of the road grade and road grade–operation correlation on the HDDT emission calculation is crucial ( 10 ).
Representative Literature About the Impact of Road Grades on Vehicle Emissions
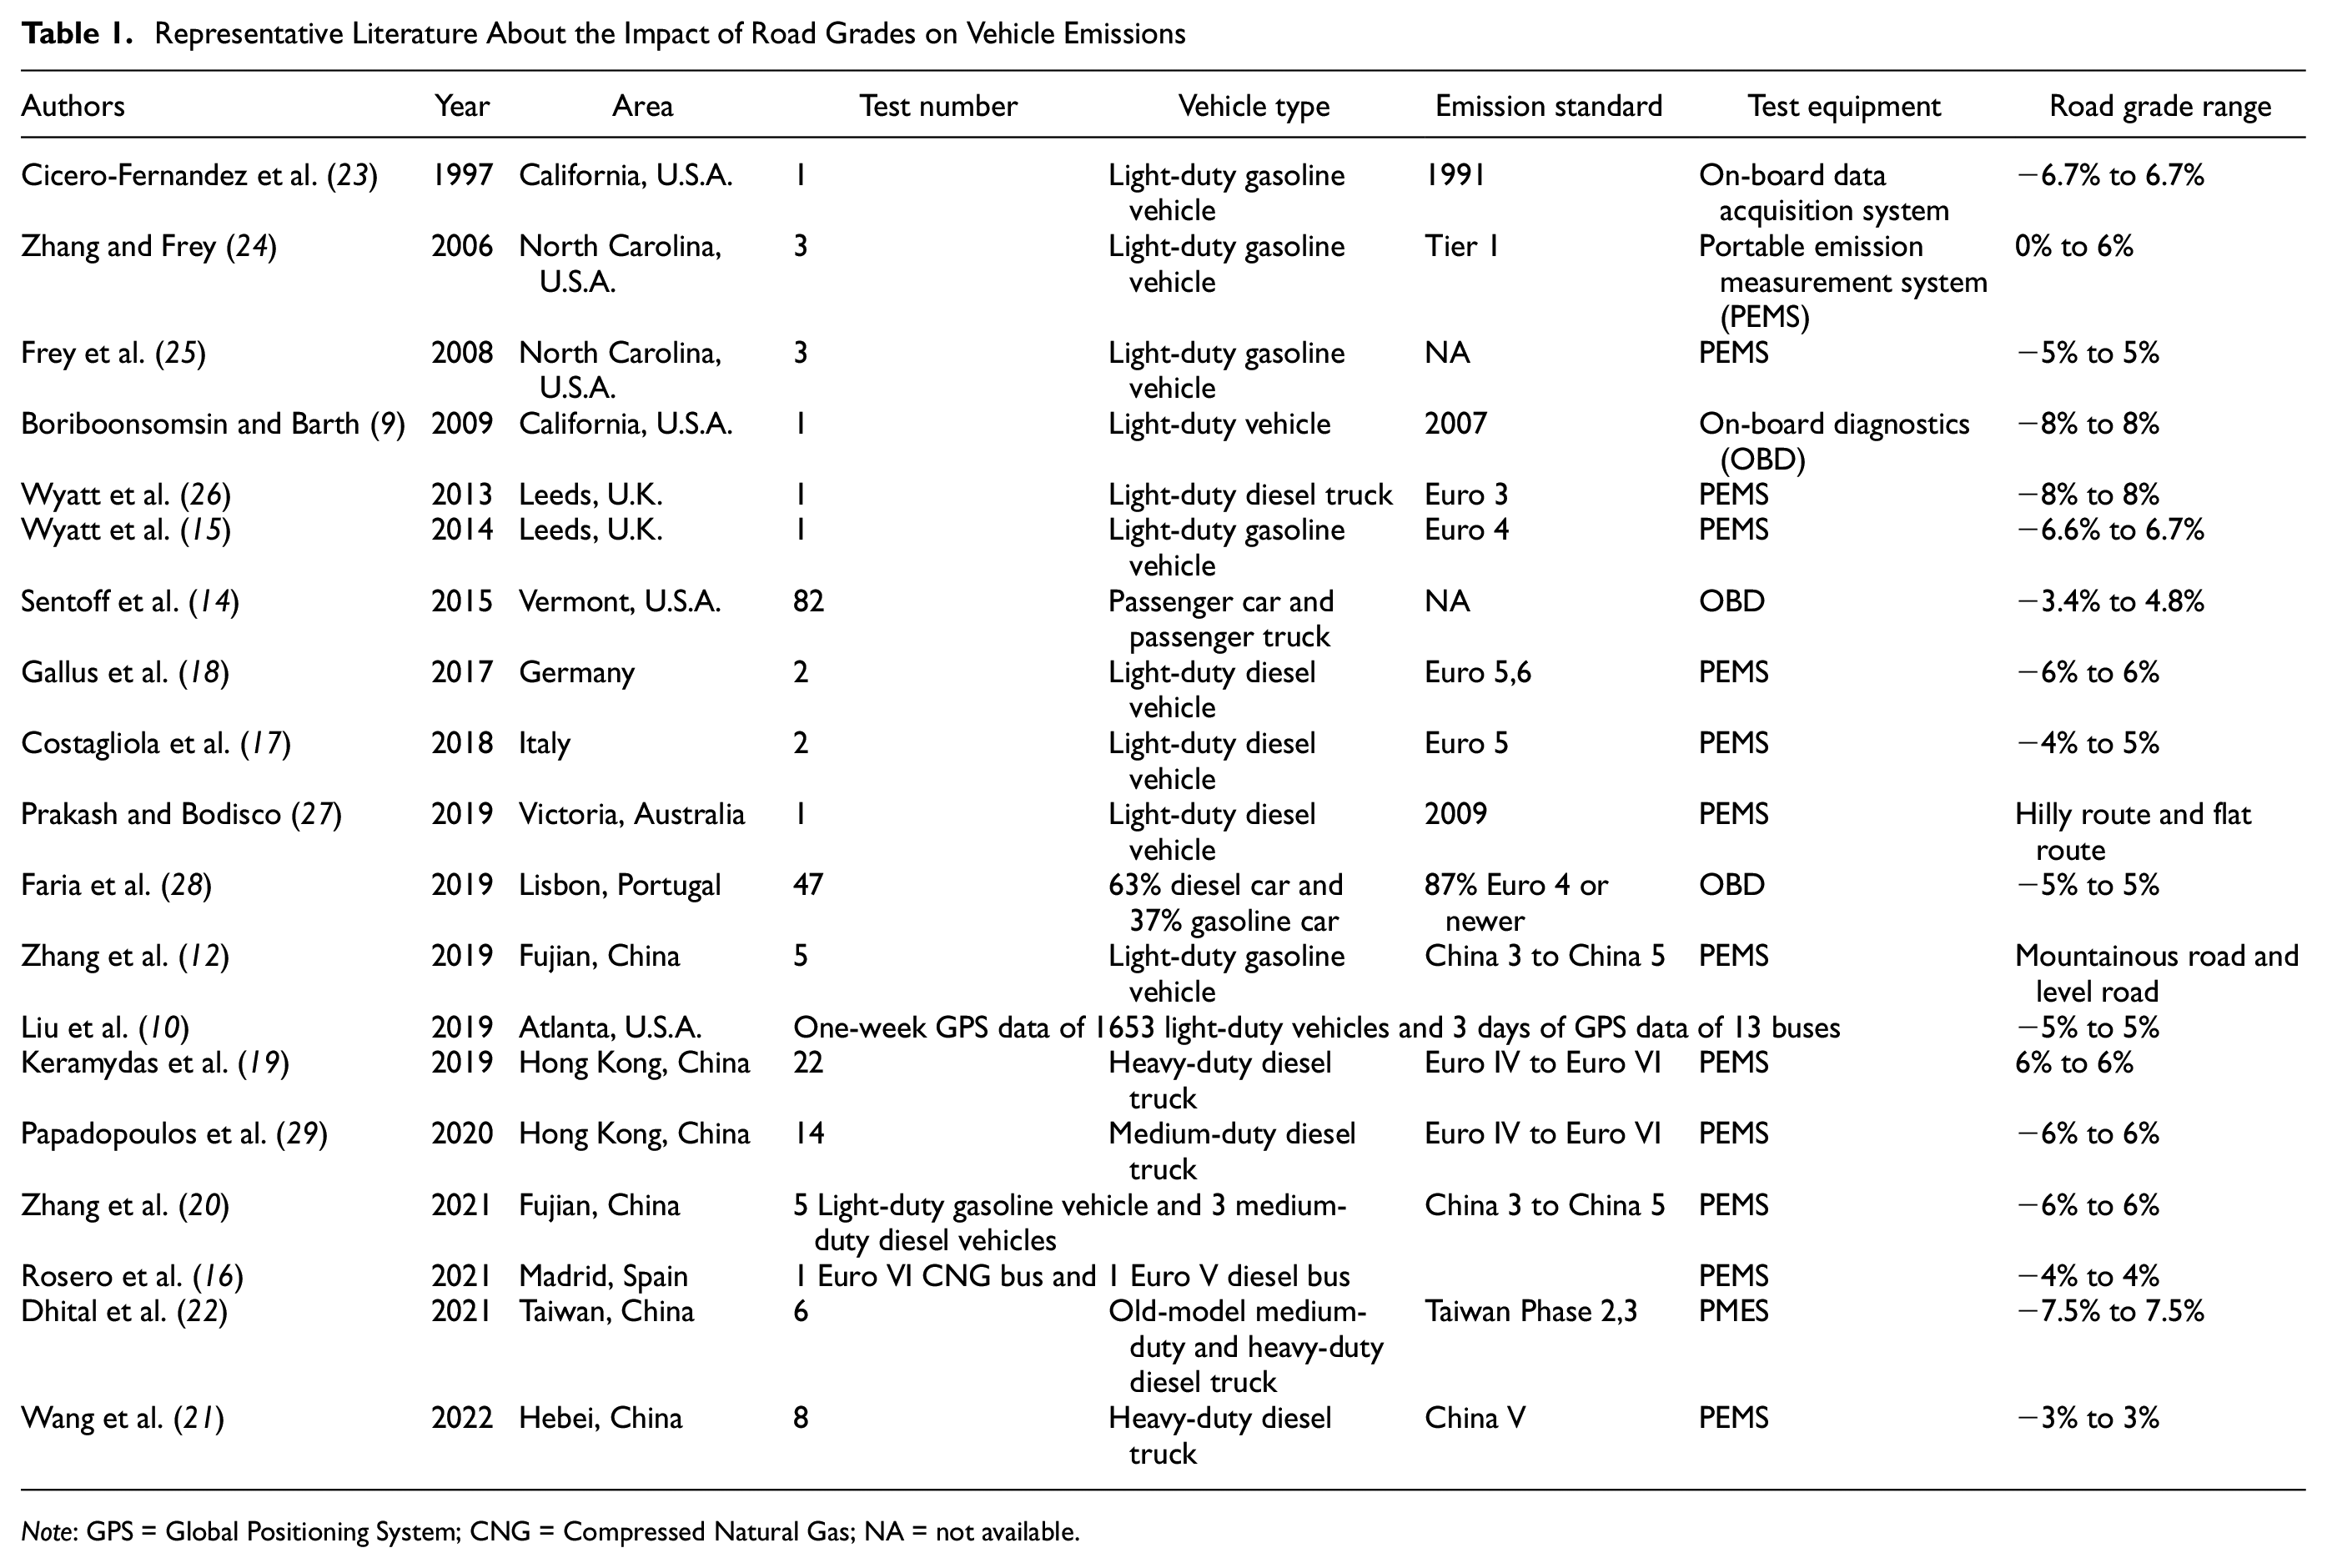
Note: GPS = Global Positioning System; CNG = Compressed Natural Gas; NA = not available.
To fill this gap, an on-road portable emission measurement system (PEMS) test was conducted on 24 HDDTs in Chongqing, a famous mountainous city in China. The purposes of this study were as follows: (a) to reveal the on-road emission levels of HDDTs in a mountainous city using the PEMS; and (b) to quantify the coupling relationship by investigating the relationship between road grades and vehicle operations, and between road grades and vehicle emissions, and then gradually reveal the coupling relationship of these three. The coupling relationship was modeled for the quantification and given emission factor under a continuous road grade range. These findings improve the accuracy and integrity of the emission inventory, and provide a scientific basis for HDDT on-road emission control.
Methods
PEMS Set-Up
Real-time emission data of NO x and CO2 and the vehicle operation data of 24 HDDTs under real-world driving conditions were measured by AVL M.O.V.E., an operation-friendly and high-integrity PEMS. The system comprises a gas PEMS, exhaust flow meter (EFM), Global Positioning System (GPS) receiver, and other accessories, which were firmly mounted on each HDDT container (Figure 1). The real-time emission concentration data (parts per million [ppm]) was measured by the gas PEMS and the exhaust flow rate data (m3/min) was measured by the EFM. These two sets of data were sent to the system control unit to process the concentration data to emission rate data (g/s) from the exhaust pipes. Longitude, latitude, altitude, and vehicle speed data (1 Hz) were recorded by the GPS receiver.
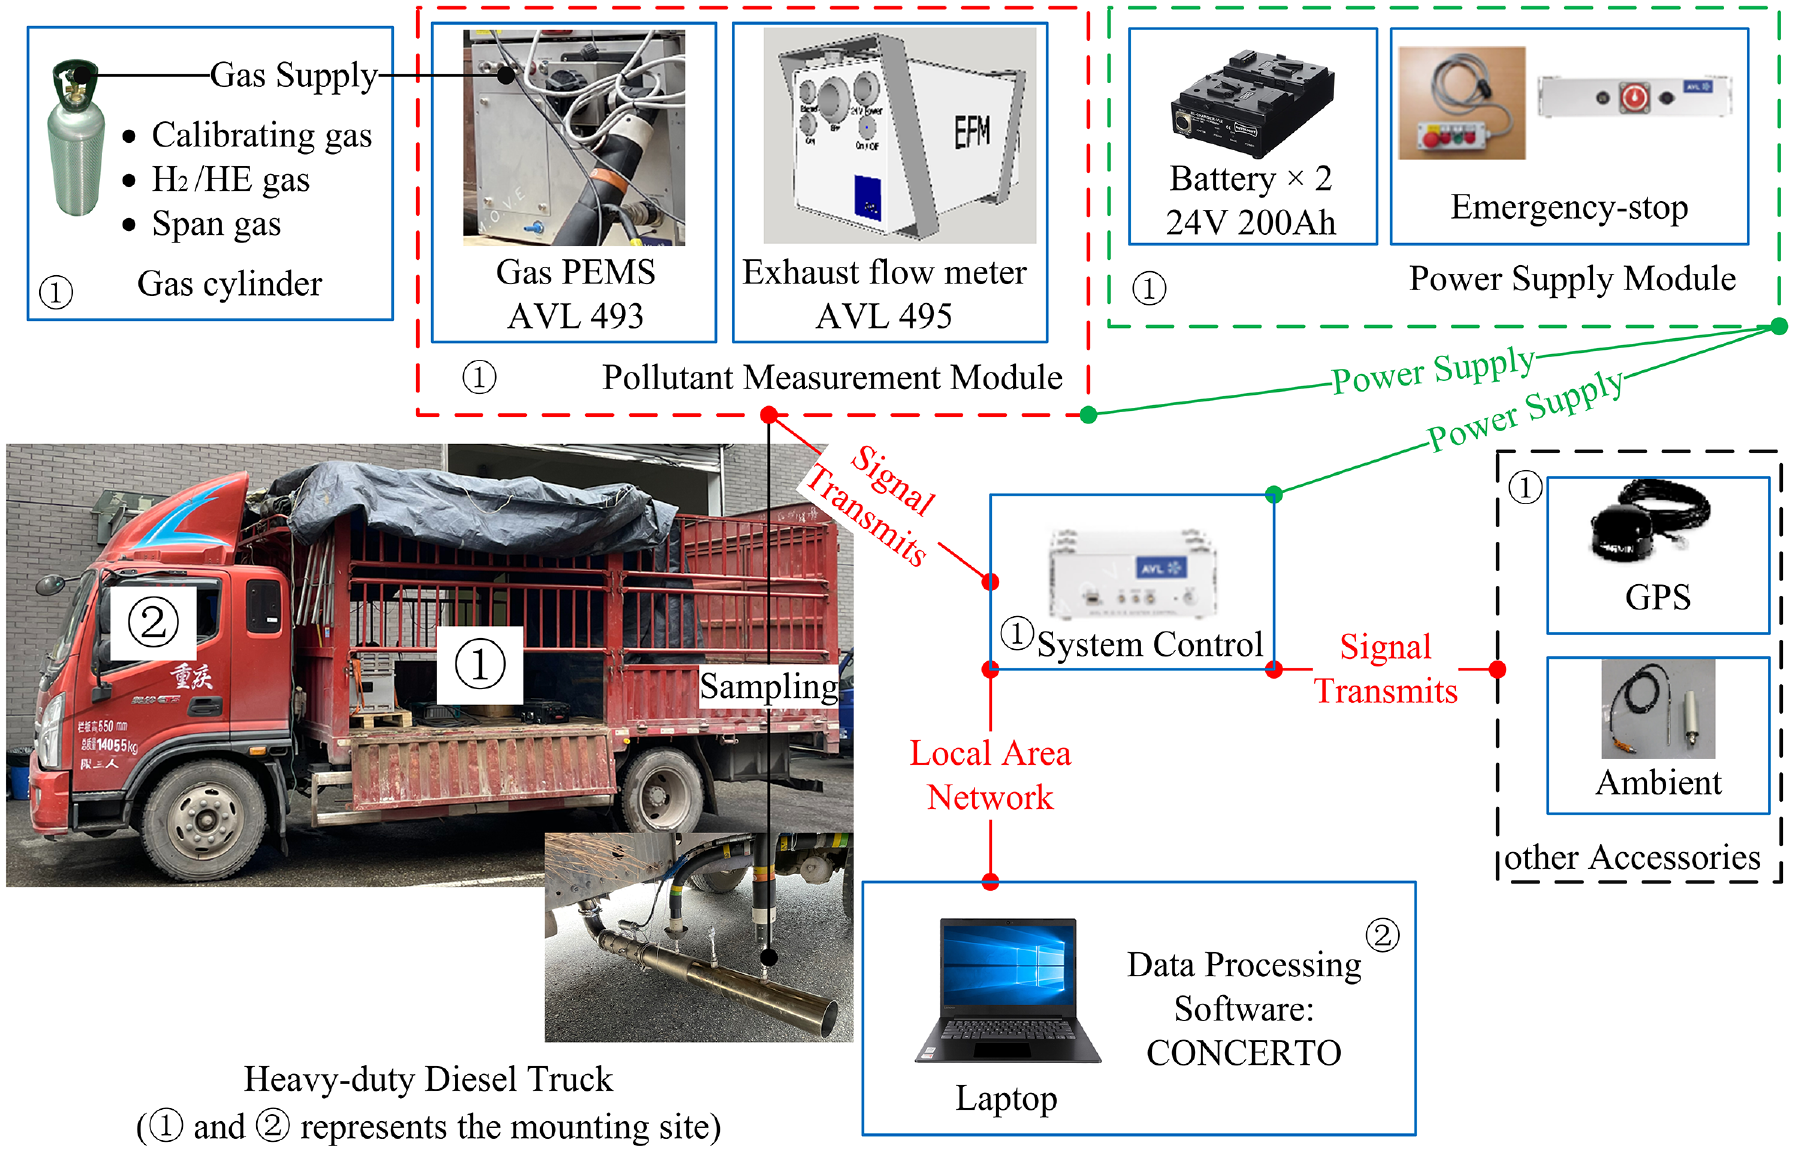
Heavy-duty diesel truck with a portable emission measurement system (PEMS) installed.
Before each test, several processes were required to ensure the accuracy of the test data collected by the gas PEMS, including calibration, leak checking, nitrogen purging, and warm-up. During the test, the test data and device condition were monitored and reported simultaneously on a laptop, which was connected to the system control unit through the local area network. Every truck was loaded with PEMS equipment and only three adults (one driver and two operators). The PEMS tests were carried out on sunny days to avoid instrument damage.
Route and Vehicle Information
Chongqing is located at the confluence of the Yangtze and Jialing rivers in southwest-central China. It was built on a mountain adjacent to the river confluence. Compared to cities in plains localities (i.e., non-mountainous), a wide range of road grades can be collected.
Route-1, a closed-loop route, was designed for the PEMS test, consisting of urban roads, rural roads, and motorways. The total length of Route-1 was 135 km, and the travel time was approximately 3 h. Routes-2–4 were then derived from Route-1 for unpredictable road condition variables in the field test (e.g., temporary road closure, road accidents, and urban restricted areas for HDDTs).
To reflect the real-world HDDT emission levels in Chongqing, the emission standard proportion of the test fleet was set according to the on-road traffic flow data of Chongqing’s road network ( 3 ). The mainstream and representative vehicle types were selected based on vehicle information from the Chongqing in-service vehicle emission database.
Twenty-four local HDDTs were recruited with experienced drivers, of which five were China III, twelve were China IV, and seven were China V. All HDDTs in this study weighed greater than 12 t. The drivers were instructed to follow the tested route and required to follow their daily driving behaviors. The total distance of the test routes ranged from 43 to 135 km, and the road grade ranged from −8% to 8%. Further details are provided in Figure 2 and Table S1. Almost 211,000 second-by-second emission and operation records were collected by the PEMS in this study (the data sample is shown in Table S2).
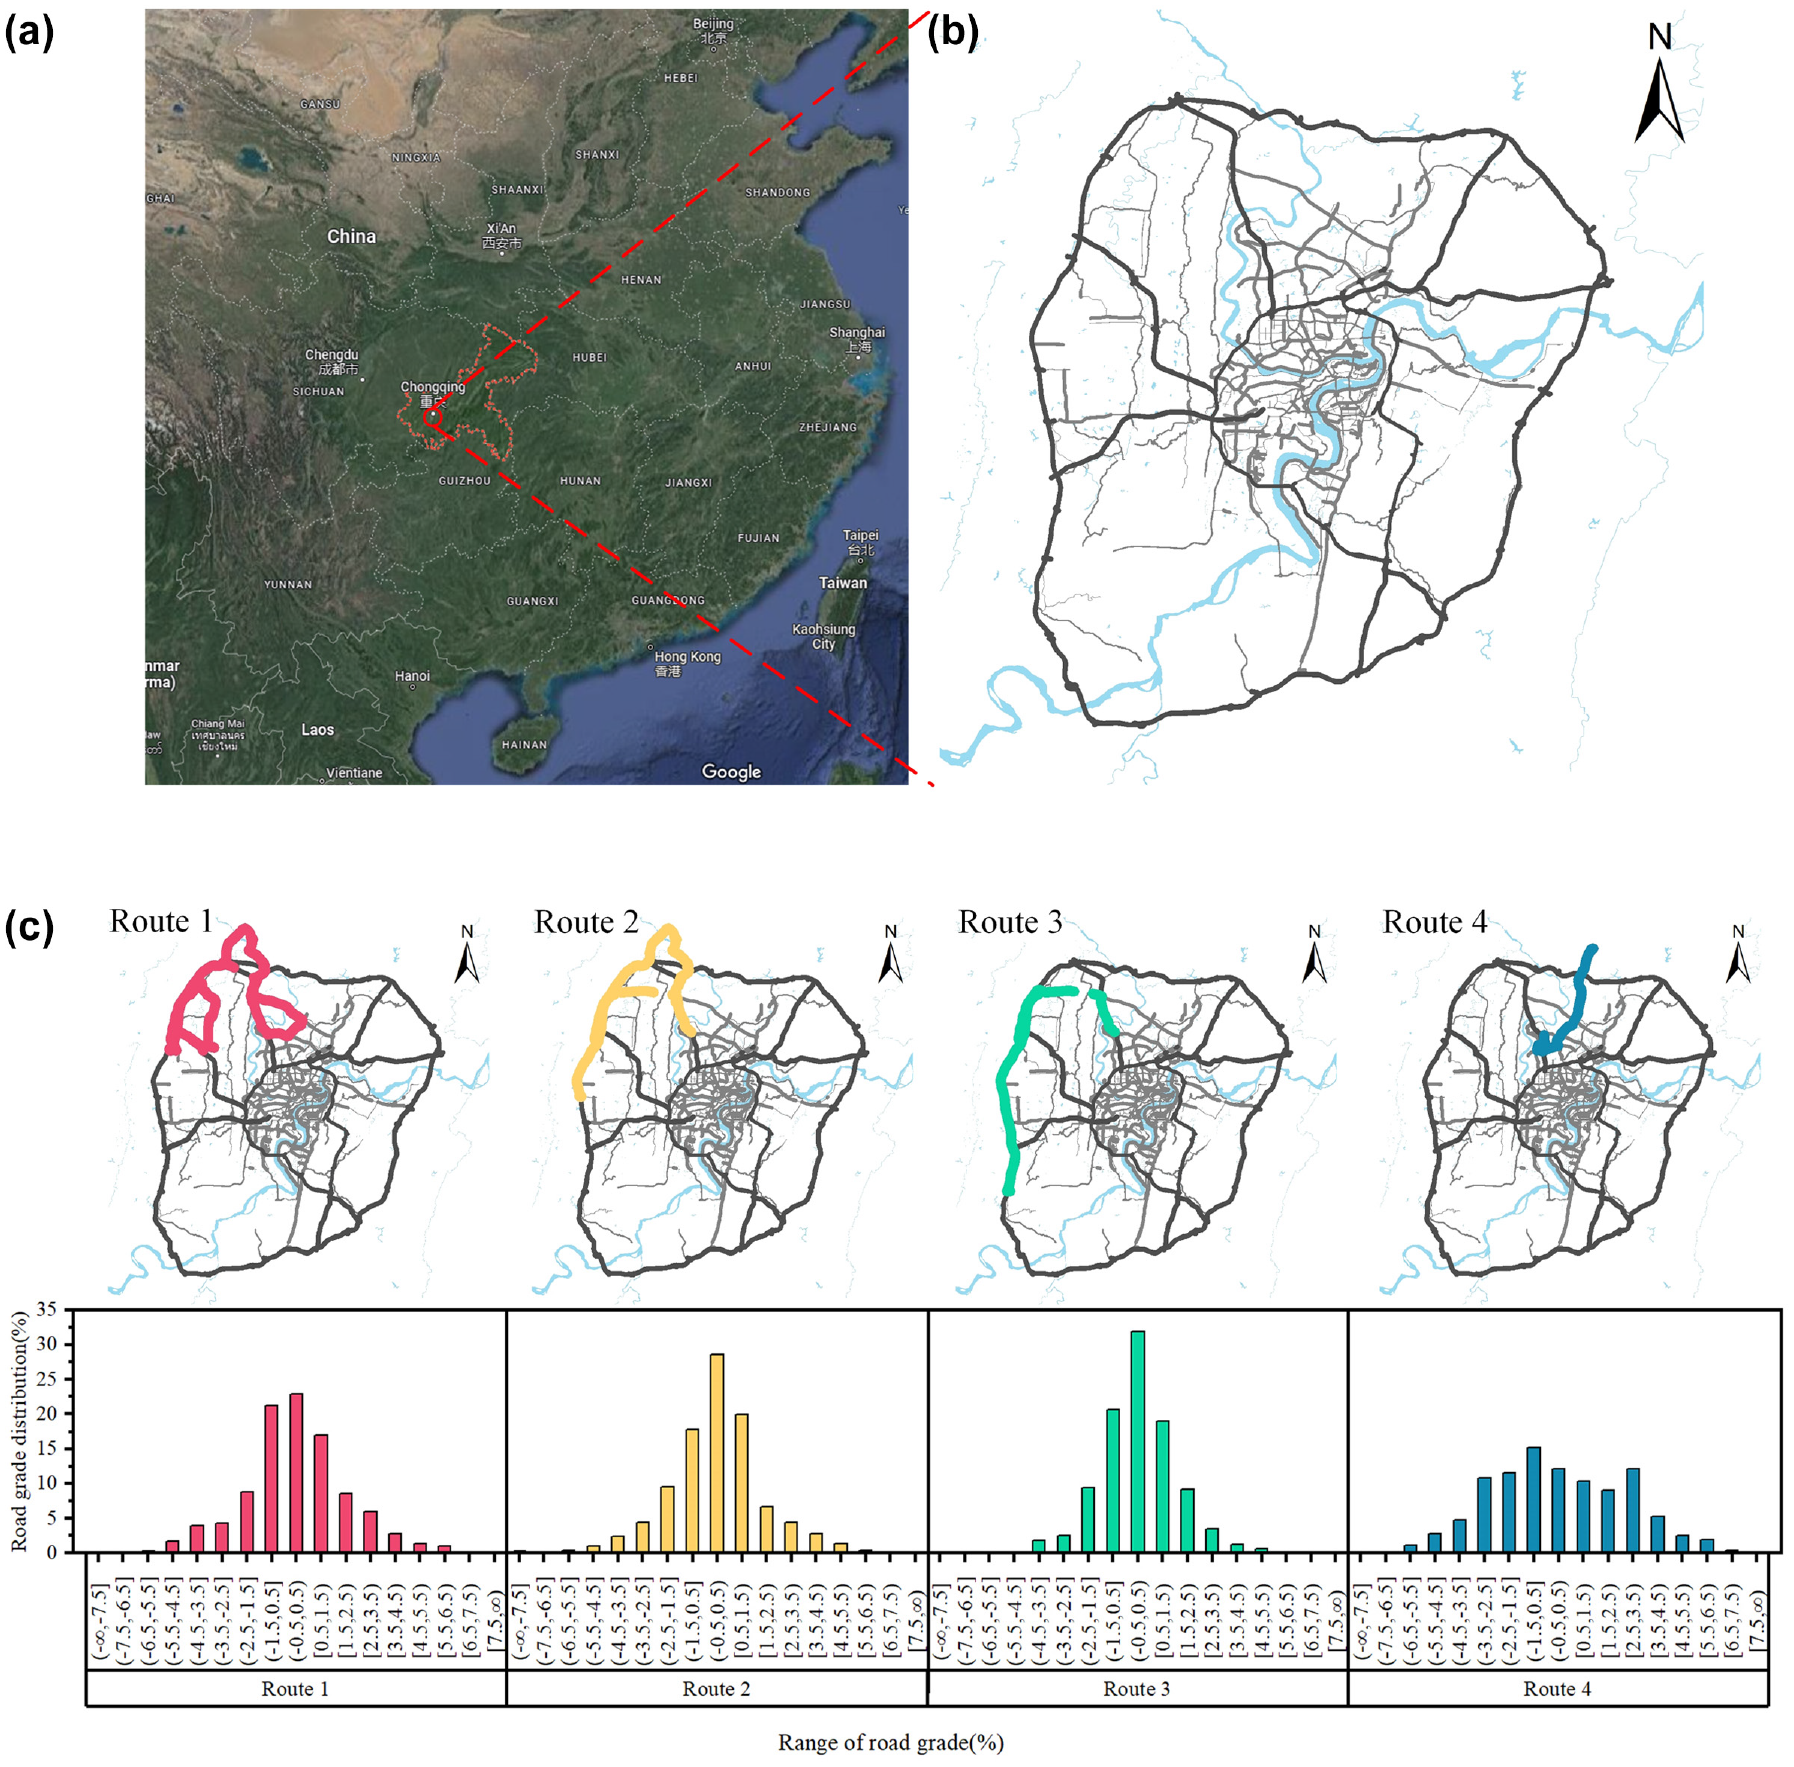
Topographic locations and distributions of road grades on the test routes: (a) location of Chongqing in China, (b) portable emission measurement system conducted area in Chongqing, and (c) location of test routes and their road grade distribution.
Road Grade Calculation
The GPS data were used to calculate the road grades of the test routes. Each test route contained at least one PEMS test, and it was appropriate to apply the “combined runs” segmentation method proposed by Boroujeni and Frey ( 11 ) for the road grade calculation. If the tested vehicles were idling or in a tunnel, the respective GPS data were removed from the road grade calculation owing to data drift and signal loss. The segment length (Δd) was set to 100 m to achieve the best trade-off between the number of GPS points per segment and precision ( 18 ). That is, the road grade spatial resolution of the test routes was 100 m.
Emission Data Processing
Emission Factor Unit
Two types of emission factors were used to illustrate the emission level of the HDDT: the distance-based emission factor (g/km) and CO2-based emission factor (g/kg CO2).
The distance-based emission factor is commonly used for the present vehicle emission level; therefore, it can be reflected in the results of this study and compared with other research. It is defined as the total emissions (g) divided by the test route length (km), indicating the vehicle emission level per unit distance. The total emissions per truck can be acquired by accumulating real-time emission data during the entire test procedure.
A comparison of the on-road vehicle emission levels and emission certification limits is also noteworthy. The unit of HDDT emission certification limit in China is the work-based emission factor (g/kWh) ( 30 , 31 ). However, some elder vehicles failed to connect the on-board diagnostics (OBD), which provided the engine power data. This set a barrier for calculating the work-based emission factor of all tested vehicles. To solve this problem, the emission certification limit was transferred to a CO2-based emission factor (Table S3). This factor conversion method was proposed by the International Council on Clean Transportation (ICCT) ( 32 ). The CO2-based emission factor is the ratio of a specific pollutant’s total emissions (g) to its CO2 total emission (kg). This can indirectly reflect the vehicle emission level per unit of fuel consumption, because CO2 is highly correlated with fuel consumption.
Relative Emission Rate
Vehicle idling emissions were set as the baseline emissions. When the vehicle is in an idle state, its emissions are not affected by the vehicle’s operation or road grade. The relative emission rate (RER) is the ratio of each emission to baseline emissions, which converts on-road emissions into multiples of idle emissions. The idling state was defined as the state in which the vehicle speed was lower than 1 mi/h (≈0.44704 m/s) ( 33 ) and the vehicle acceleration was [−0.1, 0.1] m/s2. The calculation of the RER is given by Equation 1:

where
Emission Relative Deviation
Equation 2 was used to quantify the relative deviation between the emissions of a vehicle driving on a graded road and that on a flat road (road grade = 0%):

where
Results
Test Data Verification
This section presents the on-road emission levels of the tested HDDTs by using two indicators, shows the individual differences in vehicle emissions, and compares them with the relevant literature to assess whether they were within a reasonable range.
Distance-Based Emission Factor
Each on-road distance-based emission factor for every emission standard in this study was similar to those in other literature ( 34 – 37 ) at the magnitude level (the comparison results are given in Table S4). This suggested that the tested results are reasonable and can be used to analyze the coupling relationship. In addition, the PEMS test also collected emission data for carbon monoxide (CO) and total hydrocarbons (THC); therefore, four gas pollutants are given in this section.
The on-road NO x and CO2 emission factors ranged from 1.67 to 13.11 and 307 to 629 g/km, respectively. The results showed that individual differences in on-road vehicle emissions were significant because of the complex changes in road conditions and driving operations (Figure 3). Although the emission standard was stricter than that of China III vehicles, the average emission factors of NO x and CO2 of China IV HDDTs were the highest among all tested HDDTs under real-world driving conditions. Despite selective catalytic reduction (SCR) being widely used in China IV and China V HDDTs to control NO x emissions, the results implied that SCR might lose efficacy under real-world conditions. The emission factors for CO and THC were lower when the emission standards became stricter (Figure S1).
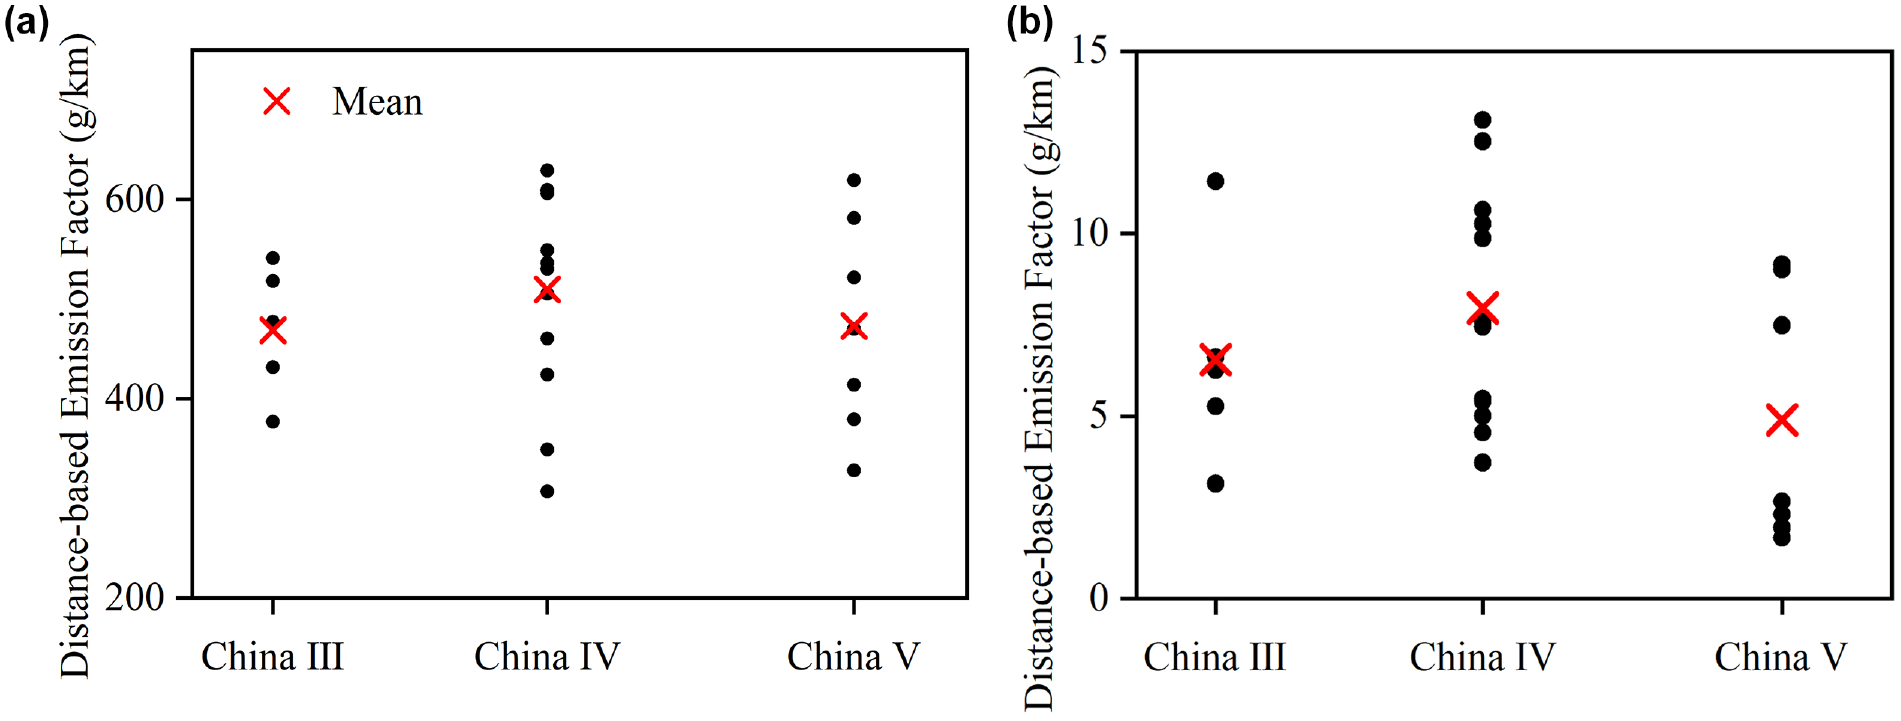
(a) CO2 and (b) NO x distance-based emission factors (g/km) of all tested heavy-duty diesel trucks.
CO2-Based Emission Factor
The CO2-based emission factor of NO x ranged from 4.71 to 21.62 g/kg CO2, which was similar to those of ICCT ( 32 ) (Table S5). This also suggested that the on-road emission data in this study are representative and reliable (the results for CO is given in Figure S2).
Figure 4 shows the measured CO2-based emission factors for NO x and the estimated limit values. The results showed that the on-road vehicular NO x emission often exceeds its corresponding standard limit value, with the average on-road NO x emission factors being 1.41 (China III), 3.09 (China IV), 3.15 (China V), and 1.57 (China V-PEMS) times the certification limit. ICCT also indicated that many HDDTs exceeded the legal limit in the PEMS test. These results suggested that the emission limits that were measured based on the standard driving cycle in the laboratory do not reflect real-world HDDT emission levels. Therefore, the problem of high NO x and CO2 emissions should raise wider concerns compared to other pollutants stemming from HDDTs.
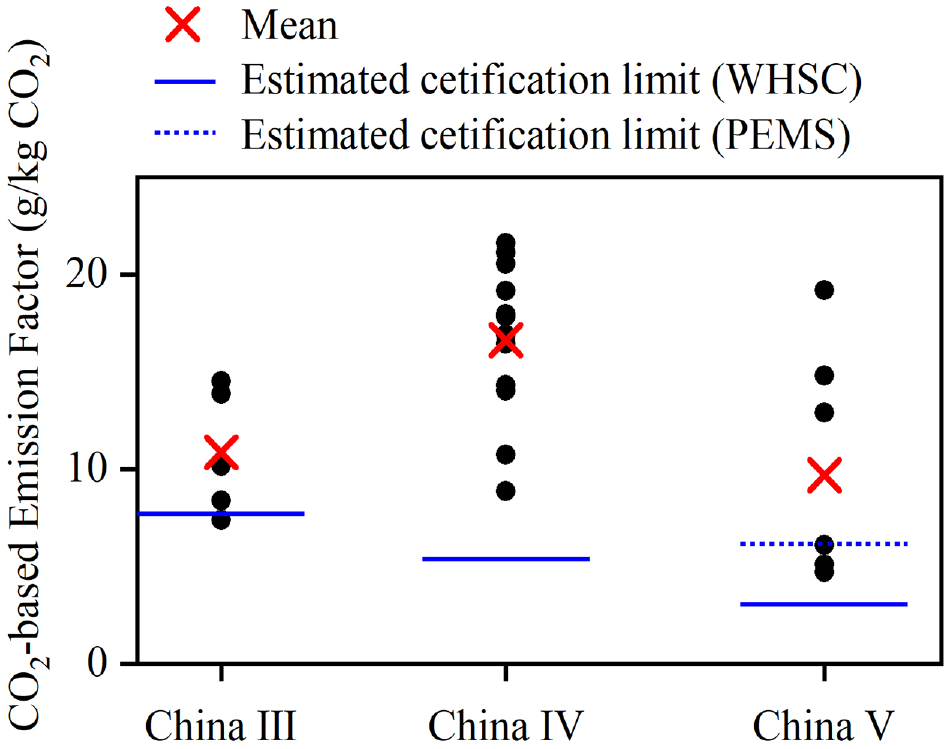
Comparison of the measured CO2-based emission factors and estimated CO2-based certification emission limit of NO x .
Impact of Road Grade on Vehicle Operation
Speed and acceleration were chosen as indicators to reveal how the road grade affected the vehicle operation. Second-by-second operation data collected by the PEMS were classified according to the road grade at an interval of 1%.
Firstly, the road grade had a noticeable negative impact on the average speed of the tested vehicles (Figure 5a). The average speed of HDDTs was 50.39 km/h while driving on a flat road (the road grade is 0%). The average speed decreased by 4%–44% on graded roads regardless of whether they were uphill roads or downhill roads. According to the relative change in the average speed, road grades can be classified into five types: steep downhill (≤−5%), moderate downhill (−5% < road grade < −2%), level road (−2% ≤ road grade ≤ 2%), moderate uphill (2% < road grade < 5%), and steep uphill (≥5%). The results showed that when HDDT drivers drove on a moderate uphill/downhill road, most of them tended to keep the vehicle speed close to that on a level road. However, for steep uphill/downhill roads, the average speed decreased by over 20%. This phenomenon implies that HDDT drivers lower their driving speeds and adopt a conservative strategy to maintain driving safety on steep roads. In addition, engine power may be insufficient for driving on steep uphill roads. Note that evidence of graded roads having a noticeable impact on speed can also be found in light/medium passenger vehicles and buses ( 10 , 20 ).
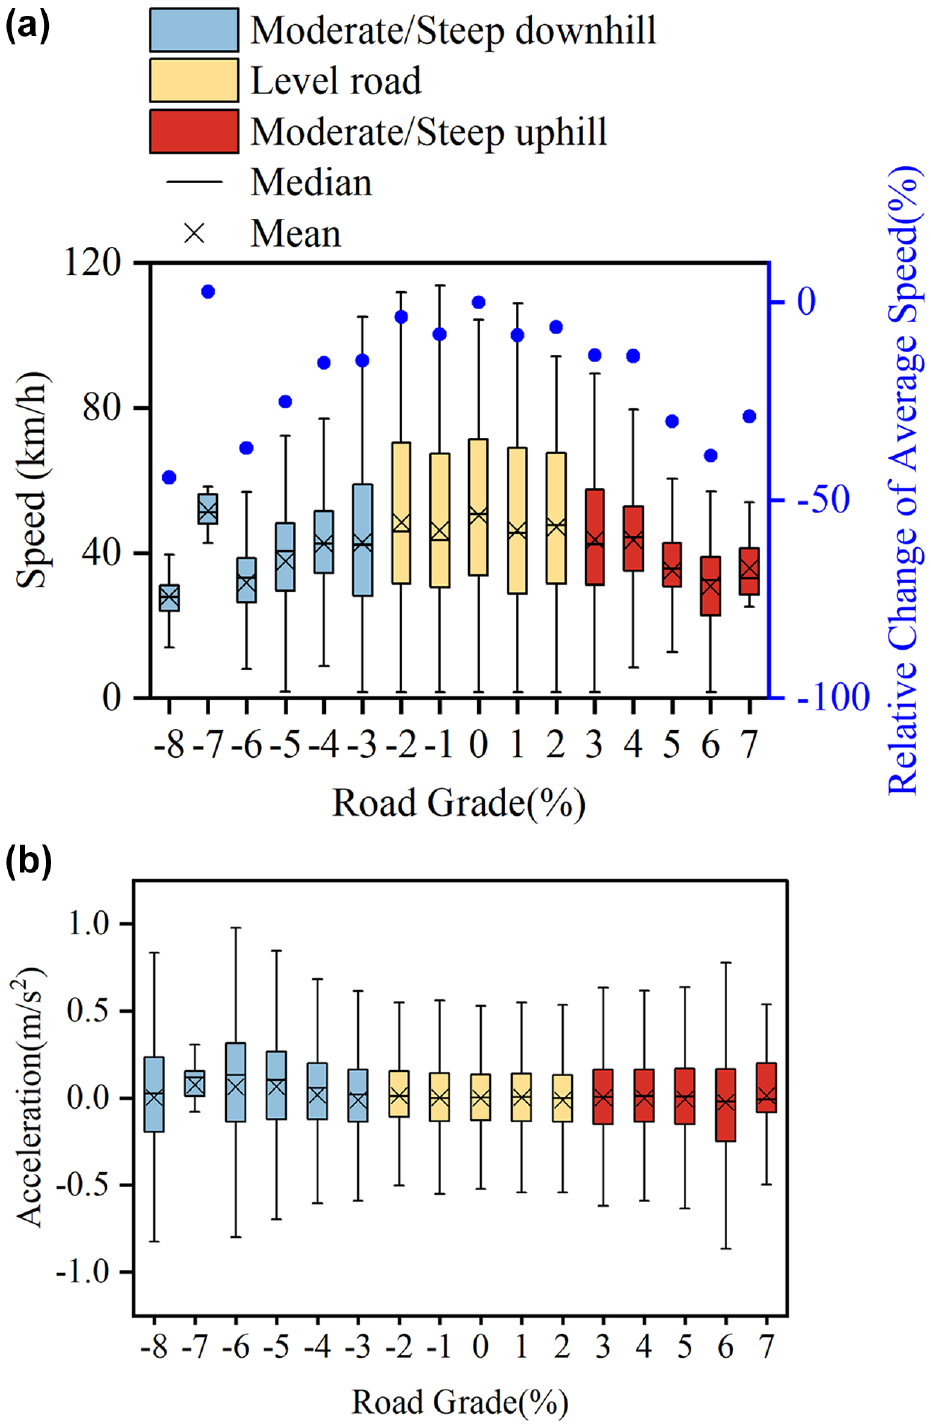
Impact of road grade on the (a) speed and (b) acceleration distribution of heavy-duty diesel trucks.
Secondly, vehicle acceleration was affected by the road grade when driving on steep and moderate downhill roads (Figure 5b). The box plot of vehicle acceleration under each road grade bin showed little difference on a level road and an uphill road. The average acceleration on level roads and uphill roads was 0.00 m/s2, but it slightly increased (0.07 m/s2) on steep downhill roads. Three types of events were defined as follows for further studying the impact of the road grade on acceleration: the cruise state represents that the vehicle acceleration is within [ − 0.1, 0.1] m/s2, accelerate state >0.1 m/s2, and decelerate state <−0.1 m/s2. From the aspect of the distribution of operation events under each road grade, the results show that the distribution of acceleration, deceleration, and cruise events was equal on the level road and uphill road, and was relatively stable with road grade changes (Figure S3). However, for driving on downhill roads, the acceleration events showed an increasing trend as the road grades became steeper. This explains why the average acceleration on the downhill road has an inconsistent performance with that on level roads and uphill roads. In addition, when driving on a steep downhill road, a higher proportion of acceleration events was reasonable owing to the large inertia of the HDDT.
This section clarified how vehicle speed changes dynamically with the road grade, and the characteristics of how the road grade affected vehicle acceleration. To the best of our knowledge, vehicle speed and acceleration are important variables for vehicle emissions. Zhang et al. ( 20 ) observed that lower speed and conservative driving behavior occurred while driving on a steep uphill road, resulting in the emission factor of NO x declining slightly (research on light-duty gasoline vehicles and medium-duty diesel trucks). To further study the relationship between the road grade and emissions, decomposing the emission changes driven by vehicle speed and acceleration is crucial.
Instantaneous Emission Rates Affected by Road Grade
To explore the vehicle emission characteristics affected by road grade, boxplots intuitively show the distribution of emission data for each road grade, operating state, and vehicle emission standard (Figure 6).
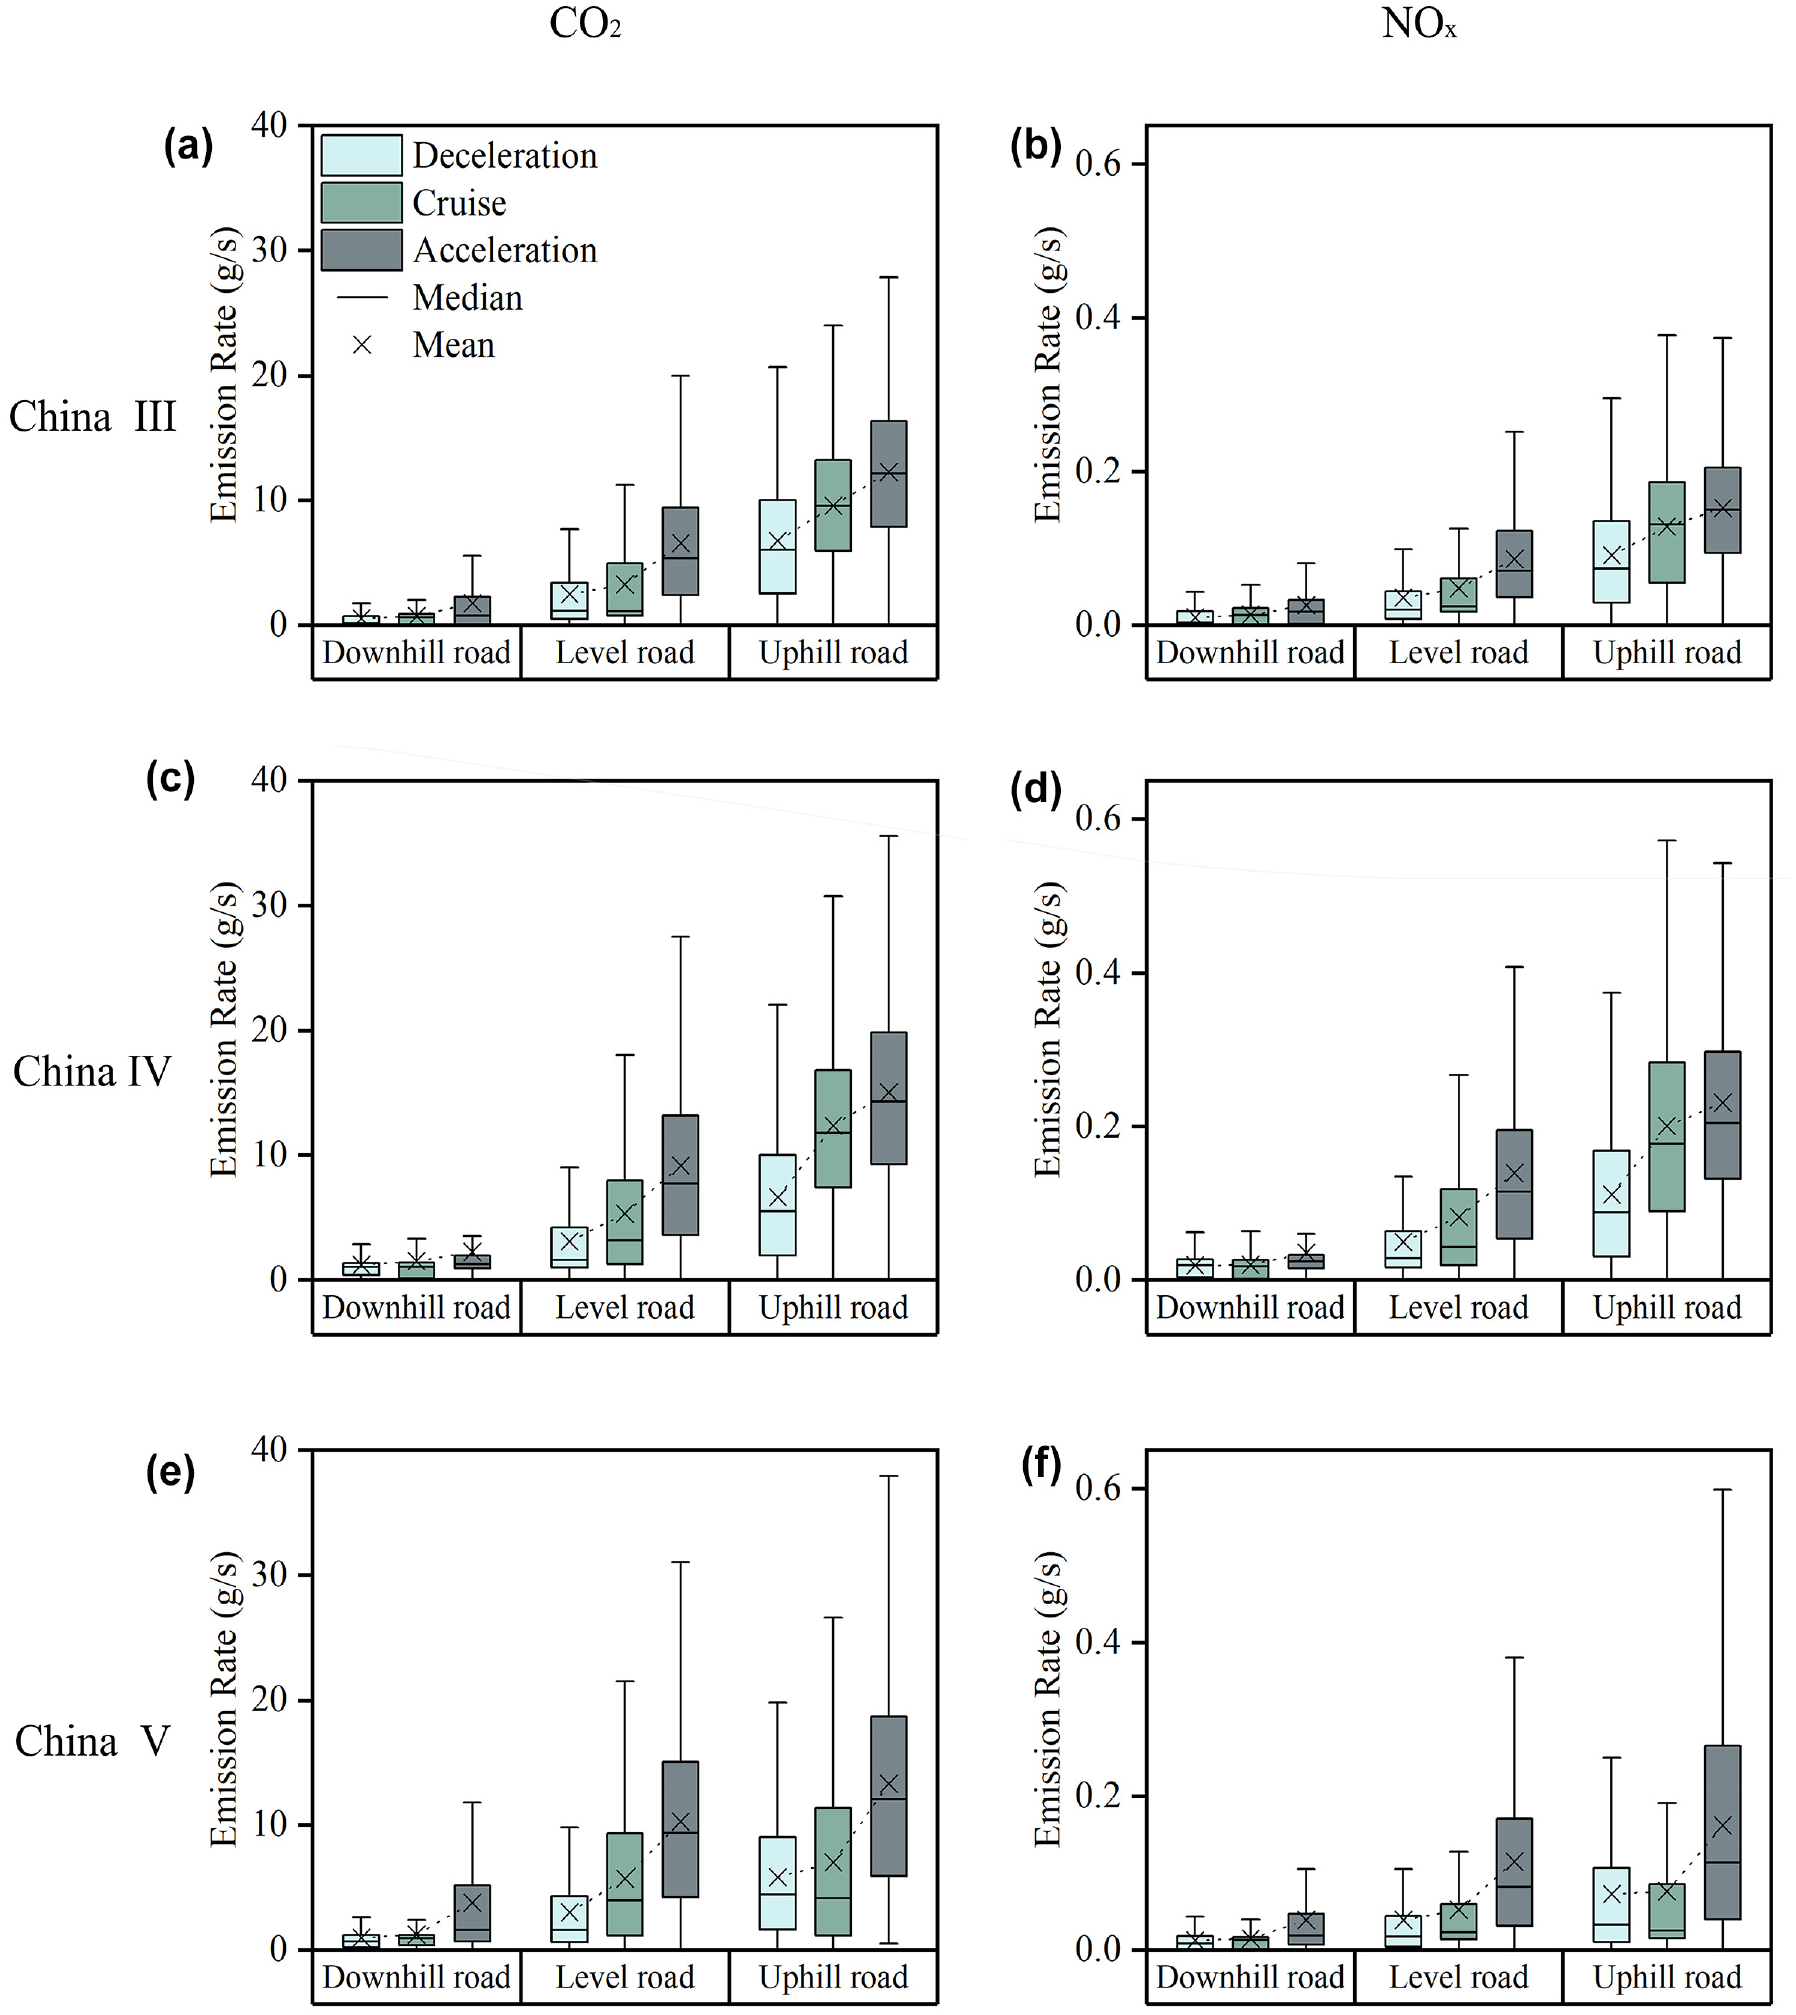
CO2 and NO x emission rates of heavy-duty diesel trucks in different emission standards, operation events, and road grades.
Note that for all pollutants and vehicle emission standards, HDDT emissions changed significantly with the road grade. The emissions on uphill roads were always the highest, followed by those on level roads and downhill roads. The vehicle acceleration process requires more engine power and fuel on uphill and level roads, which increases emissions. The dotted line connects the average emissions under each operation event bin, which moved vertically on the level road and uphill road. It suggested that the impact of acceleration on emissions showed a consistent pattern on the level road and uphill road. For example (Figure 6c), the average emissions on the level road were 3.11, 5.31, and 9.16 g/s (deceleration, cruise, and acceleration, respectively), compared with 6.63, 12.37, and 15.04 g/s on the uphill road. These lines were also consistent in different emission standards, which indicated that the influence of road grades on emissions could be similar among the three emission standard HDDTs. Keramydas et al. (19) also reported that the impact of the road grade on NOx emissions was consistent among different emission categories of HDDTs.
Interestingly, for every category, the emission distribution ranged narrowly on the downhill section regardless of the operating state. The average emission rates on downhill roads were lower than those on other road grade bins. It can be speculated that HDDTs can slide downhill by gravity, and the driver could temporarily close or reduce the output of the engine, saving fuel consumption and thereby reducing HDDT emissions. Furthermore, the emission increment of a vehicle from the cruise state to the acceleration state was the smallest on the downhill sections. As shown in Figure 6c, these emission increments were 0.75 g/s (downhill road), 3.84 g/s (level road), and 2.67 g/s (uphill road). These results help to one conclude that vehicle emissions on the downhill road will not deteriorate significantly owing to the increased proportion of accelerated events. A large proportion of the acceleration of the vehicle was provided by gravity, not by the engine. As vehicle emissions are generated by the engine, it implied that vehicle emissions were weakly related to acceleration while driving downhill. Thus, the road grade, vehicle acceleration, and emission cannot form a coupling relationship.
In summary, the effect of acceleration on vehicle emissions could be considered independently rather than in the coupling relationship. The relationship between the road grade and emissions should be discussed for each operating state to eliminate the impact of acceleration on the outcomes.
Coupling Relationship of Road Grade, Speed, and Emission
Based on the discussion above, the vehicle emission data for the cruise state were chosen as representatives to study the coupling relationship of the road grade, speed, and emission. The emission data for the cruise state accounted for the largest proportion of the three states and covered a wide range of road grade bins in this study. Moreover, because of the lack of large-scale instantaneous vehicle speed data, the acceleration of urban on-road vehicles was often set to zero in emission calculation. The cruise state results were consistent with the basic assumption that acceleration was zero in urban emission inventories.
To distinguish the emission variations caused by the change in road grade and the impact of the road grade on speed, the RER data were classified by road grade and speed (Figure S4). The results indicated that the emissions were consistent with the increase in vehicle speed in each road grade bin. In the combination range of high-speed and steep road grade bins, the average RER curve was affected by extreme data because of the small sample size. Owing to the number of data points, the minimum intervals of the road grade bin and speed bin were set as 1% and 10 km/h, respectively, except for (70,100] km/h (highest speed bin).
Figure 7 shows the characteristics of the coupling relationship between the road grade, speed, and the RER of CO2. Note that NO x has a similar pattern as CO2, and the results are given in Figure S5. Firstly, it should be noted that the road grade ranges differed for each speed bin, and the maximum road grade decreased as the speed range increased. For example, the maximum road grade was 4% when the speed reached 60 km/h (Figure 7g). These patterns were attributed to steep roads that could slow down drivers’ driving speed and to the limitation of rated engine power. Passing the steep uphill at a relatively high speed was rare in real-world driving scenarios.
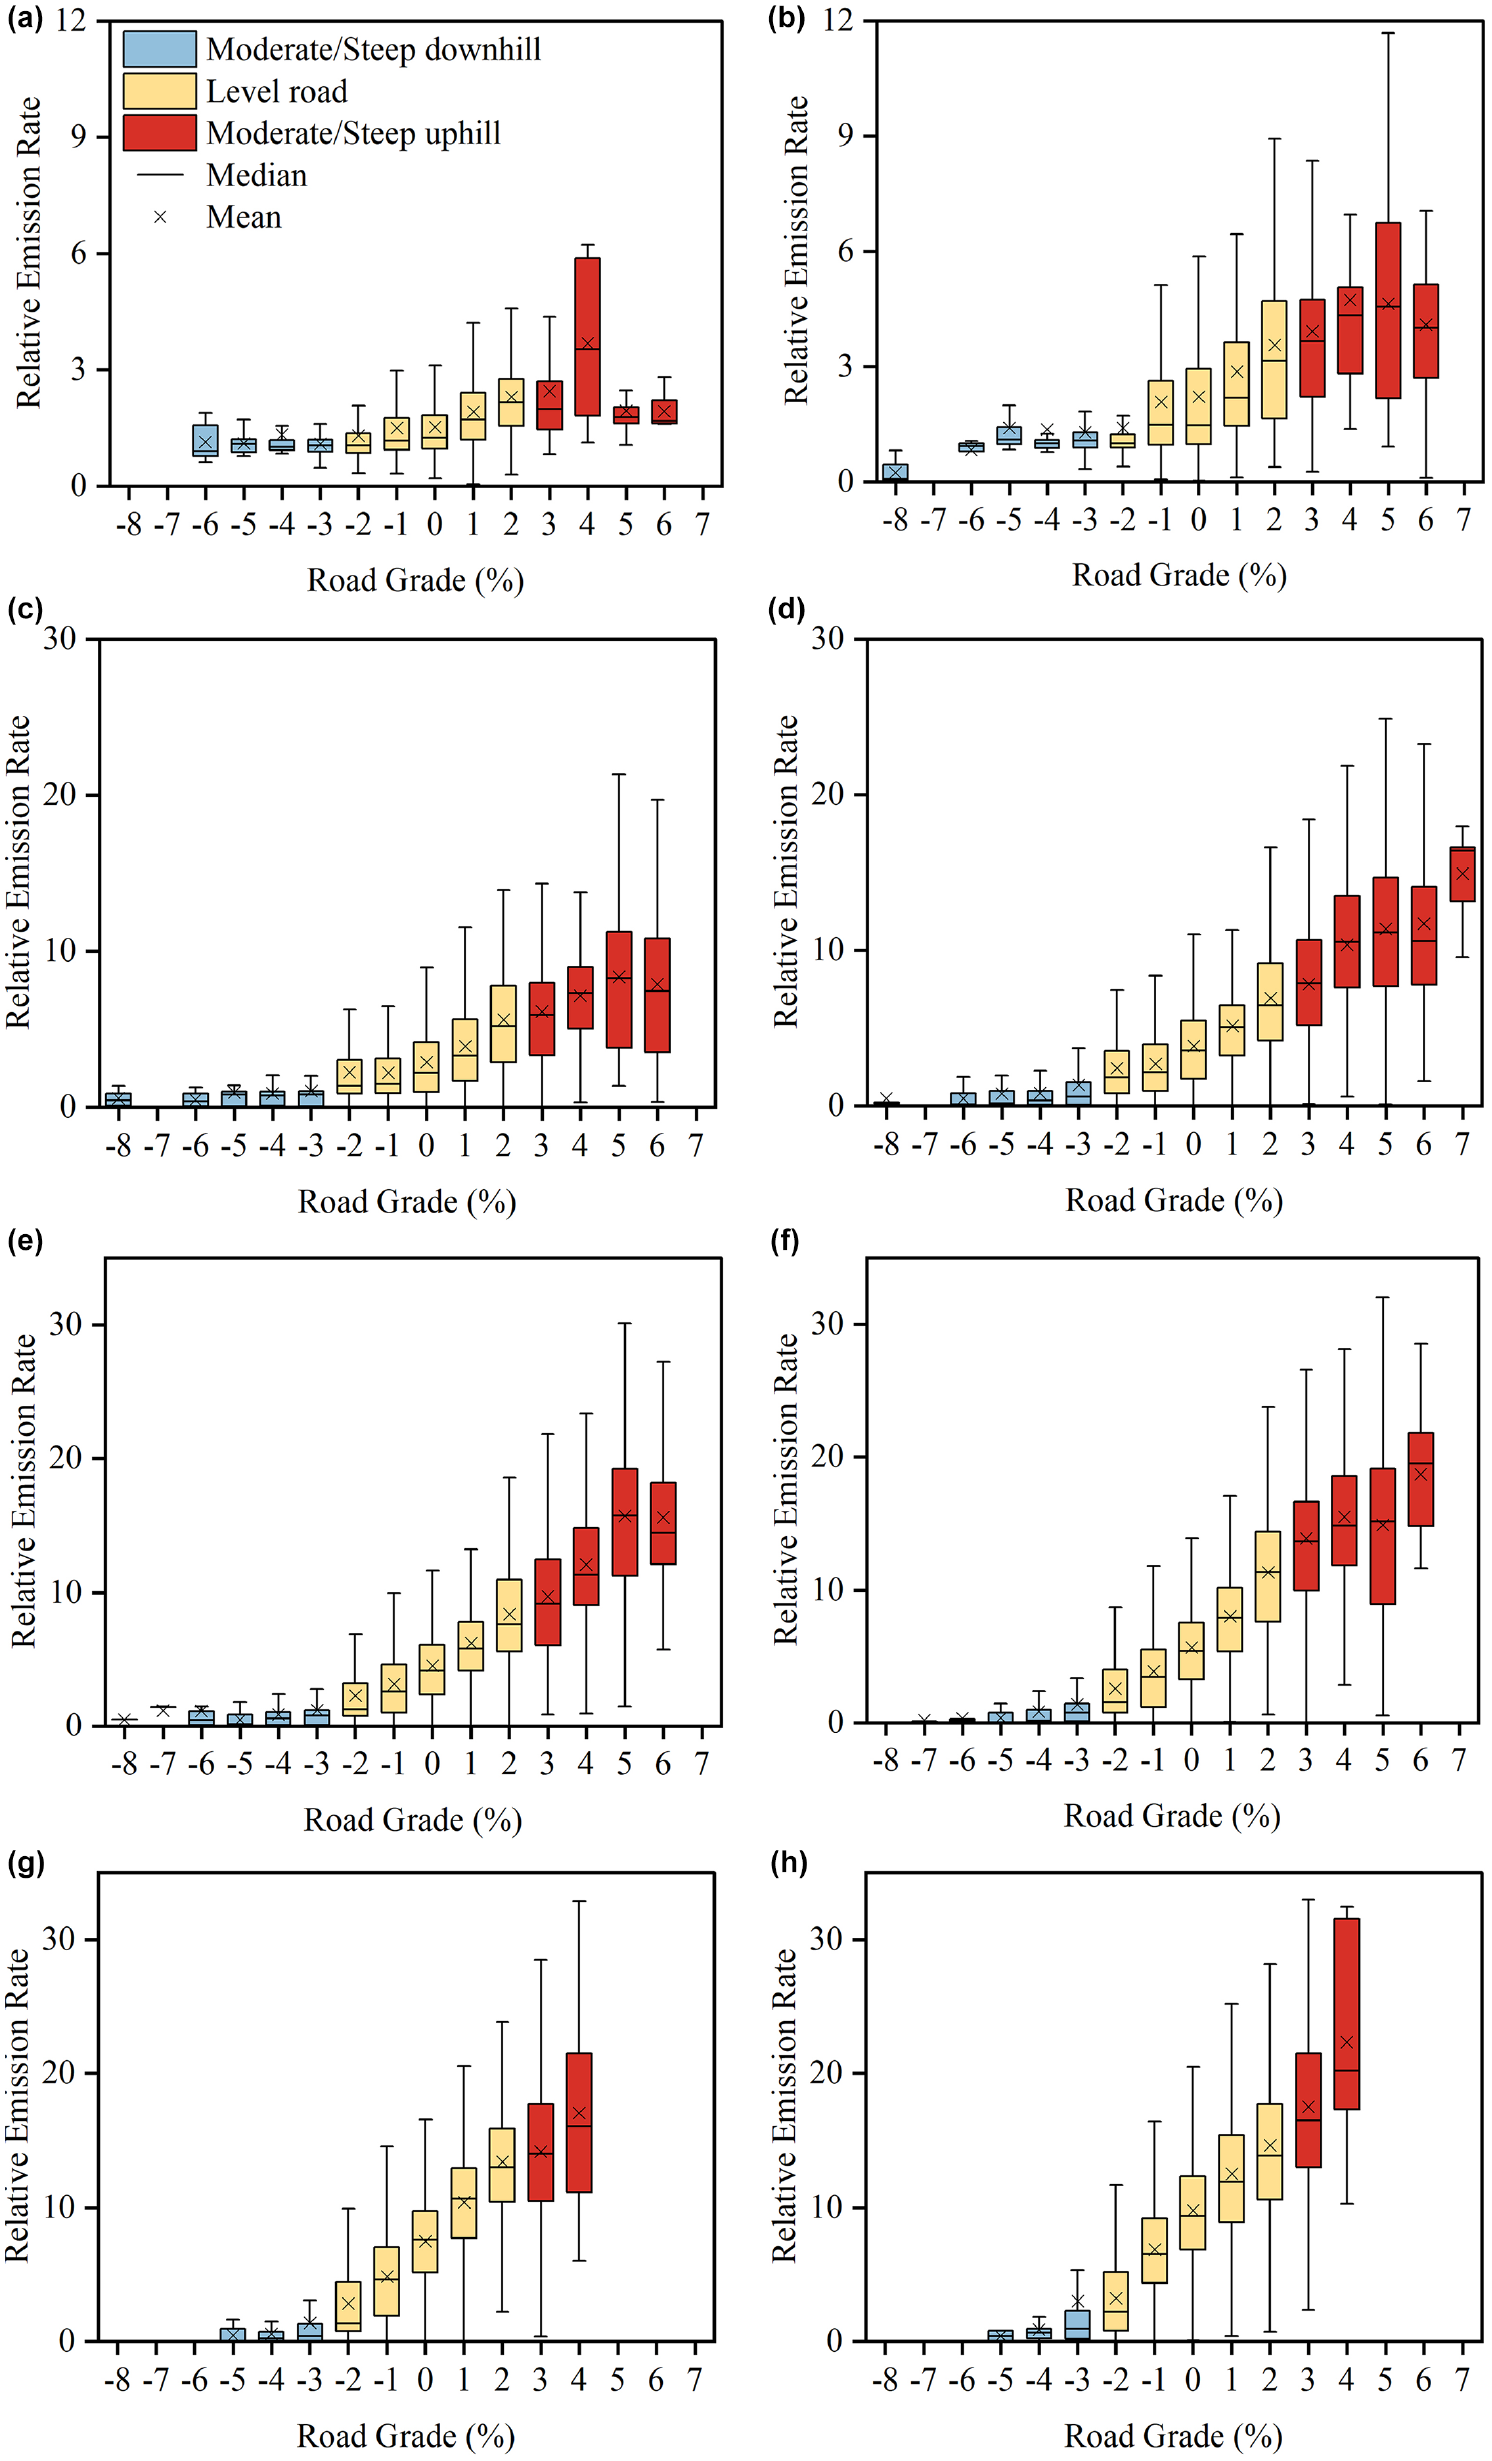
Relationship between the road grade and the CO2 relative emission rate of heavy-duty diesel trucks at each speed bin (km/h): (a) speed (km/h) ∈ (0.5,10], (b) speed (km/h) ∈ (10,20], (c) speed (km/h) ∈ (20,30], (d) speed (km/h) ∈ (30,40], (e) speed (km/h) ∈ (40,50], (f) speed (km/h) ∈ (50,60], (g) speed (km/h) ∈ (60,70], and (h) speed (km/h) ∈ (70,100].
Secondly, the emissions differed significantly before and after the −3% road grade. For the road grade ≤−3% section (a moderate and steep downhill road), the RER was very close in each speed bin or road grade bin. Note that the RER represents the ratio of emissions to idle emissions. Interestingly, the average RER under such category fluctuated around 1, indicating that vehicle emissions were quite close to idle emissions. It can be intuitively inferred that the engine was shut down (idle) on such a downhill road, and the vehicle was powered by gravity. Therefore, the emissions while driving downhill were less related to the speed. However, for the road grade >−3% section (which is a level road and uphill road), a higher RER occurred at a higher-speed bin and a steeper road grade bin, which indicated that the emissions were positively correlated with the joint effect of road grade and speed. In this case, the engine not only maintained the vehicle moving forward, but also needed to overcome gravity to climb, resulting in a rapid increase in emissions.
Thirdly, in the lower speed bin (≤20 km/h), the increment in the average RER was relatively small in each road grade bin (Figure 7, a and b ). However, in the higher-speed bin, the average RER showed a rapid increase on level roads and moderate uphill roads (with road grades from −2% to 4%), and the increasing trend slowed down on steep uphill roads (>4%). This implies that emissions do not linearly increase with road grade.
Field test data help reveal the basic characteristics of emissions, but the quantification of the coupling relationship still needs to be modeled based on PEMS data to provide the emission data under continuous road grade and speed change.
Modeling and Analysis of the Coupling Relationship
A nonlinear Sigmoid function (Equation S1) was chosen to model the coupling relationship of the road grade, speed, and emission. The Sigmoid function curve with a large gradient in the middle and a smaller gradient at both ends was consistent with the curve of the aforementioned road grade-average RER. The average R2 values of simulated curves of CO2 and NO x were 0.93 and 0.96, respectively (more details were given in Table S6).
As shown in Figure 8, the road grade directly reduced the emissions while HDDTs drive on the road grade ≤−3% section, and the corresponding RER ranged from 0.06 to 2.42 (for CO2) and from 0.04 to 1.61 (for NO x ). For the road grade >−3% section, the road grade and speed had a joint effect on emissions. The CO2 RERs ranged from 1.37 to 2.53, 1.48 to 4.70, 1.27 to 8.80, 1.43 to 12.87, 1.61 to 17.68, 1.52 to 18.13, 1.67 to 17.26, and 2.54 to 21.26 under eight speed bins, respectively. The RERs of NO x ranged from 1.28 to 2.17, 1.33 to 4.37, 1.19 to 6.81, 1.19 to 10.13, 1.49 to 13.59, 1.68 to 17.29, 1.23 to 14.68, and 1.57 to 14.60, respectively. The uphill CO2 emission could be from 1.08 (which appeared when the road grade = 1% and speed bin was at (0.5,10] km/h) to 3.60 (6%, (40,50] km/h) times the respective flat road (0%) emissions. The respective result of NO x ranged from 1.07 (1%, (0.5,10] km/h) to 3.27 (6%, (50,60] km/h), which was similar to the result of Keramydas et al. ( 19 ). Moreover, by comparing with the relevant literature ( 16 , 17 , 19 , 21 ), it was found that the impact of the road grade on emissions was more distinct for the HDDT (the comparison results are given in Table S7).
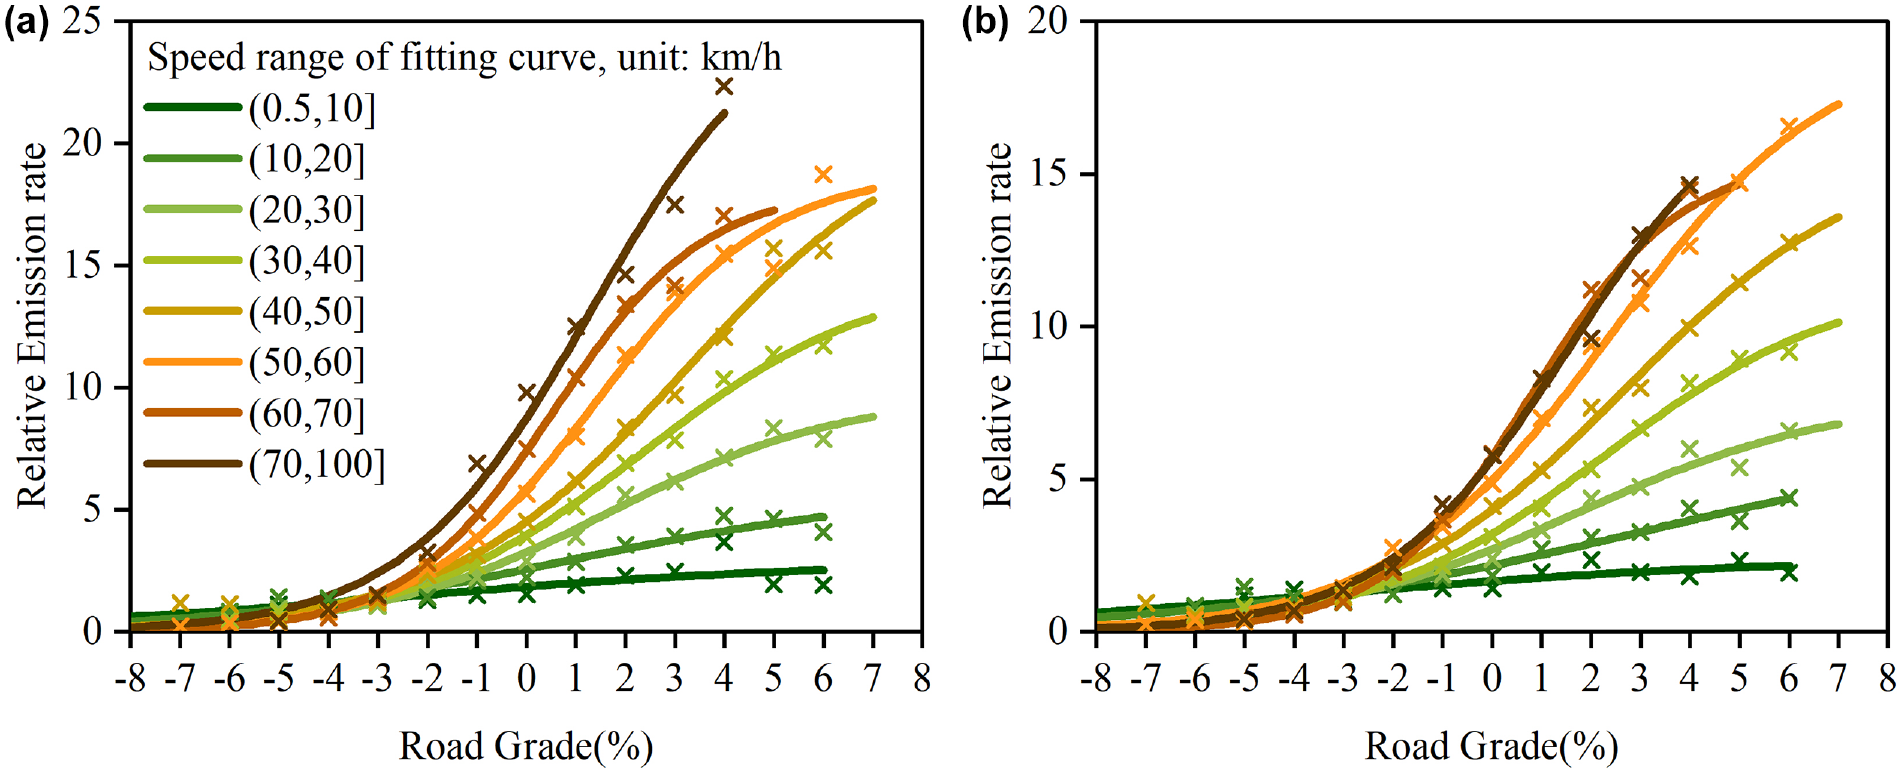
Modeling results of the impact of the road grade on the (a) CO2 and (b) NO x of heavy-duty diesel trucks in eight speed bins.
Figure 9 presents the sensitivity of RERs with road grade change. The maximum RER increment (vertex) position reflected the sensitivity of the emissions to 1% road grade changes at different speeds. In general, these vertexes are differenced with variations in road grade and speed, for example, 2%–3% at (20,50] km/h and 1%–2% at (60,100] km/h. They appeared on the gentler graded road as the vehicle speed increased. That is, at lower speeds, emissions were more sensitive to changes in the moderate uphill section. On the other hand, at higher speeds, a slight road grade significantly affected the emissions, even on a level road.
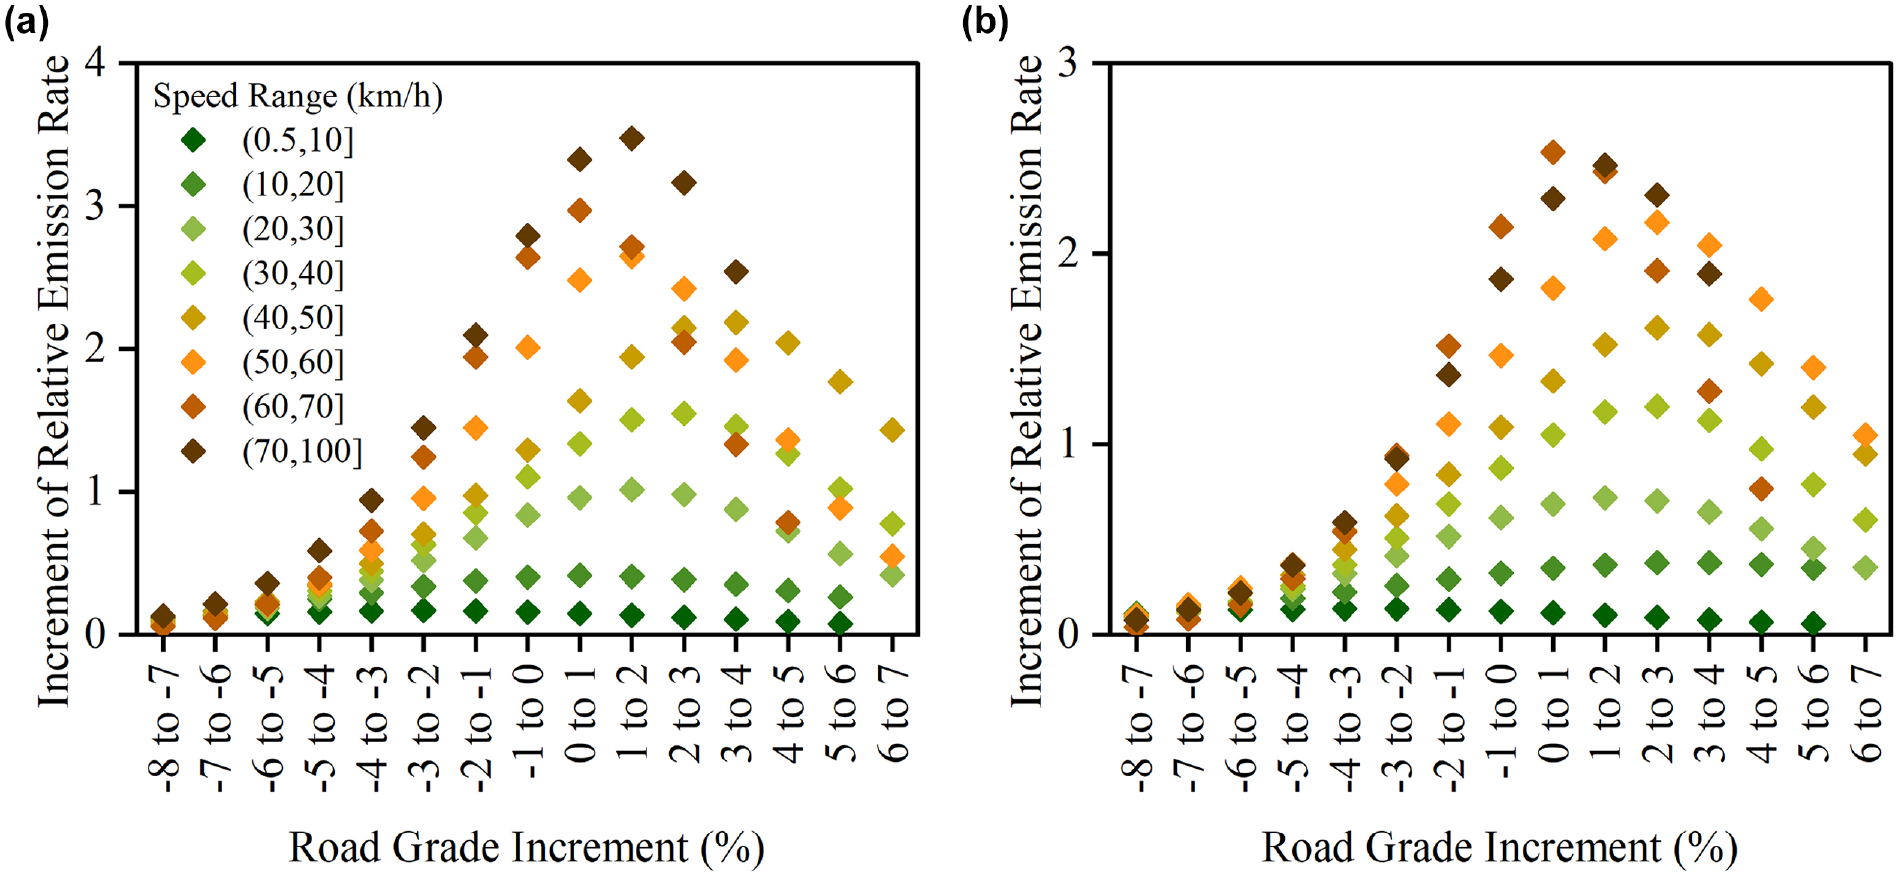
Changes in relative emission rate (RER) of (a) CO2 and (b) NO x with the increase of the road grade.
The CO2 emission rate deviation caused by ignoring the road grade ranged from −99.14% to 291.30%, and that of NO x ranged from −99.21% to 247.73% (Figure 10). In addition, the deviation was larger at higher-speed bins (>30 km/h), and their deviation values were close before the 3% road grade. It can be noticed that when the speed was over 20 km/h, the increase in emissions on uphill roads was not offset by the decrease in emissions on the corresponding downhill roads, which helps to support and supplement the viewpoint of Dhital et al. ( 22 ). In previous emission inventory calculations, the setting of road grades on emissions was based on the vehicle driving route being a closed loop, and thus the average slope (or the elevation change) of the route was equal to zero. In this case, the increase in emissions on uphill sections will be offset by the decrease in emissions on downhill sections. However, the results showed that this assumption was inaccurate, and further corrections for road grades on vehicle emissions at different speeds should be made.
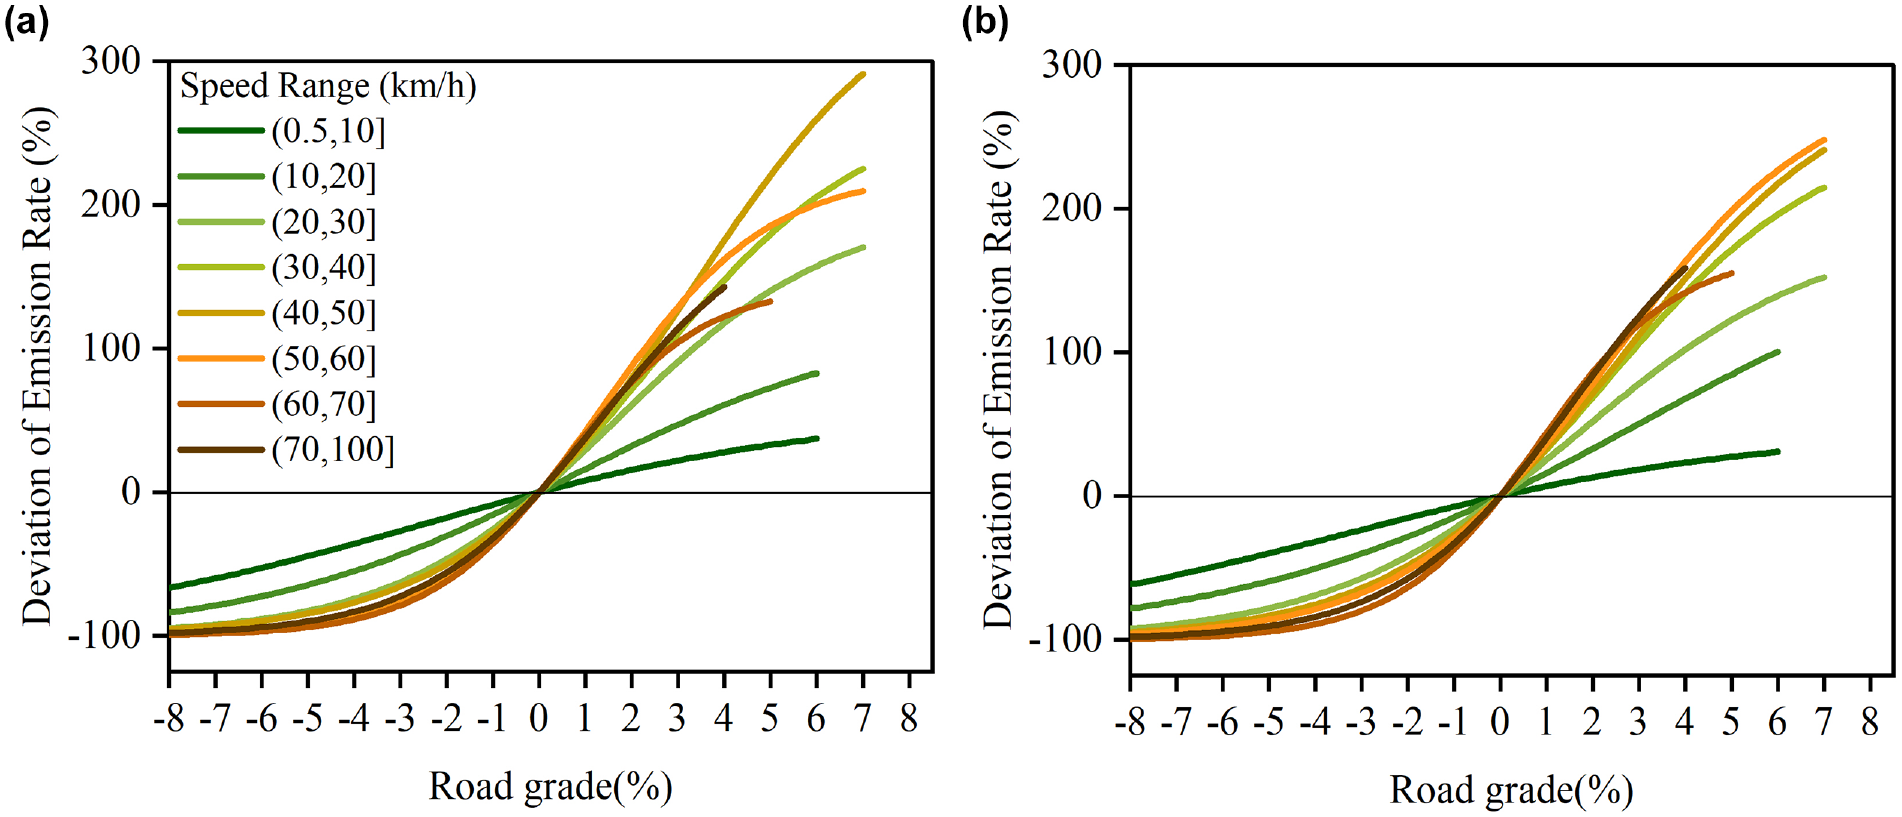
Relative deviation of (a) CO2 and (b) NO x emissions compared to a flat road.
Discussion
Against the background of fine-grained prevention and control in China, on-road HDDT emission estimation is crucial to the regulation and governance of mobile source emissions. Seventy percent of the land area in China is mountainous, with graded roads ( 20 ). The designed highways should also satisfy the requirements of a maximum road grade of 9% ( 38 ). Graded roads are common in city microenvironments (viaduct entrance ramps, branch roads, urban fringe areas, etc.). These results suggested that research on road grades for vehicular emissions was of great importance. Although the tests in this study were conducted in Chongqing, the results also could provide basic data support for cities with graded roads across the country.
Based on the on-road HDDT emission data collected by the PEMS, the road grade has a significant influence on HDDT emissions, especially at the level and uphill sections (road grade >−3%). Moreover, HDDT emissions were more sensitive to road grades at higher speeds, and the increase in emissions on uphill roads was not offset by the decrease in emissions on downhill roads. These findings help correct the insufficient assumptions of setting a constant value for the road grade in the emission calculations. In the future, the influence of other factors related to road conditions (e.g., the roughness of the road and road curvature) should be considered for vehicle emissions.
In this study, the results showed that the regular chassis dynamometer driving cycles test could hardly represent real-world vehicle emissions (recall Figure 4), in which the real-world NO x emission levels were significantly higher than the levels found during the World Harmonized Stationary Cycle (WHSC). To better reflect real-world vehicle emissions, real driving emissions (RDE) have been introduced as an important supplement to the type approval procedure since China VI. However, driving on hilly roads is still outside the boundaries of RDE regulations ( 39 ). The quantitative results of the coupling relationship of road grade, speed, and emissions could initially support the estimation of emission factors outside the RDE regulation.
By cooperating with microscale and mesoscale vehicle emission models, the coupling relationship can improve the road grade-speed correction factor for on-road emission calculation, initially improving the accuracy of the urban vehicle emission inventory by considering changes in road grades. Owing to a lack of large-scale road grade data, introducing the road grade to the high-resolution urban emission inventory has not yet been applied. However, large-scale road grade estimation methods ( 21 , 40 ) have been used to solve this problem. With the development of individual vehicle travel data based on the GPS and the increasing accuracy of digital elevation model (DEM) data, the establishment of a large-scale road grade database has become possible. More accurate vehicle emission inventories with higher spatio-temporal resolutions will be achieved in the near future.
Conclusions
A PEMS test on 24 HDDTs was conducted in Chongqing, a mountainous city in China, to reveal the coupling relationship of the road grade, driving operation, and emissions, and to quantify the emission changes under consecutive road grades and speeds by modeling. The main conclusions were summarized as follows.
The on-road NO x emissions from a large proportion of HDDTs exceeded the approval limit. Under real-world driving conditions, the average emission factors of NO x and CO2 of China IV HDDTs were the highest among all the tested HDDTs.
The average speed decreased by 4%–44% while the HDDTs drove on graded roads, and the acceleration events slightly increased on downhill roads.
The influence of the road grade on emissions was similar among HDDTs with different standards. For the same operation state, the emission rates on uphill roads are the highest, followed by level roads and downhill roads; for the same road grade types, emission rates in the vehicle accelerate state are the highest, followed by the cruise state and decelerate state.
The coupling relationship of road grade, speed, and emission was well-fitted by the Sigmoid function; the average R2 values of CO2 and NO x simulation curves were 0.93 and 0.96, respectively. When the road grade was ≤−3%, the CO2 emission ranged from 0.06 to 2.42 times that of the vehicle idling emission (0.04–1.61 times for NO x ), and emissions were less correlated with speed. When the road grade was >−3%, emissions were affected by both the road grade and speed, and the highest value for CO2 reached 21.26 times the idling emission (17.29 times for NO x ). The highest emissions appeared when a higher speed and a steeper uphill road were involved. The uphill CO2 emission was 1.08–3.60 times that on the flat road (0%), and the respective value for NO x ranged from 1.07 to 3.27.
Ignoring the road grade resulted in an estimation deviation from −99.14% to 291.30% of the emission rate for CO2, and from −99.21% to 247.73% for NO x . When the vehicle speed was over 20 km/h, the increase in emissions on uphill roads was not offset by the decrease in emissions on the corresponding downhill roads.
The demand for road transportation in China is increasing steadily. The HDDT is the main body of freight transportation, and its supervision is strictly required for environmental protection. The consideration of the road grade will effectively improve the accuracy of HDDT emission calculations. From an environmentally friendly road design and emission control aspect, this study offers a basis for emission data and supports decision-making for urban sustainable development.
Supplemental Material
sj-pdf-1-trr-10.1177_03611981231170012 – Supplemental material for Quantifying the Coupling Relationship of Road Grade Impacting Heavy-Duty Diesel Truck Operation Emissions in a Mountainous City in China
Supplemental material, sj-pdf-1-trr-10.1177_03611981231170012 for Quantifying the Coupling Relationship of Road Grade Impacting Heavy-Duty Diesel Truck Operation Emissions in a Mountainous City in China by Yonghong Liu, Hauyan Li, Wenfeng Huang, Xinru Yang, Li Li, Fanling Kong and Hui Ding in Transportation Research Record
Footnotes
Acknowledgements
The authors thank the Vehicle Exhaust Pollution Management Center (VEPMC) of Chongqing for their support in the PEMS test and data, and thank the China Automotive Engineering Research Institute Co., Ltd (CAERI) for their guidance in the use of PEMS instruments.
Author Contributions
The authors confirm contribution to the paper as follows: study conception and design: Y. Liu, H. Ding; data collection: H. Li, L. Li, F. Kong; analysis and interpretation of results: H. Li, W. Huang; draft manuscript preparation: H. Li, X. Yang. All authors reviewed the results and approved the final version of the manuscript.
Declaration of Conflicting Interests
The author(s) declared no potential conflicts of interest with respect to the research, authorship, and/or publication of this article.
Funding
The author(s) disclosed receipt of the following financial support for the research, authorship, and/or publication of this article: This work was supported by the Natural Science Foundation of China (No. 41975165; No. U1811463).
Supplemental Material
Supplemental material for this article is available online.
References
Supplementary Material
Please find the following supplemental material available below.
For Open Access articles published under a Creative Commons License, all supplemental material carries the same license as the article it is associated with.
For non-Open Access articles published, all supplemental material carries a non-exclusive license, and permission requests for re-use of supplemental material or any part of supplemental material shall be sent directly to the copyright owner as specified in the copyright notice associated with the article.