
Abstract
Understanding the preferences for new and future transportation technologies is important to ensure an efficient and equitable future transportation system. A survey was conducted of Americans’ preferences for several such technologies. Americans are concerned about vehicle range and charging station availability for electric vehicles (EVs) and hesitant about autonomous vehicle (AV) safety. Opinions about many transportation technologies, such as vertical takeoff and landing (i.e., air taxis), shared parking, and air-drone delivery are mixed. These less familiar technologies require continued tracking of preferences. A 55% increase is estimated in the probability of an individual choosing a battery electric vehicle (BEV) pickup truck if its fuel economy increases by about 9%. This result supports a market for BEV pickup trucks currently under development by many automakers. The preference for vehicle autonomation appears to depend on the use case. Driving task automation is preferred by residents of low-density, car-dependent areas where long commutes are common. In contrast, automated parking technologies are favored by those living in denser communities. Intermittent bus lanes are favored by those living in high population density areas, but not among those in areas with high shares of zero-vehicle households. These results provide indications of where to direct future research in the field.
Keywords
Numerous innovations are occurring in the transportation sector, with automation, electrification, and ride-hailing being among the most widely discussed technologies. Electrification is introducing new players in the original equipment manufacturer (OEM) market and forcing incumbents toward innovation. The development of mobile application-based transportation service providers (e.g., Uber, Lyft, and DiDi) provides a glimpse into a future city where households purchase transportation as a packaged service rather than owning and maintaining their own vehicles. Automation of the driving task is now a question of when rather than if, providing a means of significantly reducing the cost of providing transportation services. There is also the possibility of urban air mobility (via vertical takeoff and lift, for passengers and goods), alongside more mundane innovations such as dynamic bus priority lanes and (de)congestion pricing. Much uncertainty exists as to how these emerging and future technologies will affect travel. Impacts depend on rates of technology development, individual preferences and adoption rates, and policy directions taken by government actors. A multi-faceted research approach is required to capture the breadth of potential impacts from these technologies. This paper summarizes the findings of one component of this research agenda—with a focus on the preferences of individuals. A survey was developed to collect a wide range of travel preferences from a representative sample of Americans. The survey contained a mix of attitudinal, willingness-to-pay (WTP), and situational questions related to a variety of transportation technologies.
Previous surveys have targeted specific technologies. A common focus in the transportation literature is the WTP for vehicle automation. These studies generally use survey results to forecast market penetration of autonomous vehicles (AVs) ( 1 – 3 ) or mode choice with the introduction of AVs as a modal alternative ( 4 ). Similar research streams exist for electric vehicles (EVs) ( 5 ) and ride-hailing adoption and mode choice ( 6 , 7 ). Vertical takeoff and landing (VTOL) urban air mobility is also an emerging topic of interest in travel behavior research ( 8 , 9 ). There are advantages to such targeted treatments of future transportation technologies. It allows for a deep investigation of preferences and a wide range of questions to be included in the survey about the technology. Given the potential of mobility as a service (MaaS) and the many technologies on the horizon, it is equally important to obtain cross-cutting results for a single sample of individuals. In this way, the preferences for a given individual can be compared for multiple technologies rather than relying on comparisons across sociodemographic groups among multiple surveys. The survey described in this paper included questions about the above technologies (AVs both private and shared, EVs, ride-hailing, and VTOL), as they are likely to be important technologies in the coming decades. However, it included a wider range of technologies: bike-sharing, microtransit, personal rapid transit, vehicle-to-person (V2P) communication systems, remote vehicle control equipment, automated parking, vehicle platooning technology, shared parking, air-based drone delivery, and congestion pricing. Questions also address home location and remote work, in light of the recent COVID-19 pandemic.
Given the scope of the survey, only a subset of the results is presented in this paper. The survey instrument is first described, along with question classifications, and sampling frame. A weighting strategy corrects for sample versus population differences in demographics, and population-corrected summary statistics are compared with related results from a 2017 survey ( 10 ). Attitudinal results are then discussed. The paper includes the results from several models, with detailed discussion provided for two predictive models, for next-vehicle choice behavior and WTP for AV technologies.
Survey Design and Data Processing
This section outlines the design and processing of the survey instrument. It defines the quota variables used to ensure the sample matched the population and the post-stratification process to adjust the sample distribution across a wider range of control dimensions.
Questionnaire Design and Data Acquisition
The survey was administered to a sample of 998 respondents (after filtering for incomplete responses) representing a cross-section of Americans. Quotas were set during survey collection to maintain consistency with key demographic variables: gender, age (six categories), educational attainment (four categories), and geographic region (four categories). These quotas were used as tracking guidelines rather than hard limits to avoid overfitting and under-sampling of other key variables. The survey was designed in Qualtrics and the survey panel was obtained from a professional survey vender (Dynata). The survey had the following structure:
“
“Brain check” question to check for respondent attention and knowledge.
Data Cleaning and Sample Weighting
Post-stratification weighting was applied to the collected sample to match demographic and other variables. 2015 to 2019 American Community Survey (ACS) public-use microsample (PUMS) data were used to construct combinations of marginal and partial joint distributions. An iterative proportion fitting (IPF) approach was used to match survey responses to control totals from the ACS. The choice of weighting variable was based on a combination of literature sources ( 11 – 13 ), previous work by the research team ( 2 , 4 , 5 , 14 ), and the variables in the survey for which the team could obtain reliable control totals from external surveys. The following weights were used in the IPF procedure (multi-variable weights are combinatorial):
• Geographic division: New England; Middle Atlantic; East North Central; West North Central; South Atlantic; East South Central; West South Central; Mountain; and Pacific.
• Household size: 1; 2; 3; 4; and 5+ • Employment status: employed, working 40 or more hours per week (including self-employed); employed, working 1 to 39 hours per week; student, working part-time; student, not working; not employed, looking for work; not employed, not looking for work; and retired. • Household vehicles: 0; 1; 2; 3; and 4+
• Educational attainment: less than high school; high school; some college; associate or technical degree; bachelor’s degree; master’s degree or higher. • Household (pre-tax) income: Less than $10,000; $10,000 to $19,999; $20,000 to $29,999; $30,000 to $39,999; $40,000 to $49,999; $50,000 to $59,999; $60,000 to $74,999; $75,000 to $99,999; $100,000 to $124,999; $125,000 to $149,999; $150,000 to $199,999; $200,000 or more.
• Age and gender: 18 to 24; 25 to 34; 35 to 44; 45 to 54; 55 to 64; and 65 to 74 (in combination with male or female). • Marital status: single; married; divorced or separated; and widowed.
The levels for many of these dimensions are more disaggregate than in previous work because they are constructed from the control totals from the PUMS sample rather than existing variable distribution tables. The survey oversampled male respondents and respondents aged 65 to 74 but under-sampled respondents aged 55 to 64 and those with a high school degree or equivalent.
Geocoding and Referencing Survey to External Datasets
Model estimation requires additional data on the demographic of sub-regions of the United States, land use and built environment characteristics, and other relevant explanatory variables. The EPA Smart Location database provides a wide range of these variables for block groups ( 15 ). A zipcode question was included in the survey that asked for the full zipcode+4 of respondents’ home locations. The online geocodio tool was used to obtain longitude and latitude coordinates for these zip+4 data ( 16 ). There is no single point for zip+4 codes, so geocodio randomly assigns among the list of buildings in a given zip+4 code. Despite the inclusion in the survey of a link to look up zip+4 codes, many respondents provided only their 5-digit zipcode. However, the survey metadata included an IP address longitude and latitude. These coordinates will be more detailed than a 5-digit zipcode; however, some respondents may complete the survey at a different location than their home. In the case that a respondent did not provide their zip+4 code, the IP address was used only if its coordinates lay within the stated 5-digit home zipcode. Otherwise, the centroid coordinates for the 5-digit zip code were used to associate the survey record with EPA Smart Location data.
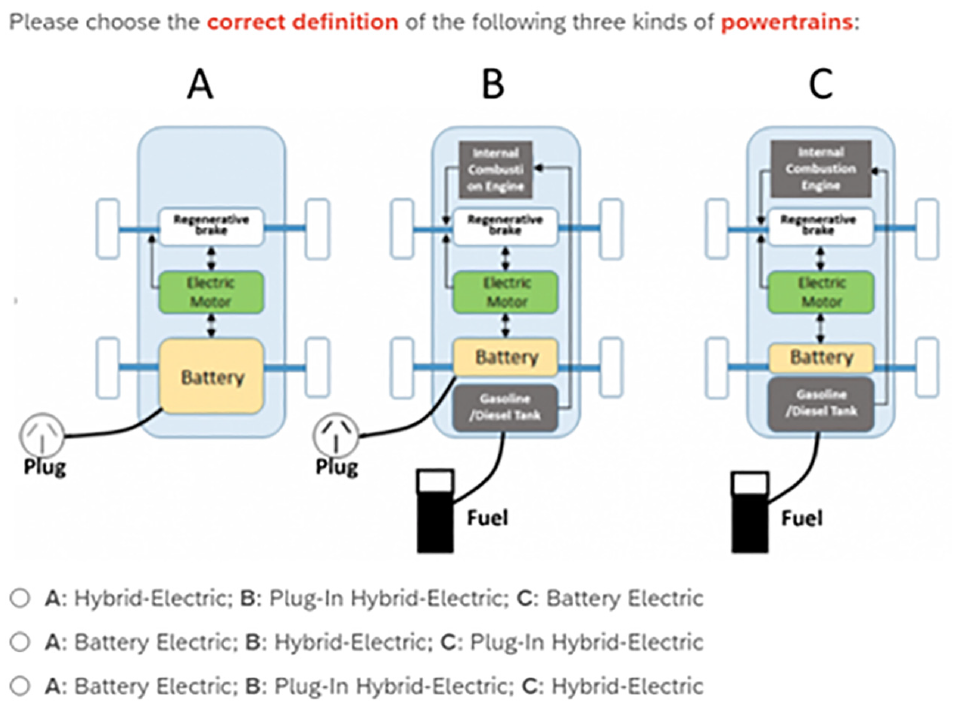
Based on the survey data, the following sixteen vehicle types were defined as the full factorial combination of four vehicle classes (coupe, sedan ICE, SUV/minivan, and pickup truck) and four powertrain classes (ICE = internal combustion engine, BEV = battery electric vehicle, HEV = hybrid electric vehicle, and PHEV = plug-in hybrid electric vehicle). As a backend database to its fuel economy website, the EPA provides a rich dataset of vehicle attributes including fuel economy, charging time for plug-in electric vehicles (PEVs), tailpipe emissions, fuel costs, luggage volume, and savings/expenditures over 5 years relative to an average car. The survey data include whether the next vehicle purchase will be a new or used vehicle. As such, vehicle data from the EPA database was aggregated into “new” (assumed as vehicle model years 2020, 2021, and 2022) and “used” (assumed as vehicle model years between 2009 and 2019, inclusive). Edmonds statistics suggest an average used vehicle age of 3.5 to 4.4 years, so averaging over a 10-year range seems reasonable ( 17 ).
In addition to vehicle characteristics, price is an important variable to include in the model. January 2021 Kelley Blue Book statistics for sales price by vehicle class and total sales were used to obtain weighted average prices for each of the sixteen vehicle types. In some cases (HEV, PHEV, and BEV SUV/minivan and pickup trucks), prices were not reported for the vehicle category, or it does not exist yet. In these cases, prices for several models or the expected price were taken as representative of the market ( 18 – 21 ).
Figure 2 illustrates that the survey provides a good spatial distribution of responses. Although there are no responses geocoded to either Alaska or Maine, there is one respondent in each case who reports it as their home state. For both respondents, their reported zip code and the IP address coordinates in the survey metadata place them in a different state than that indicated in the home state question. Given that the survey was conducted in April and that both are northern states, it is possible that these respondents completed the survey at a winter residence.
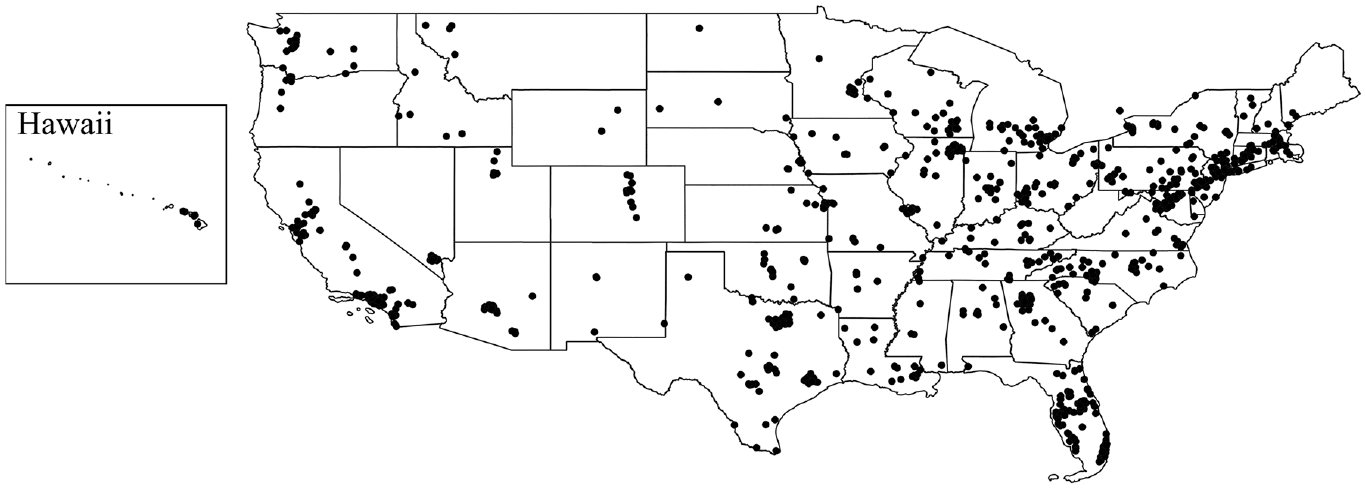
Distribution of survey responses.
Summary Statistics
This section provides general statistics derived from the survey results. In many cases, comparison is made with a previous survey conducted by the research team in 2017 (Quarles and Kockelman 5 ).
Vehicle Ownership and Purchase
Most respondents own gasoline-powered sedans, minivans, SUVs, or CUVs. However, the distribution is quite different for their anticipated next vehicle (see Table 1). A higher share of respondents expects their next vehicle to be a pickup truck or coupe—a shift toward the higher and lower ends of the vehicle class distribution. Most respondents intend to purchase a gasoline- or diesel-powered vehicle, but a significant portion of respondents intend to switch to battery or plug-in EVs (an increase of ∼18 percentage points over 2017 results). There is a marked decline in the percent of respondents who intend to purchase gasoline- or diesel-powered vehicles. The largest increase is for BEVs (12.7 percentage points), which is a promising trend for the adoption of lower-emissions vehicles.
Type of Vehicle for Next Acquisition Among Those Intending to Purchase a Vehicle in the Future (Population Weighted)
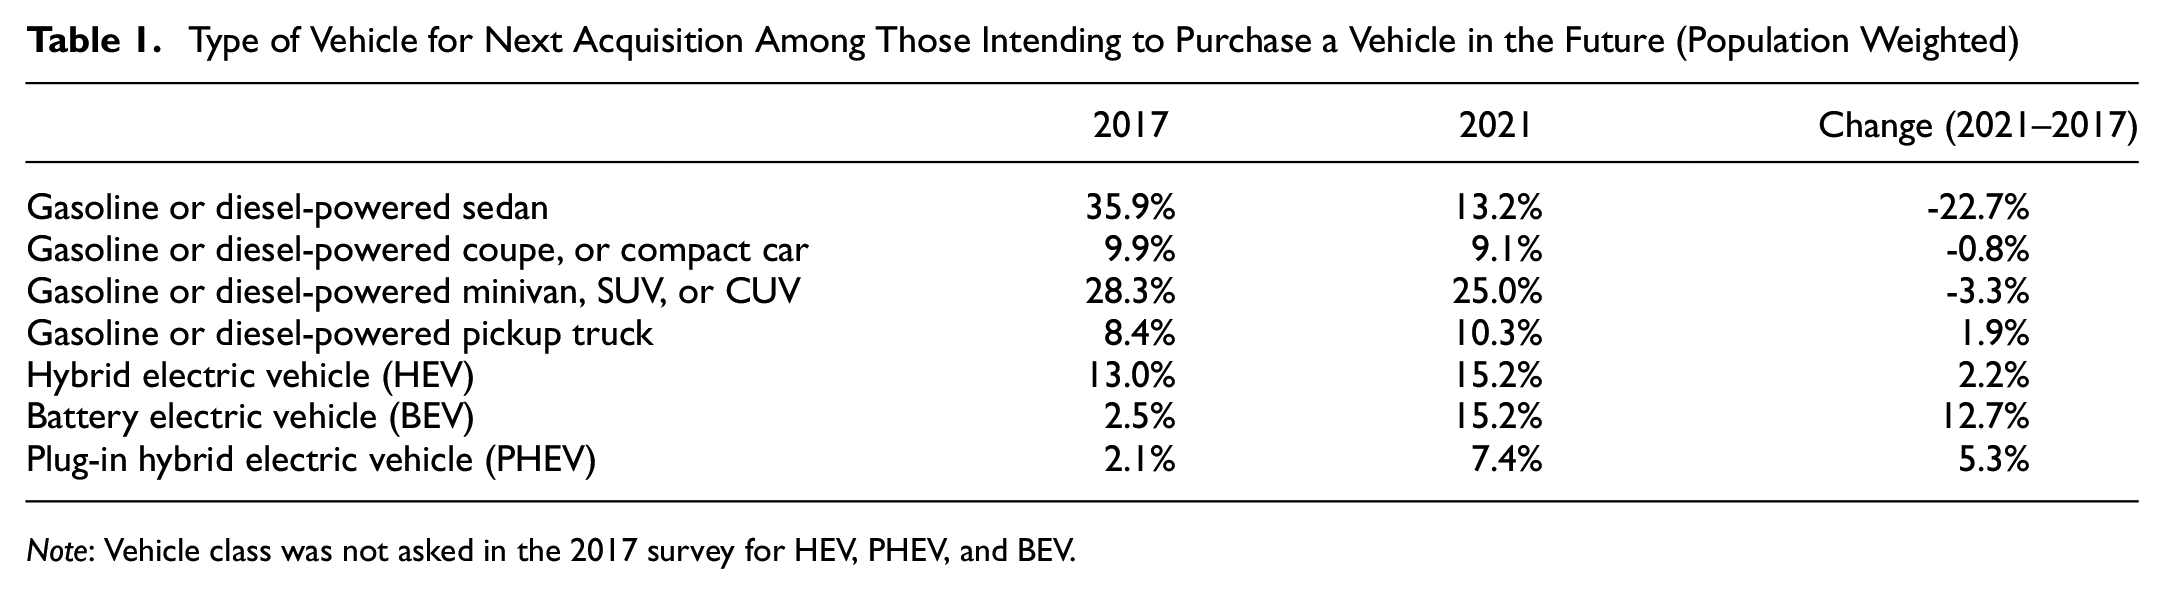
Note: Vehicle class was not asked in the 2017 survey for HEV, PHEV, and BEV.
Attitudinal Analysis
This section is divided into four subsections covering attitudes about new travel modes, attitudes about new travel technologies, willingness to pay for new travel modes and technologies, and changes in home location preferences. In some cases, additional concerns were imputed from the “other” option based on text responses. The totals for these responses are likely low and may have been selected by other respondents if presented in the survey. Note: results for attitudinal analysis do not necessarily sum to 100% as a result of multiple selections.
Attitudes About New Travel Modes
Charging concerns are a dominant force in hesitancy about EV adoption (see Table 2). Most respondents worry that EVs will have insufficient battery capacity for their daily travel and there are not enough charging stations. These are not new concerns, and the solution is likely as much informational as technological ( 22 ). A 2016 study found that 87% of daily travel could be accomplished by EV ( 23 ), with vehicle range only increasing since then. Among the motivations for EV adoption are environmental concerns and lower fuel costs. However, a non-negligible segment of respondents (26%) stated they are not interested in purchasing an EV.
Concerns and Motivations for Electric Vehicle Choice
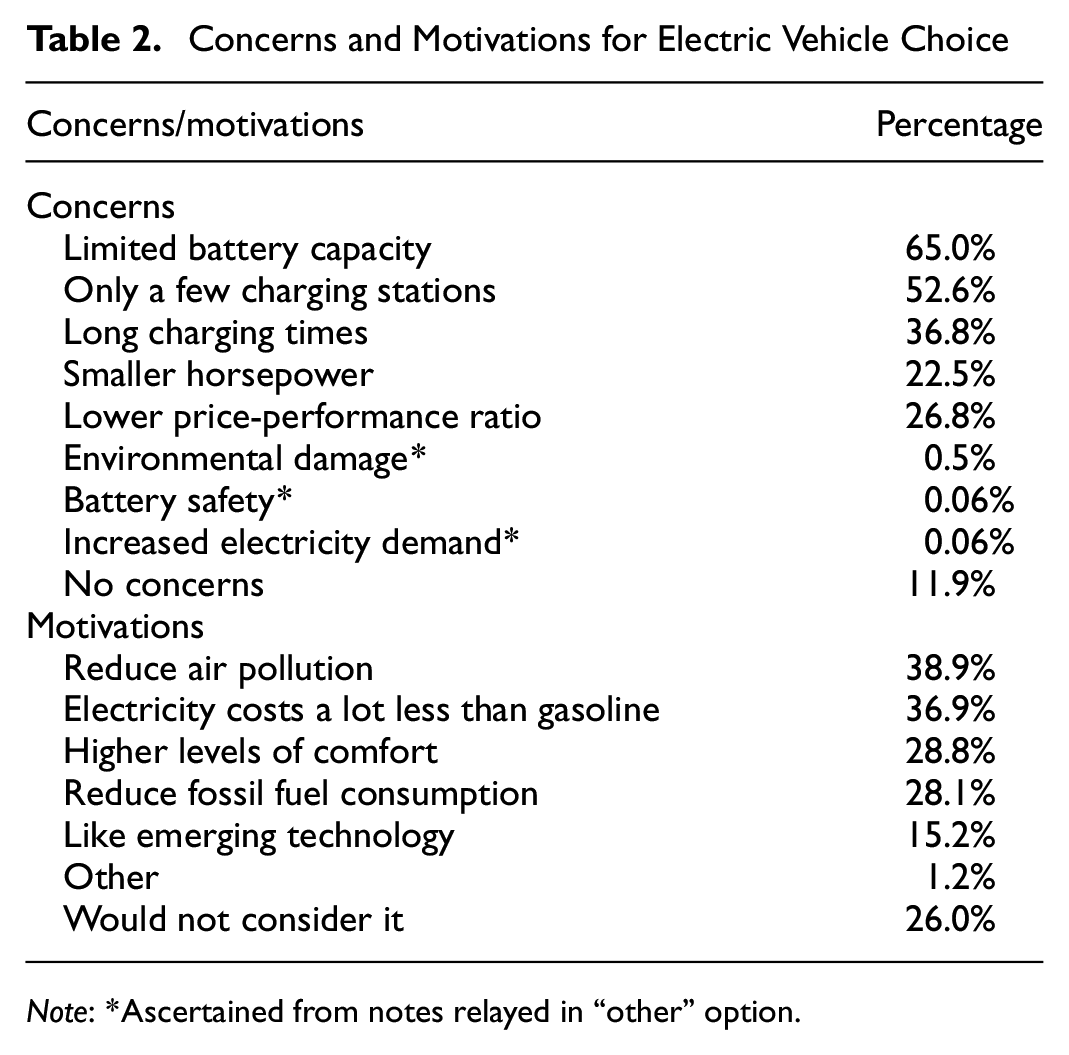
Note: *Ascertained from notes relayed in “other” option.
In the case of AVs, there is a bifurcation in the perception of safety among respondents (see Table 3). Roughly 61% of respondents expressed concern about AVs causing traffic crashes, whereas 25% of respondents indicate increases safety as a motivation to use AVs. The ability of AVs to handle unusual situations (e.g., construction and snow cover) is also a major concern among respondents. A high percent (41.1%) of respondents were unwilling to consider travel by AV.
Concerns and Motivations for Autonomous Vehicle Choice
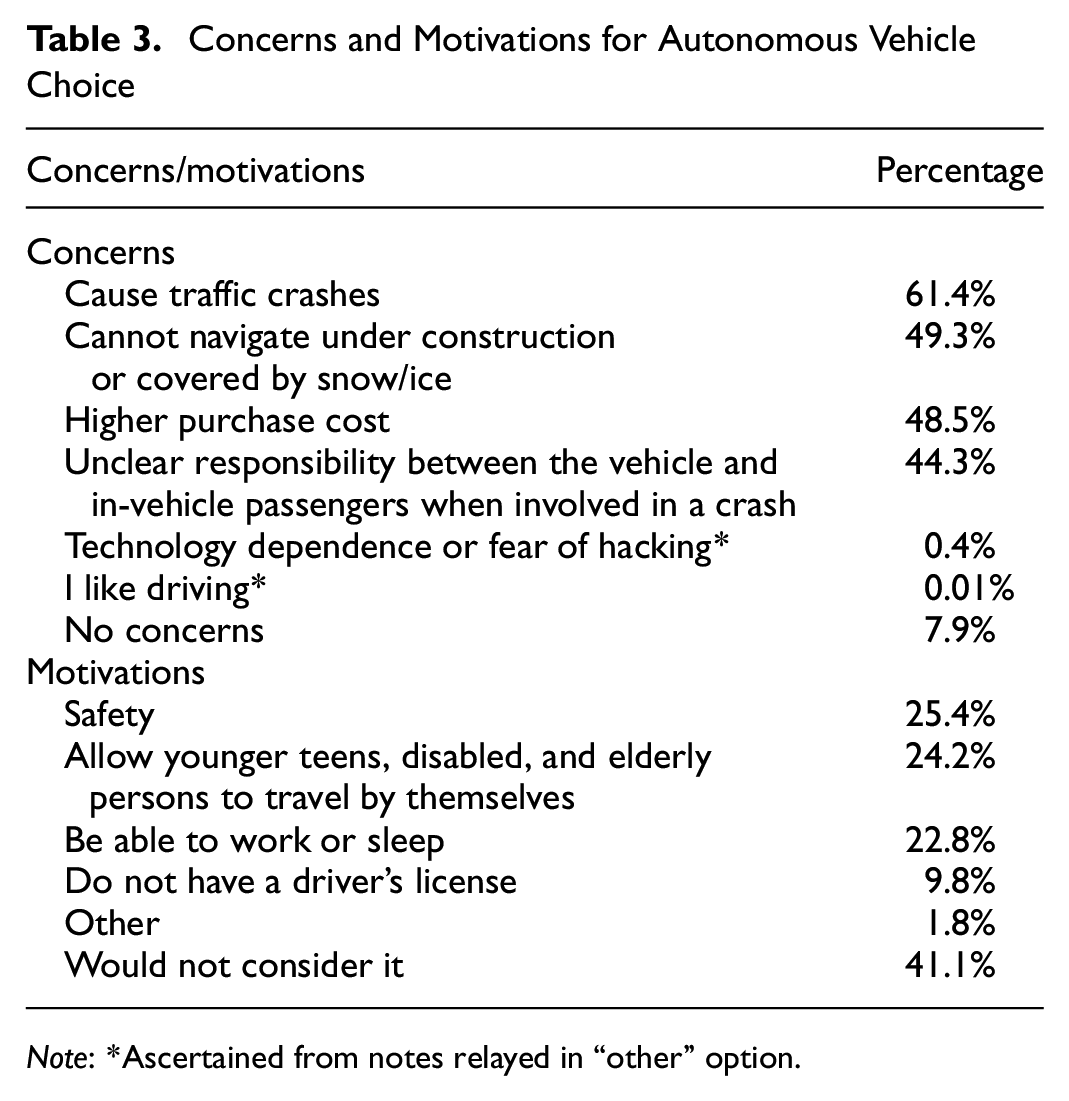
Note: *Ascertained from notes relayed in “other” option.
Attitudes About New Technologies
Respondents were asked several situational questions to assess their willingness to use various transportation technologies. All figures are based on population-weighted survey data. In the case of VTOL, about 36% of respondents expressed interest in using the service if it was twice the price of a taxi but halved the travel time (see Figure 3). This result indicates that such a service would be feasible, but it would likely serve a higher-income niche market.
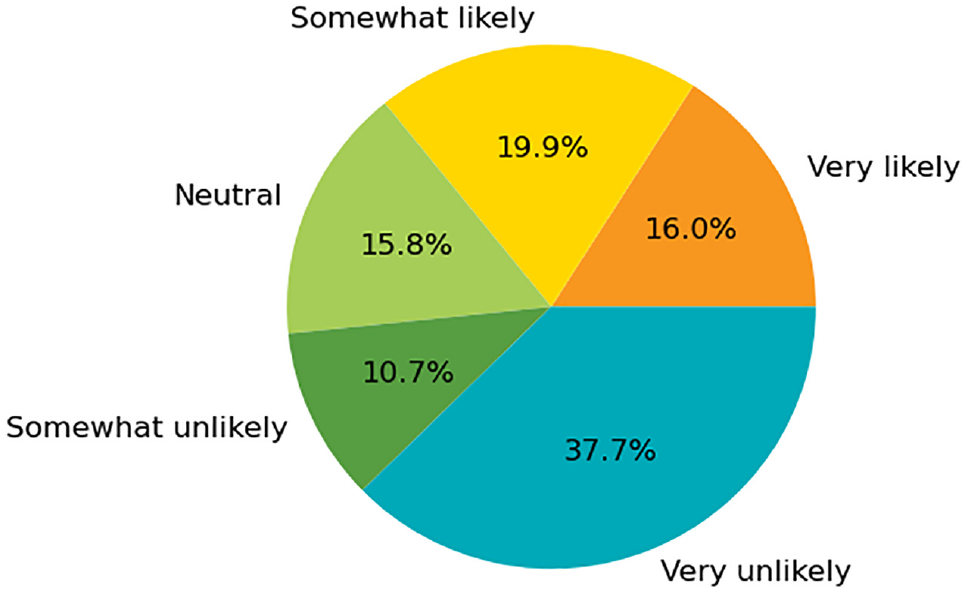
Willingness-to-pay for electric vertical takeoff and landing (EVTOL) vehicles.
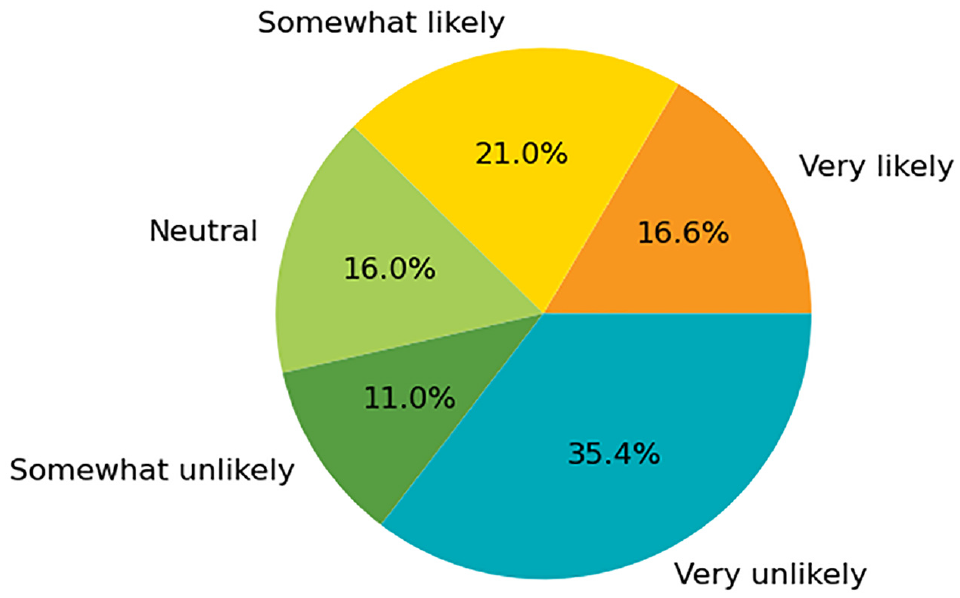
Respondents were asked about both their WTP to share parking at their home (as a supplier—see Figure 4) and their travel destination (as a consumer—see Figure 5). In both cases, shared parking was assumed to offer a monetary benefit to the respondent. For shared parking at the destination, respondents were asked to assume they had a 50% chance of finding a shared space at $2/hour versus a dedicated space at $4/hour. As with VTOL, responses were mixed to these questions, likely because the technologies are unfamiliar. If respondents had a wider exposure to shared parking systems, the distribution of responses would likely be more polarized (whether positive or negative).
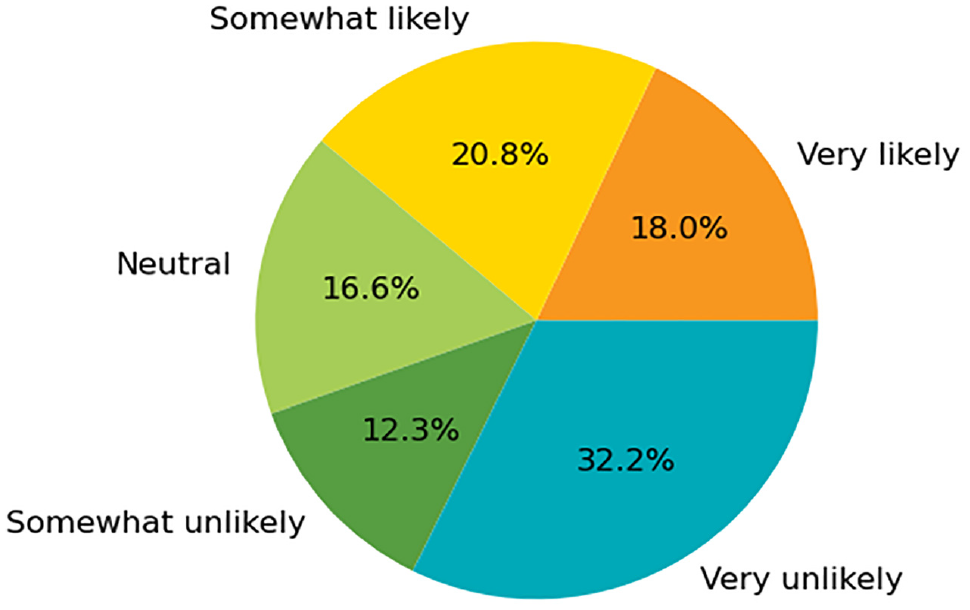
Willingness-to-share parking space at home.

Willingness-to-pay for shared parking at destination.
Another air-based technology on the horizon is drone delivery. Respondents were asked about both their willingness to use such a service (Figure 6) and their willingness to accept their neighbor’s use of it (Figure 7). The delivery service would cost twice as much as traditional delivery but reduce the delivery time by half. Again, respondents expressed a mix of responses. There appears to be a higher willingness to accept the use of drones by neighbors relative to personal use. The difference in responses could be attributed to a common concern about privacy but a lack of cost in the second instance.
Willingness-to-pay for air-based drone delivery of goods.
Willingness-to-accept neighbor’s use of air-based drone delivery.
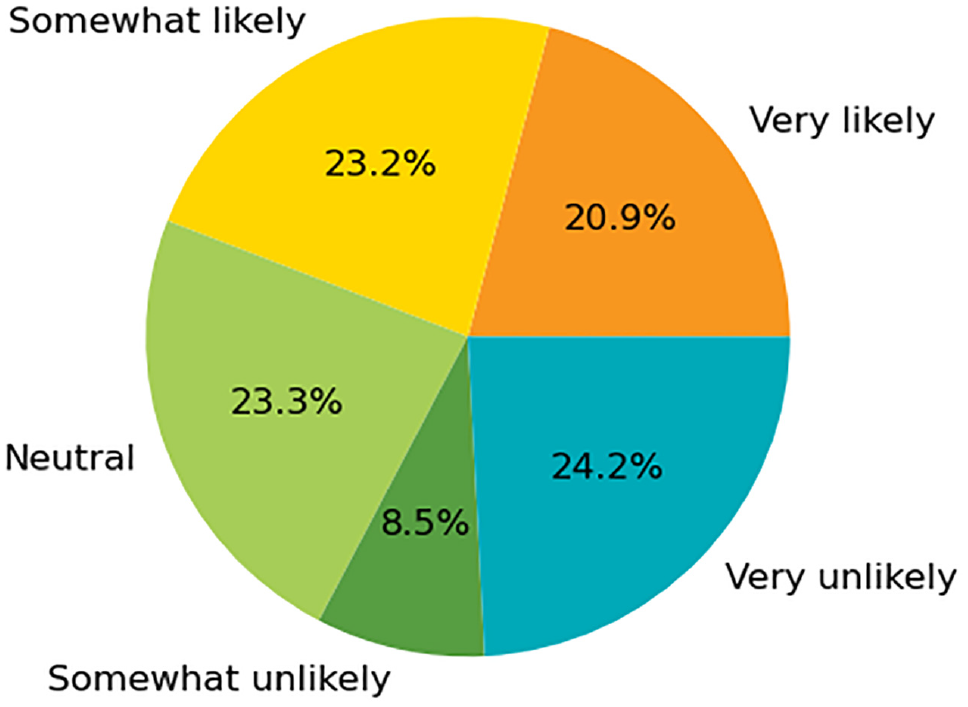
Finally, among the attitudinal questions, the ongoing COVID-19 pandemic has significantly increased the prevalence of remote work and led to questions about its continuation in the coming years ( 24 , 25 ). Although not a central focus of the research, a question about remote work preference was included in the survey. The majority of respondents expressed an interest in continuing to work remotely. Similar patterns were found for both employees and employers (see Figure 8).
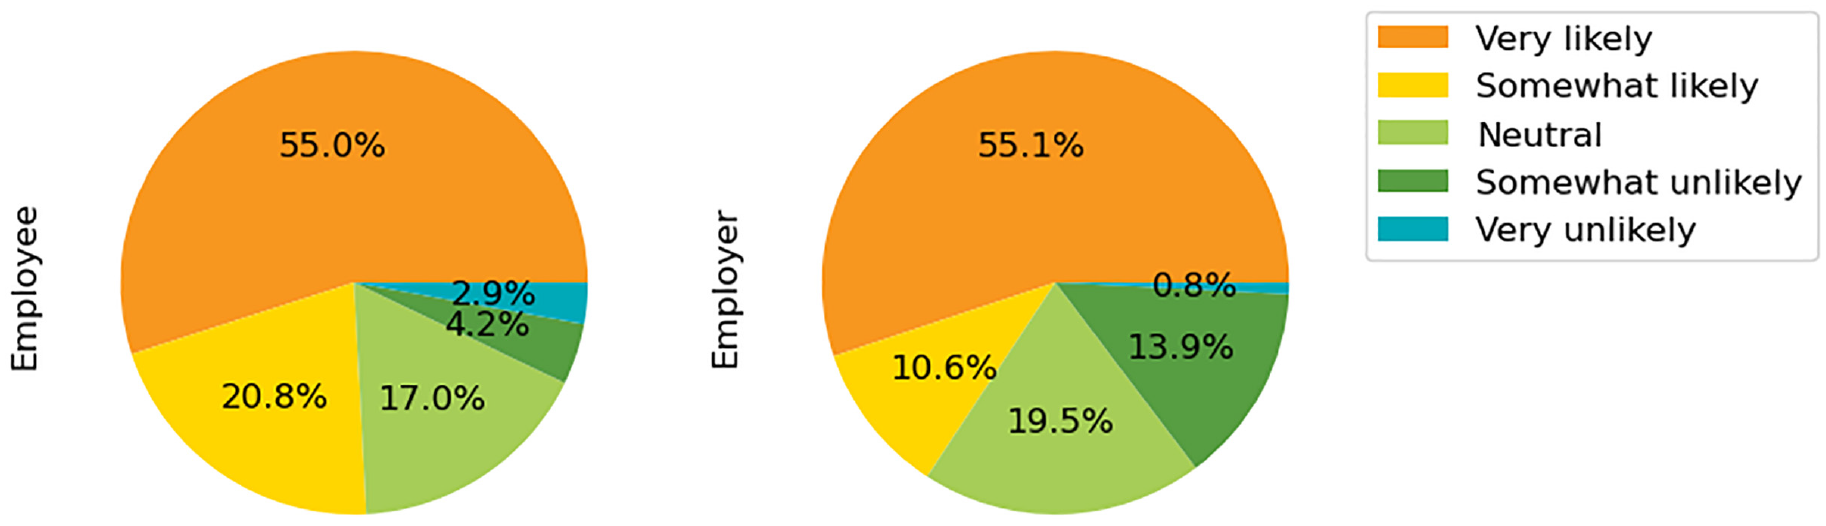
Interested in working remotely after the COVID-19 pandemic.
Comparison with Results from 2017
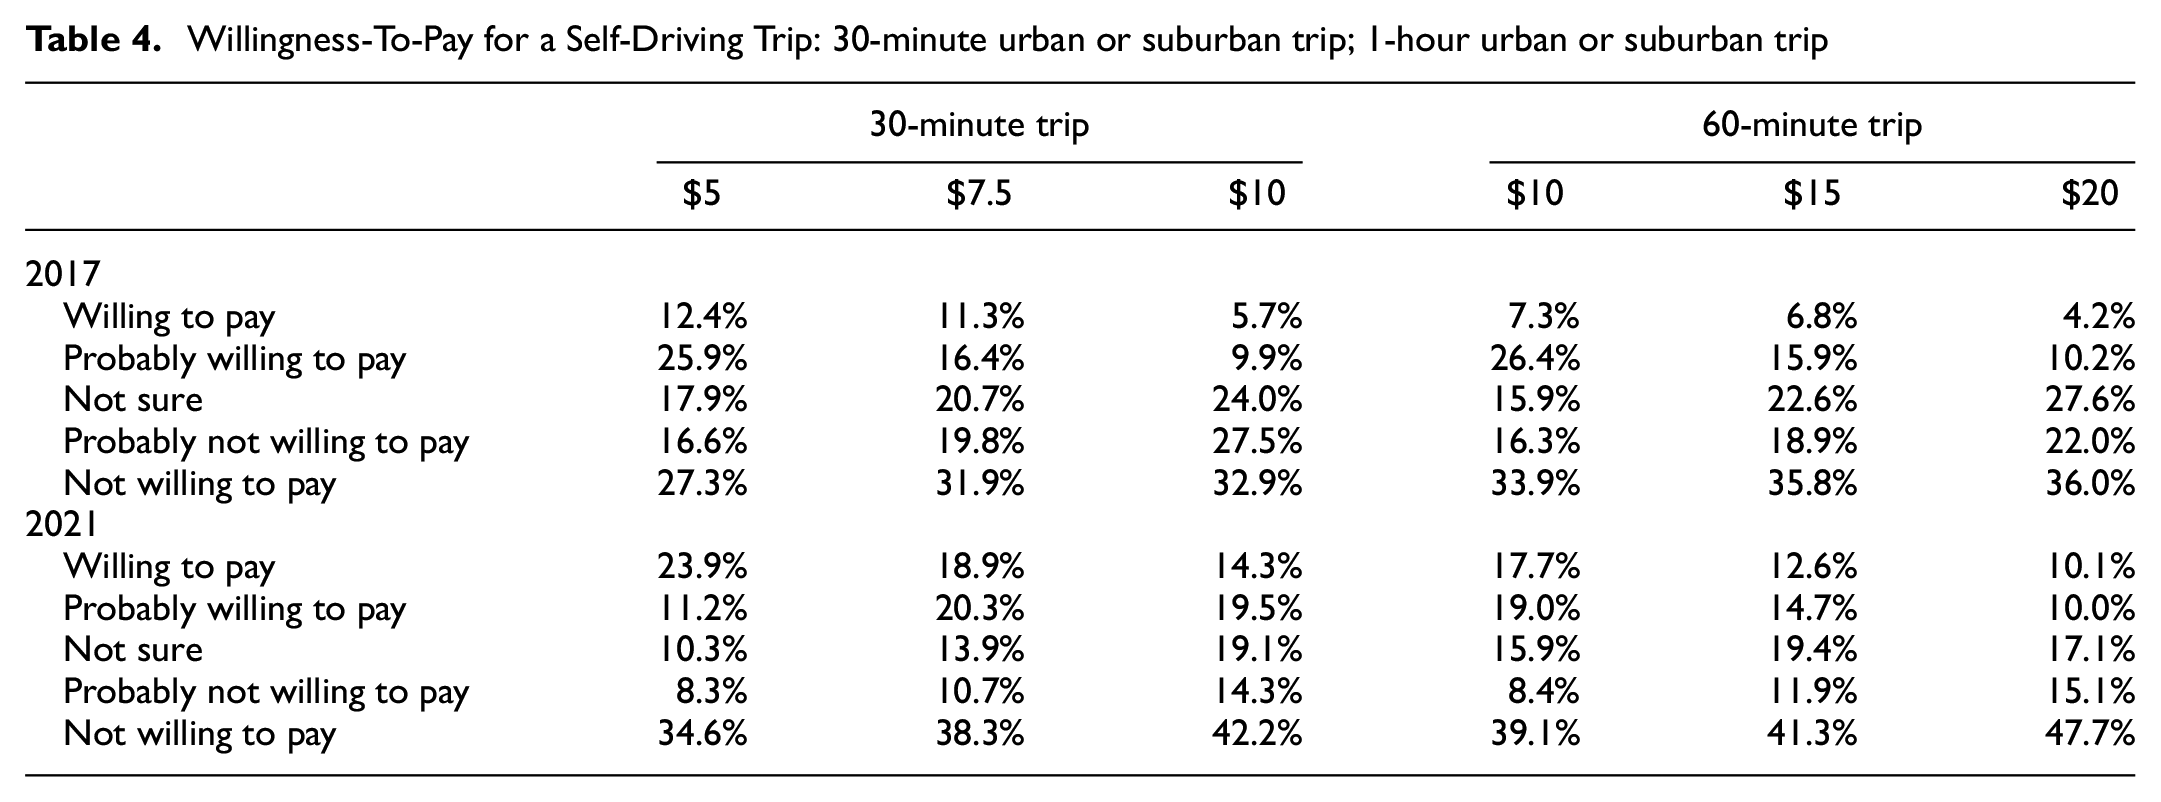
Several questions were included in the survey that parallel questions asked in the 2017 survey, allowing for analysis of how preferences have changed over the intervening five-year period. Table 4 suggests that Americans are becoming more confident about their preferences for AVs as the technology becomes more widely known. In 2017, only 12.4% of respondents expressed a strong WTP five dollars to have their vehicle drive them home for a 30-minute trip, whereas in 2021 this share had more than doubled. At the opposite end of the scale, those “definitely not willing to pay” increased by about ten percentage points. For a longer trip of 60 minutes, fewer respondents are willing to pay twice the price (i.e., the same price per minute of trip time), suggesting a diminishing marginal WTP for travel automation. Additional WTP analysis is included later in the paper.
Willingness-To-Pay for a Self-Driving Trip: 30-minute urban or suburban trip; 1-hour urban or suburban trip
The WTP results are likely affected by economic uncertainty induced by the COVID-19 pandemic. Lin et al. generated a real economic uncertainty metric for the period December 2000 to April 2021 ( 26 ). They found that uncertainty peaked at seven standard deviations above the historical mean between March and May 2020. The survey was conducted in April 2021, placing it roughly 1 year after this time of peak uncertainty (Lin et al.’s analysis does not include April 2021). Mannering highlights the impacts of similar macroeconomic events on traffic safety ( 27 ). However, it is unclear to what extent such uncertainty will affect WTP for technologies at different stages of development. For example, is a person less willing to share a ride with a stranger via Uber Pool today than they would be to share an AV in 5 to 10 years? Such a comparison would require a more targeted comparison that controls for macroeconomic and future discounting factors.
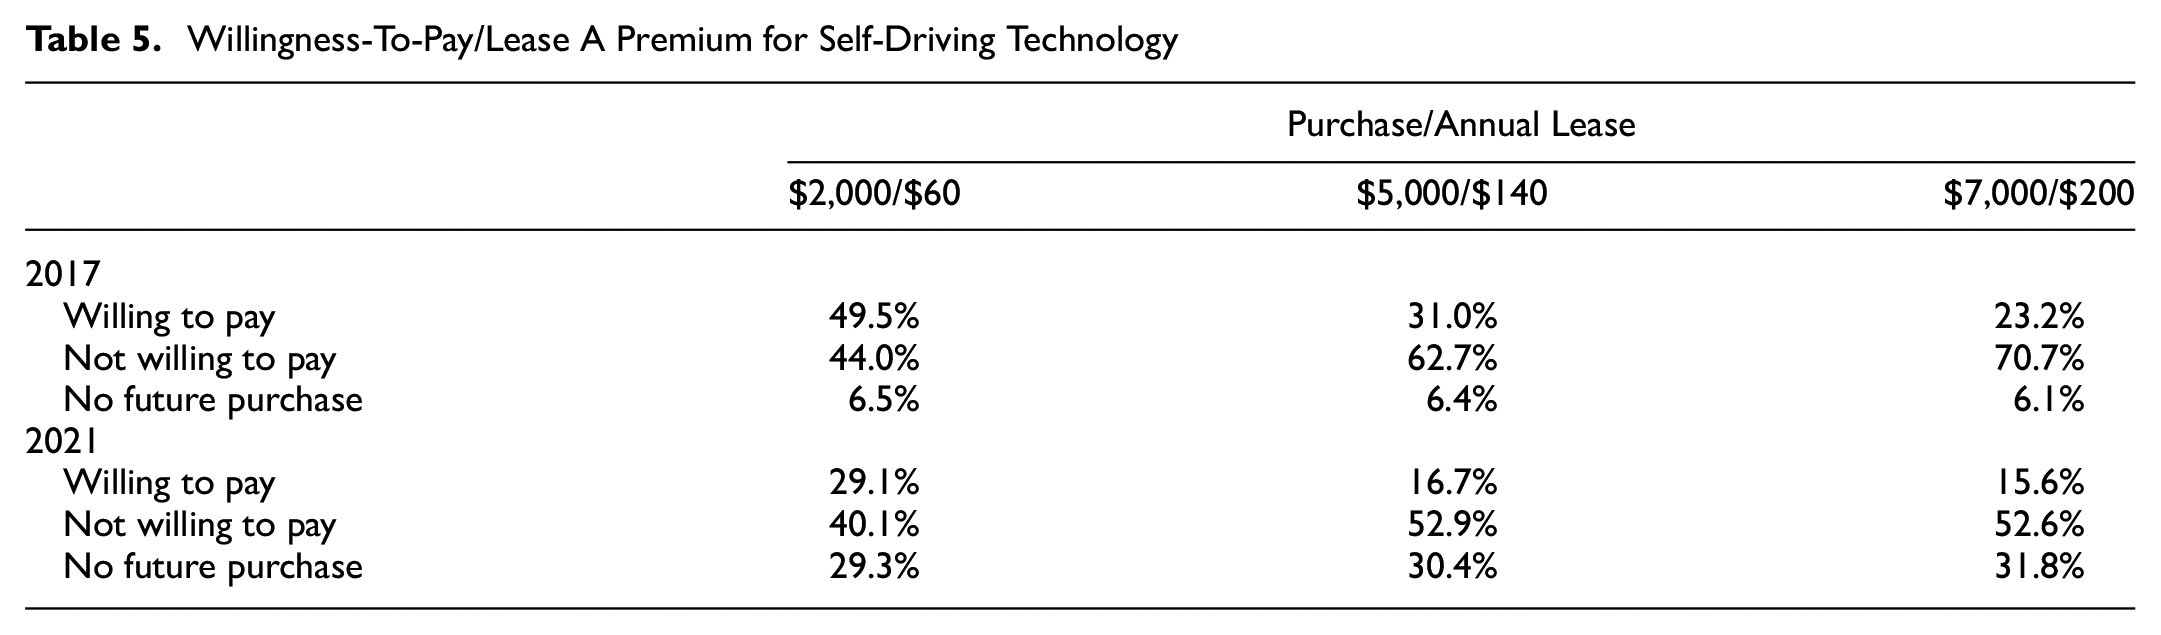
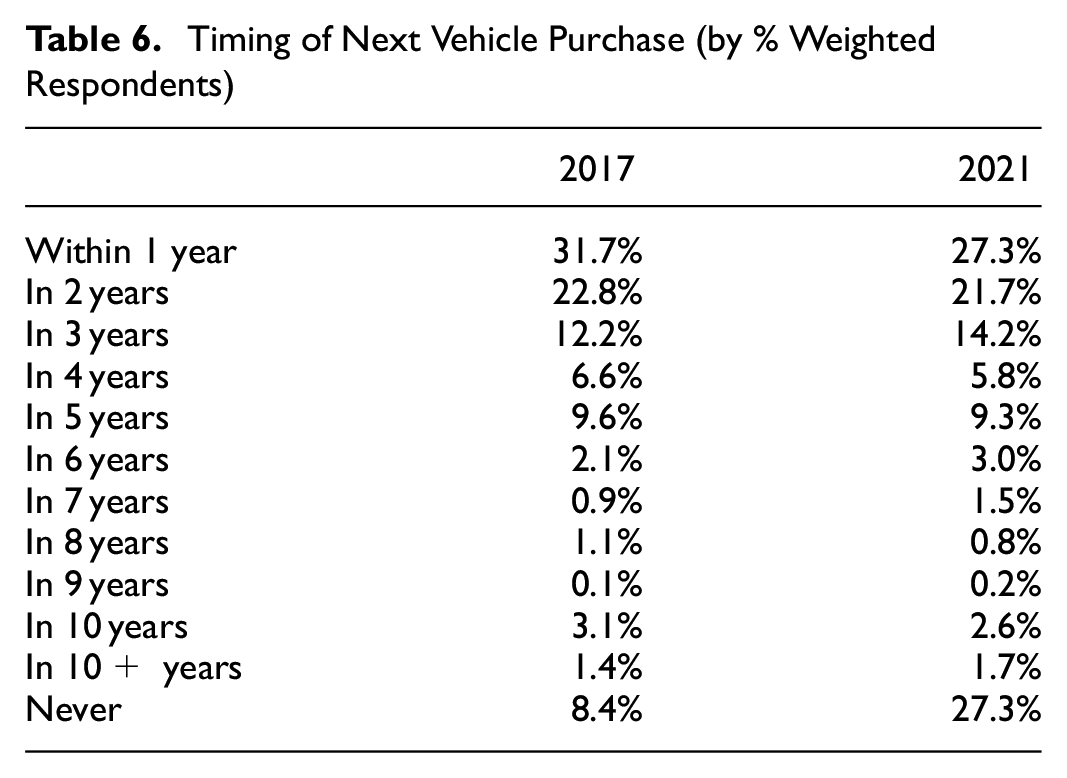
In addition to trip-level questions, a purchase decision was asked to assess the WTP for the inclusion of automation technology in the next vehicle purchase (see Table 5). It is interesting to note that the changes, in this case, are reversed from those in the case of trips: respondents are now less willing to pay for automation. One of the drivers of this change appears to be a lower vehicle purchase expectation among respondents. When asked at an earlier point in the survey about the timing of their next vehicle purchase, 27.3% of 2021 respondents (with weighting) indicated they do not plan to purchase another vehicle, whereas only 8.4% of respondents indicated such a preference in 2017 (see Table 6). The reason for this change is unclear. It may be partially attributed to younger generations not planning to purchase vehicles. Another potential reason may be a response to the inclusion of ride-sharing services in the survey prompting respondents to consider shared mobility alternatives. A final drive may be COVID-19-induced economic uncertainty, similar to the results for WTP discussed above.
Willingness-To-Pay/Lease A Premium for Self-Driving Technology
Timing of Next Vehicle Purchase (by % Weighted Respondents)
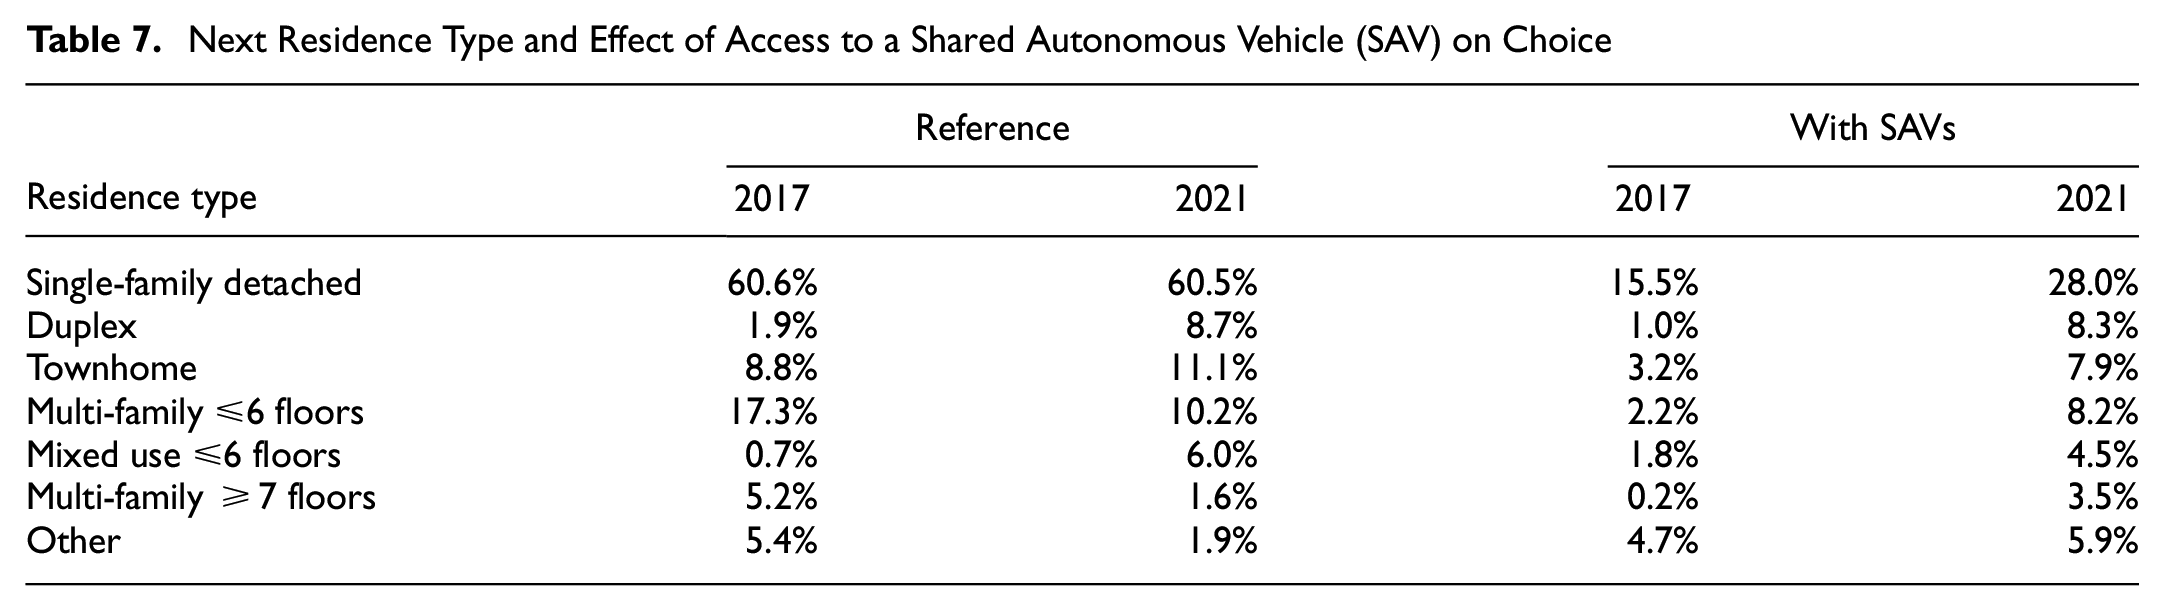
Residential location choice has a strong connection with travel patterns ( 28 ). As such, residence preferences are important considerations for forecasting the future of transportation. Related is the expectation that AVs may encourage low-density development and single-family detached homes as lower values of travel time disincentivize density ( 29 , 30 ). Comparison is again made with 2017 results, with similar patterns summarized in Table 7. In both surveys, respondents were prompted to consider whether they would reconsider their choice in the presence of shared AVs. The 2021 respondents showed a much stronger shift toward single-family detached homes specifically, and away from their previous choice in general. This change suggests that residence choice is an area requiring careful attention as new transportation technologies are introduced to the market. Simulation studies find that shared AVs, without dynamic trip matching, will increase vehicle miles traveled in the absence of mitigating policy (e.g., road pricing) ( 31 ).
Next Residence Type and Effect of Access to a Shared Autonomous Vehicle (SAV) on Choice
Model Analysis
The final component of the analysis is a series of econometric models, which help to draw out demographic attributes contributing to preferences. Results are first presented from a series of ordered probit models for WTP for various technologies. Then, detailed results are presented from two models. The first detailed analysis examines the vehicle purchase decision using a simple multinomial logit choice model. The WTP for vehicle automation is then examined using a hurdle regression model. All models incorporate population weights in the estimation.
Summary statistics for variables included in the models are given in Table 8. Current truck owners comprise 12.4% of weighted survey respondents. The variable “Human-driven setting” is an indicator variable in the WTP for self-driving technology for whether a human-driven option was available in the question text. Incomes are converted from ordinal levels to numerical values using lower bounds for each income range. Purchase price is based on literature values, as outlined above. Zonal variables are taken from the EPA Smart Location database. The jobs accessibility measure uses a gravity formulation to discount distant job locations, with additional details available in the Smart Location documentation ( 15 ). Zonal variables are assumed to correspond to individual observations and not require model adjustment for spatial panel effects. This assumption is deemed reasonable given the geographic extent of census block groups relative to the study area (i.e., the U.S.) and our access to detailed home location data at the 9-digit zipcode level.
Population-Weighted Explanatory Variable Summary Statistics (Nobs = 711)
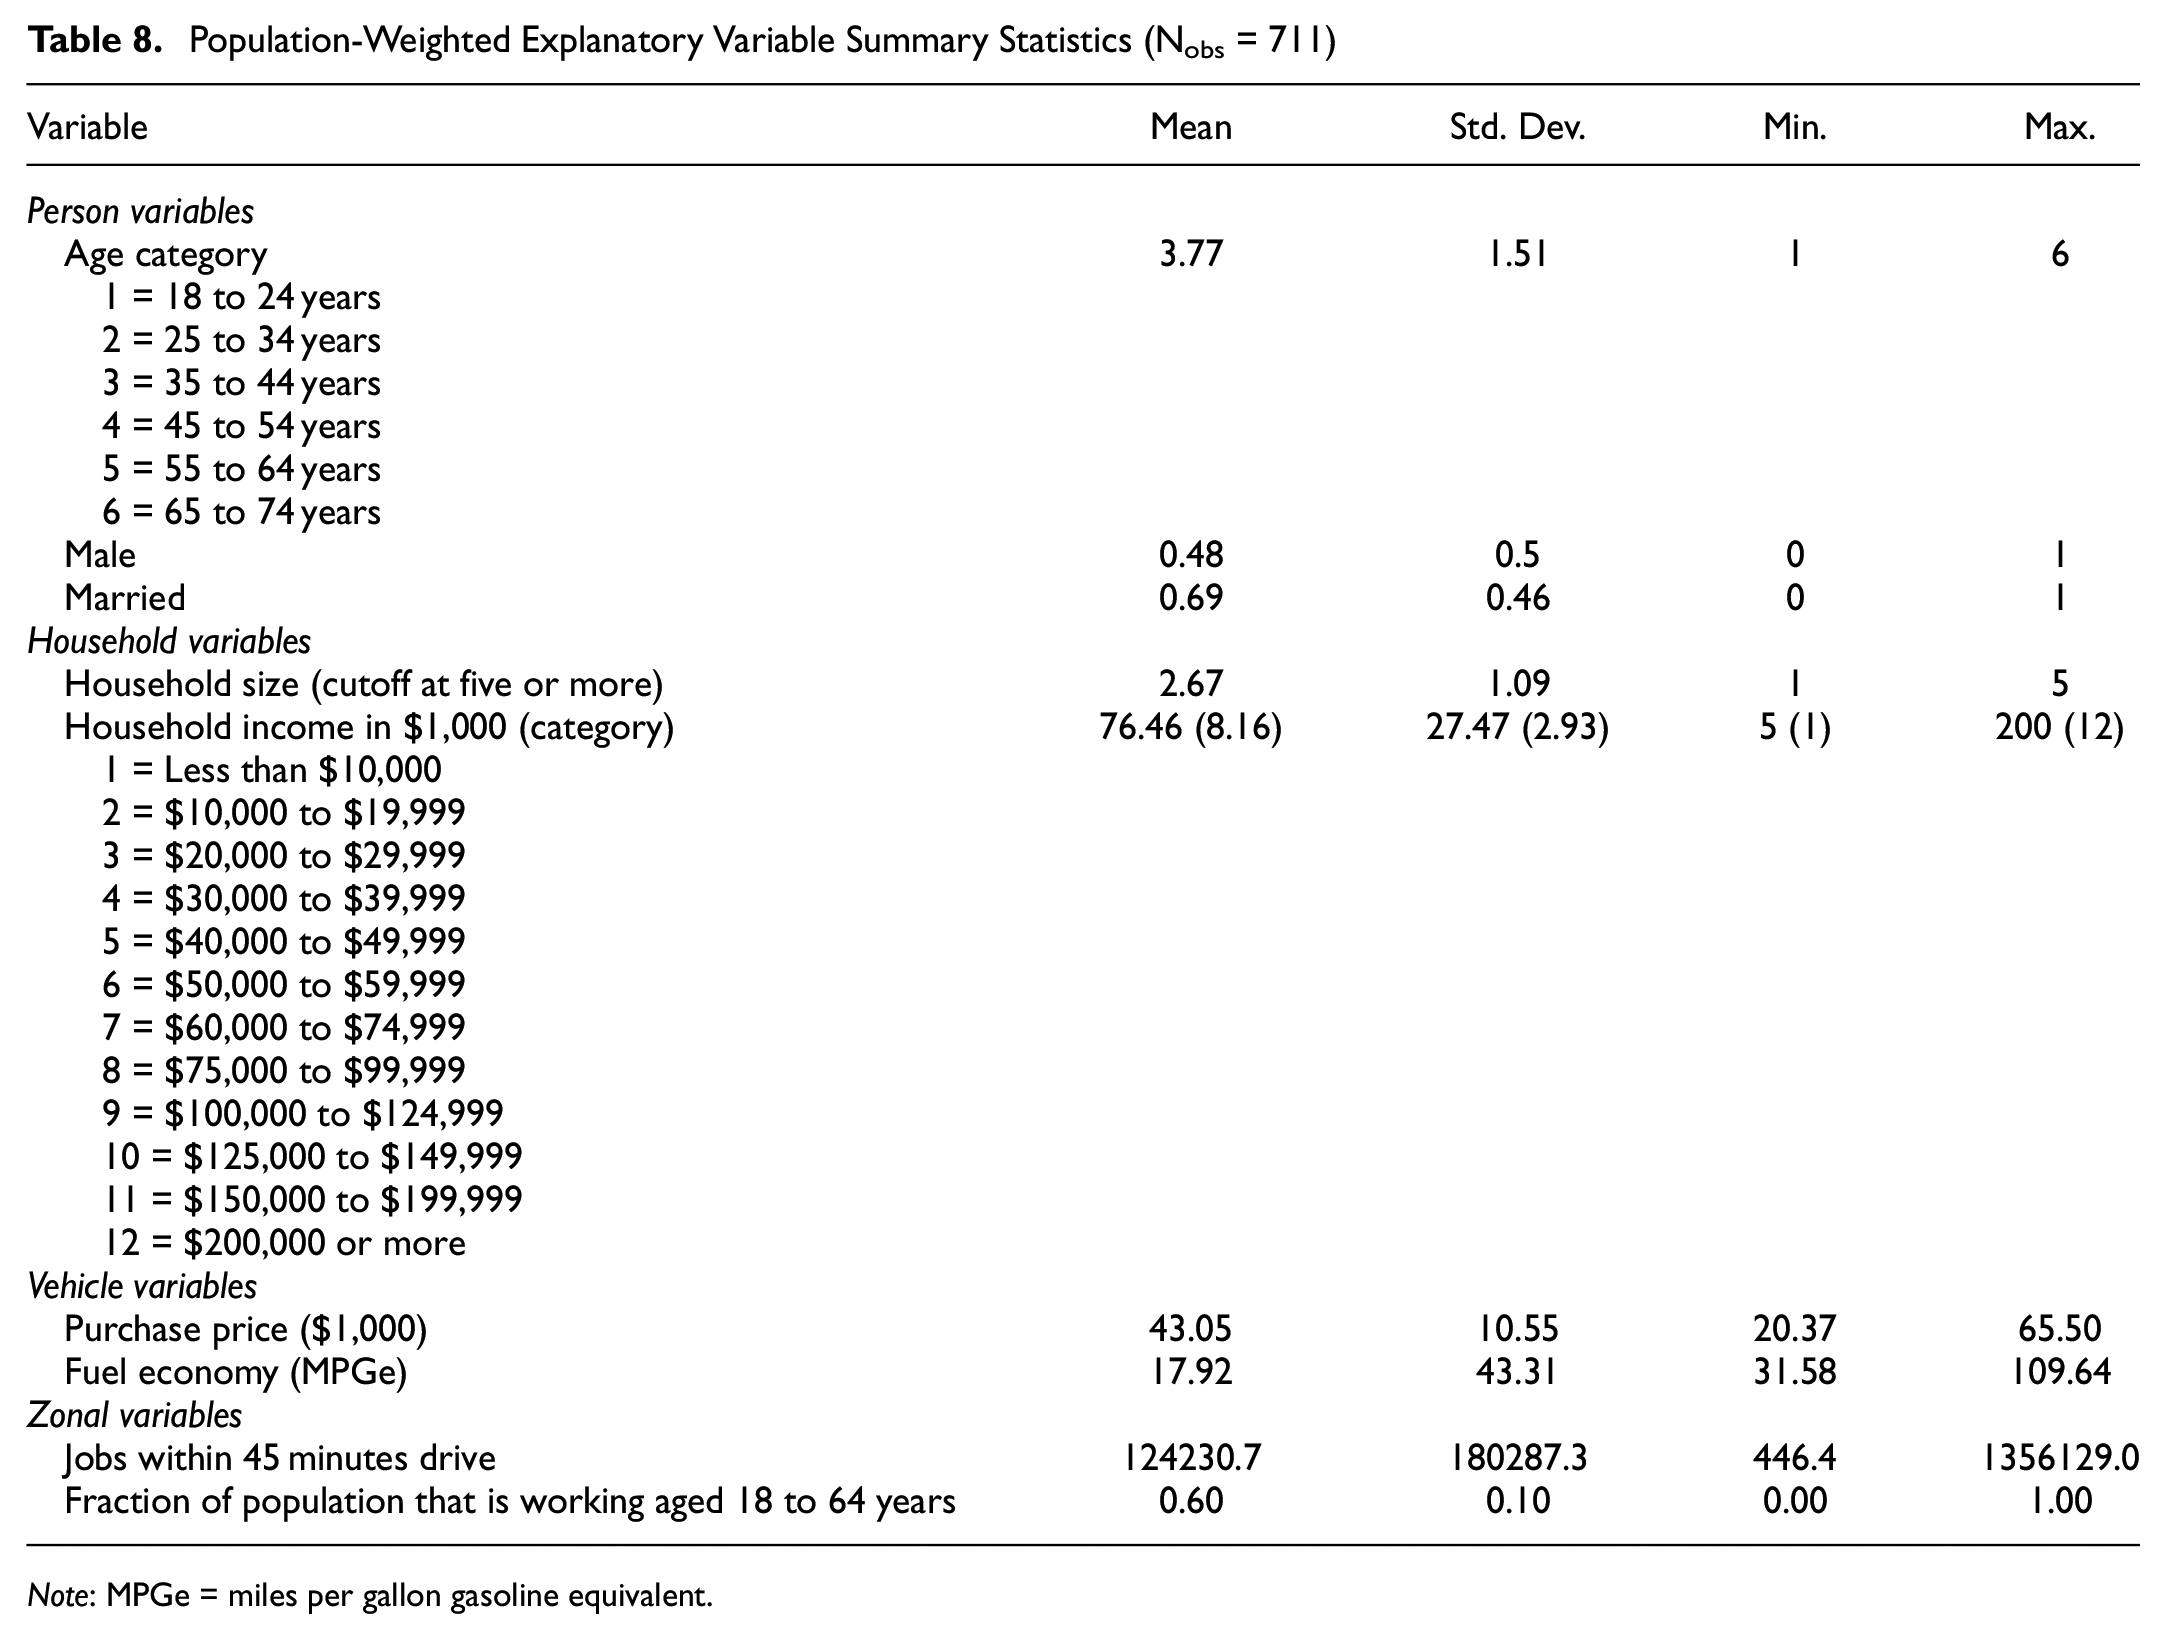
Note: MPGe = miles per gallon gasoline equivalent.
WTP for Transportation Technologies
Many models were estimated for WTP. In the interest of brevity, only the highlights are provided here. For many technologies, single individuals are likely to be early adopters: personal rapid transit, drone delivery, and vehicle-to-pedestrian alert systems. Women show a higher WTP than men for shared parking, automated parking in parkades, remote vehicle control, and VTOL. Those with children are less willing to pay for remote vehicle control, perhaps because they have concerns about its safety for their children. Interestingly, those with children are not willing to pay for vehicle-to-pedestrian alert systems. There may be concerns about children becoming less cautious in the presence of such systems, but it is difficult to draw a definitive conclusion without further questioning of respondents. Intermittent bus lanes, which dynamically allow personal vehicles to use the lane, are favored among those closer to central business districts (CBDs) but also among those further from public transit and with more household vehicles. Such households likely perceive a benefit as they are drivers, lack good access to public transit from their home, but likely interact with transit vehicles because of their proximity to the CBD. Finally, model results indicate that those with multiple vehicles and children are more willing to pay for vehicle platooning. These households may see a benefit from using the technology when traveling as a family in multiple vehicles.
Next Vehicle Purchase
The next vehicle purchase model distinguishes between sixteen alternatives formed from the combination of vehicle class (coupe, sedan, SUV, and truck) and powertrain (ICE, BEV, HEV, and PHEV). Results are summarized in Table 9.
Next Vehicle Purchase Choice (MNL Specification)
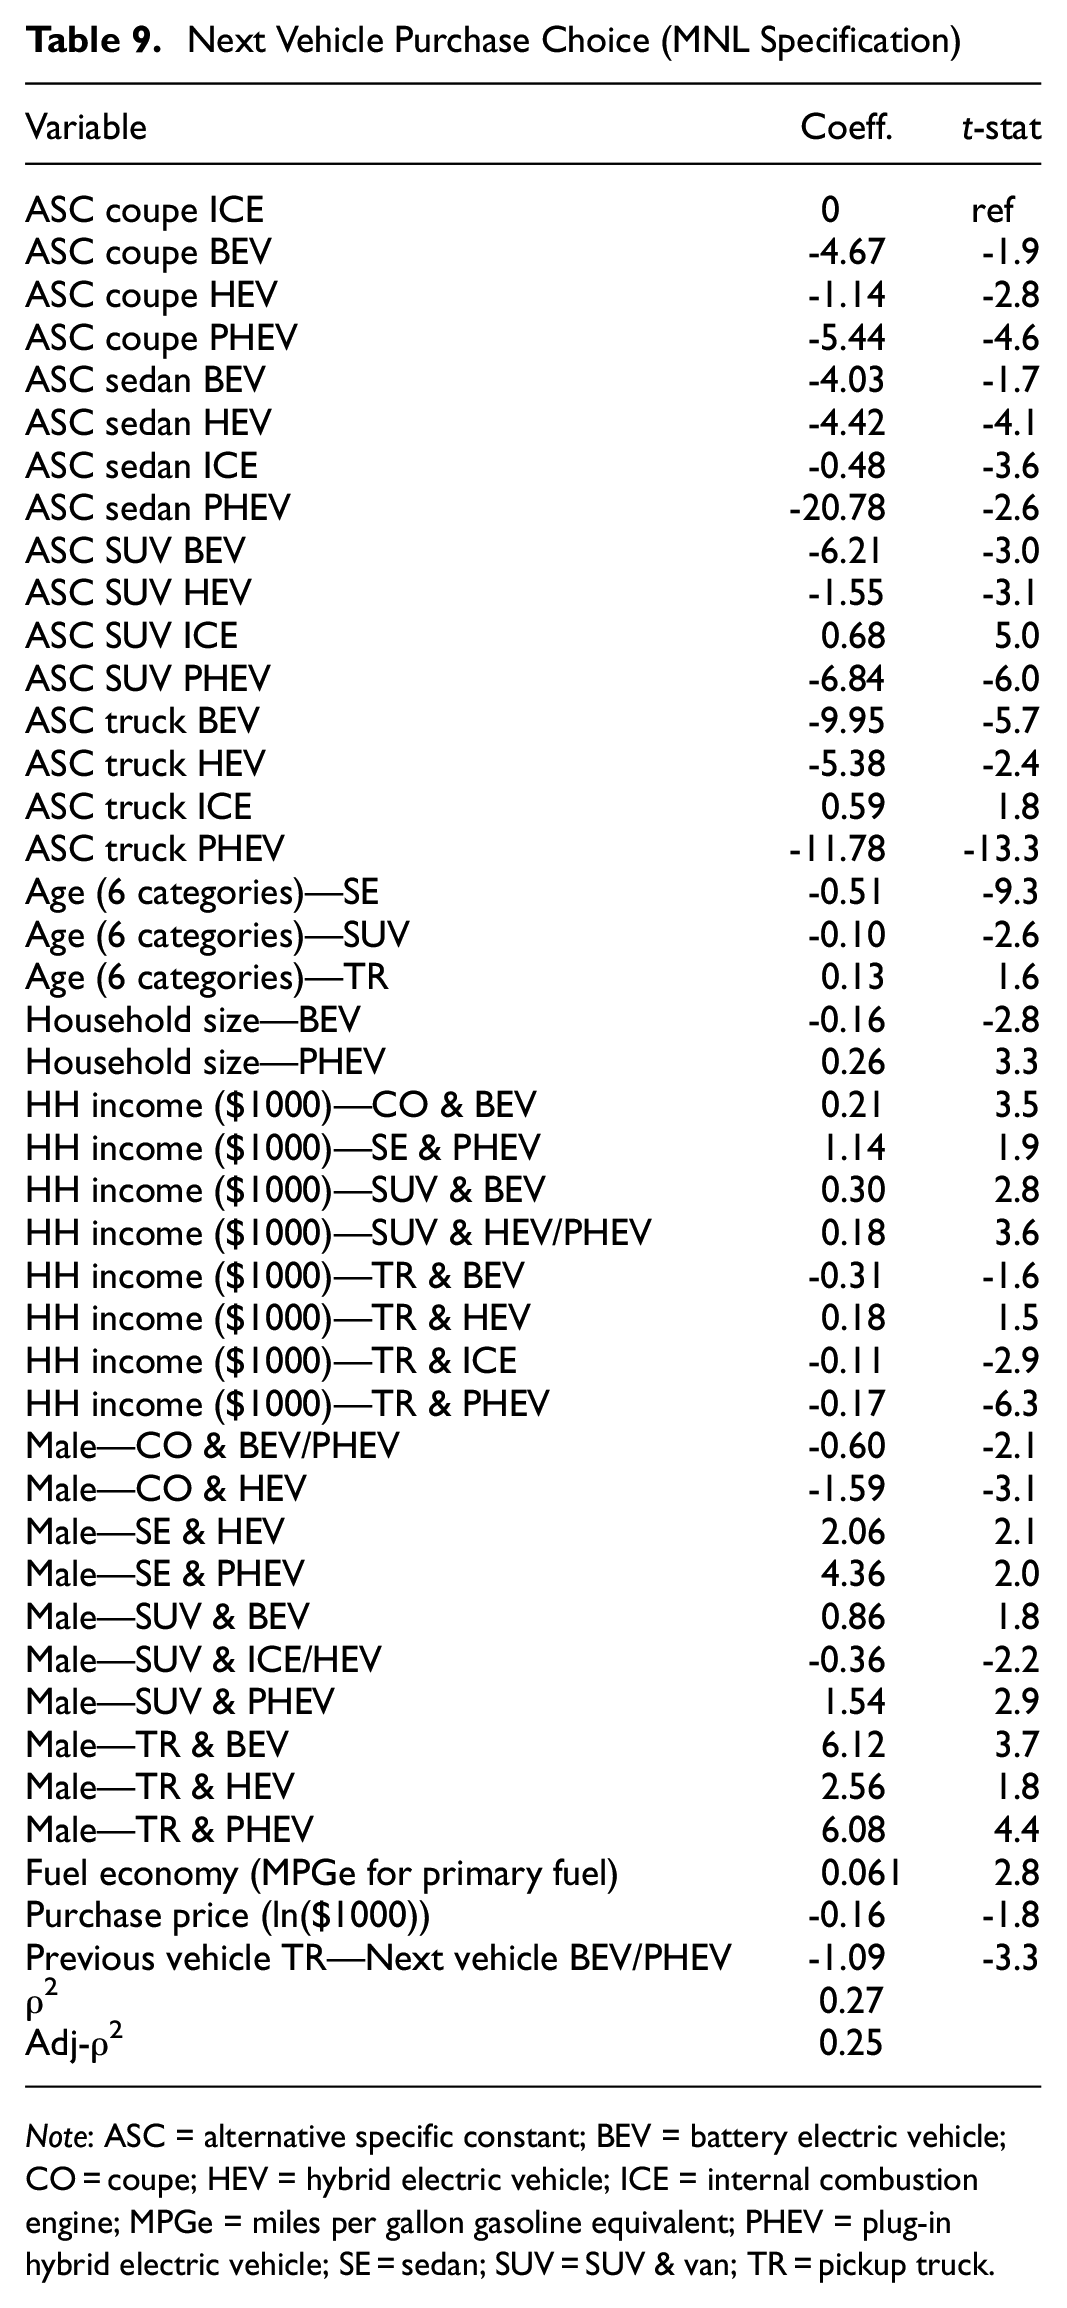
Note: ASC = alternative specific constant; BEV = battery electric vehicle; CO = coupe; HEV = hybrid electric vehicle; ICE = internal combustion engine; MPGe = miles per gallon gasoline equivalent; PHEV = plug-in hybrid electric vehicle; SE = sedan; SUV = SUV & van; TR = pickup truck.
The coupe ICE alternative is taken as the reference when interacting sociodemographic variables. Higher-income households are more likely to choose EVs (i.e., BEV and PHEV). It was also found that males tend to purchase trucks and PEVs. Larger households appear to prefer PHEVs over BEVs. An inertia term is included in the model to test whether owners of SUVs and trucks are more likely to prefer ICE and HEV powertrains for their next vehicle. No significant effect was found for current SUV owners, but it appears that truck owners are less willing to make the switch to PEVs than other respondents. Both education and race variables were tested but no significant effects were found for either vehicle class or powertrain preference.
Several other models (nested logit, cross nested logit, and latent class with feedback) were explored but none provided a significant statistical improvement over the reference MNL specification.
Practical significance values (i.e., the effect of a standard deviation change in the explanatory variable) are presented in Table 10. BEV alternatives show the highest fuel economy sensitivity. A one standard deviation (9%) increase in the MPG equivalent (MPGe) for a battery electric truck is associated with a 55% increase in the probability of choosing it as the next vehicle. Fuel economy is likely acting as a surrogate for range here. The lack of an explicit presentation of vehicle attributes to respondents likely contributes to the low price sensitivity.
Practical Significance of Variables in Next Vehicle Choice Model
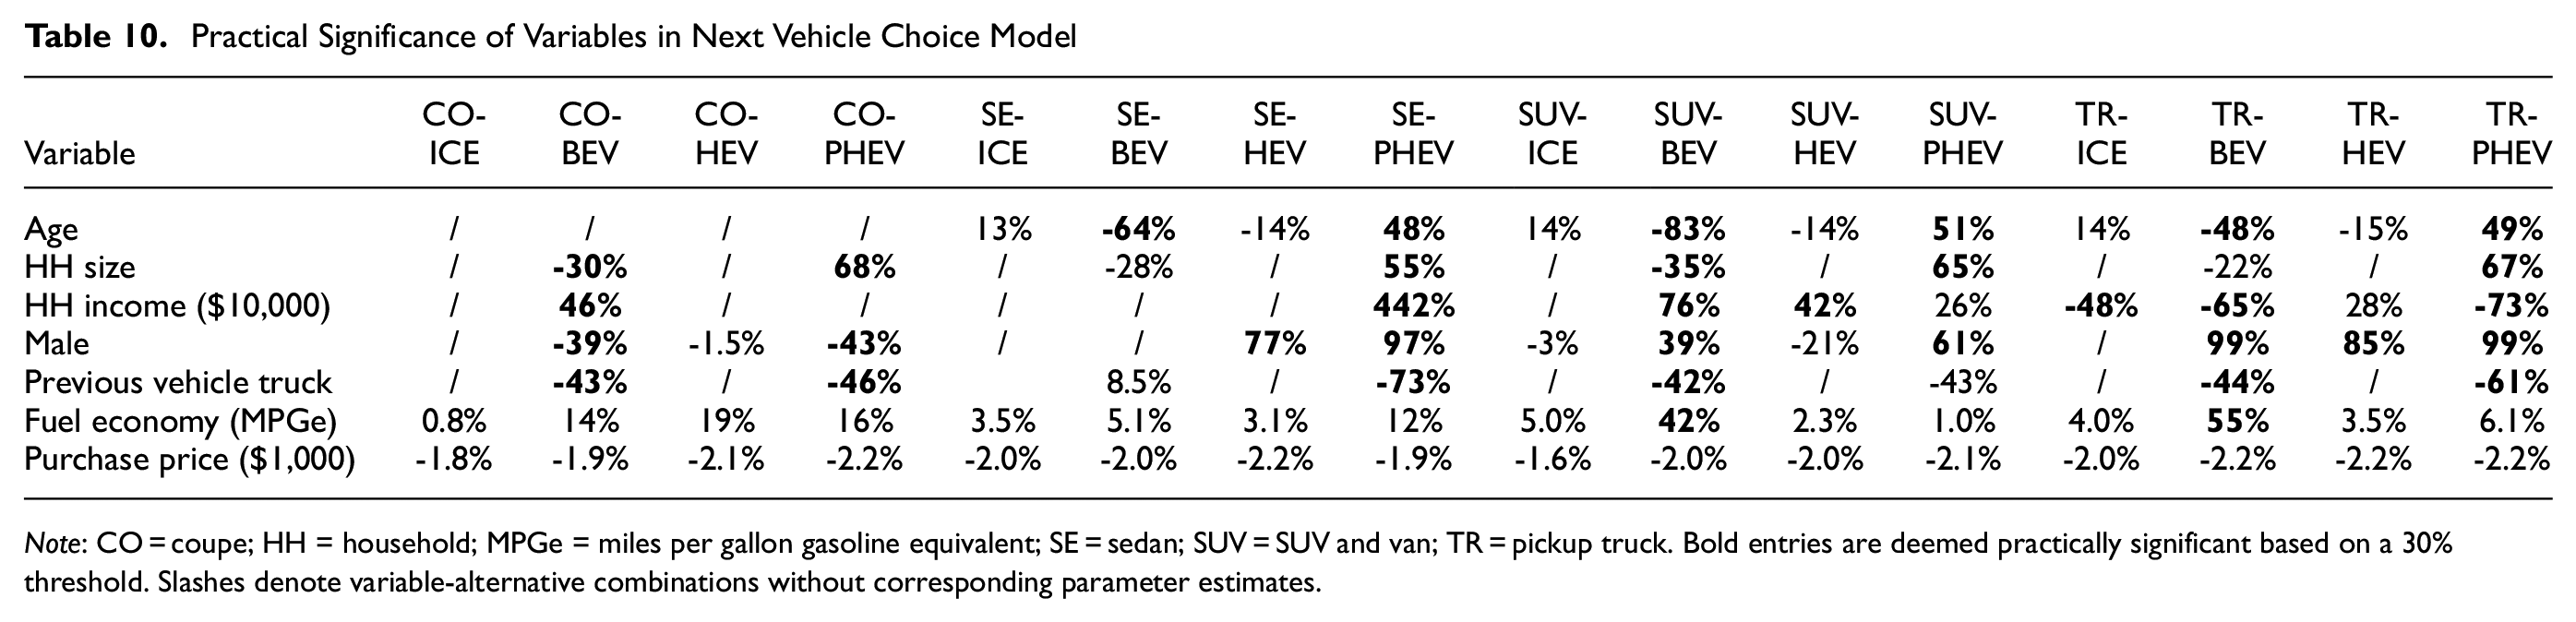
Note: CO = coupe; HH = household; MPGe = miles per gallon gasoline equivalent; SE = sedan; SUV = SUV and van; TR = pickup truck. Bold entries are deemed practically significant based on a 30% threshold. Slashes denote variable-alternative combinations without corresponding parameter estimates.
Willingness to Pay for Self-driving Vehicles
The survey included two questions about WTP for vehicle automation: an option that allowed human intervention and a fully autonomous option. Several model structures were explored to represent this process. A double hurdle model fit the use case. This model can represent that many respondents (about 23%) were not willing to pay an additional cost for automation beyond a traditional vehicle. The double hurdle model captures two drivers of zero consumption: a selection process (whether to buy an AV) and a desired consumption process (the person may be willing to buy an AV but has a negative WTP) ( 32 ). The model is essentially a joint Tobit/probit model. Results are given in Table 11. More formally, the model is provided in Equations 1 and 2 below ( 33 ).
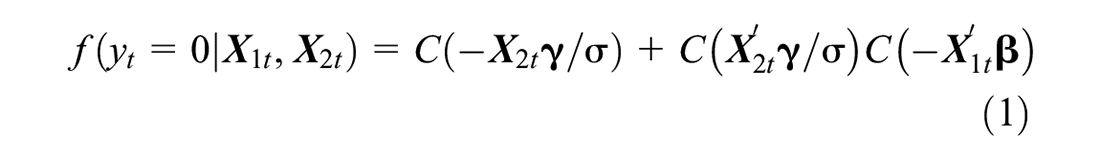
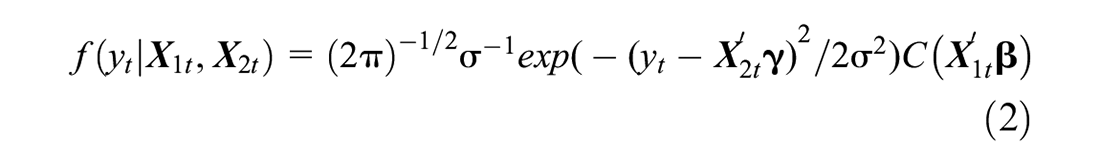
where

where
Double Hurdle Regression for WTP for Vehicle Automation
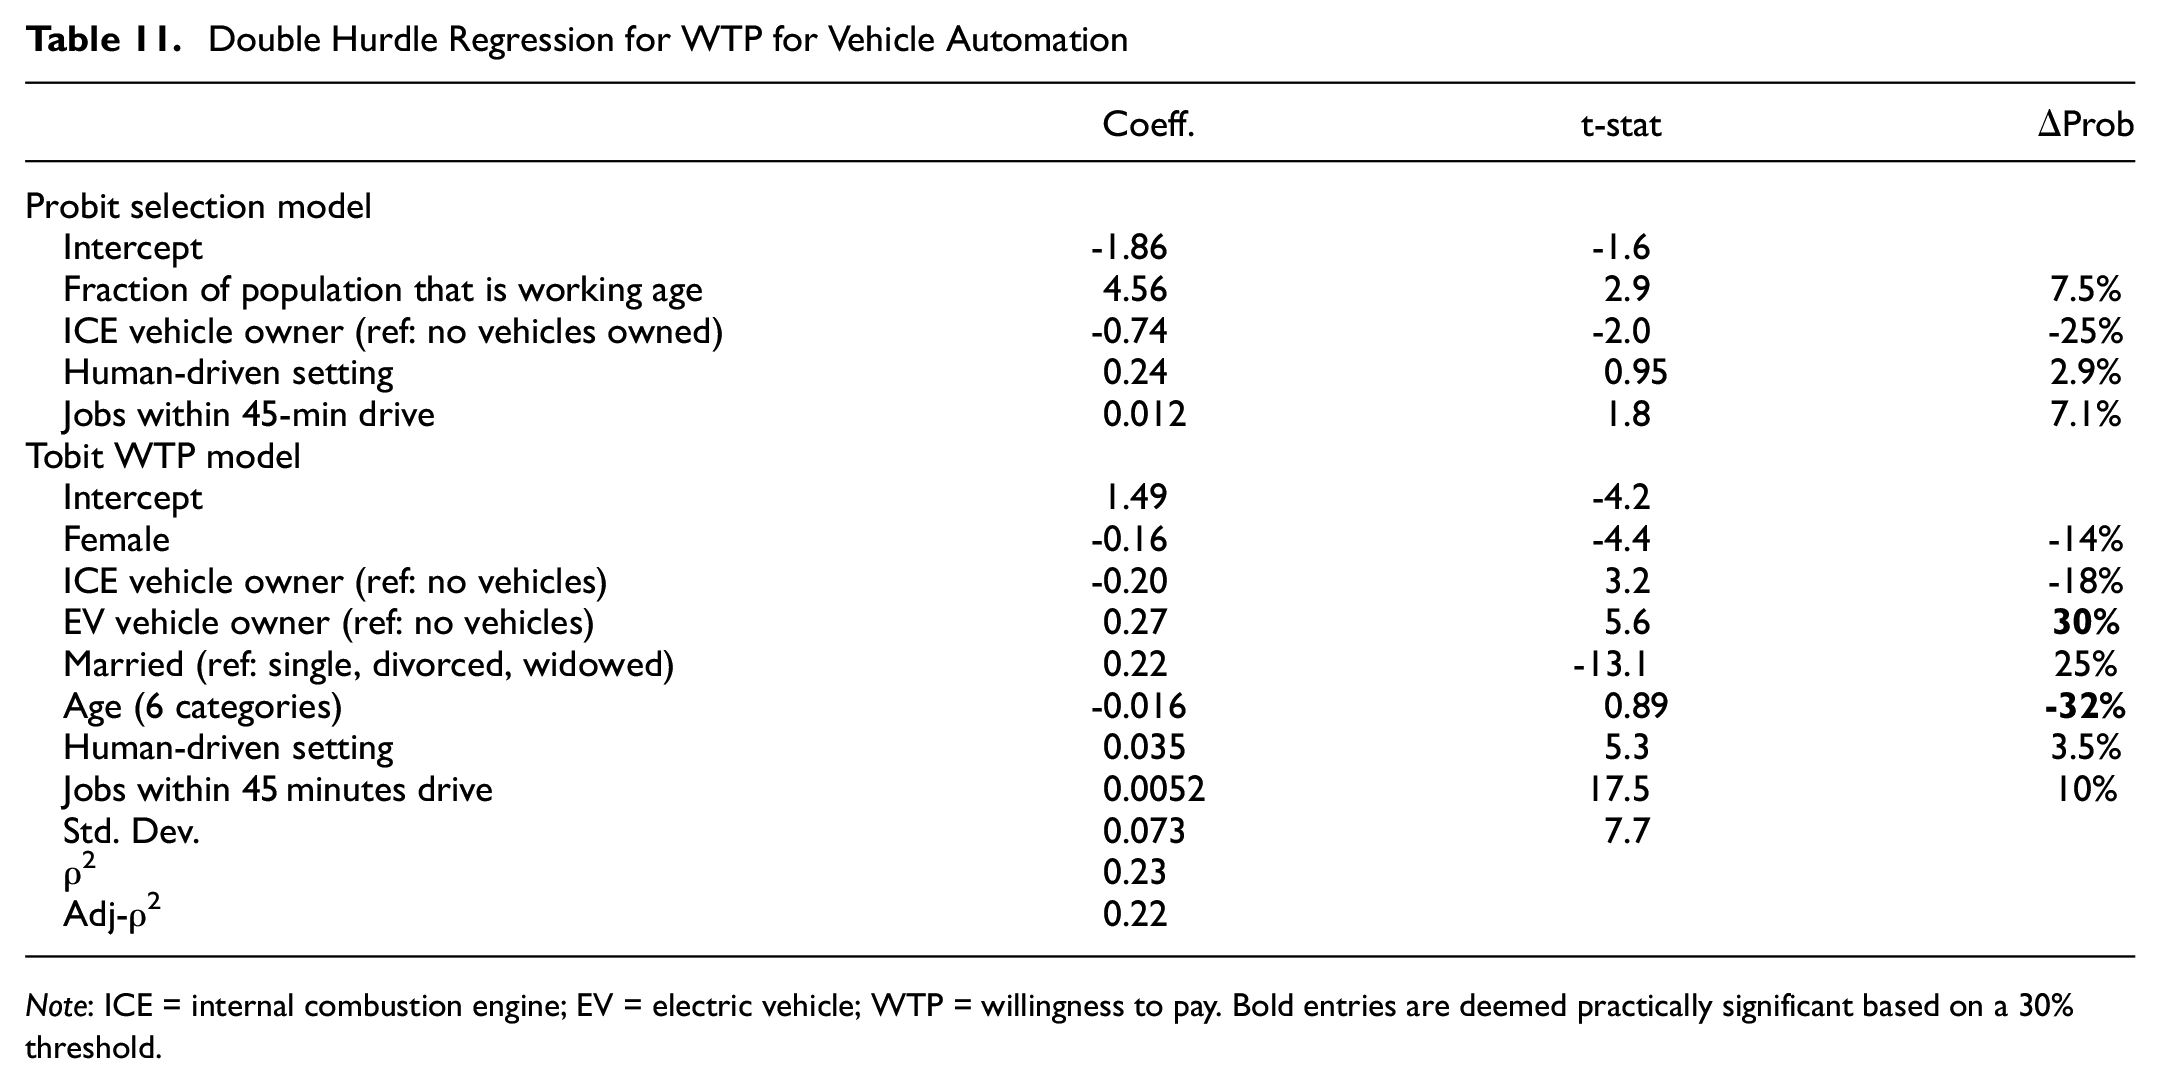
Note: ICE = internal combustion engine; EV = electric vehicle; WTP = willingness to pay. Bold entries are deemed practically significant based on a 30% threshold.
From an economic satiation perspective, one would assume that more automation should be preferable to less automation. However, results (see Table 10) suggest that human-driven vehicles are slightly preferred by respondents. Perhaps, respondents fear giving up full control and the option of human intervention is appealing to them. Women tend to be willing to pay less than men for automation, which fits typical associations between technology adoption and risk-taking by gender ( 34 , 35 ). Results also suggest generic technology adoption and income effects, with current BEV owners (often higher income) having higher WTP than ICE vehicle owners. WTP also tends to decrease with age, matching the expectation of younger individuals being more willing to adopt new technologies. A related effect in intermediate model specifications was a negative sign on income parameters. Theory suggests that WTP should increase with income. Given that income tends to correlate with increasing age, it seems that the age-technology adoption interaction was biasing this parameter sign.
Conclusions
This survey provides a range of insights and opportunities for analysis of emerging and future transportation technologies. Results were compared with a 2017 survey containing many of the same questions, which provided useful insights into the changes in preferences as these technologies evolve and enter the market. There is an increased interest in PEV relative to 2017 (up by about 18% percentage points). However, current pickup truck owners remain reluctant to make the switch. The development of BEV pickup trucks by Ford, Rivian, and other OEMs ( 36 , 37 ) should help alleviate concerns about the performance of BEV trucks (e.g., towing capacity). Across the population, there remains significant concern about vehicle charging and range. There is a need to examine these concerns in more depth and how they might change in response to the National Electric Vehicle Infrastructure (NEVI) formula funding ( 38 ). Public information campaigns and opportunities to test drive PEVs may help alleviate some concerns. This exploratory study spurred follow-up research focus on the electric pickup truck market and whether there are specific vehicle and consumer market features that may affect adoption.
The preference for vehicle autonomation depends on the use case. Automation of driving tasks tends to be preferred by residents of low-density, car-dependent areas where long commutes are common. These individuals see a benefit in reducing, or eliminating, the driving task so they can perform other activities while traveling. In contrast, automated parking technologies tend to be favored by those living in denser communities, who are more likely to use parkades. Such individuals would reduce their monthly expenses with automated parking because it reduces the required space per vehicle and therefore the cost of parking infrastructure in high land value areas.
Other technologies require additional analysis to draw strong conclusions. Intermittent bus lanes are favored by those living in high population density areas, but not those in areas with a high percent of zero-vehicle households. This result suggests the presence of factors not captured in the survey. The WTP for drone delivery shows a strong association with marital status. A targeted set of questions would help to identify preferences for this technology.
Remote work is a current topic of interest to the transportation community, among other stakeholders. Survey results indicate a stronger preference for remote work among younger workers. However, other recent studies have found the opposite preference. Confounding factors of occupation variability between age cohorts likely contribute to these unclear results.
This paper summarizes only a small subset of the questions included in the survey. The wide scope of the survey provides an opportunity to examine demographic variations across technologies; for example, comparing the market for AVs with VTOL, or whether those who are willing to share parking share commonalities with those willing to share rides. The speculative nature of many of the technologies examined in the survey means that caution is required as to the interpretation of results. Tracking preferences as these technologies evolve and enter the market will be an important avenue for future research.
Footnotes
Acknowledgements
Thank you to Drs. Ken Laberteaux and Jean Chu at Toyota for their valuable feedback on the survey and results. The authors thank Jade (Maizy) Jeong for her excellent editing and submission support.
Author Contributions
The authors confirm contribution to the paper as follows: study conception and design: Kai Huang, Jason Hawkins, Kara Kockelman; data collection: Jason Hawkins; analysis and interpretation of results: Jason Hawkins, Kai Huang, Kara Kockelman; draft manuscript preparation: Jason Hawkins, Kai Huang. All authors reviewed the results and approved the final version of the manuscript.
Declaration of Conflicting Interests
The author(s) declared no potential conflicts of interest with respect to the research, authorship, and/or publication of this article.
Funding
The author(s) disclosed receipt of the following financial support for the research, authorship, and/or publication of this article: The authors acknowledge the financial support of the NSF Industry-University Cooperative Research Center for Efficient Vehicles and Sustainable Transportation Systems (EV-STS).
Data Availability Statement
The data that support the findings of this study are not available because of survey respondent confidentiality restrictions.