
Abstract
Pavement performance models that can model consistently well across different pavement types, structures, traffic, and environmental conditions as well as throughout pavements’ lives are essential for the efficient management of transportation infrastructures. However, network pavement performance data are inherently imbalanced, and most pavement performance models are built on algorithms that assume balanced data distribution and equal error cost. As a result, the performance of most pavement performance models may vary for different pavement groups. Considering this, the objective of this study was to evaluate the data imbalance of the network pavement performance data and its effect on the performance of pavement deterioration models. Specifically, the analysis result for the longitudinal cracking model is presented in this paper. The data imbalance of the network pavement performance data mainly arises from two sources: the intrinsic pavement characteristics and pavement life expectancies. The intrinsic data imbalance arises either from the design or the management process, whereas the data imbalance introduced by the pavement life expectancies is primarily the result of the pavement management process. The distribution of the data used in this study exhibits substantial skewness owing to the data imbalance caused by the intrinsic pavement characteristics and life expectancies. The existence of the data imbalance leads to the biased performance of the deterioration models toward pavement classes with more data.
Keywords
Pavement performance models describe changes in pavement conditions over time. As one of the key elements in the pavement management system, pavement performance models are critical for transportation agencies to predict future pavement conditions as well as for the allocation of maintenance and rehabilitation funding ( 1 ). In general, based on the approaches used, pavement performance models can be grouped into four categories: empirical, mechanistic, mechanistic-empirical, and machine learning-based models.
In empirical modeling, pavement performance indicators are related to pavement structural strength, traffic loading, age, and environmental conditions using empirical functions. Empirical pavement performance models cover a variety of mathematical forms and statistical approaches. For example, researchers have investigated the application of linear regression to develop models for the present serviceability index (PSI) ( 2 ), the application of nonlinear incremental models to predict the rutting ( 3 ) and PSI ( 4 ), the application of recurrent or dynamic Markov chain for modeling the pavement crack performance ( 5 ), the application of autoregressive moving average and structural time series models to estimate deterioration of asphalt pavements ( 6 ), and the application of the mixed-effect model for the prediction of pavement deterioration that can account for the correlation between observations on the same pavement section ( 7 ).
Two common challenges in developing empirical pavement performance models are data censoring and unobserved heterogeneity. Data censoring is crucial, especially in cases where the occurrence of a certain event is of interest, such as the initiation of distress and the failure of pavements. The data censoring is usually solved through duration analysis, which models the time before the event of interest happens. Applications of the duration analysis in pavement performance modeling include the analysis of pavement failure data ( 8 , 9 ), the development of a time-based discrete-state stochastic duration model for pavement deterioration ( 10 ), the modeling of the duration of pavement condition at different condition ratings ( 11 ), the prediction of pavement crack initiation ( 12 ), and the evaluation of overlay and replacement performance ( 13 ). The most common techniques to solve the unobserved heterogeneity problem include the fixed effects approach, the random effects approach, and the random coefficients approach. Fixed and random effects approaches capture the unobserved heterogeneity by adjusting the intercept term, whereas the random coefficient approach addresses the unobserved heterogeneity by introducing randomness into the model coefficients ( 14 , 15 ). Examples of using the fixed and random effects approaches can be found in Aguiar-Moya and Prozzi’s research to model the progression of pavement fatigue cracking ( 16 ), and Li et al.’s research evaluating the effectiveness of preventive maintenance treatments on skid resistance ( 17 ). In relation to introducing randomness to the model coefficients, the Bayesian algorithm, which updates the presumed prior distributions of model coefficients with actual data, has been adopted by many researchers in the development of pavement performance models ( 18 – 21 ).
The keys to the mechanistic pavement performance models are the physical responses of the pavement structure under traffic and environmental loadings and how these responses affect the change of the pavement structure, such as the evolution of pavement distress and increase of roughness. Theoretically, if the mechanism of pavement deterioration is captured comprehensively, the pavement performance can be predicted straightforwardly through a mechanistic approach given the properties of the materials, the structure of the pavement, and characteristics of traffic and environmental loadings. However, to date, this is unfeasible because of the complexity of the pavement deterioration process. As a result, although there have been attempts to develop mechanistic pavement performance models, such as the application finite element method, mechanistic pavement performance models that are reliable and efficient still remain conceptual.
The mechanistic-empirical models take the mechanistic responses of the pavement to predict the deterioration of pavement conditions. In general, the mechanistic-empirical models consist of two steps: in the first step, based on the properties of materials, the structure of the pavement, and characteristics of the environment and traffic, the strain, stress, and deflection responses of the pavement are obtained. Then, in the second step, empirical models are used to capture the change in pavement condition based on the relation between the mechanistic responses of the pavement and pavement performance. One of the most successful mechanistic-empirical pavement performance models is the Mechanistic-Empirical Pavement Design Guide (MEPDG) that has been compiled into the AASHTOWare ME Pavement Design ( 22 ). As a milestone in pushing for mechanistic-empirical pavement design, since its publication in 2004, it has gained widespread attention from transportation agencies. As of 2021, seventeen states in the U.S. have fully or partially adopted the MEPDG as the primary design method, and twenty-seven others have plans to implement the MEPDG in the future ( 23 ).
Machine learning also covers a variety of techniques, including techniques that have been used in conventional statistical learning, such as linear and nonlinear regression, as well as some more advanced techniques, such as artificial neural networks and support vector machines. Machine learning consists of three types of approaches, including (i) supervised learning, (ii) unsupervised learning, and (iii) reinforcement learning ( 24 ). Because of the characteristics of the pavement performance data, most machine learning-based pavement performance models are developed using supervised learning techniques. For example, using artificial neural networks, Terzi ( 25 ) and Kargah-Ostadi et al. ( 26 ) developed performance models for the PSI and pavement roughness (international roughness index, IRI), respectively. Besides neural networks, other techniques, such as the random forest algorithm and the support vector machine algorithms, have also been used to model pavement deterioration ( 1 , 27 ). Researchers have also attempted to exploit the characteristics of different machine learning techniques. Tabatabaee et al. developed a two-stage model, where the support vector classifier was firstly used to group the data into different families, and the prediction of pavement performance was developed using a recurrent neural network algorithm ( 28 ). Fathi et al. proposed a hybrid machine learning method that combines the random forest and artificial neural network for the prediction of alligator cracking ( 29 ).
Given the importance of pavement performance models in pavement management, it is expected that pavement performance models perform consistently well across different pavement types, structures, traffic, and environmental conditions and throughout pavements’ lives. However, most of the current pavement performance models are built on algorithms that assume even data distributions, although the reality is that the pavement performance data, especially at the network level, are inherently imbalanced.
The data imbalance refers to the situation where there are one or multiple classes with significantly greater numbers of observations than the others in a dataset ( 30 , 31 ). The classes that prevail in numbers are called the majority classes, and the classes that are underrepresented in the database are called the minority classes. With the existence of data imbalance, models that assume balanced class distributions and equal error costs could be potentially biased toward the majority classes while producing unfavorable predictions for the minority classes ( 30 , 32 , 33 ). The impact of data imbalance can be found in examples such as fraud detection, where the high percentage of legitimate transactions makes the detection of fraudulent activities challenging; or the diagnosis of a rare disease, where a classifier that only produces negative predictions can have very high overall accuracy, but its probability of misclassifying positive cases as negative would be 100% ( 34 ). However, even though the data imbalance problem has been consistently drawing increasing attention from researchers in recent years ( 31 ), and data imbalance is inevitable in the pavement performance data, research on the data imbalance of pavement performance data and its effect on the performance of pavement deterioration models is still very limited.
Objectives
Accurate pavement performance models are critical in ensuring the efficient management of transportation infrastructures. However, because of the existence of data imbalance, the developed pavement performance models are likely to be biased toward some pavement groups while underperforming for other groups. In light of this, the objective of this research was to investigate the data imbalance of the network pavement performance data and its effect on the performance of pavement deterioration models. Specifically, the analysis result for the longitudinal cracking model is presented in this paper.
Database
The database used in this study comes from in-service pavement sections at the network level dating from 2002 to 2019, with a total number of 120,236 observations. The variables used for pavement performance model development include the functional class, traffic, pavement type, treatment type, environmental conditions, and pavement age.
Functional Class
Highways pavements in higher functional classes (such as interstate highways) are usually constructed to higher standards and with higher quality materials. Consequently, the functional class was selected in this study as a proxy for the pavement structural properties. Based on the types of functional classes in Texas, in this study, highways were grouped into four categories, including Farm-to-Market (FM), State (SH), National (US), and Interstate highways (IH).
Traffic
The traffic was accounted for by the 20 years projected equivalent single axle loads (ESALs). The average 20 years projected ESALs for each pavement section were firstly computed to keep the traffic characteristic consistent across the analysis period; then, based on the quartiles of the data, three thresholds (i.e., 200,000; 750,000 and 3,000,000) were used to divide traffic into four categories: low, medium, high, and heavy.
Pavement Type
Flexible pavements were divided into two categories based on the thickness: pavements with an asphalt layer thickness of more than 2.5 in. are referred to as thick asphalt concrete pavements (thick ACP); surface treatments and pavements with a thickness of less than 2.5 in. are classified as thin ACP.
Treatment Type
In Texas, based on the work intensity, maintenance and rehabilitation options are categorized into five groups: preventive maintenance (PM), light rehabilitation (LR), medium rehabilitation (MR), heavy rehabilitation (HR), and do nothing (DN). According to the work involved and project cost, it is expected that pavement sections receiving HR will perform better than pavements receiving MR, LR, PM, and DN, in this particular order.
Environmental Conditions
The climate information was obtained from National Oceanic and Atmospheric Administration (NOAA) database. From the NOAA database, the 30 years normal annual average temperature and precipitation were selected as representatives of the climate. After acquiring the temperature and precipitation statistics for each county, thresholds of 61.25 and 70 degrees Fahrenheit for temperature, 16 and 38 in. for annual precipitation were used to group counties into different climate zones, which resulted in a climate map with five zones.
The distributions of temperature and precipitation along with the boundaries of different climate zones are depicted in Figure 1. As shown, in general, the temperature increases from north to south, whereas the precipitation increases from west to east. These climate zones are reasonable and capture very well the environmental conditions encountered in Texas.
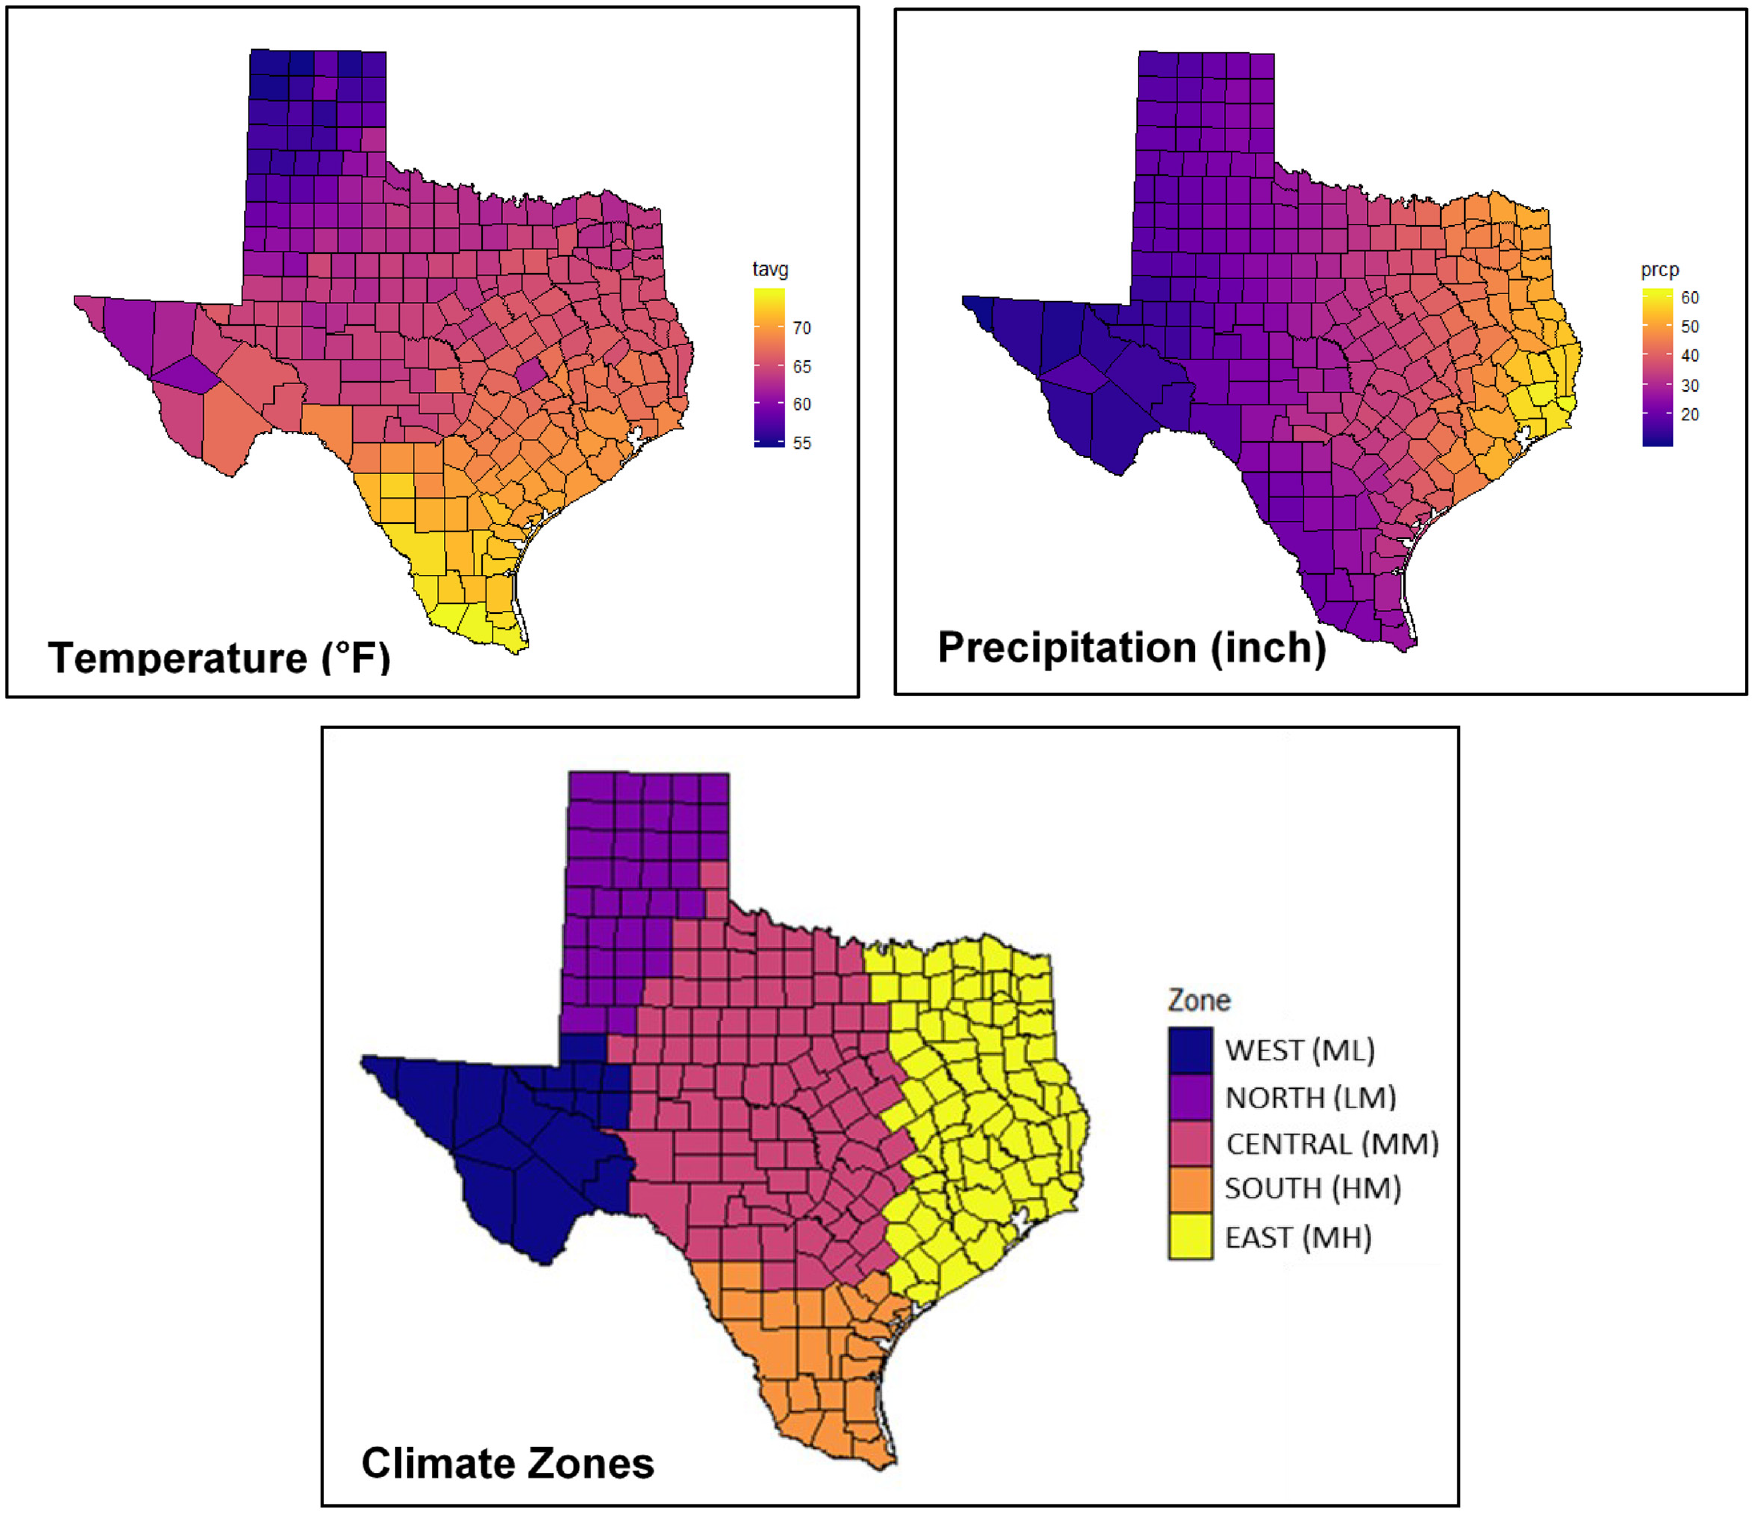
Climate distribution and climate zones.
Pavement Age
Pavement age was the main variable used to capture the effect of pavement deterioration with time, not only because time captures the cumulative damaging effect of traffic and climate, but also because the characteristics of the materials within the pavement structures degrade as a result of aging. In this study, the age of a pavement section was determined as the cumulative number of years that passed from the time of the latest maintenance or rehabilitation treatment.
Pavement Performance Model
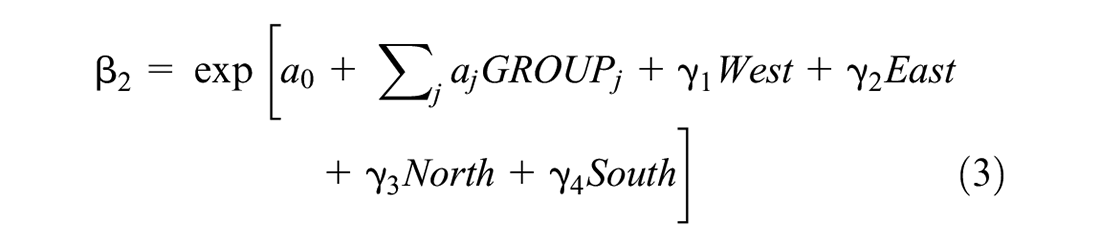
In this study, the longitudinal cracking model is used to illustrate the effect of the data imbalance. The change of the longitudinal cracking over time was modeled using the following S-shaped formulation:

where L is the distress density; Age is the independent variable that accounts for the time passed from the latest maintenance or rehabilitation treatment;
The design of pavement is a systematic decision process that accounts for various factors, including soil, materials, structure, traffic, and environmental conditions. Accordingly, intrinsic correlations can be found among different variables of the pavement performance models. In this study, a preliminary correlation analysis indicated that significant linear correlations were found among the functional class, pavement type, and traffic. Considering this, the analysis data were grouped based on these three variables, resulting in nineteen groups in total with enough data to develop deterioration models; models for the remaining groups without enough data were determined from similar groups in these nineteen groups with enough data. The group variables and the variables related to the environmental conditions were incorporated into β2, whereas the treatment type information was incorporated into β1.

The estimation of the model coefficients was accomplished using the least-squares method. The objective function of the least-squares method is to minimize the sum of squared differences between the predictions and observations:

where
The pavement condition should not improve between consecutive maintenance or rehabilitation treatments.
With everything else being the same, pavements subjected to heavier traffic tend to deteriorate faster than pavements carrying light traffic. As a result, for pavements with similar characteristics, the developed performance models should produce higher distress predictions for heavier traffic levels.
For different types of maintenance and rehabilitation, it is expected that the treatment involving a higher level of work intensity will produce better pavement performance; that is, for pavements with similar characteristics, pavements receiving the heavy rehabilitation (HR) treatment have the lowest distress and slowest deterioration rate followed in order by medium rehabilitation (MR), light rehabilitation (LR), preventive maintenance (PM), and do nothing (DN).
Results and Discussion
Data Imbalance of the Network Pavement Performance Data
In the network pavement performance data, the data imbalance possibly arises from two sources: the intrinsic pavement design characteristics and the life expectancy of the pavements. In this section, the data imbalance was investigated from these two aspects.
Data Imbalance Owing to Intrinsic Pavement Properties
The intrinsic data imbalance of the network pavement performance data is the result of either the design or management process. On one hand, during the design process, systematic considerations of various factors, including soil, materials, structure, traffic, and environmental conditions, would normally favor certain combinations over others. For instance, for an IH with heavy traffic, normally thick ACP designs would prevail over thin pavements. In contrast, in cases of FM highways with low traffic volume, agencies would more likely apply a thin pavement design instead of a thick pavement design. On the other hand, during the pavement management process, transportation agencies seek to spend their limited funding cost-effectively to improve the network pavement performance. With limited maintenance and rehabilitation funding, most transportation agencies attempt to maintain their pavements earlier with PM instead of later with costly rehabilitation. This results in substantially higher numbers of pavement sections treated by PM than rehabilitation. For example, in the TxDOT’s 4-Year Plan ( 35 ), in 2019, the total lane miles of planned PM projects were 26,618, whereas in contrast only 5,486 lane miles were scheduled to receive different levels of rehabilitation treatments.
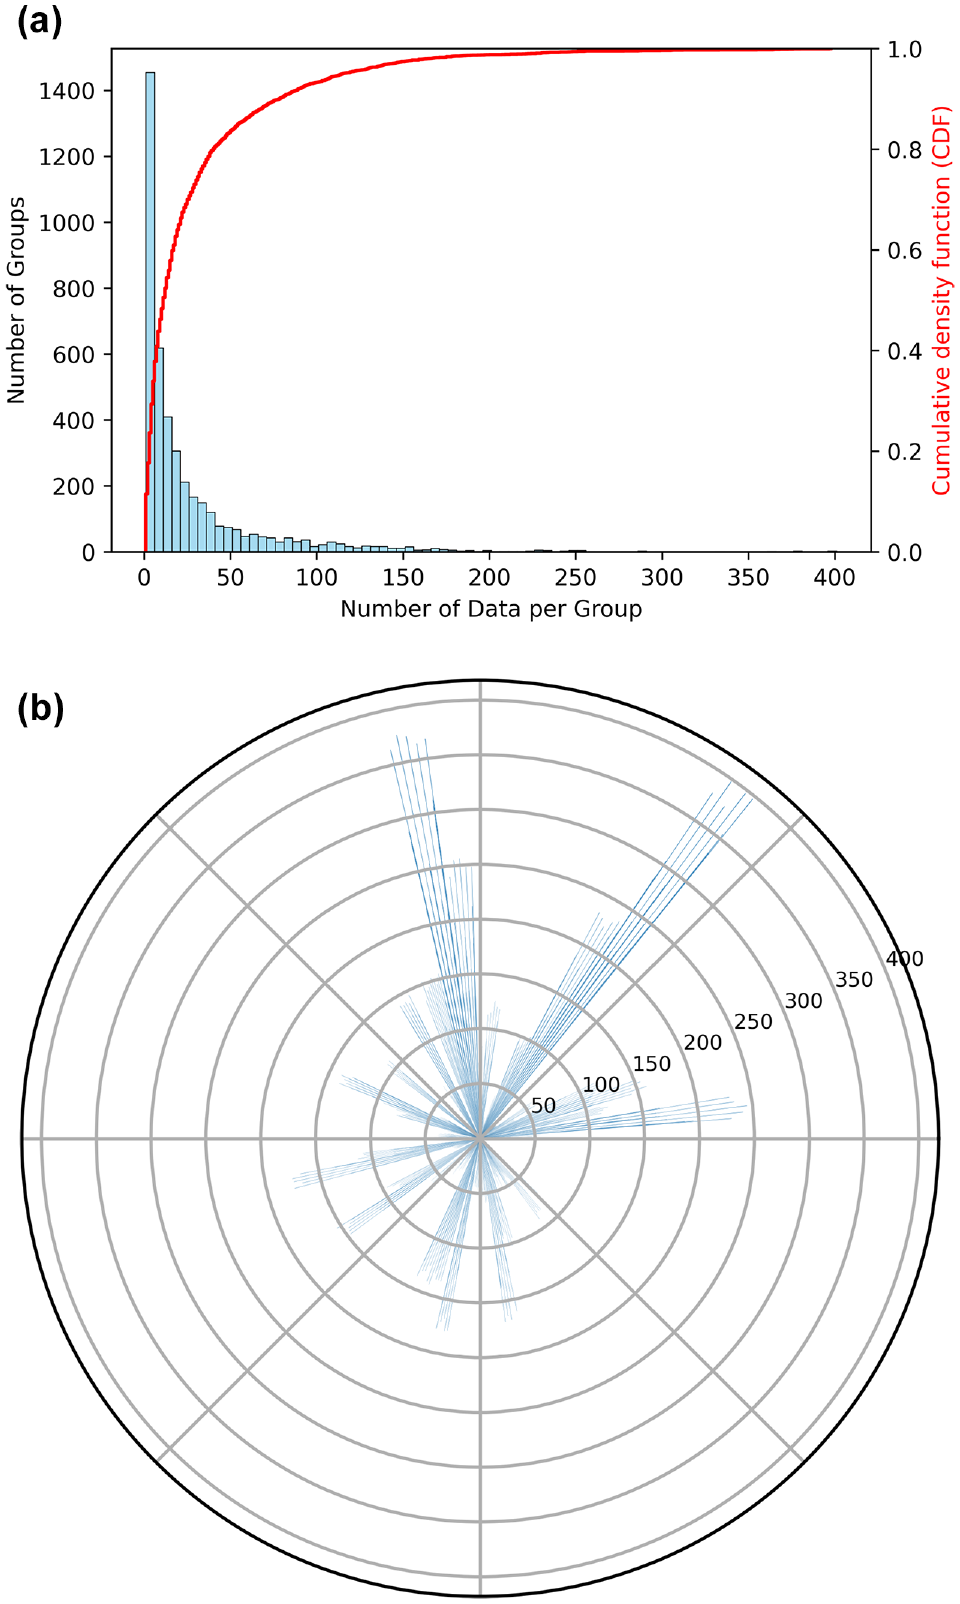
In this study, four highway functional classes, four traffic levels, two pavement types, five climate regions, and five treatment types were considered, which resulted in 800 groups with different intrinsic properties. However, because of the design and management considerations mentioned previously, only 412 groups of them make sense and have data for the analysis. Nevertheless, even in these groups, the data imbalance is still evident. As shown in Figure 2a, the distribution of the number of data points per group is very skewed. Of these 412 groups, there are groups with extremely limited data; for example, more than 100 groups have fewer than fifty data points. This indicates that data imbalance resulting from intrinsic properties exists in the network pavement performance data. The data imbalance resulting from intrinsic properties can also be confirmed by Figure 2b, where the length of each bar represents the number of data points for a specific group. If a dataset has a balanced distribution across different groups, the lengths of the bars should be about the same and form an approximate circle. However, this does not apply to the network pavement performance data in this study.
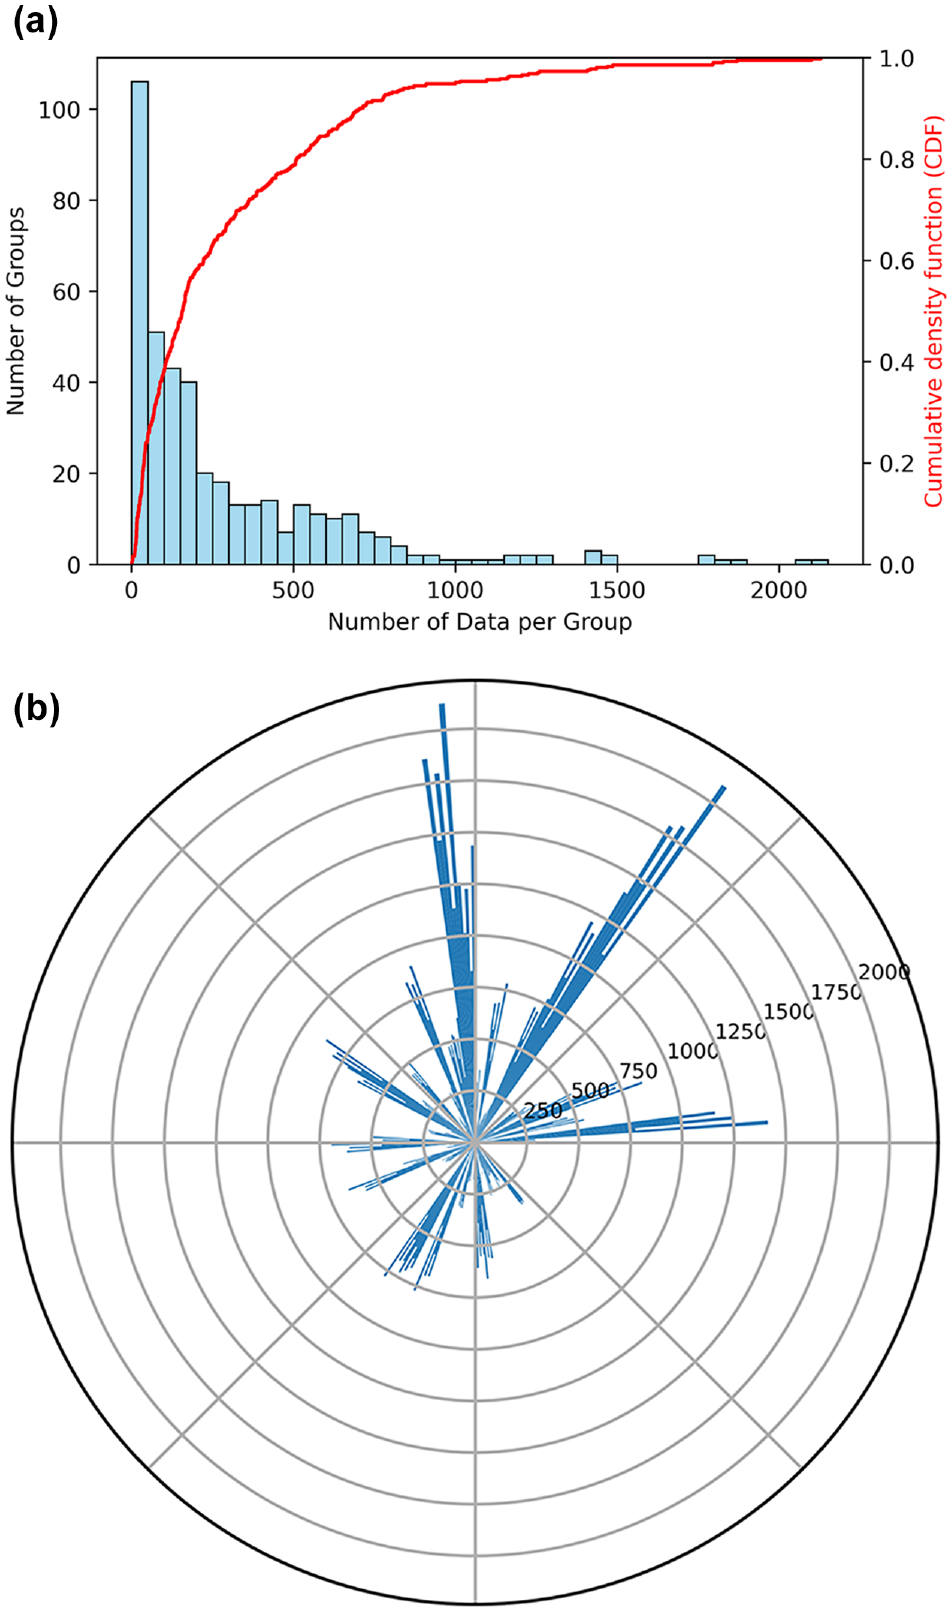
Data imbalance resulting from intrinsic characteristics: (a) distribution of the number of data per group and (b) number of data for different groups.
Data Imbalance Owing to Life Expectancies
The data imbalance caused by pavement life expectancies is also the result of the pavement management process. After initial construction, to maintain good serviceability, pavements must receive subsequent PM and rehabilitation treatments. Depending on the work type, the life expectancy of PM varies from 1.0 to 10 years ( 36 , 37 ), whereas the gaps between consecutive rehabilitations are about 12 years and higher in Texas ( 38 ). As a result, when grouping the network pavement performance data based on the pavement ages, the number of available data points significantly decreases with the increase of pavement age (Figure 3).
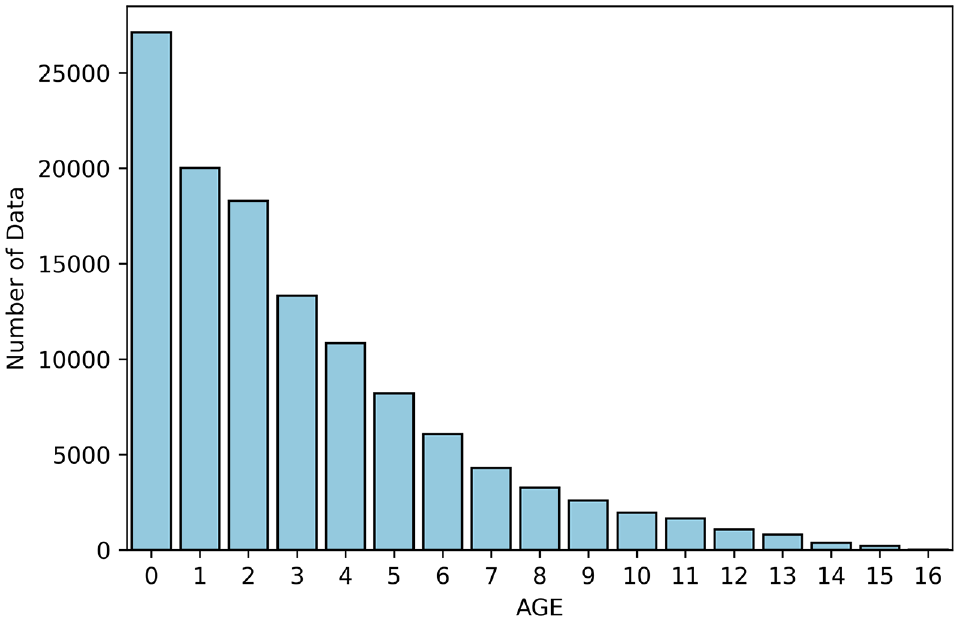
Data imbalance resulting from life expectancy.
Comprehensive Data Imbalance
The distribution of the number of data points for different groups after taking both the intrinsic pavement properties and pavement ages into account comprehensively is presented in Figure 4. As shown, the distribution of the number of data points per group is very skewed, and there are groups with very few data points as well as groups with significantly more data, which validates the comprehensive data imbalance attributable to both the intrinsic pavement properties and pavement life expectancies.
Comprehensive data imbalance: (a) distribution of the number of data per group and (b) number of data for different groups.
Effect of Data Imbalance on Model Performance
In this section, the effect of the data imbalance on the performance of the longitudinal cracking model, which was developed in the pavement performance model section without addressing the data imbalance issue, was analyzed. During the analysis, the data used to develop the longitudinal cracking model was firstly grouped based on common characteristics, and then the root mean squared errors (RMSEs) for each group were computed.
Effect of Data Imbalance Owing to Intrinsic Pavement Characteristics
As the estimated pavement deterioration models always predict zero at age zero, while investigating the effect of the data imbalance on the model performance, those data points corresponding to age zero were not included. The effect of data imbalance introduced by the intrinsic pavement properties on the model performance is presented in Figure 5. The RMSE for each group of pavements with the same properties was plotted against the number of data points per group. Based on the scatter plot, in general, with the increase of the number of data points, the group model error as well as the error range decreases, which indicates that the established deterioration models have better and more consistent performance for pavement classes with more data than pavement classes with fewer data. When inspecting the boxplot, again it is confirmed that the increase of the number of data points results in the decrease in the range of group model errors. However, the decreasing trend of the group model error becomes less noticeable. One possible reason is that some of the underrepresented groups consist of pavements that are predominately new so that both the observations and the predictions are relatively small, resulting in small RMSEs.
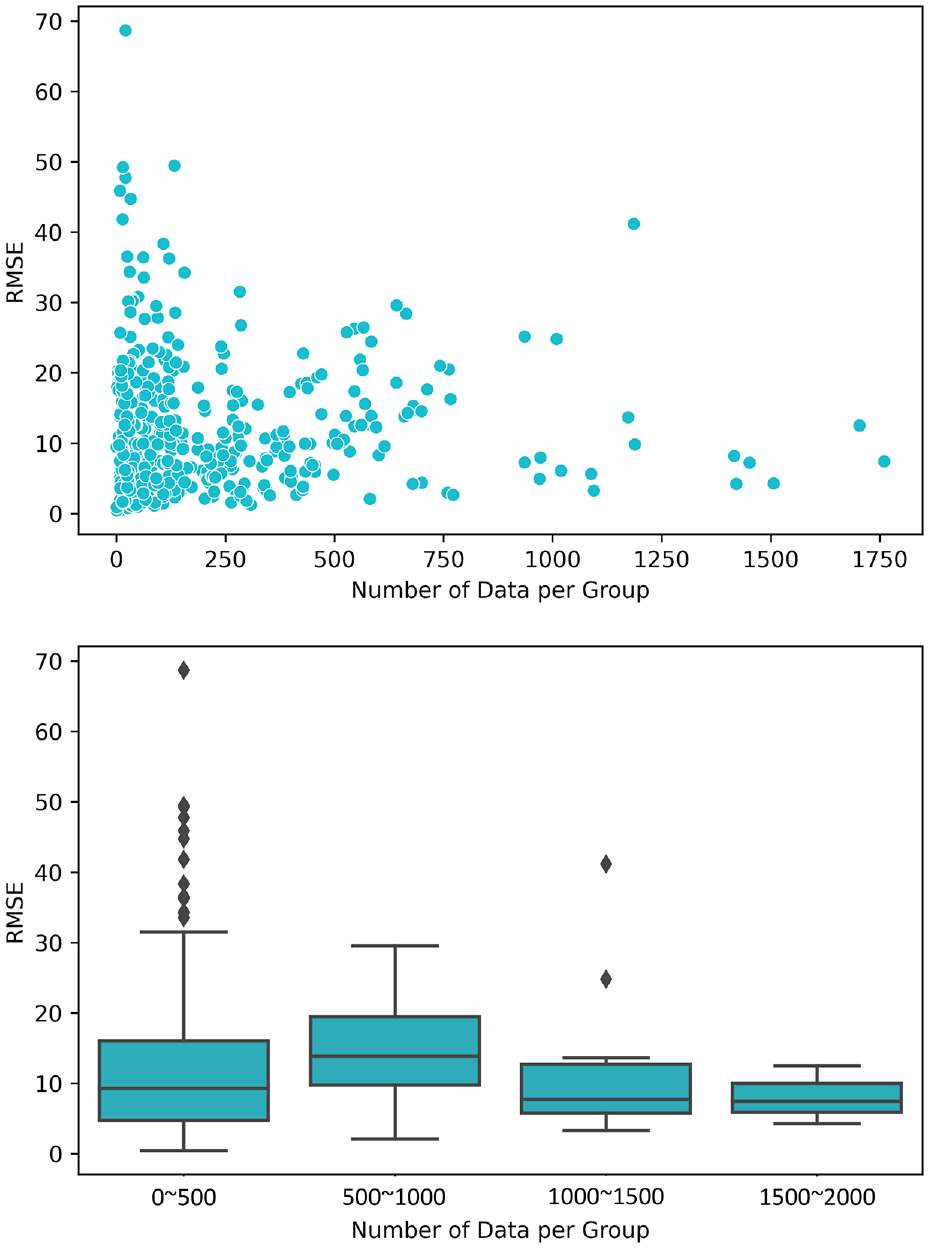
Effect of data imbalance resulting from intrinsic characteristics.
Effect of Data Imbalance Owing to Life Expectancies
The effect of data imbalance owing to the pavement life expectancies on the model performance is presented in Figure 6. As pavement age increases, fewer data points are available for the model estimation, resulting in depreciated model performance. With the number of data points decreasing from about 20,000 at age 1.0 to less than 1,000 at age 16, the RMSE can grow from less than 5 to nearly 40. This suggests that the effect of data imbalance caused by the pavement life expectancies on the model performance is very significant and can no longer be ignored.
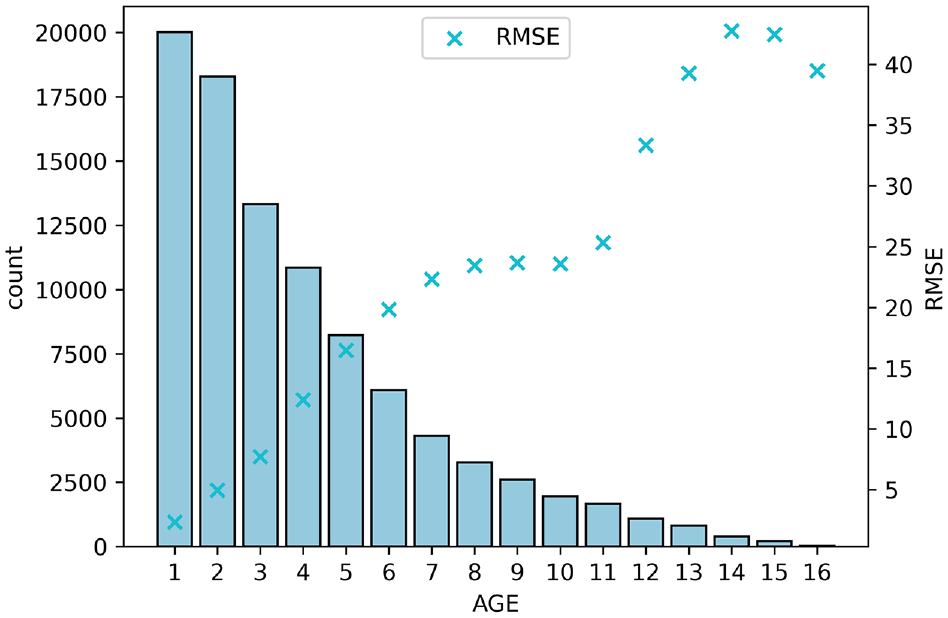
Effect of data imbalance resulting from survival probability.
Effect of Comprehensive Data Imbalance
Based on Figure 7, the effect of comprehensive data imbalance, introduced by both the intrinsic pavement properties and pavement life expectancies, on the model performance is also significant. As shown, the established pavement deterioration models tend to perform more efficiently and consistently for pavement classes with more data. For groups with more than 250 data, the group model errors are remarkably small and have very narrow distributions, whereas for groups with fewer than 250 data, the corresponding model errors are significantly larger and are distributed over a wider range.
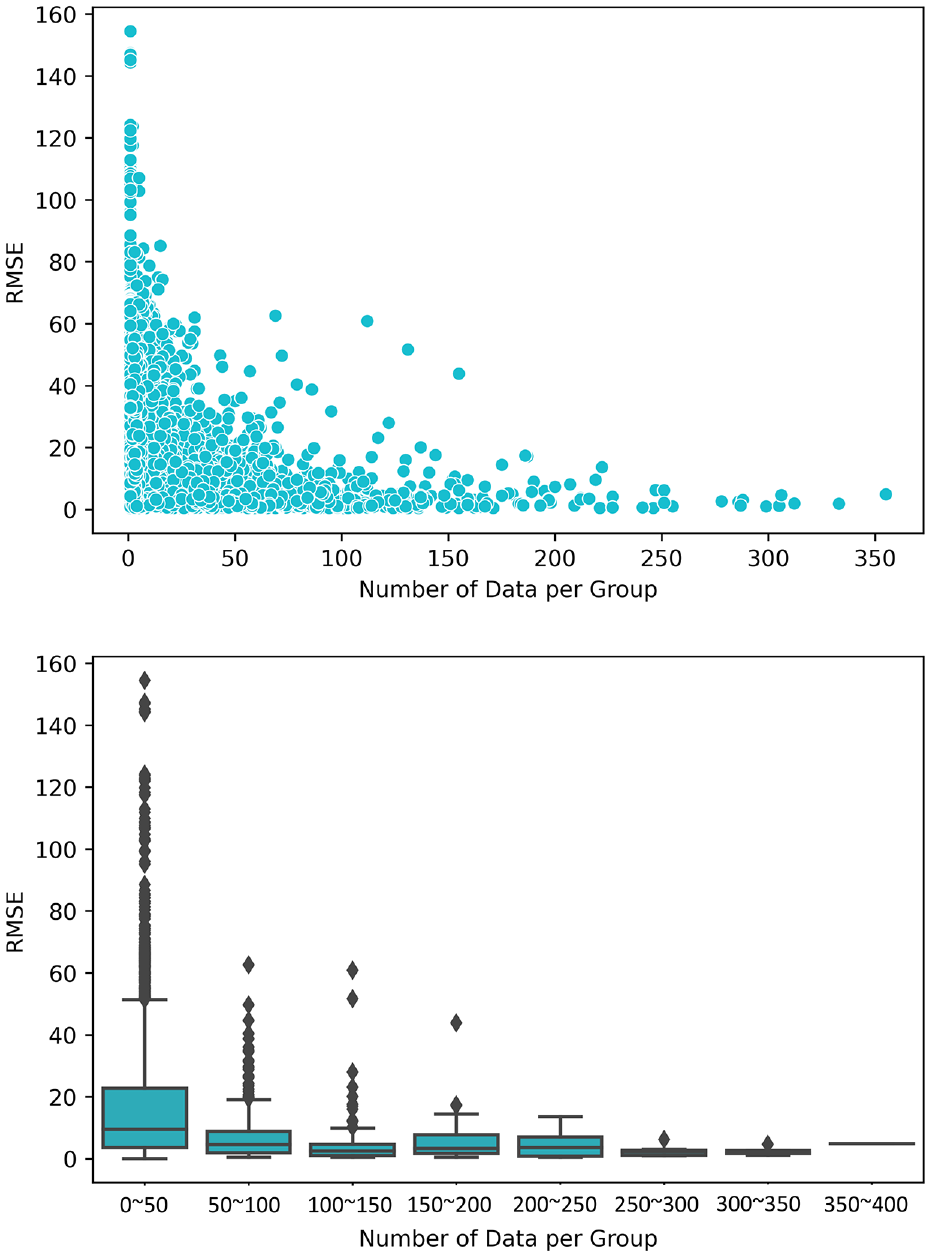
Effect of comprehensive data imbalance.
Summary and Conclusions
Pavement performance models play a central role in the pavement management system. Models that are capable of producing accurate predictions consistently across different pavement types, structures, traffic, and environmental conditions as well as over the service life of the pavements are crucial for effective and efficient management of the transportation infrastructure. However, most of the current pavement performance models are built on algorithms that assume even data distributions, ignoring the inherent data imbalance of pavement performance data. As a result, the accuracy and precision of the developed pavement performance models may vary significantly for different pavement groups. Considering this, in this research, the imbalance of the network pavement performance data was investigated. Additionally, the effect of the data imbalance on the performance of the pavement deterioration model was also analyzed. The main findings of this study are listed below:
The imbalance of the network pavement performance data mainly comes from two sources: the intrinsic pavement characteristics and pavement life expectancies. The intrinsic data imbalance is the result of either the design or the management process. The data imbalance introduced by the pavement life expectancies primarily comes from the pavement management process.
The distribution of the data analyzed in this study does exhibit substantial skewness because of the data imbalance caused by the intrinsic pavement characteristics and life expectancies. Specifically, the data imbalance caused by pavement life expectancies results in decreasing data availability with the increase of pavement age.
The existence of the data imbalance leads to biased performance of the deterioration models toward the pavement classes with more data. With the decreasing number of data, the pavement deterioration models tend to produce predictions with larger errors.
The results of this study demonstrate the consequence of ignoring the data imbalance of the network pavement performance data. To promote more efficient pavement management, it is recommended that the data imbalance should be addressed properly in the development of pavement performance models. Potential approaches include data-based and algorithm-based methods. Data-based methods focus on the modification of the training dataset through resampling, such as over-sampling of the minority classes ( 31 , 39 , 40 ), under-sampling of the majority classes ( 31 , 40 , 41 ), and the hybrid sampling approach that combines both the over-sampling and under-sampling ( 31 , 40 ). In the algorithm-based methods, instead of modifying the training dataset, the learning algorithms are adapted to be able to learn from data with skewed distributions so that the biased model performance toward the majority classes can be alleviated ( 33 , 40 , 42 ), such as the AdaBoost algorithm ( 43 – 46 ).
Footnotes
Author Contributions
The authors confirm contribution to the paper as follows: study conception and design: Hongbin Xu and Jorge A. Prozzi; data collection: Hongbin Xu and Jorge A. Prozzi; analysis and interpretation of results: Hongbin Xu and Jorge A. Prozzi; draft manuscript preparation: Hongbin Xu and Jorge A. Prozzi. All authors reviewed the results and approved the final version of the manuscript.
Declaration of Conflicting Interests
The author(s) declared no potential conflicts of interest with respect to the research, authorship, and/or publication of this article.
Funding
The author(s) received no financial support for the research, authorship, and/or publication of this article.