
Abstract
Potholes represent one of the dangerous distress types on roads. They form as a result of various factors, including water ingress, freeze–thaw, and pavement condition deterioration. In the UK, 1.7 million potholes were repaired in 2021; this critical number causes significant economic, social, and environmental impacts; there is no tool able to predict the number of potholes that might appear in a road network. This study aims to analyze pothole formation and its relationship with other distress types and their severity, and to develop a simple tool able to predict the number of potholes that might appear in a road network based on the network condition. Significant pothole data from the road network of Greater London between 2017 and 2020, in addition to surface distress data, were used in this study. ‘Spatial density’ and ‘join’ tools embedded in ArcGIS were used to correlate pothole spatial density (PSD) with the road condition surrounding the potholes. This analysis was then used to calculate PSD as a function of different condition indicators, such as road condition index and crack intensity, allowing prediction of the number of potholes based on the length and condition of the sections being analyzed. The results demonstrate that potholes are significantly concentrated in sections with deteriorated conditions. They also show that it is possible to predict the number of potholes using PSD with reasonable accuracy. Lastly, it was found that sections with low crossfall are more susceptible to pothole formation, presumably because of water ponding and consequent damage.
Potholes represent one of the most dangerous distress types that might appear on a pavement surface. With no agreed global definition, potholes can appropriately be defined as a localized depression in the fabric of a pavement surface having sharp and vertical edges, certain depths, and certain widths. They are usually bowled in shape ( 1 ); to be classified as potholes in the UK, they have a minimum depth between 30 and 60 mm and a width between 200 and 300 mm ( 2 ). This distress represents one of the major concerns to the public in the UK, owing to its substantial effects on the highway condition and the safety of road users ( 3 ). The latest Annual Local Authority Road Maintenance (ALARM) survey shows that the annual average number of filled potholes is 1.85 million, with an average pothole repair cost of £63.12 ( 4 ), as shown in Figure 1. The direct cost of pothole repair, however, is not the only economic burden, as potholes cause damage to vehicles, injuries to road users, and traffic disruption, owing to frequent maintenance. Highway authorities in England, Scotland, and Wales paid around £13 million as compensation for vehicle damage caused by potholes between 2018 and 2021 ( 5 ); with pothole-related injury compensation claims submitted every 17 min ( 6 ).
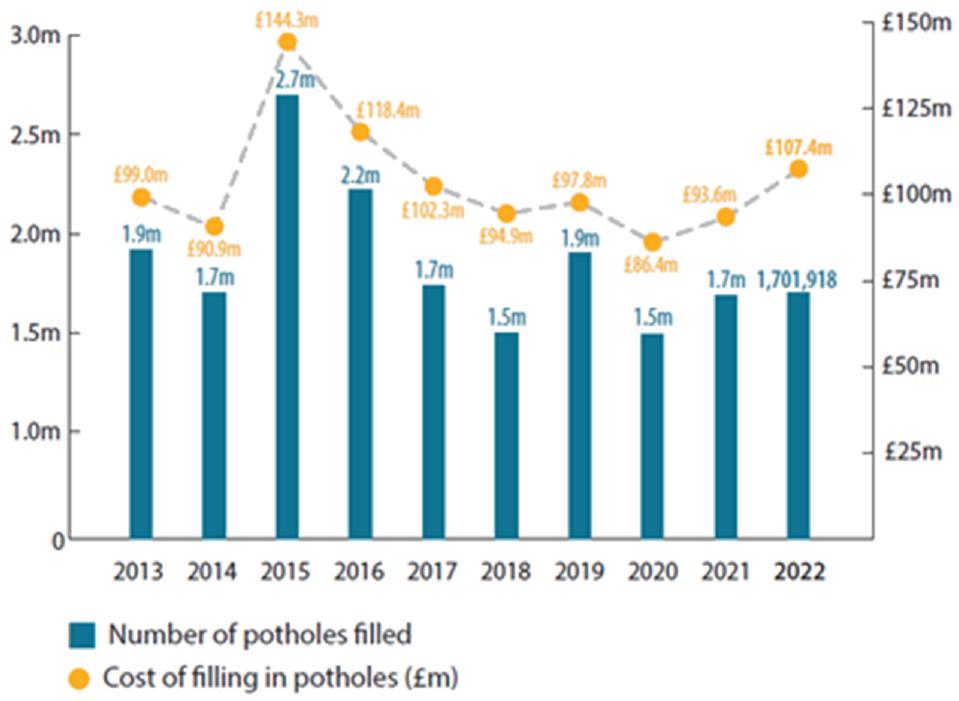
Number of filled potholes in the UK and their annual repair cost between 2013 and 2022 ( 4 ).
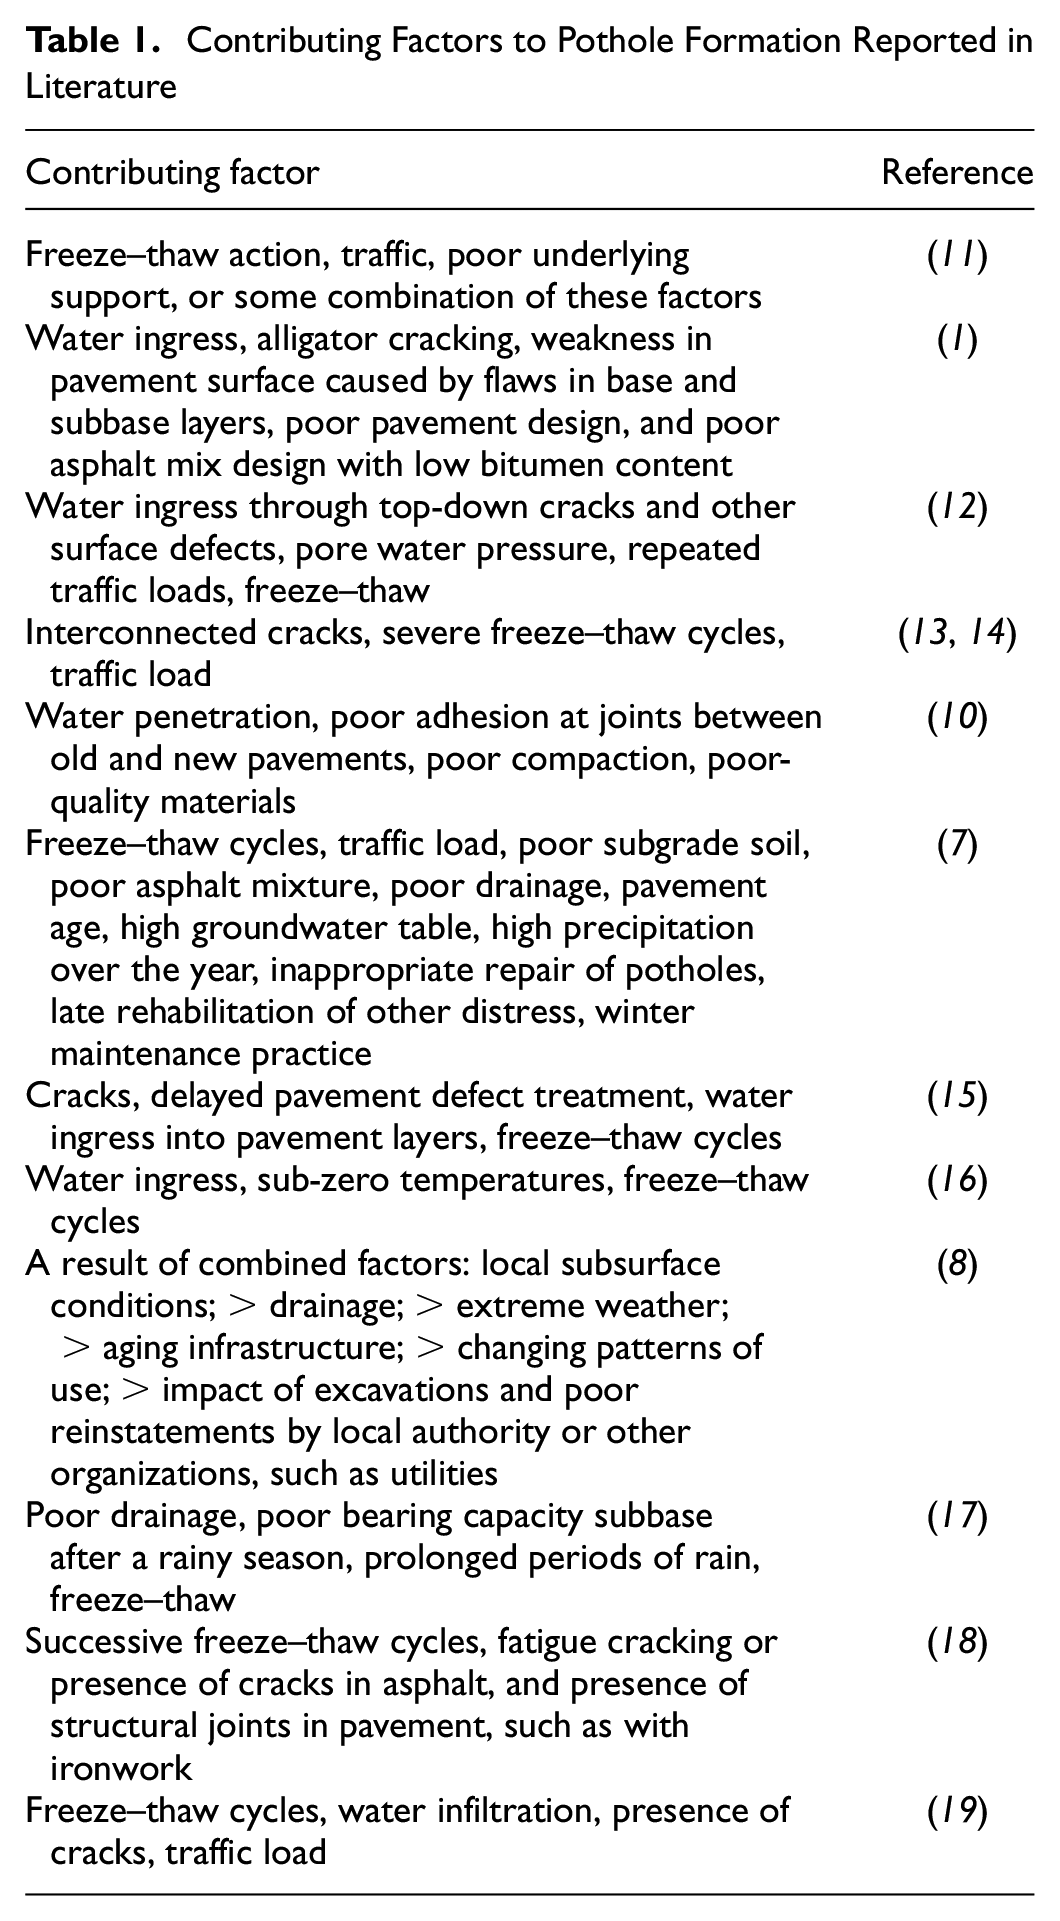
Often, potholes are more pronounced on roads with a deteriorated condition and they might appear as a result of several factors, rather than a single cause ( 7 , 8 ). Table 1 summarizes various contributing factors to pothole formation that are listed in different scientific papers and technical reports. Analysis of the table reveals that freeze–thaw cycles and water ingress are two of the most frequently quoted contributing factors. The presence of cracks or other defects that allow water to infiltrate a pavement structure is also one of the main contributing factors. A Department for Transport report ( 3 ) explained that severe winter weather had caused extreme deterioration in local highway authority networks, which led to a significant increase in the formation of potholes. Rahman et al. (9) mentioned that non-uniform compaction of asphalt pavements could cause much premature distress, including potholes. Saeed et al. (10) surveyed about 80 local authorities in the UK and identified water penetration and poor adhesion between the edges of a cut pothole and patch materials as two of the most likely causes of potholes; poor compaction was a less likely cause and poor-quality materials was the least likely cause, as reported by the respondents. Following a similar approach, Biswas et al. (7) surveyed six transportation authorities in Canada about pothole causes and maintenance practices. They concluded that freeze–thaw, traffic load, poor drainage, and pavement age are among the main contributing factors to pothole formation.
Contributing Factors to Pothole Formation Reported in Literature
Moreover, mechanisms have been described in the literature to explain the initiation and deterioration of potholes. Thom (12) describes the mechanism of pothole formation in asphalt pavement as follows:
Through top-down cracks or any other surface defects, water penetrates the pavement surface.
Under the effects of vehicle tires, pore water pressure develops in the cracks and defects, leading to breaking of bonds between individual aggregate particles and pavement layers near the defects, which eventually leads to noticeable fragmentation of asphalt.
Repeated traffic loads deepen the depression by removing the fragmented stones.
As the depression becomes larger, it can retain more water, accelerating the damage in the depression.
Water eventually penetrates to the foundation of the pavement, softening it, and causing a localized drop in the pavement stiffness, which causes further accelerated deterioration.
Thom also mentions that water freezing is a contributing factor in weakening the adhesion between pavement layers; during the thaw, the trapped water causes pore water pressure generation. Vu et al. (20) developed a constitutive law to model the swelling of water in asphalt pores and implement it in a finite-element program in an attempt to understand the effects of freeze–thaw cycles in winter on pothole formation in partially saturated asphalt pavements. This study demonstrated that a delamination failure between the surface layer and the underlying layer occurs as a result of a few freeze–thaw cycles, owing to differential strains on both sides of the interface, which may explain the formation of potholes in the winter seasons. Hajj and Lu (19) explained that the mechanism of pothole formation caused by freeze–thaw cycling is as follows:
Traffic loading and weather effects create cracks in the asphalt layers.
The cracks allow water to penetrate the underlying layers.
When the temperature drops below zero, water freezes and expands and when the temperature rises the ice melts, leading to damaging of the surrounding areas.
Repeated action of this process will eventually create holes in the pavement surface.
Based on this brief literature review, it can be concluded that potholes cause a significant economic burden on the budget of highway authorities. They also cause significant damage to vehicles and pose safety risks and injuries to road users, particularly cyclists and motorcyclists, causing further economic consequences. Furthermore, there seems to be an agreement among pavement researchers, highway industries, and highway authorities that potholes are a more advanced form of other distress types. They are also a symptom of a deteriorated pavement network. Unfortunately, there is no available tool that can predict the number of potholes that might appear in a road network. The development of such a tool can help highway authorities in preparing the required additional budget for pothole repair and provide better planning of road maintenance activities. With these drawbacks in mind, this study aims to develop a tool capable of predicting the number of potholes that might appear in a road network as a function of pavement condition and distress severity in the network. To achieve this, details of potholes that appeared in the road network of Greater London between 2017 and 2020 are combined with surface condition assessment for the national network of roads (SCANNER) ( 21 ) data. A practical prediction tool has been developed using spatial analysis and correlation of potholes with the surrounding pavement condition; the tool is capable of predicting pothole density (number of potholes per km of road) as a function of different distress types. The results show that this tool can give a reasonable estimate of the number of potholes that might appear in a road section, making it a valuable pothole management tool for highway authorities.
Data Description
Two sets of data were used in this study: pothole survey data from the road network run by Transport for London (TfL) ( 22 ) between 2017 and 2020, and road surface condition assessment data for the same period. The pothole data include the geographical coordinates in easting and northing of the potholes that appeared in 2017, 2018, 2019, and 2020. Figure 2 shows a sample of these data, while Figure 3 presents the total number of potholes formed over the study period. These data were collected by accredited surveyors following TfL investigations and survey specifications ( 23 ) as part of the routine inspection of the road network in the study area, in which potholes on carriageways have at least 20 mm depth over an area of 100 cm2 or more. This means that details of potholes having a depth of less than 20 mm or an area of less 100 cm2 were not collected and therefore are not included in this study. In addition, it must be stated here that the distance between potholes formed every year was measured using ArcGis (10.8.1) tools; about 95% of the data were more than 3 m and about 99% were more than 1 m apart. Potholes formed in any consecutive years that showed a distance less than 1 m were excluded in the analysis to avoid duplicating these data in the calculations.
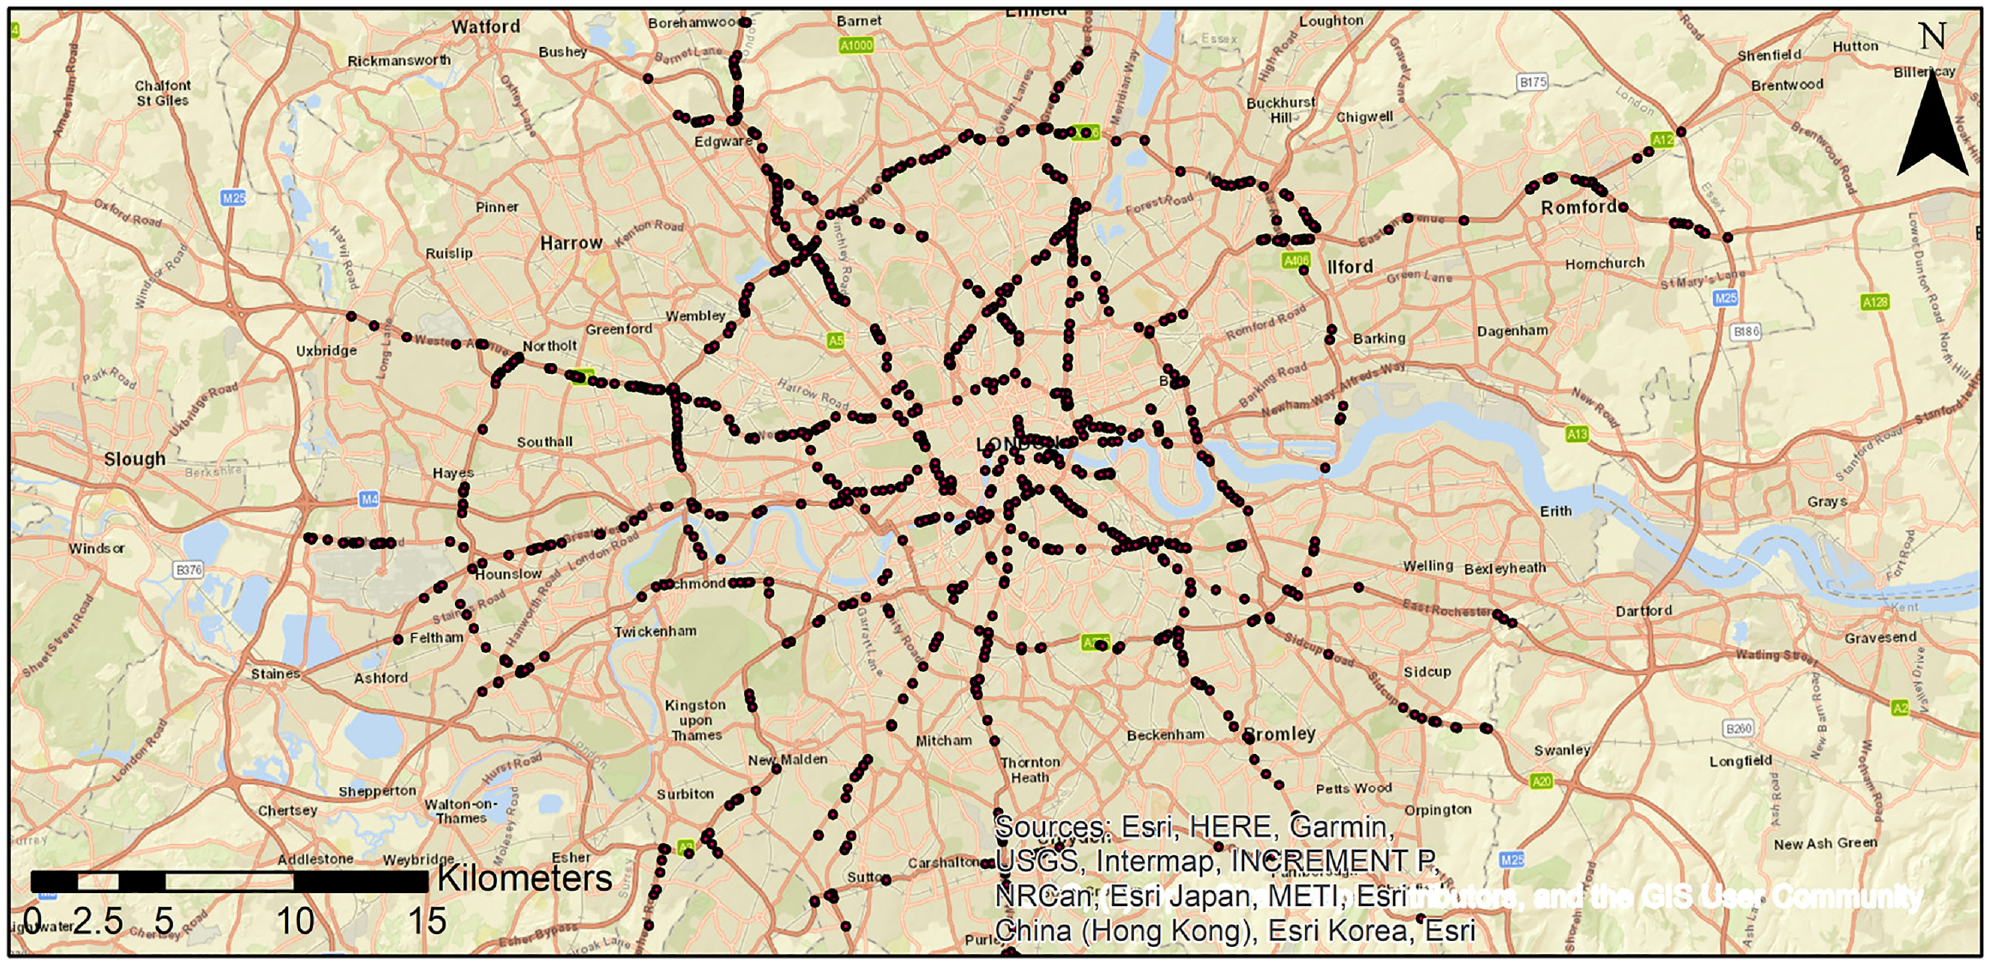
Map showing pothole locations formed in 2017 in the Transport for London road network. This map shows that potholes are isolated in some sections and quite dense.
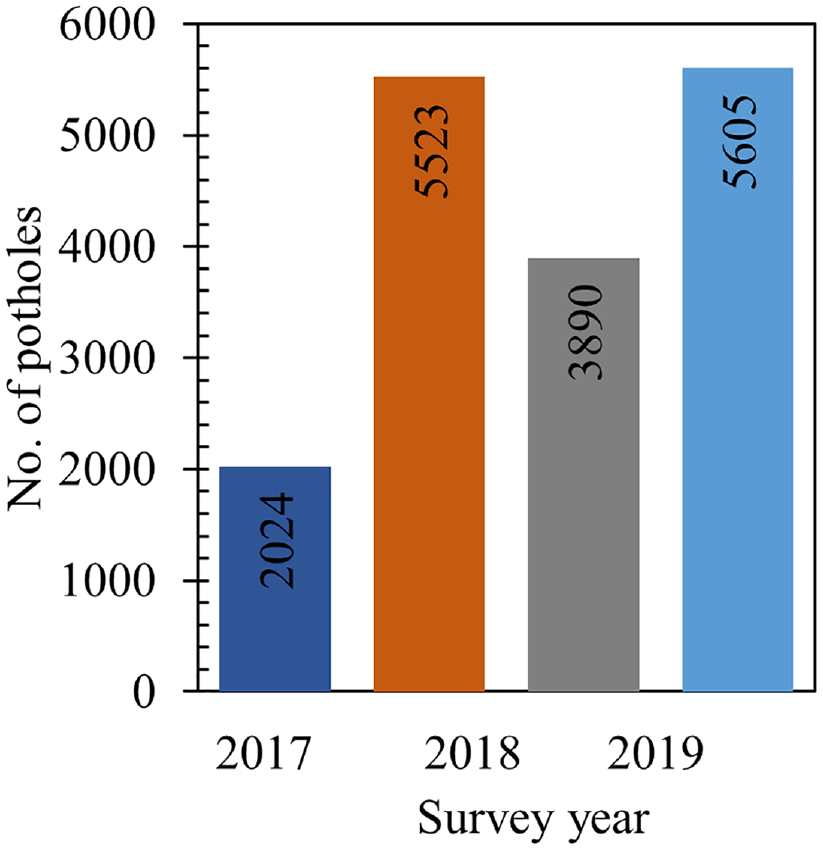
Number of potholes formed between 2017 and 2020 in the Transport for London road network.
TfL also conducts annual surface condition assessments of its road network using the SCANNER method. In this method, a scanning vehicle is used to capture surface defects and the geometry of roads, while it is moving at operational traffic speed ( 24 ), which assures uninterrupted traffic flow and the safety of road users and the machine operators. Figure 4 illustrates the main components of a typical SCANNER vehicle; it has two digital laser sensors, an accelerometer, a global positioning system, cameras, and a data acquisition system ( 24 ). Data from these components are processed to quantify various road geometry measures and surface distress types, and more than 40 indicators are reported, including rutting, cracking, texture depth, and longitudinal profile variance, in addition to section geometry, such as turning radius and crossfall, and geographical coordinates ( 21 ). The main application of SCANNER measurements is to calculate a pavement condition indicator called the road condition index (RCI), which is a function of rutting, cracking, texture depth, and longitudinal profile variance:
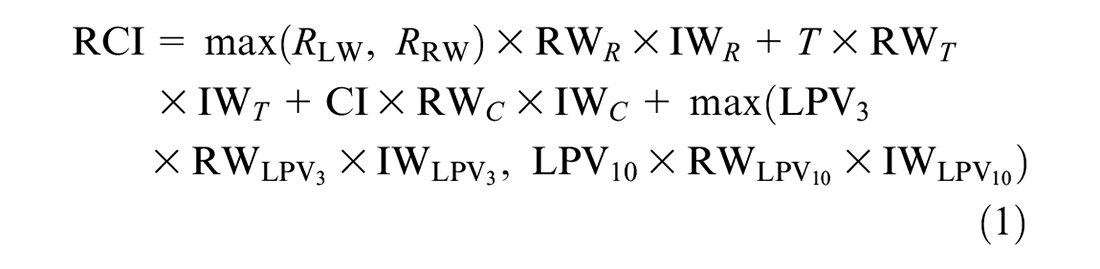
where
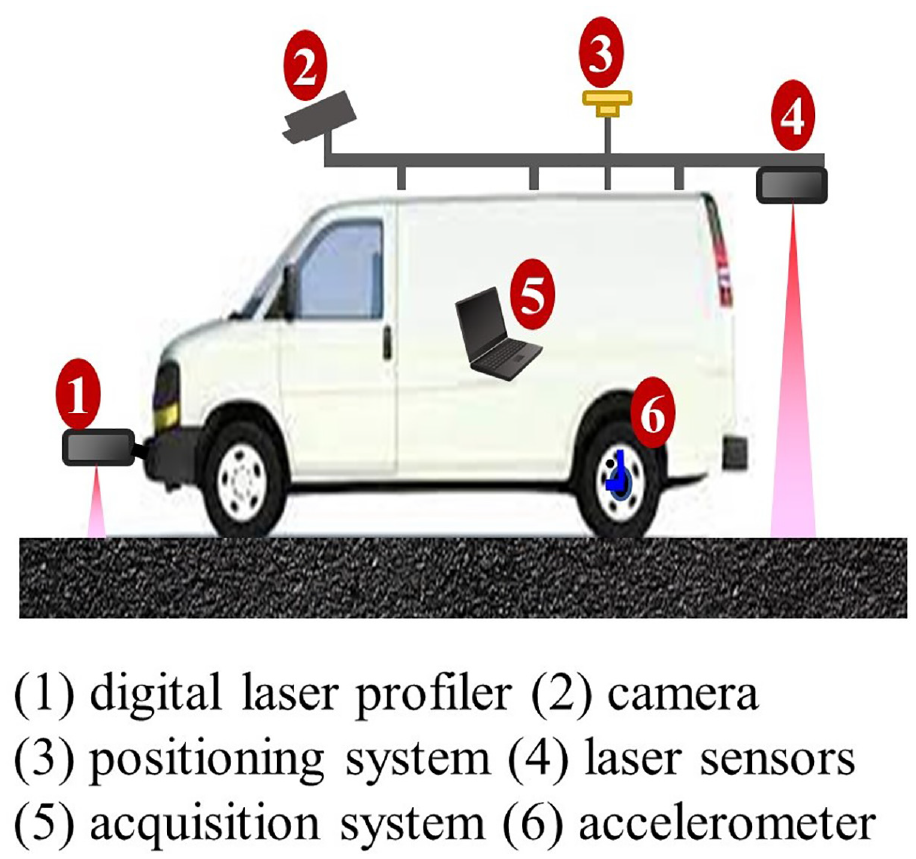
Typical surface condition assessment for the national network of roads (SCANNER) system.
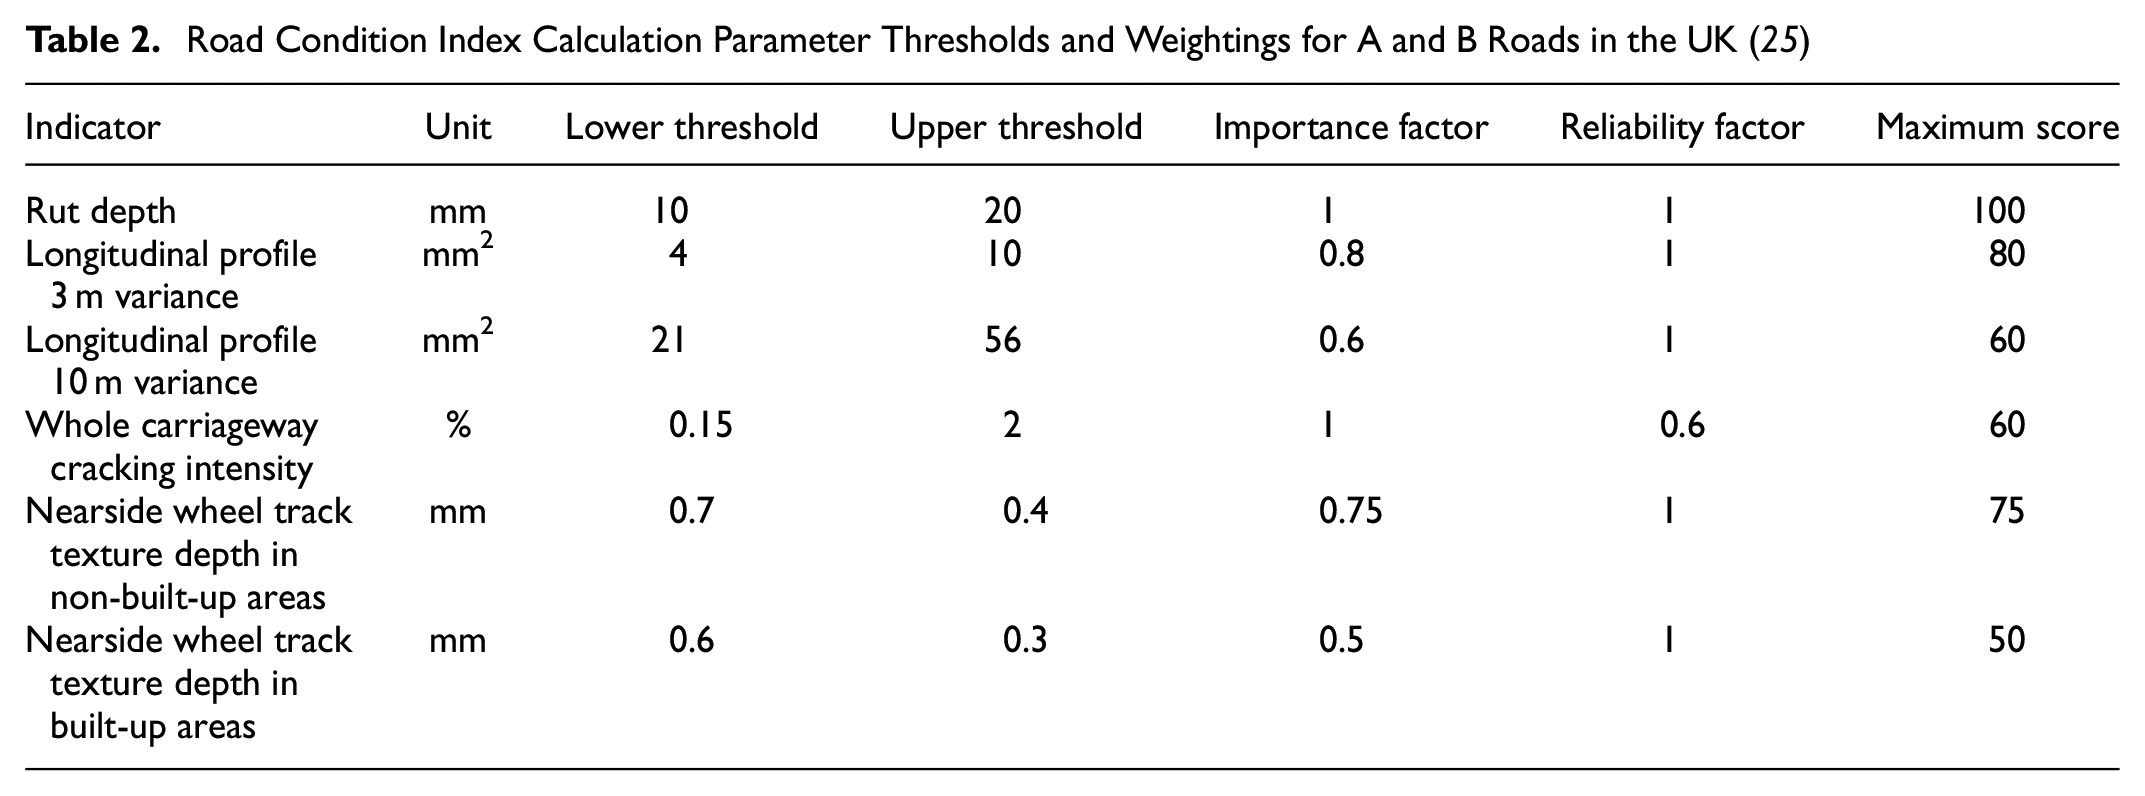
Road Condition Index Calculation Parameter Thresholds and Weightings for A and B Roads in the UK ( 25 )
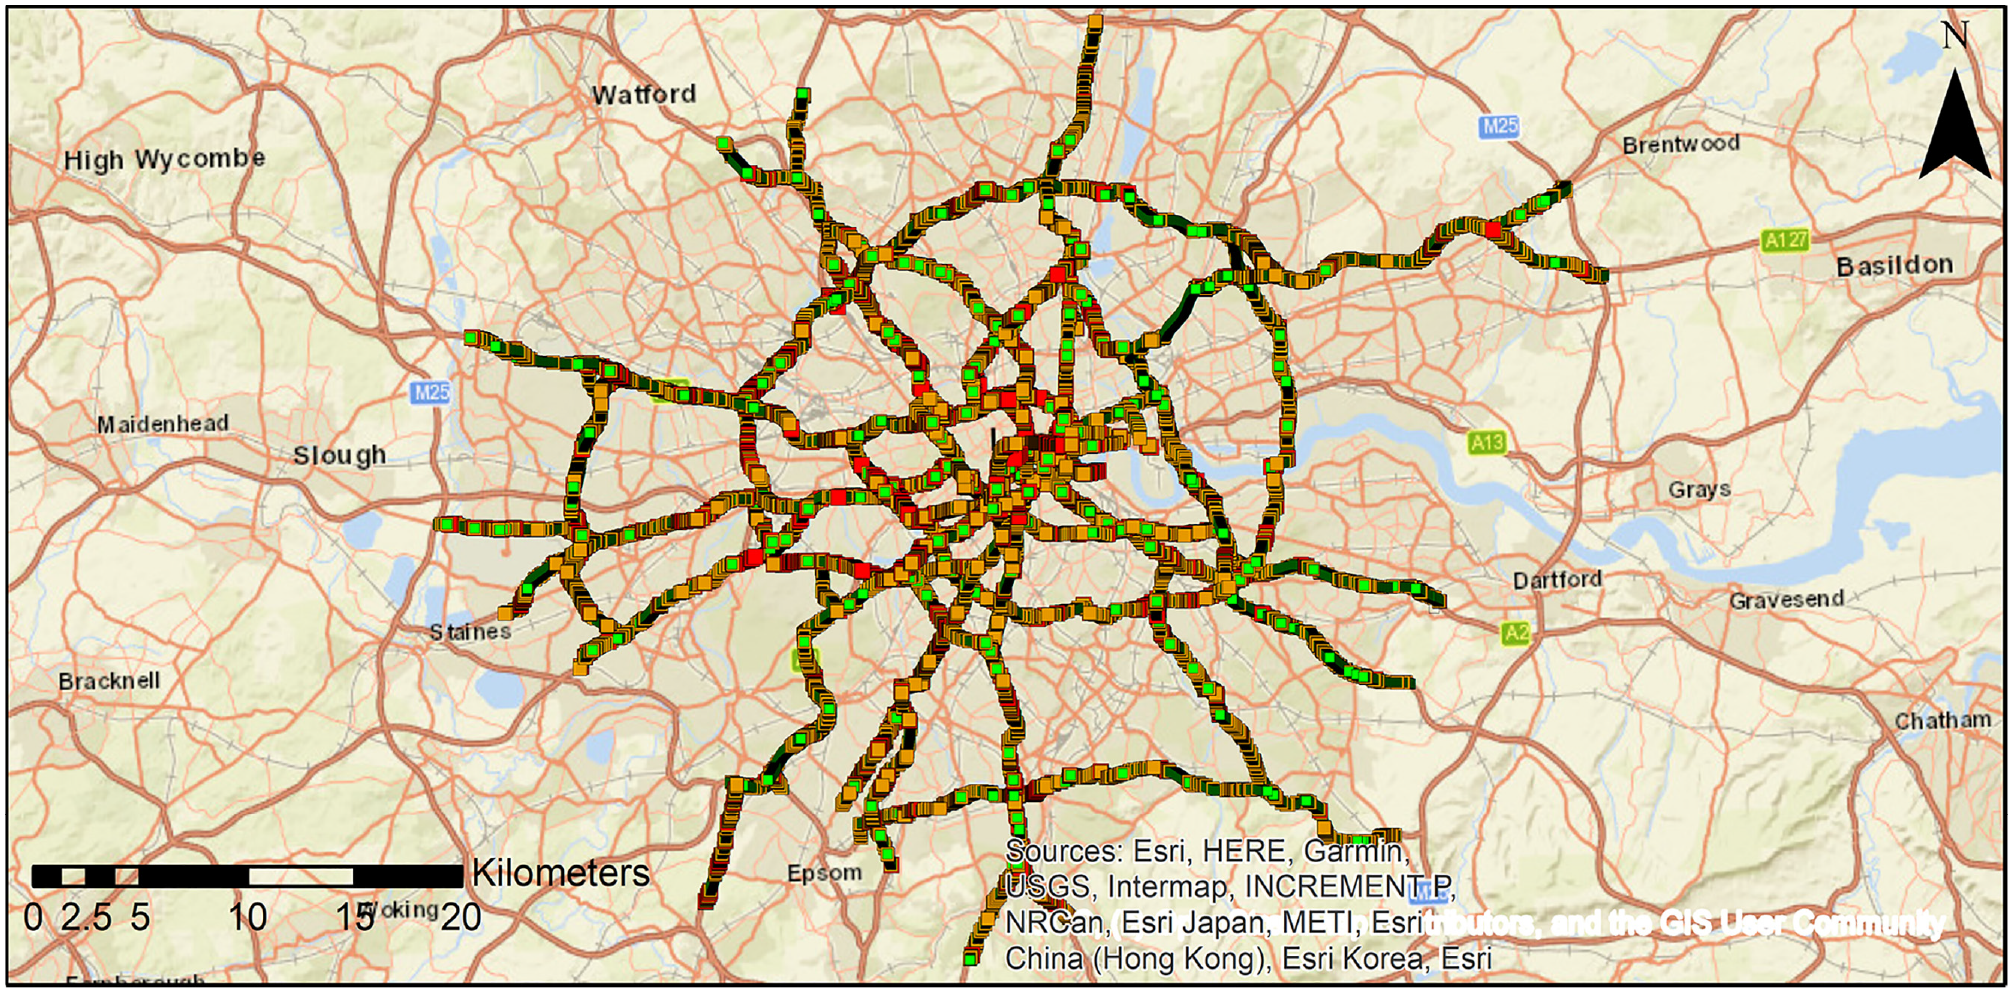
Surface condition assessment for the national network of roads (SCANNER) road condition index (RCI) data for the Transport for London network surveyed in 2017: green sections have RCI <40; orange sections have RCI 40 to <100; and red sections have RCI ≥100.
Analysis Methodology
To analyze the collected data, it was suggested in this study to conduct a spatial analysis that links pothole spatial location with the condition of road sections where potholes form. To achieve that, the “join” tool embedded in ArcGis (10.8.1) software was used. With this tool, all potholes were joined with the road sections in which they formed. This means that potholes and the condition of road sections in which they formed are linked in one dataset, which enables individual analysis of these sections. Furthermore, since potholes are reported as a number and form on roads that are measured by length, then determining potholes as a spatial density, that is the number of potholes per unit length of the road, would be logical. Also, it is expected that pothole spatial density (PSD) will be different from one place to another, owing to variations in pavement condition, properties, and geometry. Since pavement condition can be reported using various indicators and these have different severities, therefore, PSD can be calculated as

where PSD i,k is the pothole spatial density in potholes per kilometer of road (NP/km); NP i,k is the number of potholes formed on road sections with condition i and severity k; and Li,k is the total length of the sections with condition i and severity k. This formulation enables the calculation of PSD as a function of available pavement distress measurement data. It does not necessarily mean that the distress used explains the formation of potholes, however. It statistically means that a road section with a certain distress might develop a certain number of potholes, and that this number can be calculated from observations and used in pothole predictions. The number of potholes that might appear on a road network can then be estimated as


where NP is the predicted number of potholes and S is the number of condition severities. With these equations, the length of sections based on an indicator with a certain severity is used to estimate the number of potholes on these sections using PSD; the total number of estimated potholes is found by summing predicted potholes across all severities. The developed methodology is logically explained in Figure 6.
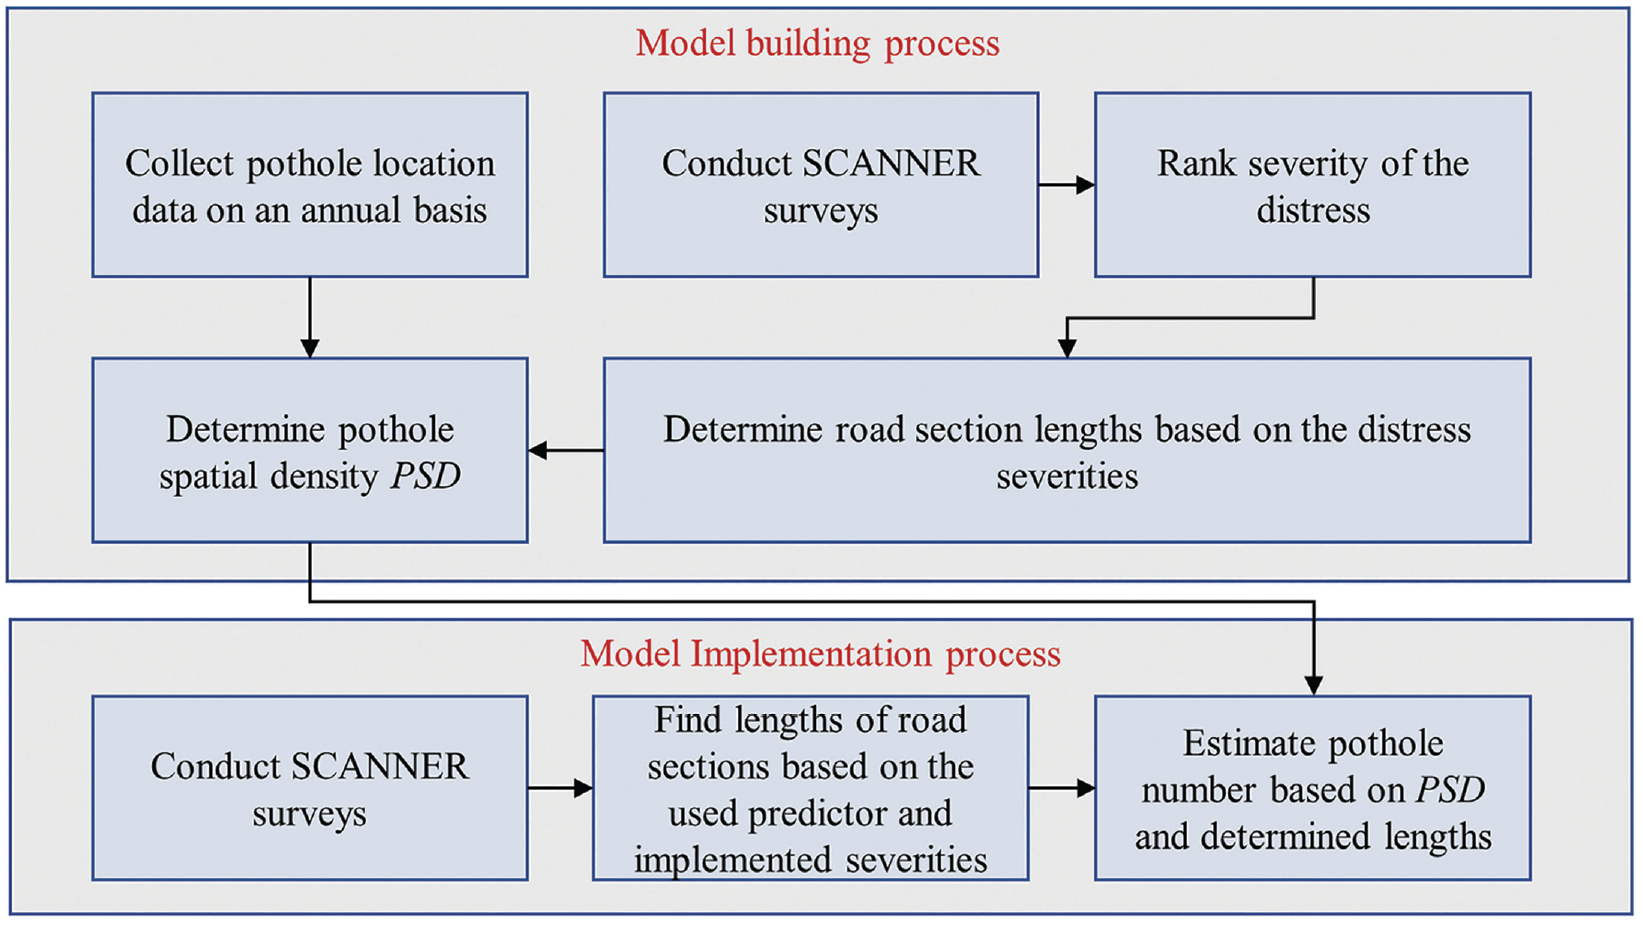
Flow chart explaining developed methodology.
In this study, seven condition indicators were adopted, as shown in Table 3. The first six indicators are measured by the SCANNER system, while the RCI was calculated using Equation 1. Every indicator is assigned two thresholds to identify its severity level, as shown in the table. These thresholds were determined following the SCANNER specifications ( 25 ), but with two exceptions. Firstly, the texture depth thresholds are optimized to assess skid resistance; therefore, there are no upper thresholds in the SCANNER specifications. These thresholds, however, do not reflect the loss of aggregate particles from a pavement surface, known as raveling ( 28 ), which might indicate the susceptibility of a road section to pothole formation. Therefore, two LLTX thresholds are selected in this study based on expert judgment; less than 1 mm for sections with low texture; and more than 2 mm for sections with high texture. Secondly, based on the collected data, no potholes were found on sections with rutting greater than 15 mm; in other words, the vast majority of the sections have rutting less than 15 mm. Accordingly, two thresholds were selected to correlate rut depth with potholes: less than 5 mm for sections with low rutting; and more than 10 mm for sections with high rutting. Using these indicators and the implemented severities, Equation 2 was used to calculate PSD i,k for the years 2017 to 2019, then these results were used to estimate the number of potholes in 2020 using Equations 2 and 3. These results are discussed in the following section.
Pavement Condition Indicators Implemented in This Study ( 29 )
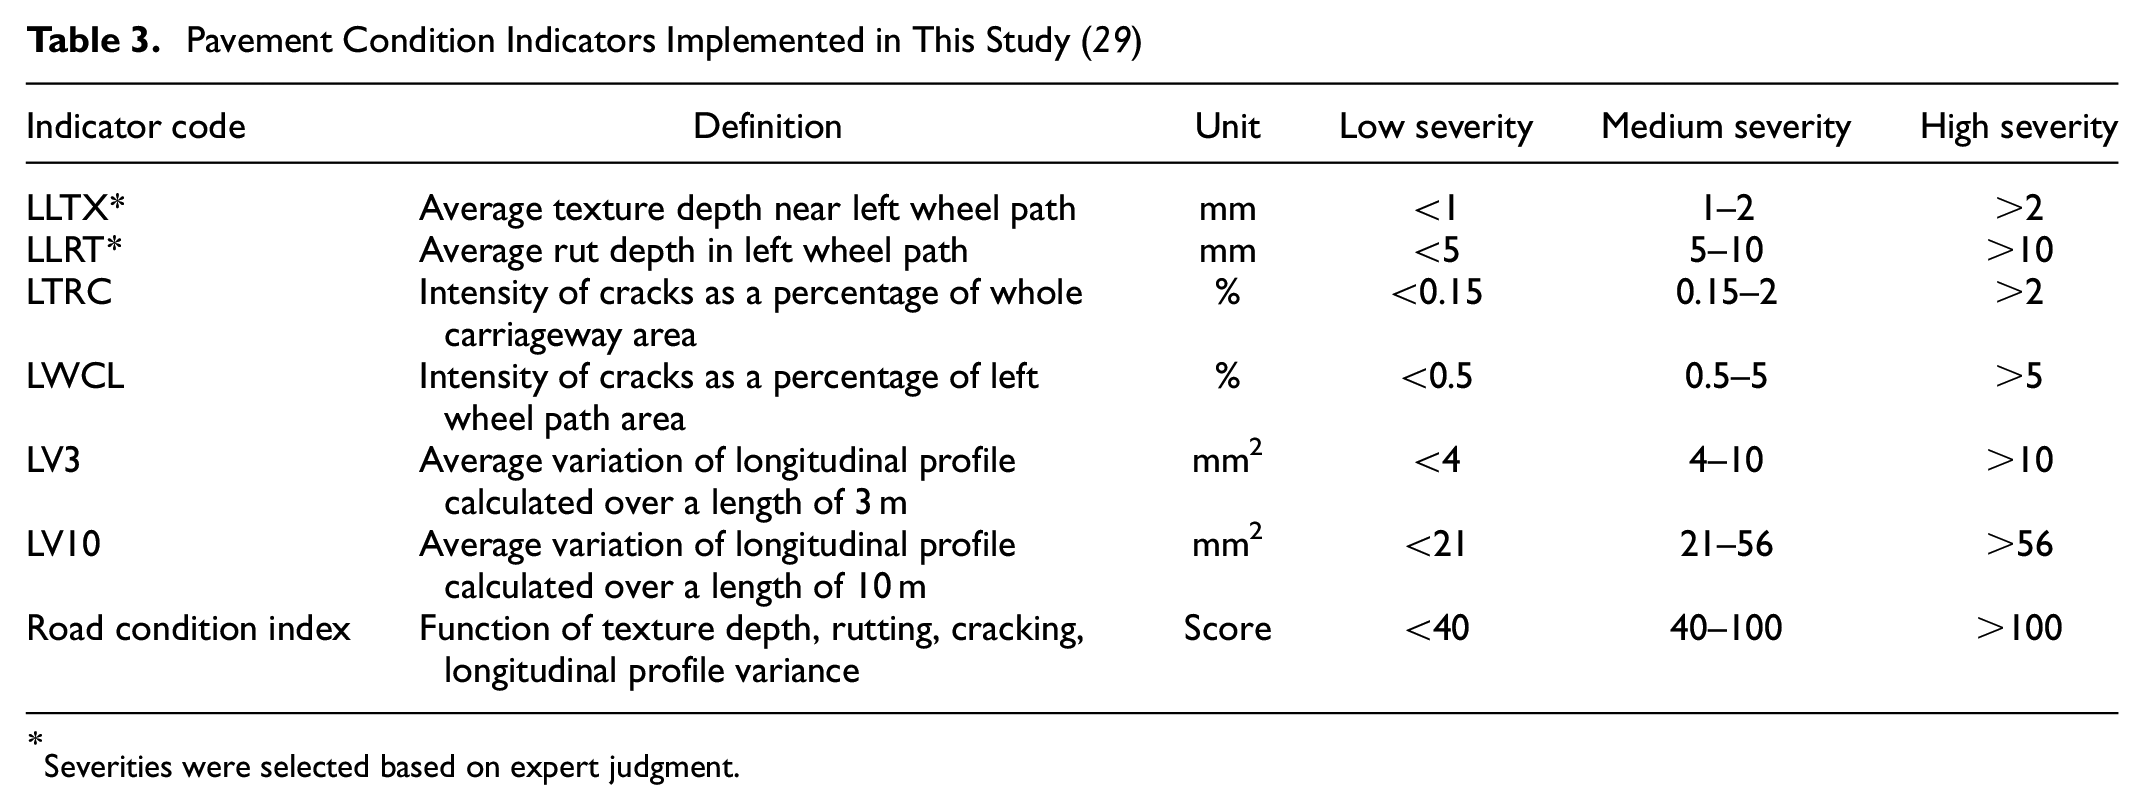
Severities were selected based on expert judgment.
Results and Discussion
Distress and RCI Relationships with PSD
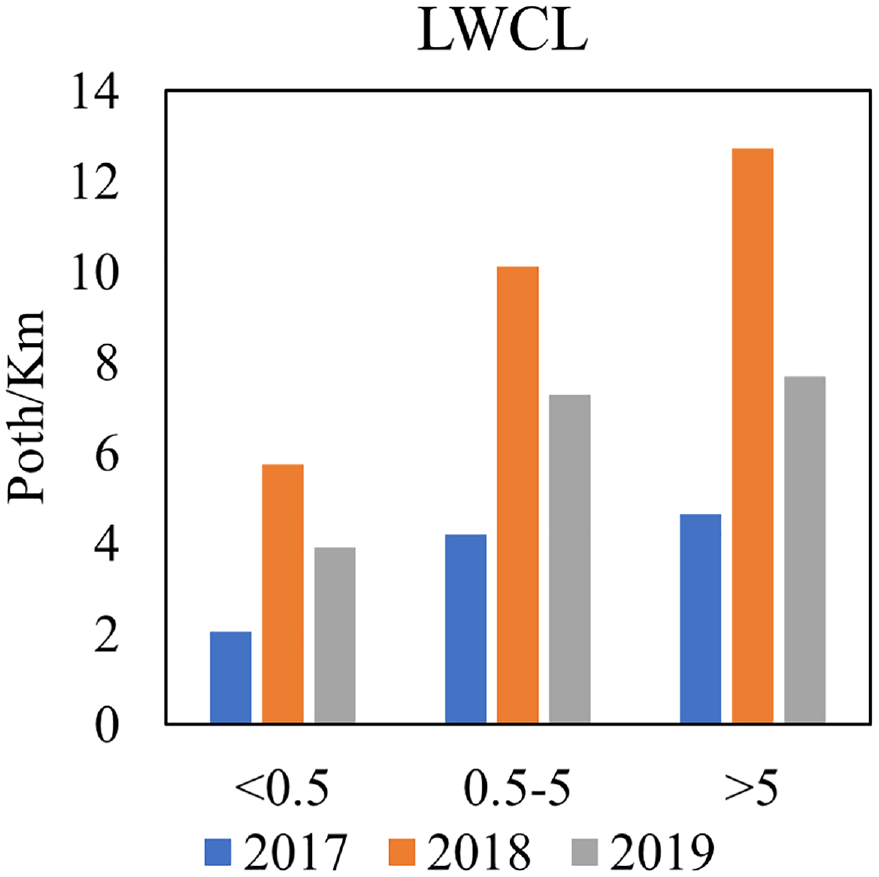
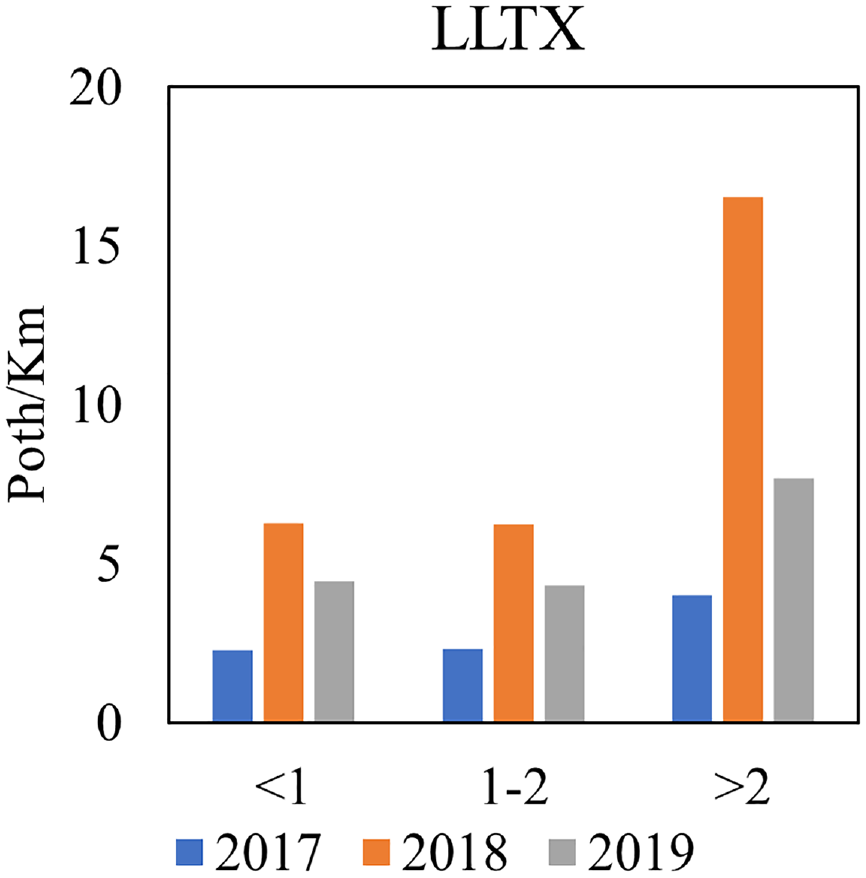
Following the suggested methodology, the relationships between the selected distress types and RCI with PSD were investigated and the results are shown in Figures 7 to 11. Interestingly, all these results show an increasing PSD with an increase in the severity of the distress. For instance, Figure 7 shows that PSD is between 1.6 and 6 potholes/km on road sections with rutting less than 5 mm. This rate, however, increases to 4.4 to 9.2 potholes/km when the rutting ranges 5–10 mm; it further slightly increases to 5.2–9.6 potholes/km when rutting exceeds 10 mm. This relationship between rutting severity and PSD can probably be explained by the effect of rutting on water ponding, which is one of the main precursors of pothole formation: the presence of rutting causes unevenness in the surface profile, which affects water drainage, allowing more time for the water to damage the pavement. Similar trends can be observed between the two cracking indicators and PSD, as shown in Figures 8 and 9; both of these figures suggest that the more severe the cracking on a pavement surface, the larger the PSD. This observation is in line with the findings in Table 1, which indicate that cracks allow water ingress and eventually accelerate pavement damage. The effect of texture depth on PSD is slightly different from these results. As shown in Figure 10, texture depth up to 2 mm does not indicate an increased PSD but, when exceeding this limit, the results suggest that PSD is significantly higher. This means that road sections that exhibit raveling are more prone to pothole formation. Lastly, the relationship between RCI and PSD is presented in Figure 11. This figure also demonstrates a strong direct correlation between RCI and PSD, where road sections with RCI ≥ 100 are prone to 8–20 potholes/km. Since RCI is a function of various distress types and road geometry, represented by the LPV, which is discussed next, this indicator can reflect the effects of various precursors combined on pothole formation, which may make it a better factor to investigate the relationship between pavement condition and pothole formation.
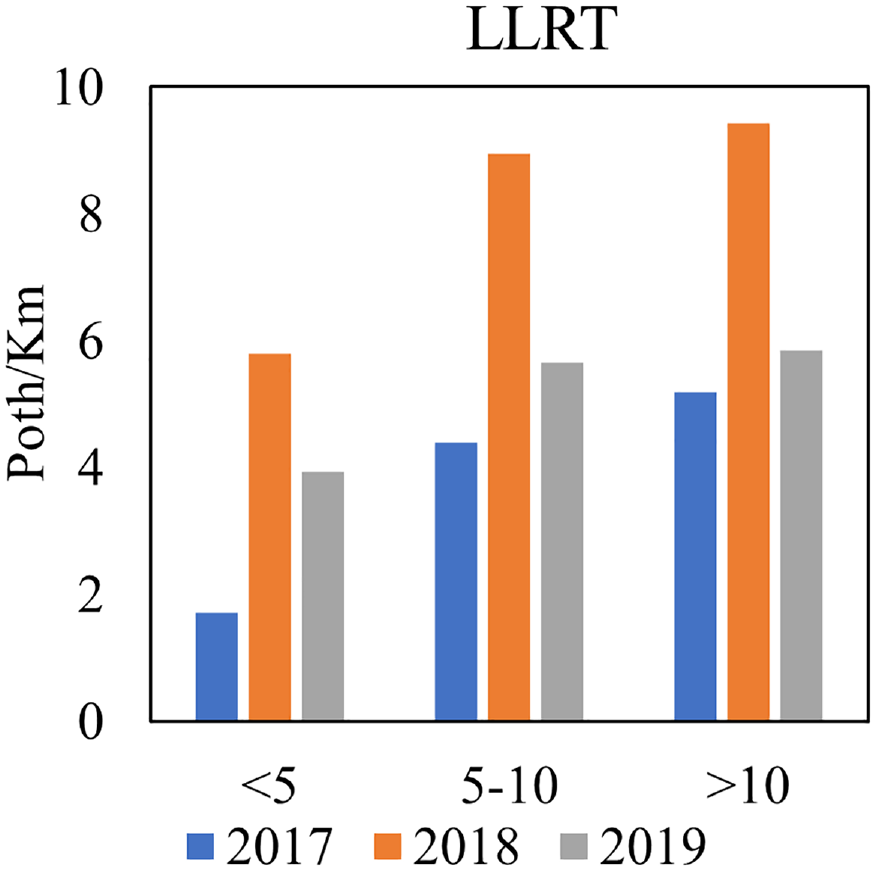
Pothole spatial density measured based on rutting.
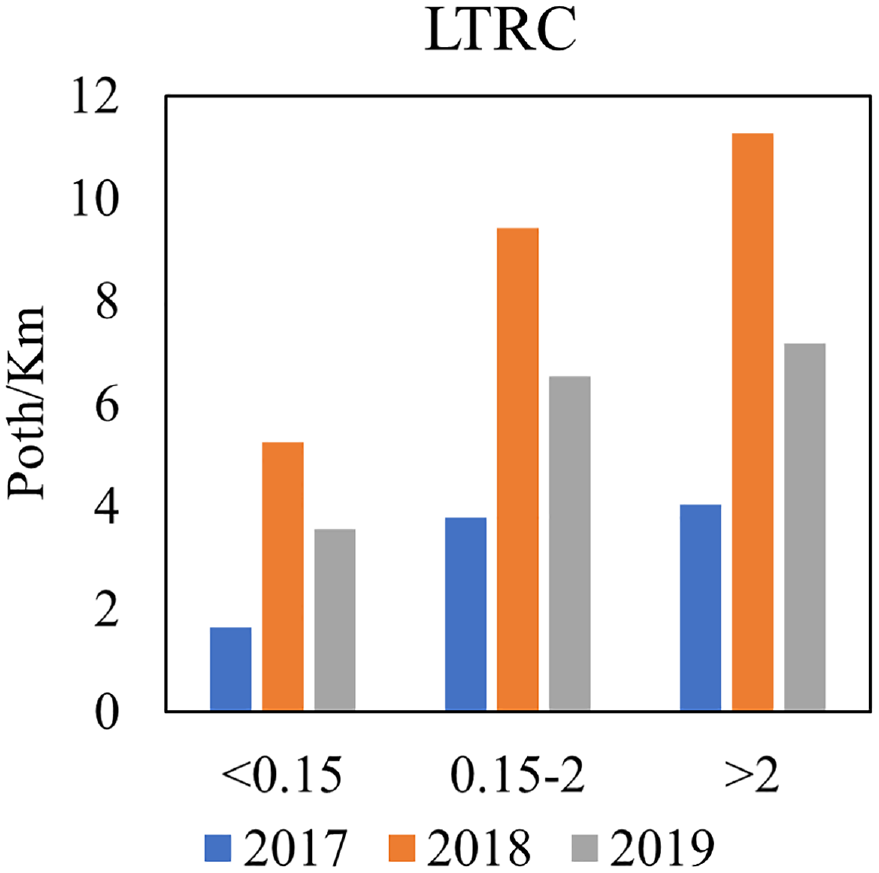
Pothole spatial density measured based on pavement crack intensity over the whole carriageway.
Pothole spatial density measured based on pavement crack intensity over the wheel path area.
Pothole spatial density measured based on texture depth.
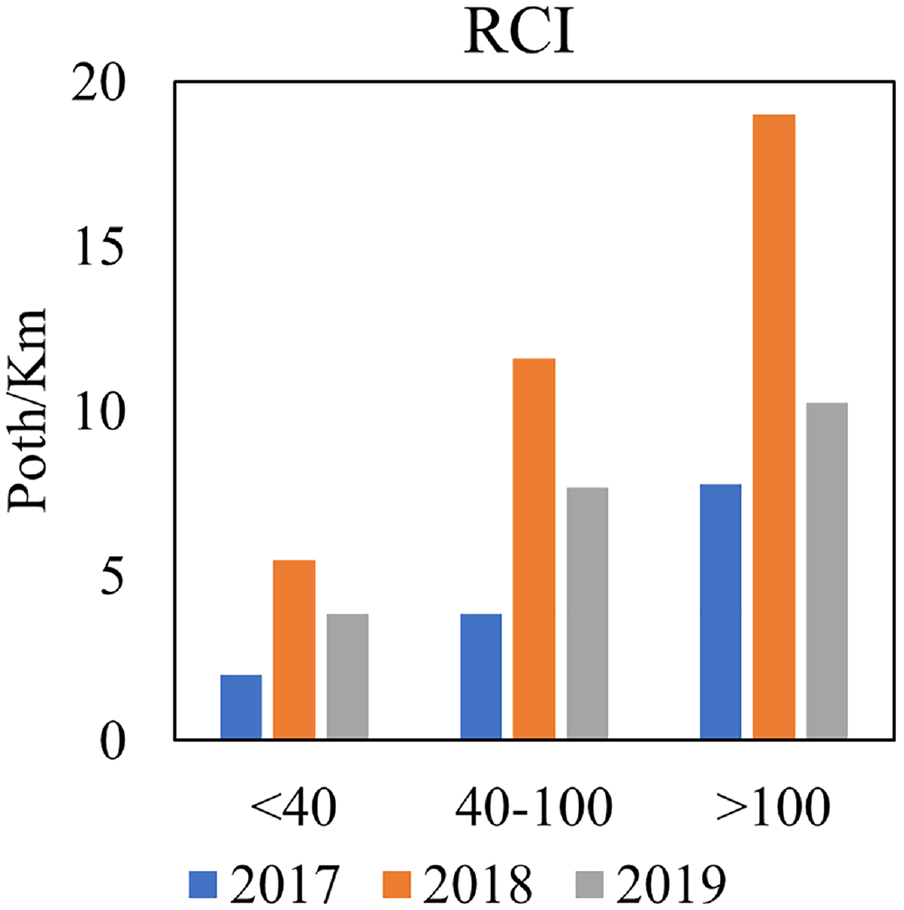
Pothole spatial density measured based on road condition index (RCI).
Road Geometry Effects on PSD
In this section, the relationship between road geometry and PSD is investigated. Road geometry has direct effects on the water flow, and this factor can have critical effects on pothole formation. Therefore, the impacts of two geometry elements on pothole formation are discussed in this section: crossfall and longitudinal profile. The crossfall of a road represents the transverse slope of the road surface. It has a direct effect on water drainage, where low crossfall leads to extended runoff time and poor drainage, which leads to water ingress and further pavement damage ( 12 , 30 ). The SCANNER machine reports crossfall as an average of every 10 m. Therefore, the spatial relationship between crossfall and pothole formation has been analyzed following the PSD approach, as shown in Figure 12. Since there are no specific crossfall thresholds to investigate, PSD is given at three sets of thresholds: more than 2% or less than −2%, or between these extremes; more than or less than 0%, or at 0%; more than 1% or less than −1%, or between these extremes. This analysis was conducted on all of the available data between 2017 and 2020, as shown in the figure. This figure clearly demonstrates that the lower the crossfall the higher the PSD; this observation is valid for all implemented thresholds. This result can be explained by observing that low crossfall roads have longer water runoff times. This means that water has more time to penetrate the road surface and damage it through the various water damage mechanisms. Accordingly, it can be concluded that water drainage plays an important role in the formation of potholes, proving that an efficient water drainage system is therefore one way to limit the pothole problem. Accordingly, highway authorities should, whenever circumstances allow, construct roads with a maximum allowable crossfall to inhibit pothole formation.
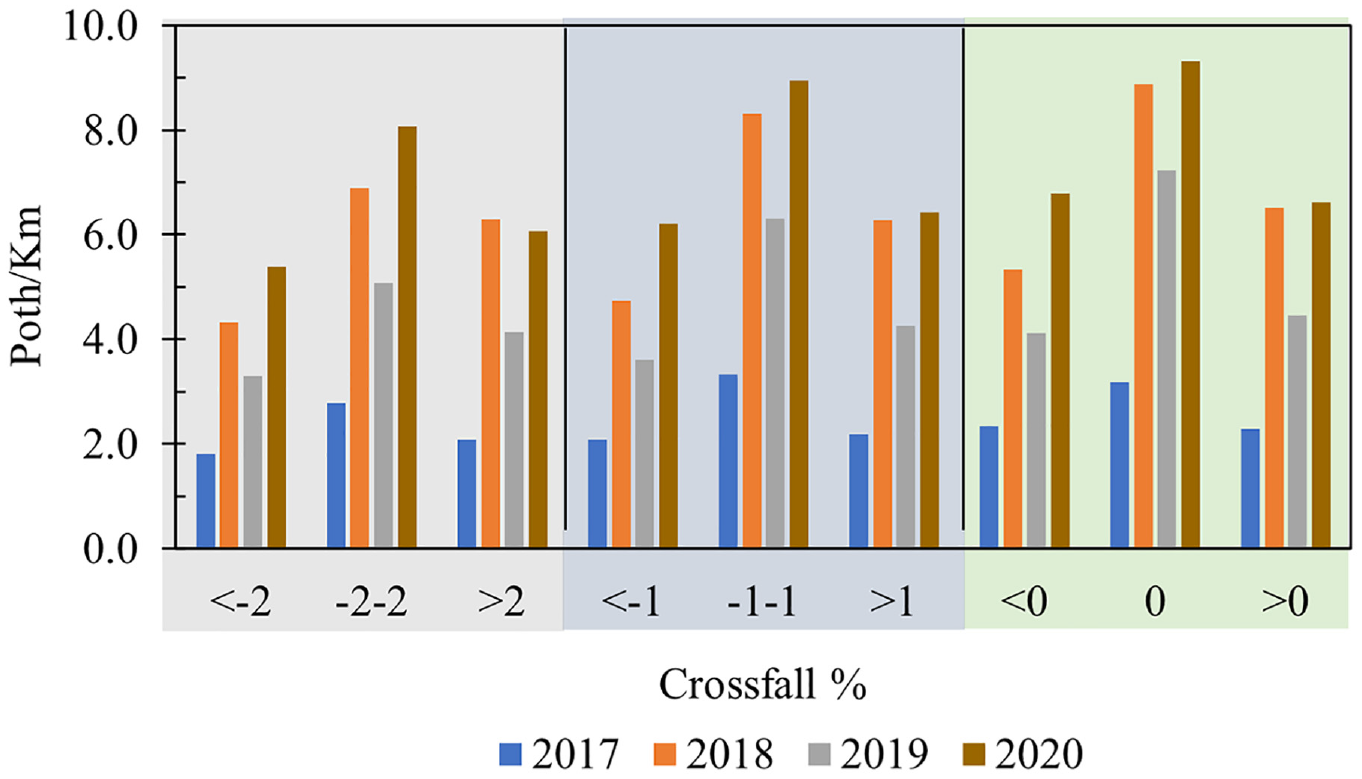
Pothole spatial density at various crossfall thresholds.
Conversely, the longitudinal profile effects on pothole formation have been investigated through the longitudinal profile variance. This factor represents the unevenness of a road surface profile over a certain length, and has been historically used to assess driver comfort and ride quality on roads ( 31 ). Nevertheless, since the road surface unevenness can affect water ponding and water runoff time, then the relationship between LPV and pothole formation has also been investigated using the PSD approach. Two LPV indicators are used in this analysis: LPV3, which is an average variance over 3 m, and LPV10, which has an average variance over 10 m. The thresholds of both LPVs are reported in Table 3, while the PSD results are presented in Figures 13 and 14. These figures indicate that the higher the LPV, whether it is averaged over 3 or 10 m, the larger the PSD. These results also confirm the previous conclusion that water ponding and runoff time can play a significant role in pothole formation.
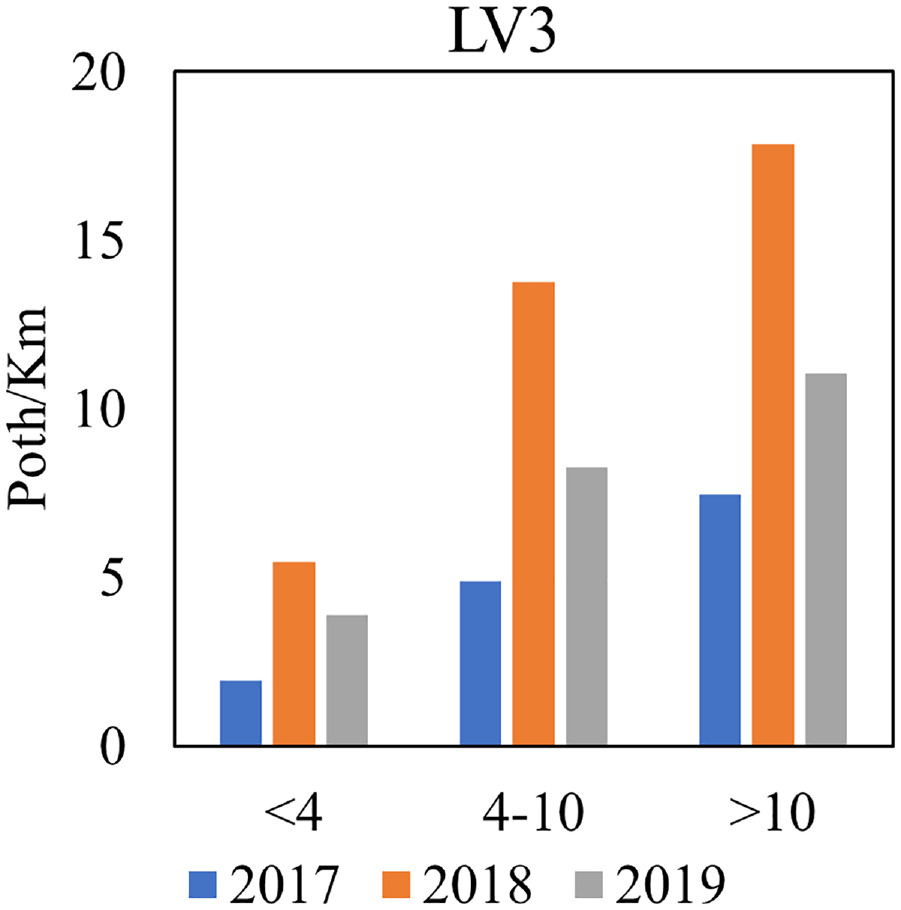
Measured pothole spatial density based on variation in longitudinal profile over 3 m.
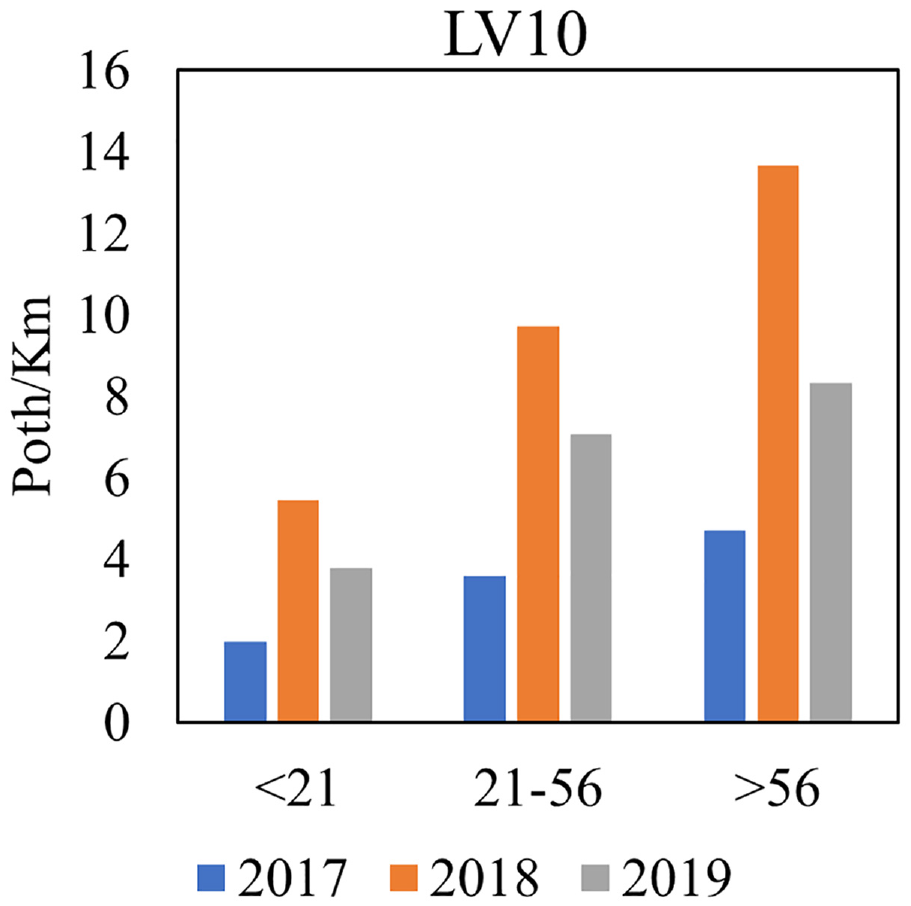
Measured pothole spatial density based on variation in longitudinal profile over 10 m.
Prediction of Pothole Formation Based on PSD Approach
The previous results demonstrate that there is a strong spatial relationship between the location of the potholes and the condition of the road sections. This section investigates the possibility of using this relationship in estimating the number of potholes that might appear in a road network using the PSD results and the investigated pavement condition indicators quantified by the SCANNER method. This can be accomplished using Equations 3 and 4, respectively. Basically, the first equation requires PSD measurements and the total length of the road sections being analyzed, which is calculated based on the type and severity of the indicator used in the analysis, while the section equation is used to sum up the total number of potholes across the distress severities. The application of this concept, however, must include temporal variations in the PSD, to give some confidence in the pothole predictions.
The presented results in this study show that PSD varies widely over time. This can probably be explained by further factors that are not considered in this study, such as weather variations from one year to another. For instance, there was a prolonged period of freezing and snowing in February 2018 that lasted for more than 10 days, with the temperature dropping to −11.7°C on the 27th of February ( 32 ). This severe weather event nearly doubled or even trebled the formation rate of potholes, as shown in Figure 3. This figure also shows that the number of potholes formed in 2020 was significant. This increased formation rate might be a result of the level of precipitation in 2020 which reached 864 mm; about 15% more than the average rainfall in the previous 5 years ( 33 ). The UK Met Office data ( 33 ) also show that the precipitation in the winter of 2020 was the second highest since 1995. These observations suggest that the pothole formation rate can be significantly affected by weather fluctuations.
Nevertheless, to consider annual variations of pothole formation, PSD can be calculated at different reliability levels and the analyst can assign a suitable reliability level based on experience, weather fluctuations, or amount of variation of the data in hand. For instance, PSD was calculated at 95% reliability level in addition to the average PSD using 2017–2019 results, as shown in Figure 15. Accordingly, the average number of potholes and the number of potholes at 95% reliability level in 2020 can be estimated using Equations 3 and 4, respectively. Following this approach, the number of potholes formed in 2020 was predicted using the indicators implemented in this study, as shown in Figure 16. This figure suggests that there is a good agreement between the number of potholes formed in 2020 and the predicted number of potholes. Most of these data showed better agreement with the predictions made at a 95% reliability level. This is because the number of potholes formed in 2020 was also significant, as shown in Figure 3. To further understand these results, the absolute error in the predicted number of potholes was calculated as the difference between the observed and predicted number, as shown in Figure 17. This figure shows that pothole prediction at 95% reliability has less error than predictions made at the average PSD. Nevertheless, pothole formation is significantly affected by climatic and network conditions; if the road network received major maintenance alongside moderate winter seasons, then PSD will most probably drop and pothole prediction at the average PSD might be more accurate in this scenario. Accordingly, there is no one answer to what reliability level should be used. To be on the safe side, however, a pothole prediction at 95% is preferable, as highway authorities will be prepared to deal with a worst-case scenario rather than putting themselves in a vulnerable position. Lastly, it can be seen in Figure 17 that the cracking over the wheel path indicator has the second-lowest error after the RCI. This observation is in agreement with reports in the literature that cracks in asphalt surfaces lead to pothole formation through different mechanisms of water damage inside the cracks. Conversely, RCI shows the lowest absolute error between prediction and observations. This result shows that potholes are affected by several distress types and formed by different mechanisms, rather than a single mechanism. Accordingly, RCI seems a better predictor and is therefore recommended for pothole prediction. Nevertheless, the pothole prediction results based on RCI are not significantly different from those based on crack intensity; therefore, if RCI data are not available, the number of potholes can be predicted using available crack intensity data.
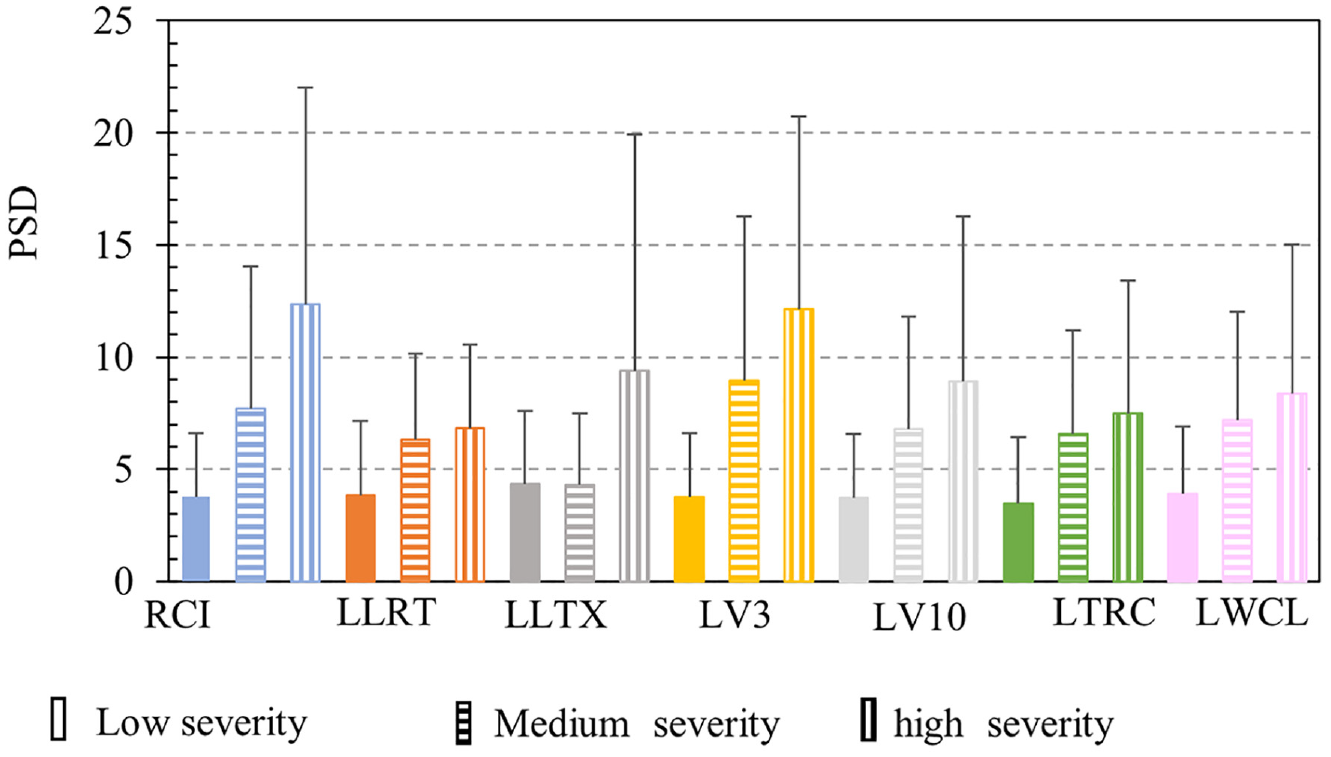
Average pothole spatial density (PSD) and PSD at 95% reliability levels (end of error bars represents results at 95% reliability).
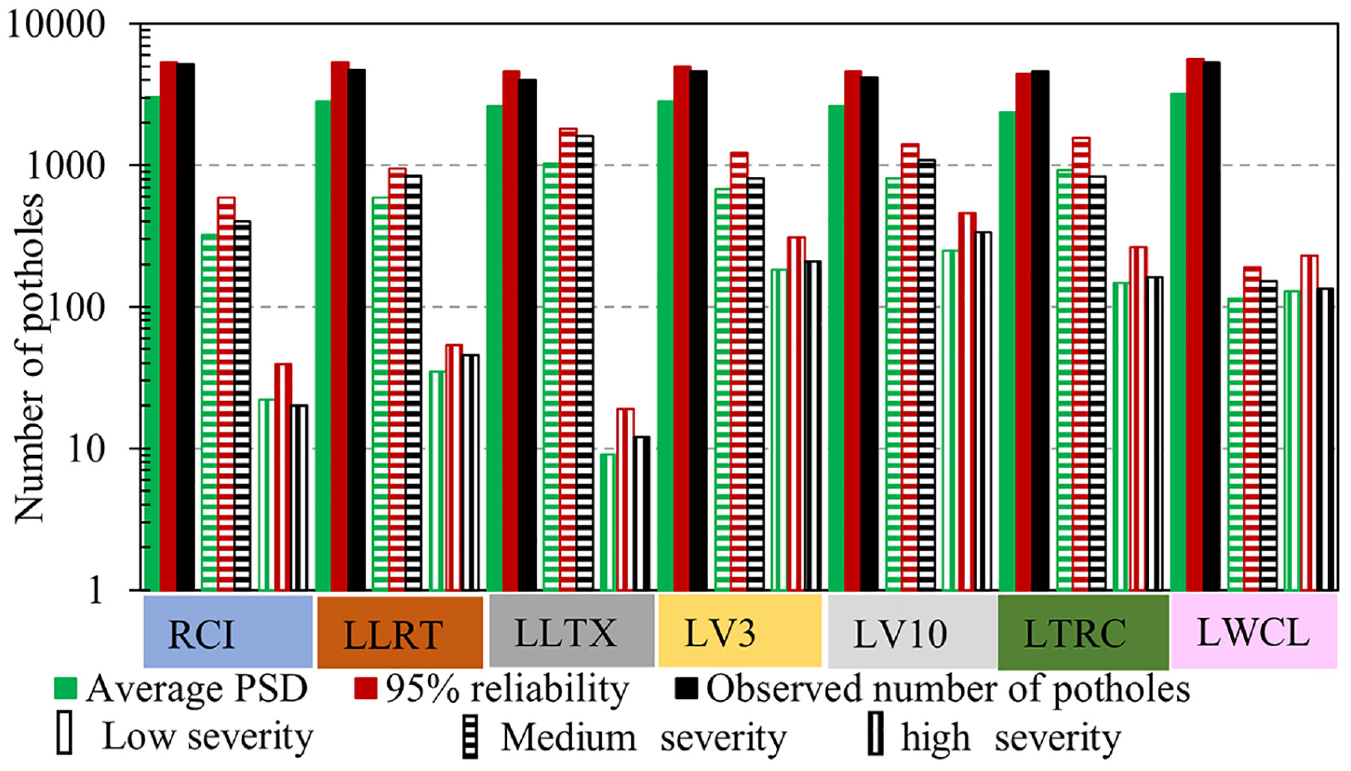
Prediction of potholes at average pothole spatial density (PSD) and 95% reliability compared with the observed number of potholes formed in 2020.
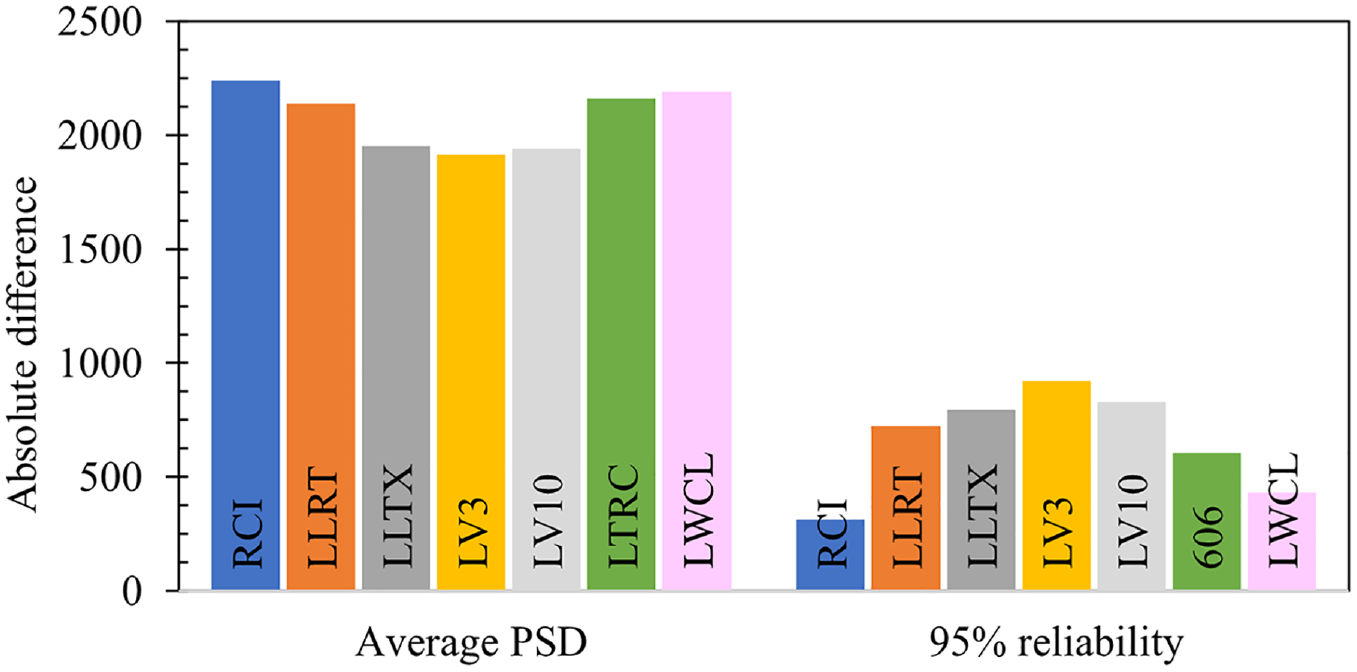
Absolute error in pothole formation prediction at average pothole spatial density (PSD) and 95% reliability.
Lastly, the results presented are based on the spatial correlation between potholes and distress measured in the same year. TfL SCANNER data show that defect annual surveys take place between May and October, whereas pothole surveys are conducted monthly. This means that pavement condition assessed between May and October reflects potholes already formed or that will form in that particular year. Since the aim of the developed tool is to support highway authorities with pothole management, using SCANNER data of a particular year to predict pothole numbers in the same year might not be of practical benefit. This is because highway authorities need to plan and budget pavement maintenance activities in advance. To overcome this issue, two alternatives can be followed. The first is to use the latest SCANNER data in predicting pothole number, and the results, in this case, may be taken to cover pothole formation over the next 12 months—at least approximately. The second alternative is to predict road network deterioration level and then to use the predicted pavement condition in predicting pothole number. This alternative may be more accurate, but it can only be implemented if reliable distress prediction methods are available. Selecting one of these alternatives depends on such factors as the observed pavement deterioration levels and availability of valid distress prediction models; therefore it is a decision of the tool user, who must use expert judgment based on the available data when applying this tool. Furthermore, road maintenance activities might affect porthole prediction results. Certainly, when predicting potholes on road sections that may receive some maintenance, some or all potholes on these sections will disappear, which will lead to an error in the prediction process. Accordingly, this factor should be considered when implementing or validating this approach.
Conclusions
In this study, the pothole formation rate on a road network has been analyzed based on the network condition, and the relationships of distress type and severity with PSD have been investigated. Using the proposed analysis, a simple pothole prediction tool has been developed. The tool predicts PSD as a function of different pavement condition indicators measured by SCANNER; these are rutting, texture depth, longitudinal profile variance, cracking, and RCI, which is a function of all these distress types. The spatial density of potholes can be converted to the number of potholes by determining the road section lengths associated with every severity level of the distress type used as a predictor. The tool has been developed by correlating potholes formed in Greater London between 2017 and 2020 with the conditions of the road sections where the potholes formed using ArcGis tools. Furthermore, the effect of road geometry on PSD was also investigated, since this factor affects water drainage. Based on the results of this study, the following conclusions can be drawn.
All indicators discussed in this study suggest that potholes are symptoms of a deteriorated pavement condition, where the more severe the distress the more potholes form. This suggests that maintaining the road network in a good condition by implementing an effective pavement maintenance program will reduce the number of potholes or delay their formation.
The relationships between potholes and the studied distress types show that there is a strong correlation between cracking and PSD. This is because cracks allow for water ingress into pavement layers; the water ingress damages the pavement condition through various mechanisms, such as freeze–thaw or water pressure.
Road geometries have a direct impact on pothole formation. Roads with low crossfall or high LPV are more susceptible to potholes than roads with high crossfall or low LPV. This is probably because of the effects these indicators have on water ponding and water runoff. Accordingly, maintaining high crossfall and keeping LPV low can reduce the probability of pothole formation.
Variations in PSD over time reflect the effects of different factors, such as the number of freeze–thaw cycles in winters, extreme weather conditions, prolonged pavement freezing, or heavy precipitation.
The developed tool can help highway authorities in estimating the number of potholes that might form on their road networks based on pavement condition data collected by SCANNER. Based on the pothole prediction results, it is recommended to use RCI at a reliability level of 95% when implementing this method to be on the safe side when budgeting and managing potholes.
Although this method is simple to implement, it involves collecting a lot of pothole and SCANNER data, which makes it a data-intensive method. Accordingly, highway authorities are recommended to document these data and start calculating PSD on an annual basis to implement this tool in their pavement management systems.
Currently, the authors are developing a pavement condition prediction tool that can be used to predict road network conditions using SCANNER data. This tool will be used to predict the distress types used in RCI calculations, which can be used in predicting PSD using the developed tool. The ultimate aim of this work is to implement both of these tools in a pavement management system that can be provided to highway authorities.
Footnotes
Acknowledgements
The authors acknowledge Leigh Boswell and George Curtis from Transport for London for providing the data and for their technical support during the development of this work.
Author Contributions
The authors confirm contribution to the paper as follows: study conception and design: AA, MR, NT; data collection: MR, NT, AA, LL, DH, GA; analysis and interpretation of results: AA, NT, MR, LL, DH, GA; draft manuscript preparation: AA, NT, MR. All authors reviewed the results and approved the final version of the manuscript.
Declaration of Conflicting Interests
The author(s) declared no potential conflicts of interest with respect to the research, authorship, and/or publication of this article.
Funding
The author(s) disclosed receipt of the following financial support for the research, authorship, and/or publication of this article: This work was supported by the Engineering and Physical Sciences Research Council (grant number EP/T01962X/1).
Data Accessibility Statement
The raw data used in this study can be made available based on reasonable requests subject to approval of the data owner.