
Abstract
The performance of the unbound aggregate base is affected by moisture content and fines (materials finer than No. 200 sieve) content. Proper moisture content and the proper amount of fines in a base material contribute to long-lasting pavements. This study evaluated an unbound aggregate base under different moisture contents and fines contents. The evaluation included the measurements of the electrical and electromagnetic properties with moisture content and fines content. The dielectric constants were measured with a percometer, and the resistivity values were measured using a Wenner probe. These measurements were correlated with the moisture content for all fines contents used in the study. Strength and modulus tests were also performed on the specimens using the unconfined compressive strength (UCS) tests and a lightweight deflectometer (LWD). The variations in these parameters with moisture content are also presented here for all fines content. A normalization scheme was used to allow for the data to be compiled and analyzed more easily. The dielectric constant increased as moisture was added with some dispersion, but no clear trend was seen among different fines contents. The resistivity decreased consistently as the moisture content increased. The peak UCS normally occurred at moisture contents of about 1% dry of optimum moisture content (OMC); specimens prepared with 1% less than optimum had higher UCS. LWD modulus tended to peak when prepared drier than OMC. The optimum strength and modulus were obtained with 5% and 10% fines contents for the unbound granular base used.
Keywords
An unbound granular base (UGB) is considered the essential layer of the structural section of a highway pavement ( 1 ). A base has two primary functions. First, UGB acts as a foundation and provides proper mechanical support to the asphalt or concrete layer above. Second, it provides proper drainage of the excess water out and away from the pavement structure. Failure to properly achieve one or both functions leads to premature pavement failure ( 2 ). Determining the optimum moisture content (OMC) and dry density of a UGB is crucial in properly complying with standards and constructing pavement foundations. Proper moisture content and adequate dry density allow the base to perform adequately.
Nuclear density gauge (NDG) devices have been used in the compaction control of pavement construction since the 1950s. The accuracy of this testing method depends on the calibration of the nuclear gauge, which establishes the correlation between material density and nuclear gauge count reading in the form of a calibration equation with several constants. The calibration equation may vary depending on requirements, engineering conditions, and physical principles of measurement. Finding soil density with a nuclear gauge starts with the gauge emitting gamma photons that pass through the soil and collide with electrons in the soil. These collisions depend on soil density. Thermalized neutrons emitted from the nuclear gauge collide with hydrogen atoms inside the soil ( 3 ). The higher the density is, the fewer photons will reach the detector. The same method is used to determine moisture content.
A ground penetrating radar (GPR) can also be used to provide continuous information about an existing road. GPR is used to determine pavement layer thickness, assess compaction uniformity, locate moisture retention areas, and identify low-density areas ( 4 ).
The UGB course consists of aggregate and crushed gravel or sand, which contains a certain percentage of fines. UGB must exhibit high resistance to deformation to support the high pressure imposed on it ( 5 ). The size and shape properties of the constituents of a UGB should be controlled to ensure proper workability during construction and improved performance for pavement longevity ( 6 ). The percentage of fines can be variable because of the variation in the source rock during the crushing process, the shake-down of the material during transportation, and improper stockpiling in a quarry or site ( 7 ). The frost susceptibility of UGB used in road construction depends on its mineralogical composition, the percentage of fine particles, and hydraulic conductivity ( 5 ). Proper moisture content and a proper percentage of fines also aid the UGB foundation to perform adequately. Materials consisting of finer particles tend to reach their highest stiffness level when compacted dry of their OMCs ( 8 ). This is typically a result of the tighter packing of fines within larger aggregates, which may increase stiffness.
Siswosoebrotho et al. ( 9 ) investigated the influence of fines content and type on the strength and permeability of Class A road-base materials per the National Indonesian Standard. A Class A road base typically contains 8% or less fines per Indonesian specifications. Permeability tests were conducted to understand the change in hydraulic conductivity with the increase in fines. They tested base aggregate mixtures with 0%, 4%, 8%, 12%, and 16% fines by weight. The California Bearing Ratio (CBR) and permeability tests were performed on said mixtures. The researchers stated that UGBs with little or no fines gained stability from grain-to-grain contact. A UGB with no fines usually had a relatively low density but was pervious and not frost susceptible. A UGB that contained sufficient fines to fill all voids still gained its strength from grain-to-grain contact with increased shear resistance. Material that contained a significant amount of fines had no grain-to-grain contact, and the aggregate merely “floated” in the soil. The UGB with 8% fines had the highest maximum dry density of all fines mixtures with the highest CBR.
Gandara et al. ( 10 ) evaluated the engineering properties and performance of two different UGB materials, focusing on the gradation and specifically on the percentage of fines. They performed various tests to determine the properties of the base materials varying in gradation and fines content. Different mixtures were prepared and tested with 0%, 5%, 10%, and 20% fines. The properties measured and analyzed were permanent deformation, moisture susceptibility, stiffness, and strength. Moisture susceptibility, triaxial compression, permanent deformation, and resilient modulus tests were conducted. Gandara et al. concluded that the 20% fines mixture exhibited the highest moisture susceptibility. The results of their triaxial compression tests demonstrated that cohesion increased as the amount of fines increased. The highest strength at 10 psi (pounds per square inch) confining pressure was obtained at a fines content of 10%, followed by the 5%. The blend of 5% fines mixtures exhibited the highest resilient strains during permanent deformation tests, followed by the blend with 10% fines. Finally, the highest resilient moduli were measured for the mixtures with 5% fines. The study concluded that increasing the percentage of fines often improved the base material’s performance. However, the results showed that the percentage of fines had a limit of around 10% fines.
This study aims to establish a correlation between the percentage of fines in an aggregate base material and the mechanical, electrical, and electromagnetic properties. The resistivity and dielectric constant measurements were compared from the base materials with different fines percentages to relate the moisture content and fines content to those properties. Also, the moduli and strengths were measured with a lightweight deflectometer (LWD) and unconfined compressive strength (UCS) tests to correlate these strength parameters with the moisture content, and percentage of fines.
Experimental Design
The flowchart of the laboratory procedures can be observed in Figure 1. A dolomitic-limestone base material local to El Paso, Texas was obtained, oven-dried, and subjected to its corresponding index tests. The base material was subjected to a proper sieve analysis to separate the stockpile into proper fine-grained, intermediate, and coarse-grained bins. The proper amounts from different bins were then combined to develop four base materials with varying fines.
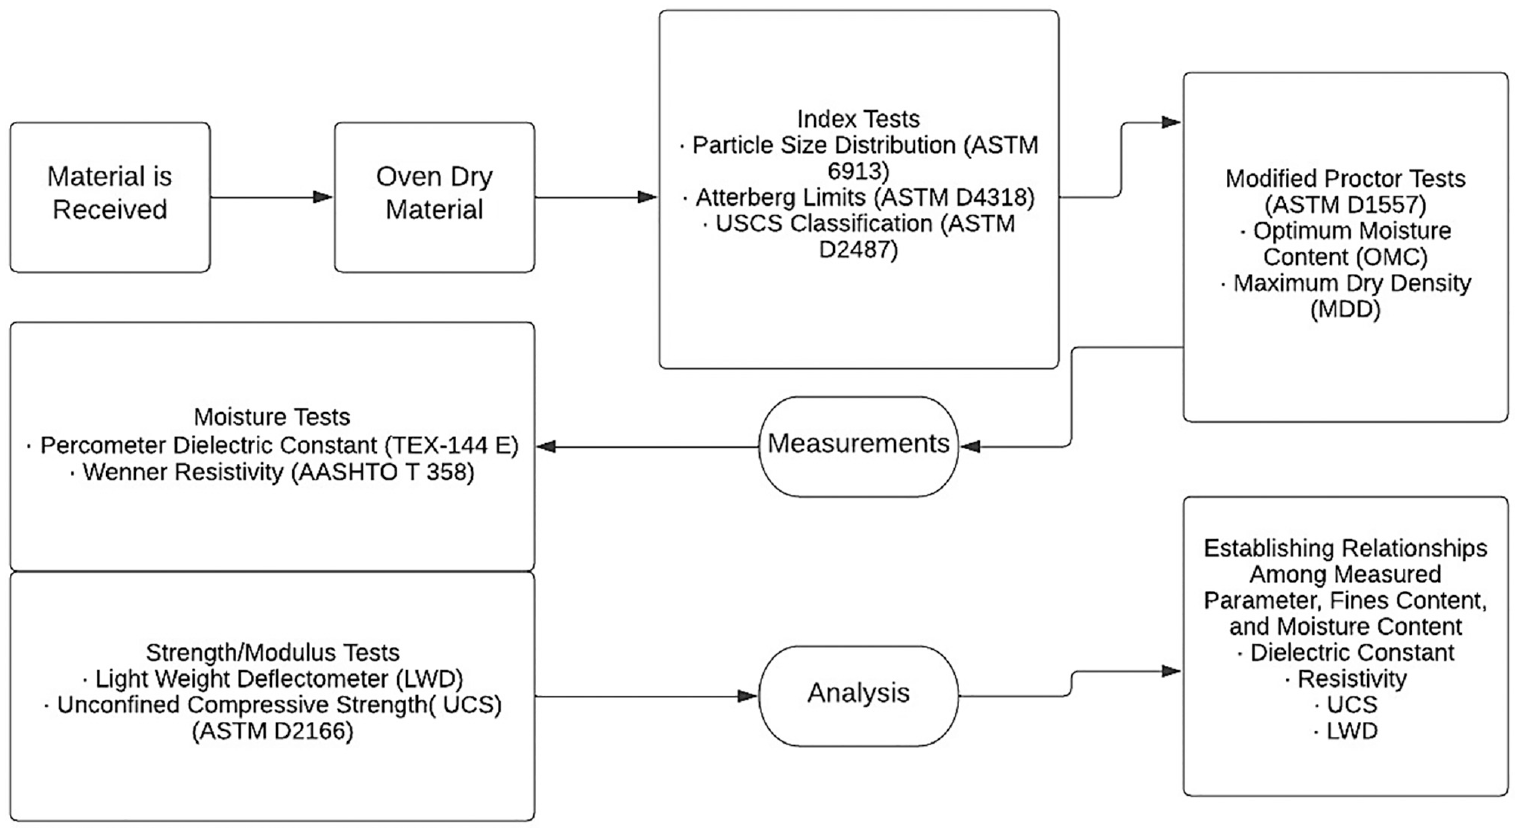
Experimental design and testing flowchart.
The next step was determining the OMC and maximum dry density (MDD) of each UGB. After obtaining the OMC, five specimens 6 in. in diameter by 8.5 in. in height were prepared at OMC, OMC ± 1%, and OMC ± 2% and tested. The LWD test was performed before demolding the specimen as outlined by Schwartz et al. ( 11 ). After the LWD measurements, the specimens were demolded, and various moisture and strength measurements were conducted. These tests included dielectric constant, resistivity, and UCS. The actual moisture content was then obtained to relate the measurement results to moisture content and fines percentages.
Measurements
Lightweight Deflectometer (LWD)
The LWD, consisting of a light mass, steel springs (placed on top of the specimen), an accelerometer, and a data collection unit shown in Figure 2a, was used to obtain the LWD modulus. The mass is attached to a vertical pole and dropped from a fixed height of 2 ft onto the specimen. The mass is transferred from the steel springs into the loading plate (6 in. in diameter and with a nominal force of 800 lb) and from the loading plate into the specimen ( 12 ). The LWD modulus may not be representative of the comparable field modulus because of the specimen being confined inside of a steel mold which is placed on a concrete floor. Six total drops were conducted, three conditioning and three displacement outputs. These three displacements were averaged to get the LWD modulus of each specimen.
Dielectric Constant (DC)
A percometer, shown in Figure 2b, was used to determine the dielectric constant as per the Texas Department of Transportation (TxDOT) test procedure Tex-144-E. The metal electrodes of a percometer sensor form an electrical capacitor within the specimen. The change of electrical capacitance determines the dielectric constant of the specimen because of the influence of base material close to the electrodes ( 13 ). Five measurements were recorded for each side of the specimen.
Resistivity (R)
A Wenner probe, shown in Figure 2c, was used to measure each specimen’s resistivity (AASHTO T 358). The probe is used for concrete; however, past testing has shown it works with soils and base materials. The probe consists of four metallic probes, which operate at a frequency of 40 Hz, uses a current of 10 to 50 µ-amps, and outputs the resistivity in kiloohm centimeters. Resistivity is measured by sending an electrical current through the specimen via two outer electrodes, then by the voltage changes between the inner two electrodes within the electrical field created by the current ( 14 ). The average of five readings at 60° intervals around the circumference of the specimen was used.
Unconfined Compressive Strength (UCS)
The UCS (ASTM D2166) was obtained using an automated load test system, as shown in Figure 2d. The axial strain in the specimen is measured while the force is increased at a strain rate of 1% ( 15 ). After this test, the actual moisture content was obtained by weighing the crushed specimen and oven-drying it to get the dry weight.
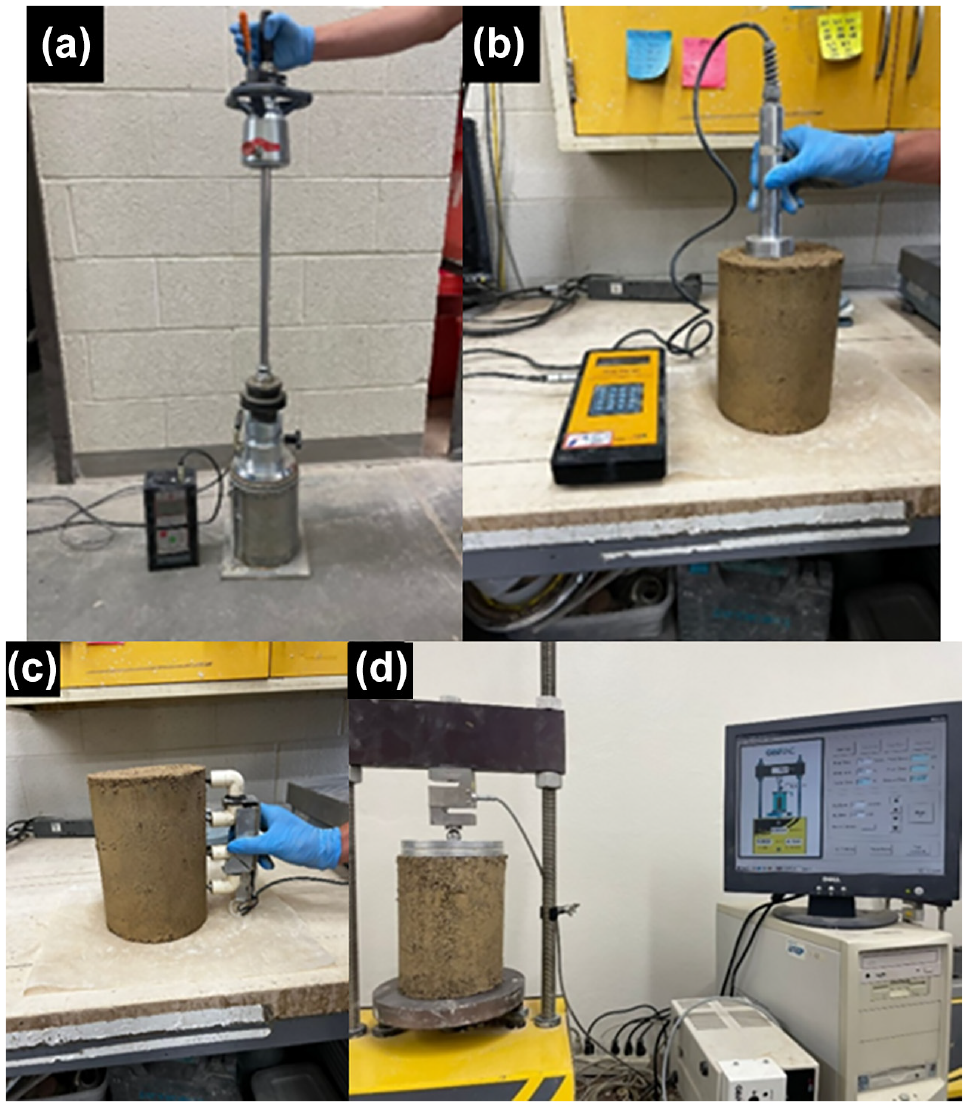
Measurement devices: (a) lightweight deflectometer, (b) dielectric constant, (c) resistivity, and (d) unconfined compressive strength.
Presentation and Discussion of Results
The original UGB, which was classified as well-graded gravels (GW), contained 4% passing the No. 200 sieve. The Atterberg limits of the materials were 18%, 15%, and 3% for the liquid limit, plastic limit, and plasticity index, respectively.
A stable gradation equates to a well-graded mixture consisting of particle sizes ranging from coarse to fine. This particle size distribution helps achieve good stability and compaction properties. Cooper et al. ( 16 ) proposed Equation 1 to establish stable gradations when the percentage of fine material passing the No. 200 sieve varies.
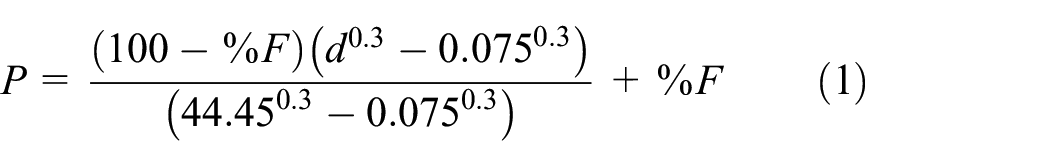
where P is the percentage passing per sieve, F is the percentage of material passing the No. 200 sieve, and d is the sieve opening in millimeters. Four different fines contents of 0%, 5%, 10%, and 20% were inputted into the equation to establish the percentage of materials for each sieve size as shown in Table 1. Figure 3 shows the grain size distributions for the four fines contents.
Summary of Index Properties of Geomaterials Used
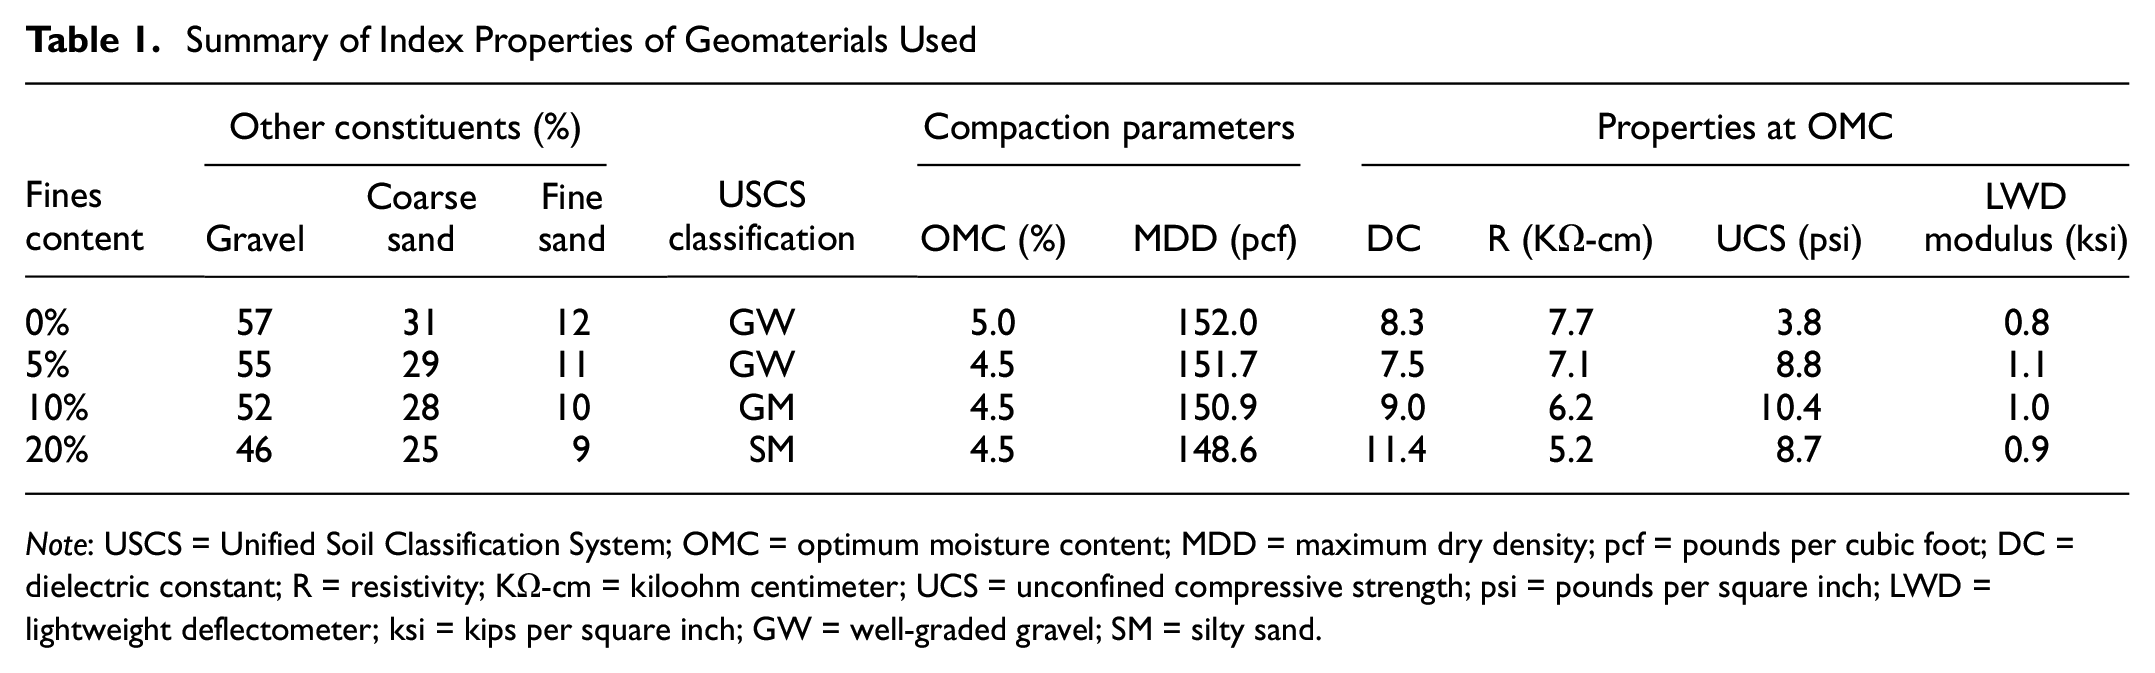
Note: USCS = Unified Soil Classification System; OMC = optimum moisture content; MDD = maximum dry density; pcf = pounds per cubic foot; DC = dielectric constant; R = resistivity; KΩ-cm = kiloohm centimeter; UCS = unconfined compressive strength; psi = pounds per square inch; LWD = lightweight deflectometer; ksi = kips per square inch; GW = well-graded gravel; SM = silty sand.
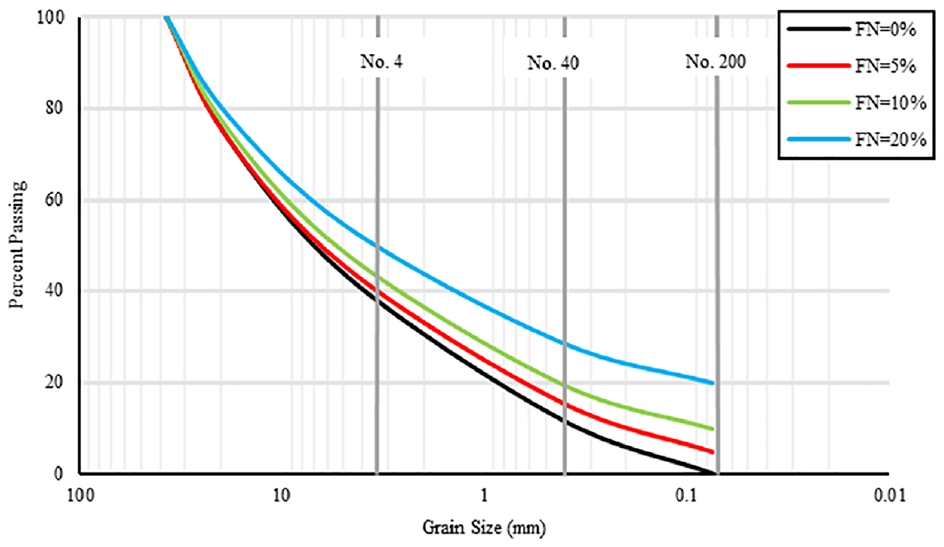
Gradation curves of geomaterial used.
A moisture content versus dry density graph was plotted for all four UGBs, shown in Figure 4a, to obtain each of the UGBs’ OMC and MDD which is shown above in Table 1. The error bars shown in Figure 4, c and d , represent ± 1 standard deviation for those tests that were replicated. As shown in Figure 4b, the LWD modulus peaks at its maximum value at around 3% to 3.5% moisture for all four UGBs and then decreases drastically until the OMC, after which the modulus is steadily similar through the wet specimens. The dielectric constant increases as the moisture content increases for all four UGBs, as shown in Figure 4c. Despite the high variability in the measurements, the dielectric constants consistently increase with increasing moisture content. Figure 4d shows that the resistivity has the opposite trend, as it decreases when moisture content decreases for each of the four UGBs. Higher variability is observed for the dry specimens. As moisture content increases in Figure 3e, the UCS values decrease. The strengths peak between the nominal 3% and 3.5% moisture for all four UGBs.
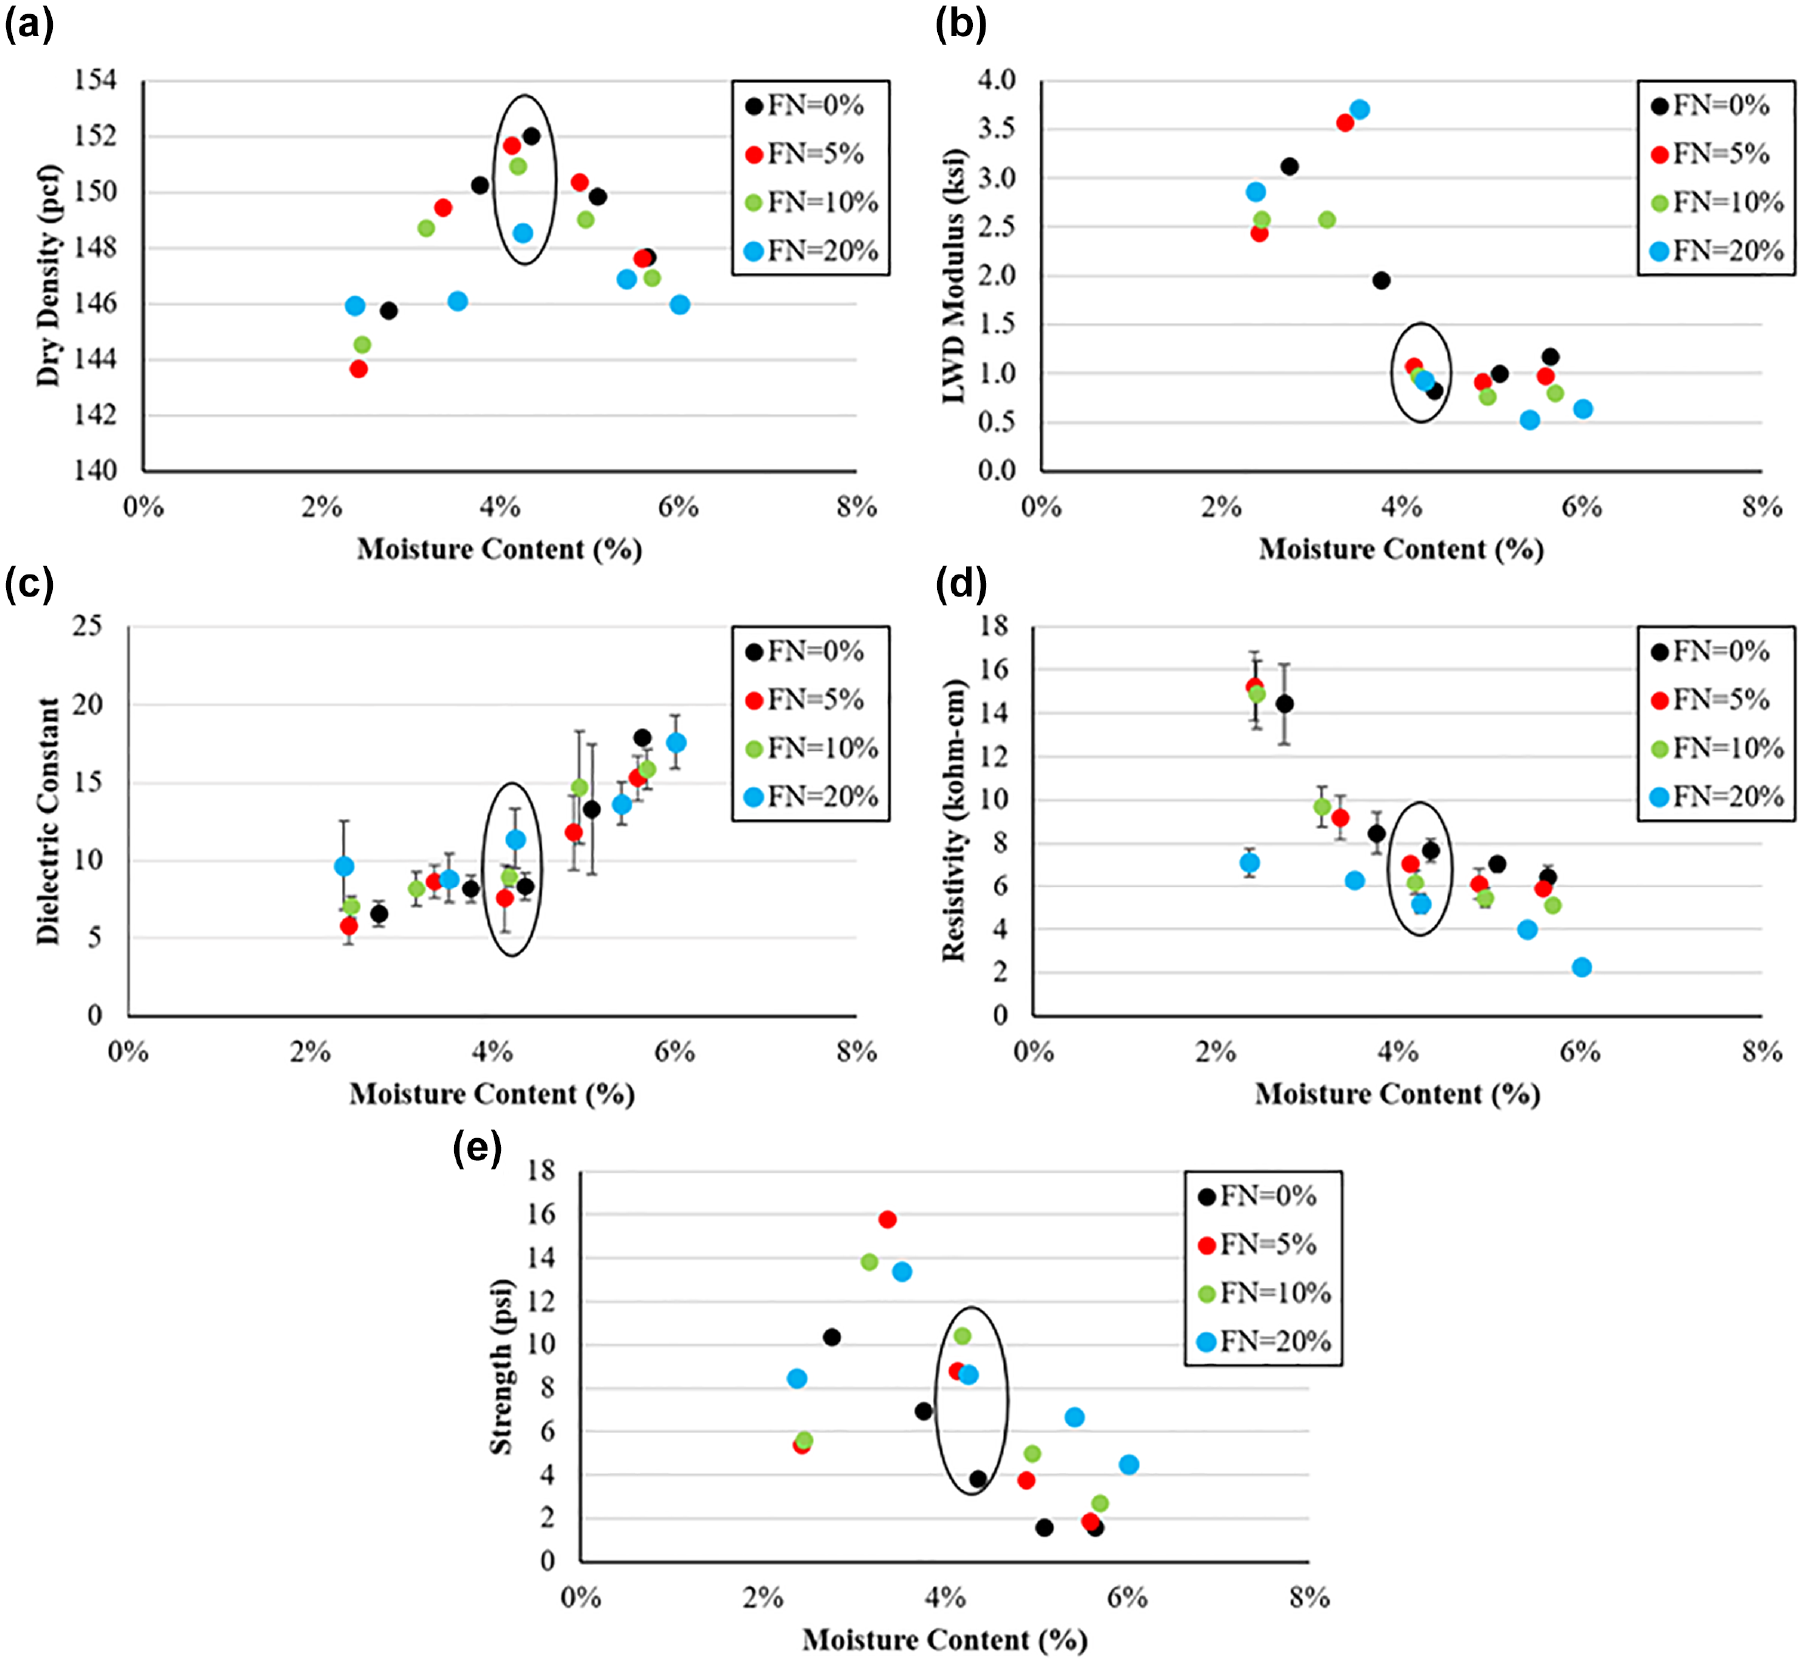
Variations of unbound granular base properties with moisture content for different fines contents. OMC specimens are circled: (a) moisture–density curve, (b) LWD modulus, (c) dielectric constant, (d) resistivity, and (e) unconfined compressive strength.
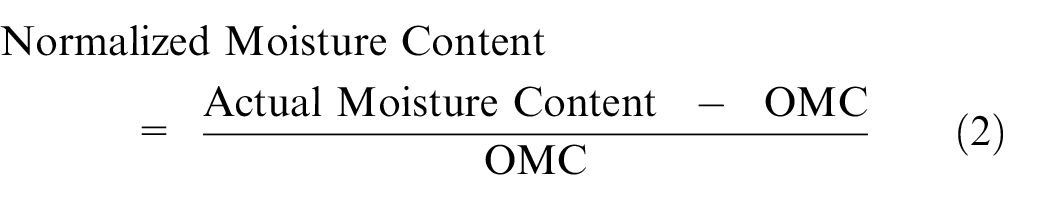
The normalized data are presented according to the proposed normalization process scheme in the NCHRP 10-84 ( 17 ). The ordinate (y-axis) parameters were normalized by dividing the given parameter at a given moisture content by the corresponding value at the OMC. The abscissa (x-axis) was normalized by using
The normalized data for the four UGBs tested are shown in Figure 5. As shown in Figure 5a, all moisture–density curves fall in a narrow band, except for one isolated case for the driest specimen. Figure 5b demonstrates the LWD normalized data. The specimens from different UGBs follow a similar pattern but with some dispersion. As shown in Figure 5c, the dielectric constant values exhibit a general increase in their magnitudes with the increase in moisture content. Figure 5d demonstrates that the normalized resistivity is sensitive to changes in moisture content. In this case, the results from different UGBs fall in a narrow band. Finally, normalized data for UCS can be seen in Figure 5e. All four blends follow the same pattern with a peak strength occurring dry of the OMC. The specimens prepared wet of OMC with 10% and 20% fines exhibited higher UCS than specimens prepared with 5% or less fines.
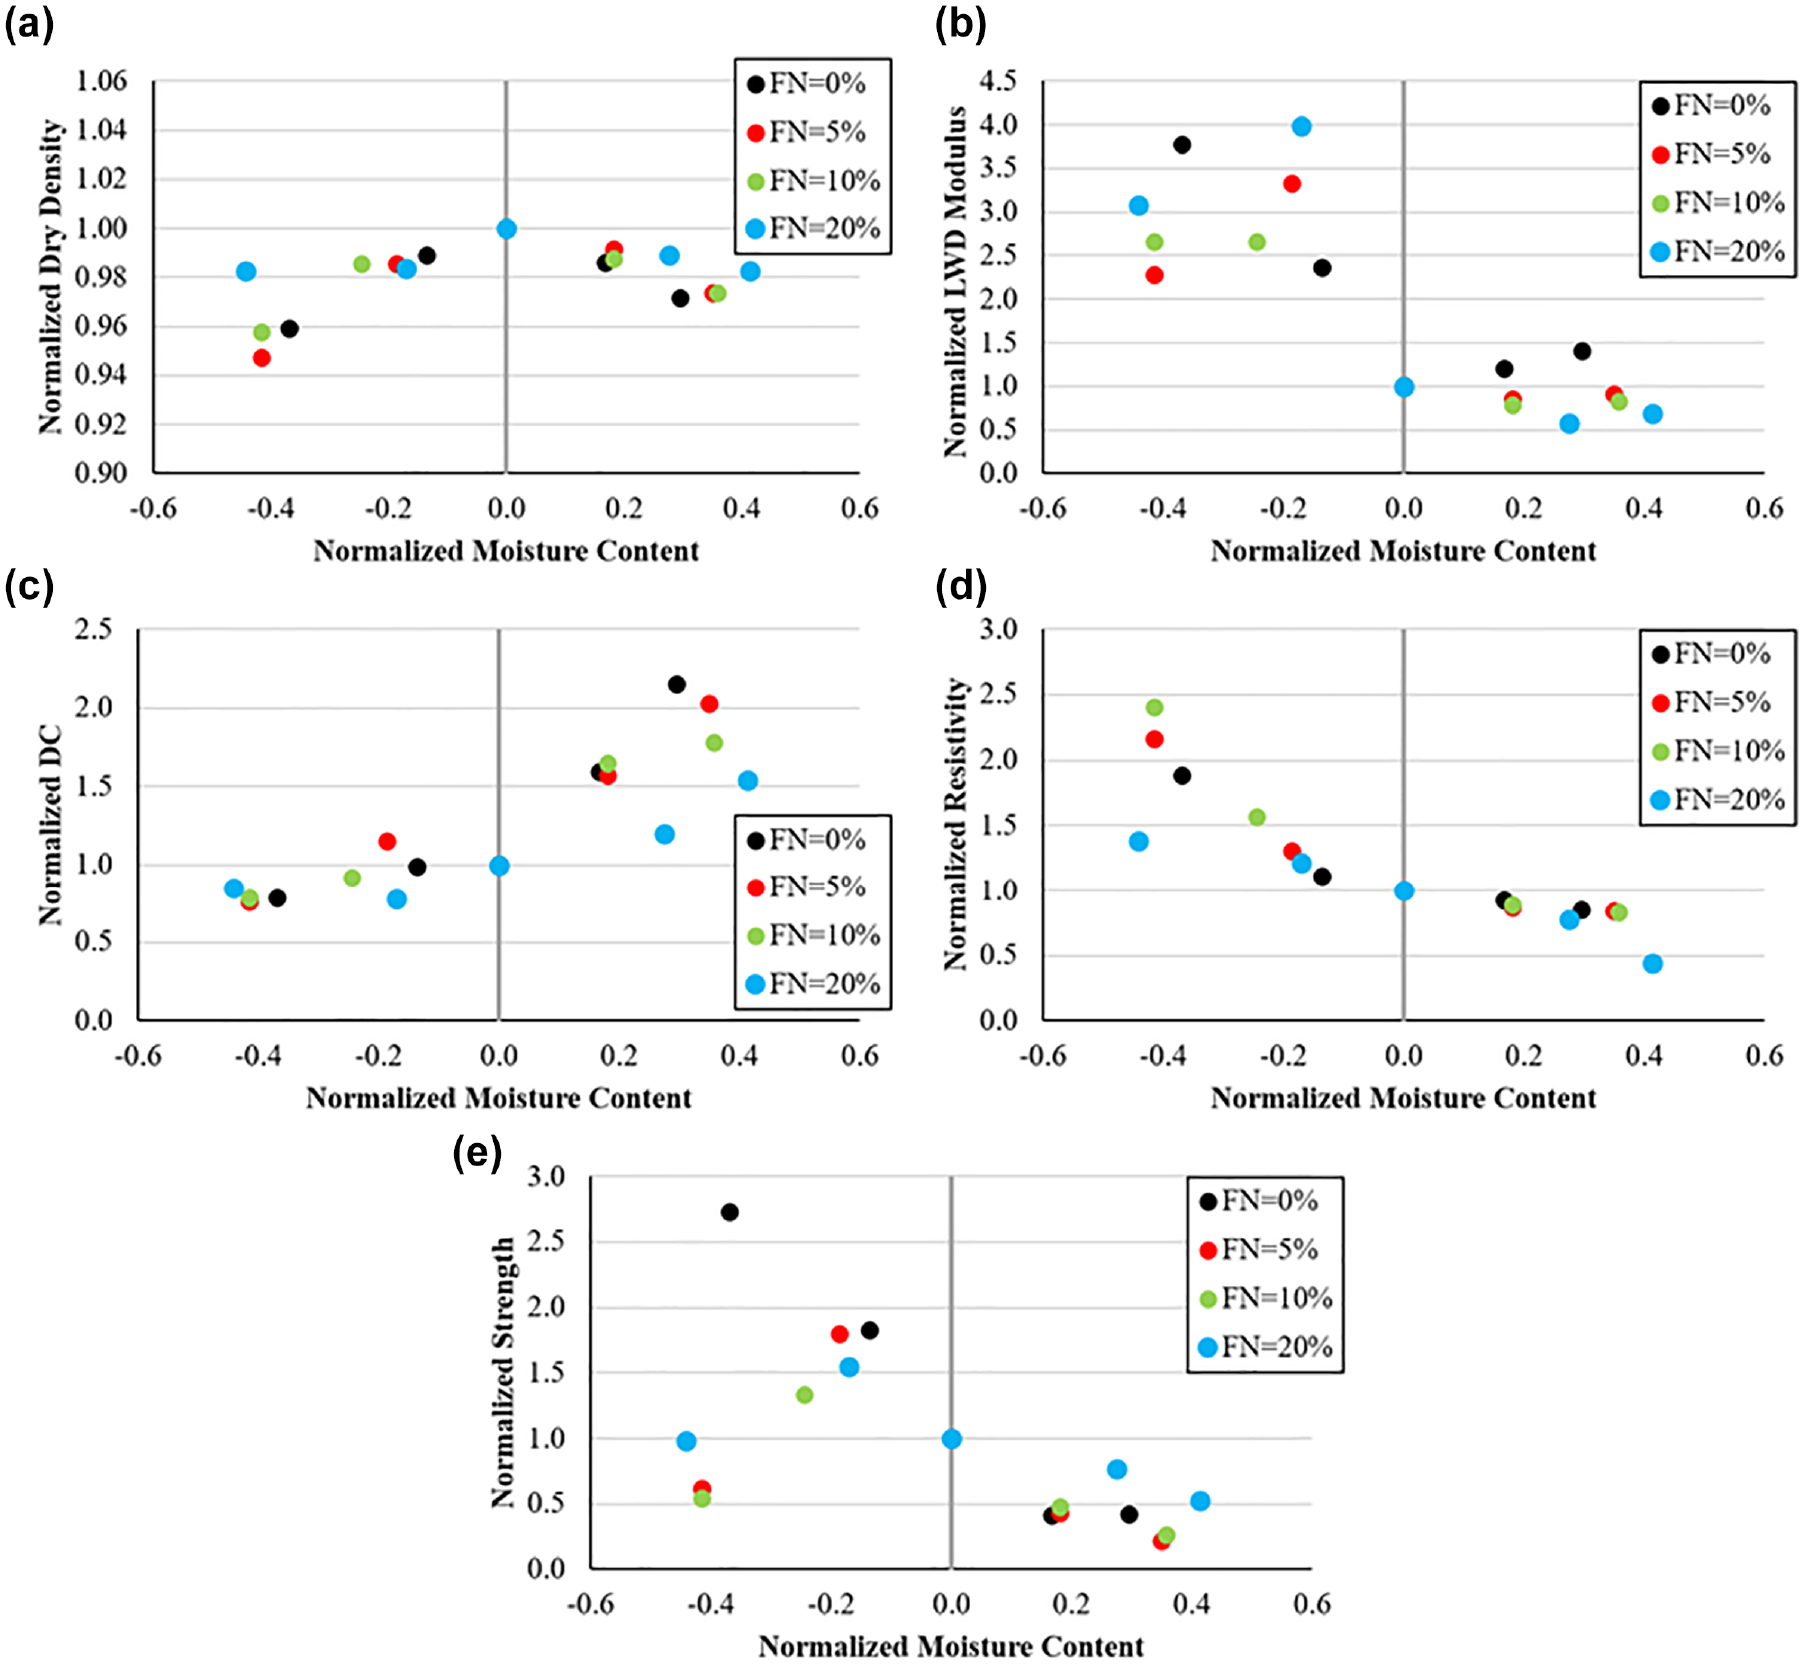
Variations of unbound granular base normalized properties with normalized moisture content for different fines contents: (a) normalized moisture–density, (b) normalized LWD modulus, (c) normalized dielectric constant, (d) normalized resistivity, (e) normalized unconfined compressive strength.
Conclusions
This study consisted of studying the variations of the properties of a compacted UGB with different percentages of fines. The gradation of a UGB was perturbed by adding different percentages of fines to study their electromagnetic, electrical, and mechanical properties with moisture content. The impact of fines content on the laboratory LWD modulus, dielectric constant, resistivity, and UCS results at different moisture contents were established. The following conclusions can be drawn from this study:
The dielectric constant measured with a Percometer increased with an increase in moisture content.
Resistivity measured with a Wenner probe decreased with an increase in moisture content and decreased with an increase in fines content.
The UCS increased with an increase of moisture and peaked at around 3%–3.5% moisture content, after which point the strength decreased as moisture increased.
The 5% and 10% fines content showed the best trends throughout the various measurements, where “best trends” is defined as the gradation with the most consistency among the various moisture contents and measurements.
The LWD modulus decreased with an increase in moisture content and the change plateaued to very small values for specimens prepared wet of OMC.
Regardless of the geomaterial, the normalization scheme aids in condensing the variations of the parameters with moisture content into narrow bands for simpler analysis.
As the percentages of fines in UGBs seem to significantly affect their properties as pavement foundations, further work with finer increments than those reported would be desirable.
Footnotes
Acknowledgements
The authors express their appreciation to Karen Febey and the TRB Minority Student Fellowship program for the opportunity to write this paper. The authors recognize those who contributed to the findings of this paper. Soheil Nazarian, CTIS Director, is acknowledged for his guidance and support. The authors acknowledge Mark Baker for the concept of the project. Appreciations are extended to all involved and those who supported the work in this paper.
Author Contributions
The authors confirm contributions to the paper as follows: study conception and design: S. Nazarian and M. Baker; data collection: S. Morales, I. Zuniga; analysis and interpretation of results: S. Morales, I. Zuniga; draft manuscript preparation: S. Morales, I. Zuniga. All authors reviewed the results and approved the final version of the manuscript.
Declaration of Conflicting Interests
The author(s) declared no potential conflicts of interest with respect to the research, authorship, and/or publication of this article.
Funding
The author(s) disclosed receipt of the following financial support for the research, authorship, and/or publication of this article: The data from this paper is part of a research project funded by the Minnesota Department of Transportation (MnDOT) through the National Road Research Alliance (NRRA).