
Abstract
Pavement skid resistance is critical for public safety, especially in wet-weather conditions. In Texas, as the population grows and the likelihood of wet-surface crashes and fatalities increases, the use of Surface Aggregate Classification A (SAC-A) aggregate has significantly increased each year to improve pavement skid resistance. Texas Department of Transportation specifications allow for the use of reclaimed asphalt pavement (RAP) to conserve natural resources and save costs. However, the impact of RAP on the skid resistance of the surface mixture was unknown or not quantitatively studied. Currently, all RAPs are categorized as Surface Aggregate Classification B aggregate in Texas. This study proposed a method of quantitatively evaluating the skid resistance of RAP aggregate using a dynamic friction tester (DFT). The DFT test results (friction numbers) for RAP and raw aggregate were combined according to their gradations and stockpile percentages in the mixture design, called “blended-DFT,” to predict the skid resistance of the surface mixture. Twenty asphalt mixtures with different RAP types and percentages were designed and tested to study the impact of RAP on mixtures’ skid resistance. The researchers found that adding high skid-resistant RAP increases the mixture slab DFT values, while low skid-resistant RAP decreases the slab DFT values. This confirms the potential of using high skid-resistant RAP to conserve SAC-A raw aggregate resources. A preliminary DFT threshold for RAP to be rated as SAC-A aggregate was proposed in this study.
Keywords
Pavement skid resistance is critical for public safety in wet-weather conditions. Crashes on wet pavements are related to inadequate pavement skid resistance. To improve pavement skid resistance, the use of Surface Aggregate Classification A (SAC-A) aggregate has increased each year significantly to meet the friction demand of pavements. This demand will be even greater as the population of Texas grows and the likelihood of wet-surface crashes and fatalities increases. It is important for the Texas Department of Transportation (TxDOT) to develop specifications, methods, and means to conserve the existing SAC-A resources. TxDOT specifications allow for the use of reclaimed asphalt pavement (RAP) to conserve natural resources and save costs. The use of RAP will only increase since both TxDOT and the industry are proponents of using recycled materials. Unknown is the contribution of RAP to the skid resistance and friction of the pavement surface, especially when pavements constructed with SAC-A aggregates are reclaimed and used for production. These RAP materials may potentially help reduce the need for raw SAC-A aggregates. Intuitively, RAP must have some contribution to friction, but this contribution has not been evaluated or quantified.
The main objectives of this paper are to evaluate the impact of RAP on the skid resistance of surface mixtures quantitatively and to determine the potential of conserving SAC-A resources by using RAP. To accomplish the abovementioned objectives, this paper first reviews the current knowledge and practice of using RAP in surface mixes and then introduces the methodology of this study. After that, both aggregate and mixture tests are described, and the corresponding results are presented and analyzed. Finally, a summary and conclusions are made.
Review of the Current State of the Knowledge and Practice of Using Reclaimed Asphalt Pavement in Surface Mixes
TxDOT maintains a program during surface aggregate selection to ensure that pavements with good skid-resistant characteristics are used. This program is referred to as the Wet Surface Crash Reduction Program (WCRP). A key step of the WCRP is aggregate selection. The TxDOT Material and Testing Division, Soils and Aggregates Section (MTD/SA) is responsible for using the aggregate classification criteria and listing the results in the Bituminous Rated Source Quality Catalog (BRSQC) every six months. Frictional and durability indicator tests (such as acid insolubility, soundness, crushed faces, and micro-Deval) are used to classify the aggregates. Currently, no friction-related test is required for RAP; all RAP is categorized as Surface Aggregate Classification B (SAC-B) aggregate. The asphalt mixture is usually composed of aggregates from different sources and with different stockpile percentages. Texas Standard Specifications for Construction and Maintenance of Highways, Streets, and Bridges (
1
) specify the following: Class B aggregate may be blended with a Class A aggregate to meet requirements for Class A materials. Ensure that at least 50% by weight, or volume if required, of the material retained on the No. 4 sieve comes from the Class A.
The Mississippi Department of Transportation (DOT) funded the laboratory investigation of high RAP content pavement surface layers carried out by Doyle and Howard ( 2 ) in 2010. This research effort aimed to examine the possibility of decently high (≈25%–50%) RAP content as surface blends and overlays. One of the tasks performed was to test the frictional resistance and surface texture of mixtures with varying RAP content fabricated with the linear asphalt compactor. To assess the potential impacts on skid resistance by incorporating high quantities of RAP in surface blends, three blends were tried that included 0%, 50%, and 100% RAP. One-factor analysis of variance tests were performed to assess the importance of RAP levels in estimating pavement friction. RAP was not found to have a statistically significant effect on pavement friction parameters at a 95% confidence level for both response variables.
In 2012, the Joint Transportation Research Program (JTRP) project supported by the Indiana DOT and Purdue University evaluated the impact of RAP on pavement surface frictional properties ( 3 ). In this study, laboratory-fabricated RAP and field-sampled RAP were mixed with surface mixtures at different RAP percentage levels. The laboratory testing showed that the addition of poor-quality RAP materials did affect the mixtures’ friction properties and cracking resistance, but that lower amounts of RAP had little effect. The frictional performance of the laboratory-fabricated and field-sampled RAP materials was acceptable at a content of 25% but was questionable at 40%.
In Spain, another research study was conducted by Lizárraga et al. ( 4 ) to evaluate the mechanical performance, in laboratory and in situ, of two mixtures containing high RAP contents (70% and 100%). Both mixtures presented similar skid resistance values to those obtained in the conventional HMA mixture. In general, the 70% RAP mixture exhibited the highest percentage of skid resistance (64%) four months after the compaction of the mixtures. This result can be attributed to the mixture produced with the coarse RAP fraction being obtained from in-service road pavement sections. The polished stone values could have been higher than those exhibited by the RAP obtained from the urban test section.
One research study was carried out by White ( 5 ) to quantify the impact of RAP on airport asphalt surfaces in Australia. This research created two diverse asphalt blends with and without RAP. All asphalt blends were intended to be thick reviewed and Marshall-planned 14 mm ostensible nominal maximum aggregate sized. The RAP of the first mixture was recovered from texturing of the underlying layer and removal of temporary ramps and was used to surface a runway catering to B737-800-sized aircraft. The RAP of the second mixture was recovered from the removal of temporary ramps and was used to surface a runway accommodating turboprop and regional jet aircraft. Friction testing was performed along the full length of the runway surface developed with the first mixture at two speeds: 65 and 95 km/h. The friction testing results indicated that the addition of RAP was associated with a significant reduction in the measured surface friction at both 65 and 95 km/h test speeds. For example, the 95 km/h average friction result decreased from 0.55 to 0.47 where RAP was included. The reduction in friction was observed despite the measured surface texture being unaffected.
Kowalski et al. ( 6 ) developed a polishing model to estimate the terminal friction level (referred to as F60 @ X1). X1 represents the number of wheel passes at which the terminal friction level is reached, and F60 is the friction number at 60 km/h. McDaniel et al. ( 3 ) used this model to quantify changes in the F60 @ X1 values of the RAP mixture in the JTRP study Evaluation of Reclaimed Asphalt Pavement for Surface Mixtures. Their results showed that adding RAP influences friction, as seen in Figure 1. The more RAP material is added, the lower the friction value becomes. This general trend can be observed for both dense-graded asphalt (DGA) and stone matrix asphalt (SMA) mixtures. For SMA mixtures, the changes in the F60 @ X1 values generally decrease linearly, while for the DGA mixtures, the F60 drops more between samples with RAP contents of 15% and 25% than between 0% and 15% or 25% and 40%. Note that the RAP in this study was laboratory-fabricated using poor-quality aggregate (for friction) to represent a “worst case.”
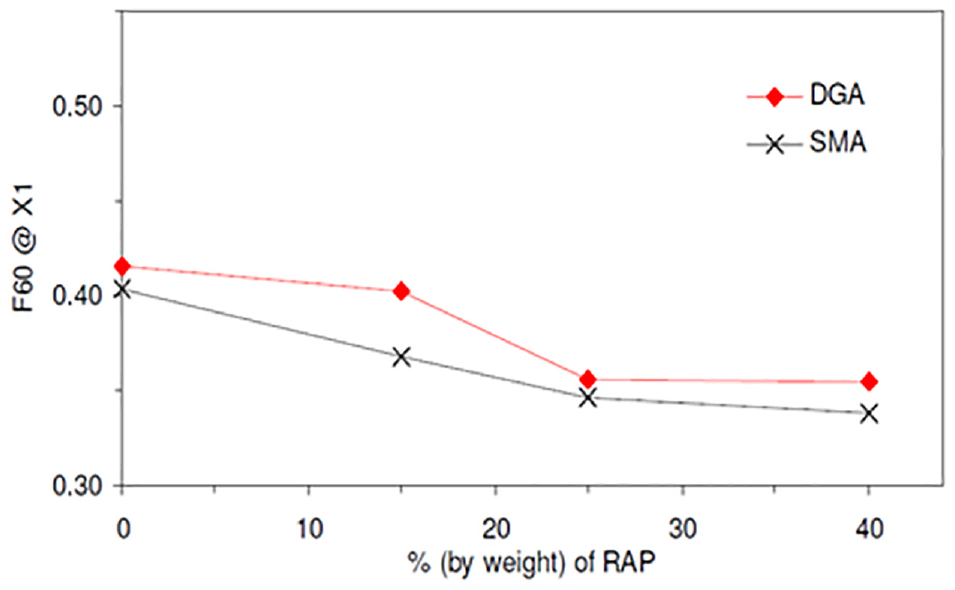
Distribution of the friction terminal value (F60 @ X1).
Overall, various states have guidelines for RAP usage, the percentage allowed in the surface mixes, and the aggregate gradation policy. These studies have concluded that the friction and durability performance of asphalt surface courses with 10%–25% RAP performed well under low traffic. However, no research was currently found that investigates the skid resistance (or texture) of the RAP aggregate itself or categorizes RAP aggregates like other raw aggregates (e.g., SAC-A or SAC-B). The potential positive impact of high skid-resistant RAP on surface mixtures is unknown or not quantitatively studied.
Methods and Sample Preparation
To study the impact of RAP on the skid resistance of asphalt mixes and develop the SAC rating for RAP materials, the researchers designed a test matrix and considered the following factors.
Two RAP types were used, one milled from Texas State Highway (SH) 37 pavement, known as a SAC-A material, and the other laboratory-produced RAP using low-friction aggregate with the same gradation as SH 37 RAP. For convenience, in this study, they are also called SAC-A RAP and SAC-B RAP, respectively.
Three RAP amounts were used: 0%, 15%, and 30%.
Four surface mixture types were used. During this study, the researchers collected the raw aggregates for mixtures used in several Texas test sections, such as Farm Road (FM) 356 in Lufkin District, Interstate Highway (IH) 20 in Atlanta District, and IH 10 in Atlanta District. In addition, the raw aggregates of one typical Superpave D (SP-D) mixture in Texas were also collected. Each mix type was redesigned to incorporate the above two RAP types and three RAP amounts.
Thus, the combination led to 20 different asphalt mixtures, since each mix type has five variations: 0% RAP, 15% SAC-A RAP, 30% SAC-A RAP, 15% SAC-B RAP, and 30% SAC-B RAP. Among them, the gradation of the redesigned FM 356 mixtures and IH 10 mixtures were Superpave C, the redesigned IH 20 mixtures were dense-graded Type D, and the others were SP-D.
To quantify the impact of RAP, the mixtures must be carefully designed and controlled. Note that the SAC-B RAP is laboratory produced to have the same gradation as the SAC-A RAP (SH 37 RAP). For RAP mixture design, when adding RAP into the mixture, the percentages of other aggregate stockpiles must be adjusted to maintain the same final gradation. Using the same gradation of “good” and “bad” RAP, the adjustment to the other aggregate stockpile percentages is the same. For example, the mixture with 15% “good” RAP and 15% “bad” RAP has the same aggregate stockpiles and percentages. The only difference between them is the RAP type. If a difference in skid resistance exists between them, the only cause must be the RAP type, not the other factors, such as the difference of other aggregates. In addition, the combined gradation was designed to be the same (or very close) among different RAP percentages for each surface mix type.
The researchers first evaluated all the raw and RAP aggregates involved in these mixtures. These evaluations include the micro-Deval abrasion and dynamic friction tester (DFT) tests. The ignition oven test was performed for RAP material to remove the asphalt binder.
Next, two slabs (500 mm × 400 mm × 50 mm) were fabricated and investigated for each mixture. Three-wheel polishing, DFT, and circular track meter (CTM) tests were performed. The polishing on each slab went through 115,000 cycles. The researchers stopped the polishing at 500, 1500, 3000, 6000, 10,000, 15,000, 25,000, 40,000, 60,000, 85,000, and 115,000 cycles to conduct the DFT and CTM tests. Then the aggregate blended DFT values were determined according to the aggregate gradation and stockpile percentage information for each mixture. By comparing the aggregate blended DFT with the mixture slab DFT, the relationship of skid resistance with the aggregate and the mixture was developed. Further, the impact of RAP aggregate DFT on the aggregate blended DFT and the mixture slab DFT could be quantified.
Laboratory-Produced RAP Preparation
The procedure described by McDaniel et al. ( 3 ) was followed to produce the RAP in the laboratory. The researchers identified that combining two limestone stockpiles (one Type F rock and one limestone screenings stockpile) could produce blends with the same gradation as SH 37 RAP. The aggregates were sieved into each sieve size and blended according to the desired percentages of SH 37 RAP. After mixing with binder and conditioning for short-term oven aging, the mixture was left in an 85°C (185°F) oven for 120 h to simulate aging over the pavement’s service life. After this exposure, the mixture was cooled and remixed in the bucket mixer to be separated into smaller particles. The laboratory-produced RAP was then stored in closed containers for future use. The laboratory-produced RAP simulates a “worst” RAP case with respect to skid resistance.
Aggregate Ring-Shaped Specimen Preparation
Aggregates need to be arranged in a circular shape (or “ring” shape) for the DFT test. The researchers followed the procedure proposed by TxDOT MTD/SA ( 7 ). A high-density polyethylene (HDPE) template is needed. This template has a depth of 1/2 in. (12.7 mm) and has a 1-in. (25.4-mm) wide circular channel. The outer diameter of the circular channel is 12 in. (305 mm). Before filling the channel with polyester, debonding grease was applied to the surface of the channel so the ring could be easily removed from the HDPE template after testing. Then a ratio of 0.8 lb (351 g) of polyester (filler) to 0.06 oz (1.7 g) methyl ethyl ketone peroxide (hardener) was mixed and poured into the channel. This ratio allows enough time to place and roll the aggregates before the polyester sets. After that, a 1/8-in. (3.18-mm) notched-out plastic spatula was used to remove the excessive polyester to a level of approximately 1/8 in. (3.18 mm) below the surface of the HDPE template. Next, the HDPE template was placed on a turntable and slowly rotated while the aggregates were deposited with a scoop of the same width as the channel. Aggregate particles were then manually placed in areas of the ring that did not receive a tight arrangement of aggregates. Further, a hard rubber roller, wider than the ring, was rolled over the full circumference of the ring until the aggregate was flush with the surface of the HDPE template. Finally, the ring-shaped specimen was left to cure for about 1 h before testing. Figure 2 shows the main steps.
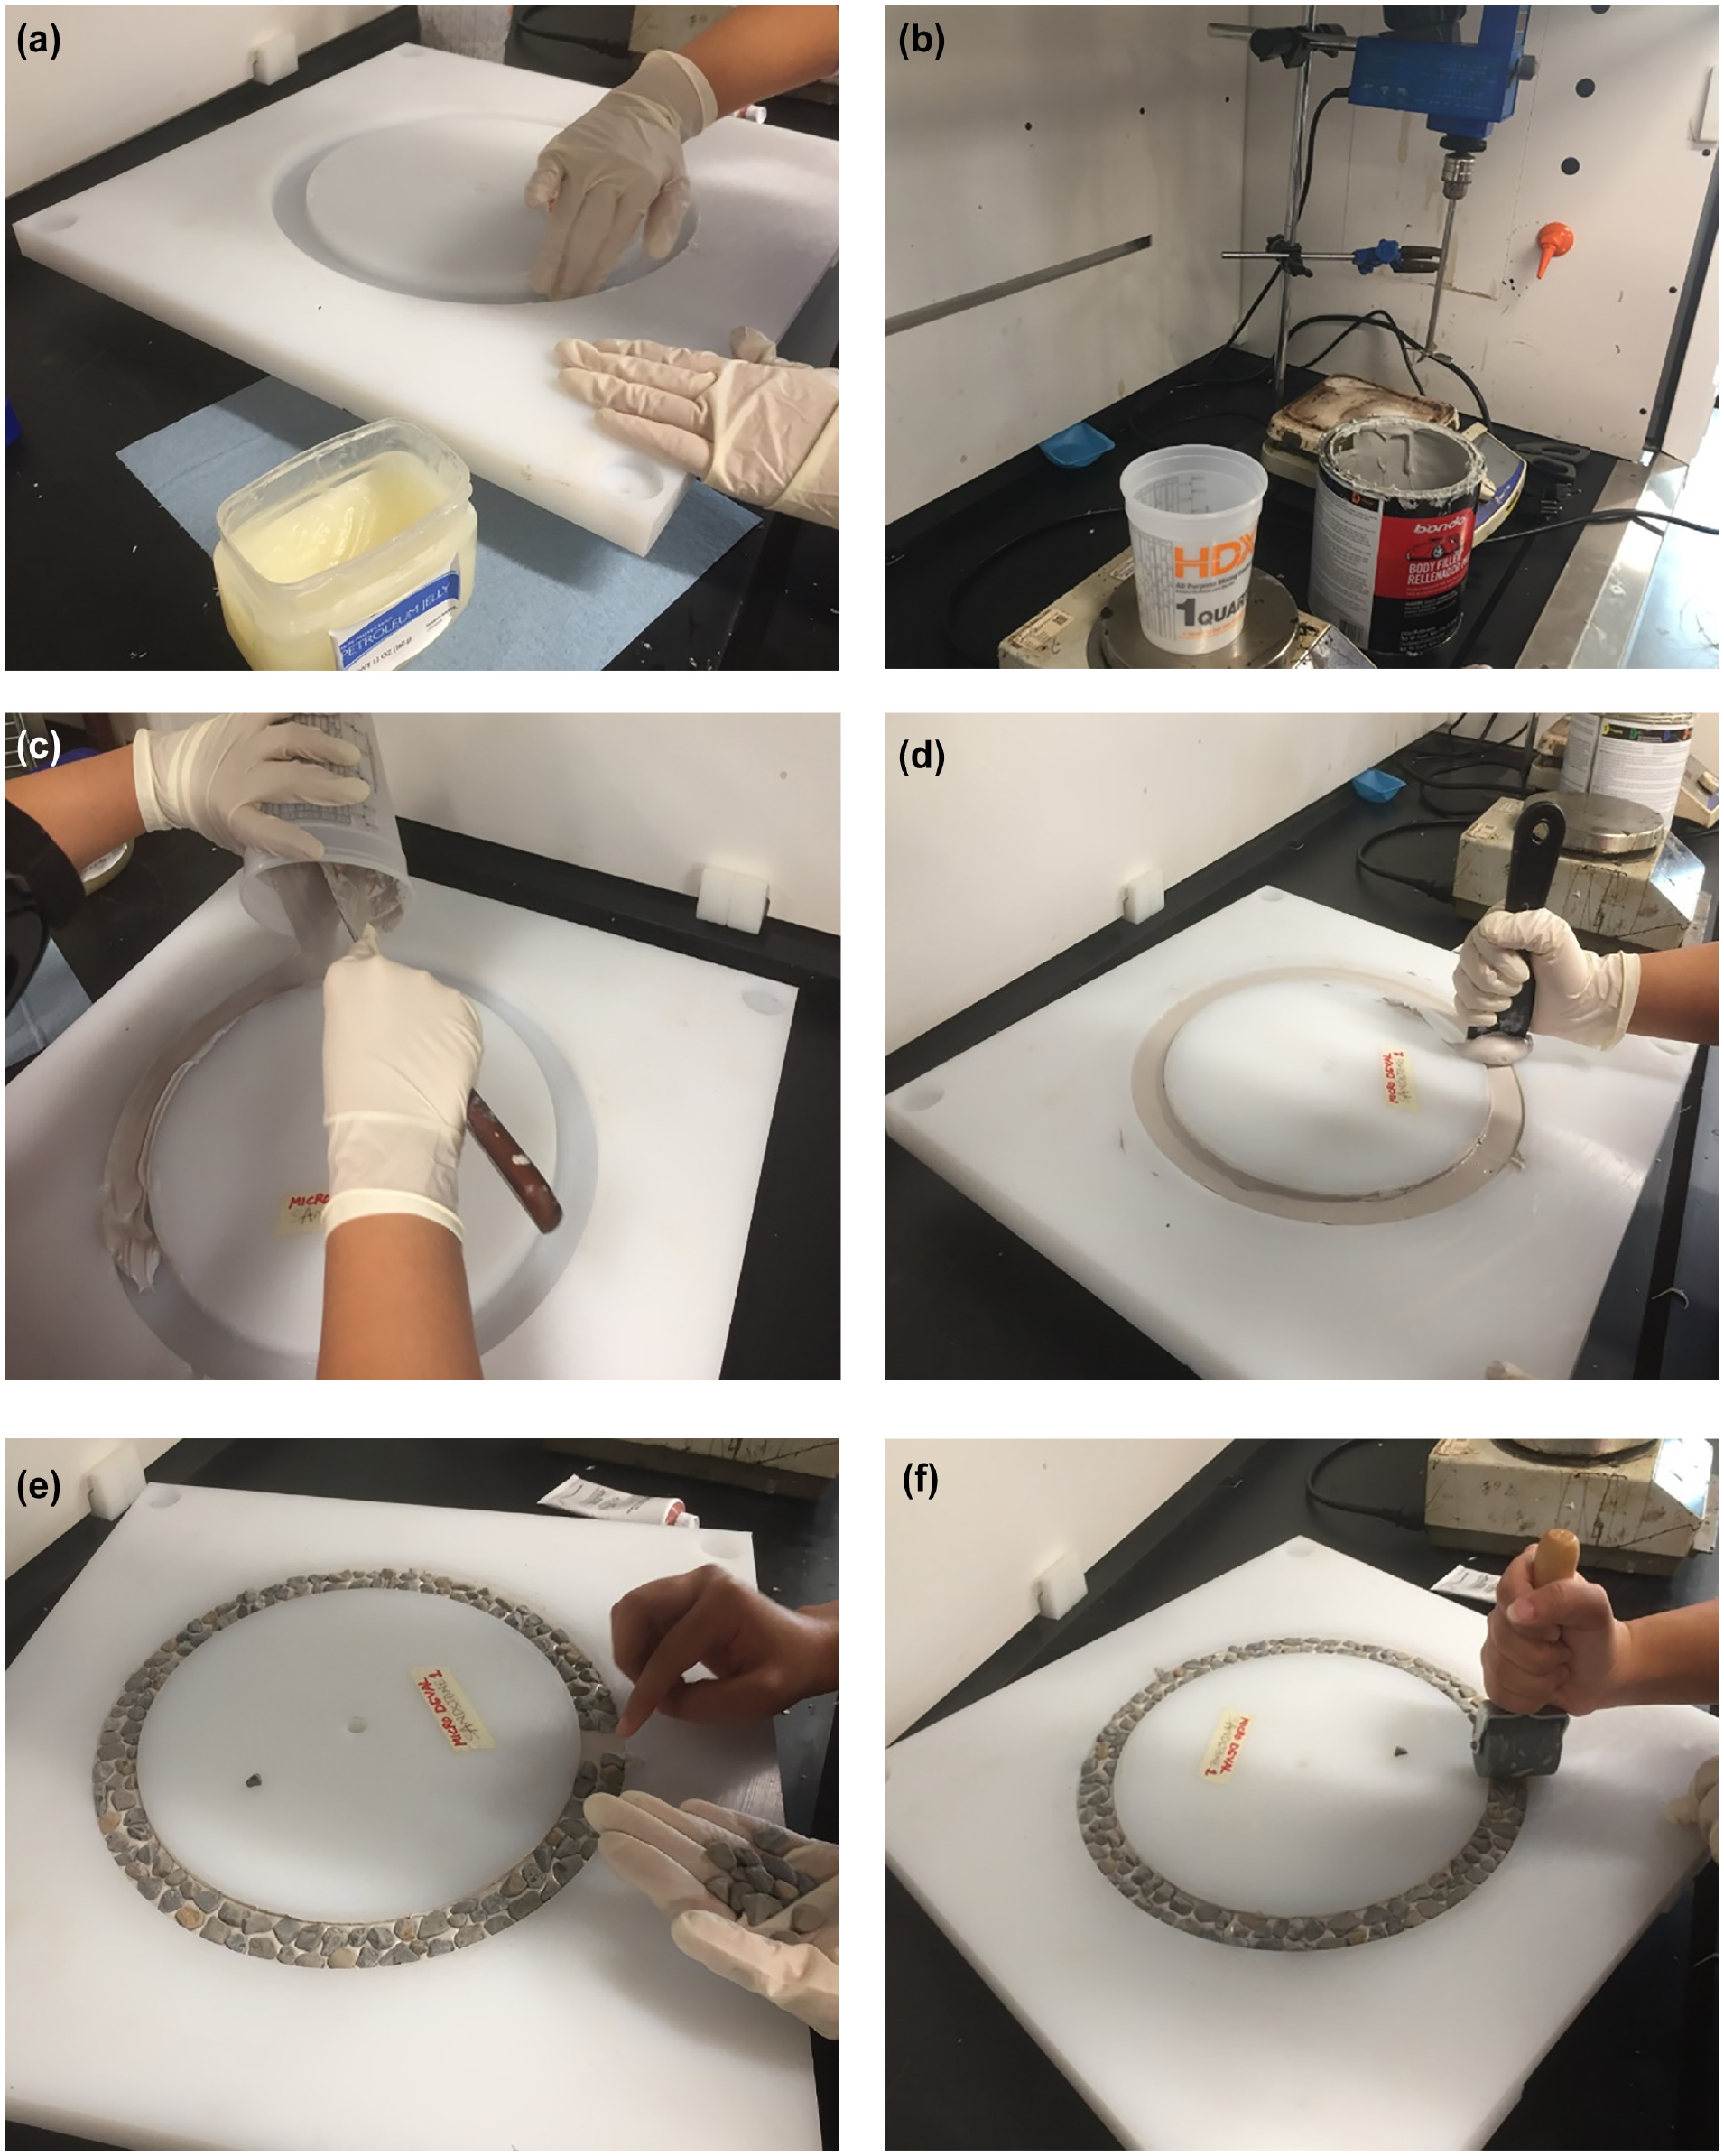
Aggregate ring specimen preparation steps: (a) apply grease, (b) weigh and mix filler and hardener, (c) pour the polyester, (d) use a notched spatula to remove excessive polyester, (e) place aggregate particles, and (f) roll over the surface.
The aggregate size selected for preparing the ring specimen passes a 3/8-in. sieve and retains on a 1/4-in. sieve. Both the aggregates before micro-Deval abrasion (BMD) and after micro-Deval abrasion (AMD) were used to fabricate aggregate rings so that the test results could be compared between BMD and AMD. Aggregates having similar BMD DFT values may have significantly different AMD DFT values. Having both the BMD and AMD DFT values provides an opportunity to look at the relationship between aggregates and mixture slabs at different polishing stages.
Mixture Slab Preparation
Mixture slabs were fabricated to provide a pavement-like surface to measure the texture and friction of the asphalt mixture. An asphalt roller compactor was utilized following the ASTM D8079-16 standard ( 8 ). The dimensions of the rigid specimen mold permit the compaction of a 500 mm × 400 mm asphalt mixture slab specimen. The mass of the total asphalt mixture needed to achieve the desired height (50 mm) is calculated according to the theoretical maximum density and the target air voids (7% ± 1%).
Tests
The following describes the tests performed in this study.
Micro-Deval Abrasion
The micro-Deval abrasion test was performed following the standard test method Tex-461-A ( 9 ). The procedure requires a 1500 ± 5 g sample of aggregates that has been sieved, washed, and oven-dried to constant weight at a temperature of 110°C. The container used for testing is prepared by adding 5000 ± 5 g of stainless steel balls. These balls are placed before putting the aggregate test sample in the container to minimize abrasion. After introducing the aggregate sample, 2000 ± 500 ml of water is poured into the container to saturate the sample for a minimum of 1 h. After saturation, the container is placed on its side in the micro-Deval apparatus and tested at 100 ± 5 rpm for 105 ± 1 min.
After the established test time, all material passing sieve No. 16 is removed. The remaining aggregate is oven-dried overnight at 230°F (110°C) and weighed after verifying the drying. The difference between the initial aggregate sample weight and oven-dried weight after the micro-Deval test procedure is used to calculate the percent loss caused by abrasion.
Three-Wheel Polishing on the Mixture Slab
The three-wheel polishing test simulates the polishing of asphalt pavement surfaces caused by vehicular traffic. Figure 3 shows the three-wheel polishing device. The device has three patterned pneumatic tires and can exert 146 ± 5 lb force through the tires to the test surfaces. The driving mechanism for the vertical shaft is an electric motor geared to rotate the shaft and wheel assembly at a speed of 60 ± 5 rpm. The automatic counter can shut off the machine at a predetermined number of revolutions. The test procedure followed was AASHTO PP 104-20 ( 10 ). One polish cycle equals one 360-degree revolution of the three-wheel carriage. A National Center for Asphalt Technology (NCAT) report ( 11 ) indicates that the slabs with 100,000 and 150,000 cycles of polishing had similar friction coefficients (the statistical p-value was 0.827 between the two groups, which is larger than 0.05 and means the difference between the groups is not significant). Therefore, it was suggested that polishing slabs for 100,000 cycles was adequate to achieve the terminal friction coefficient. In this research, the maximum number of polish cycles for each slab was 115,000.
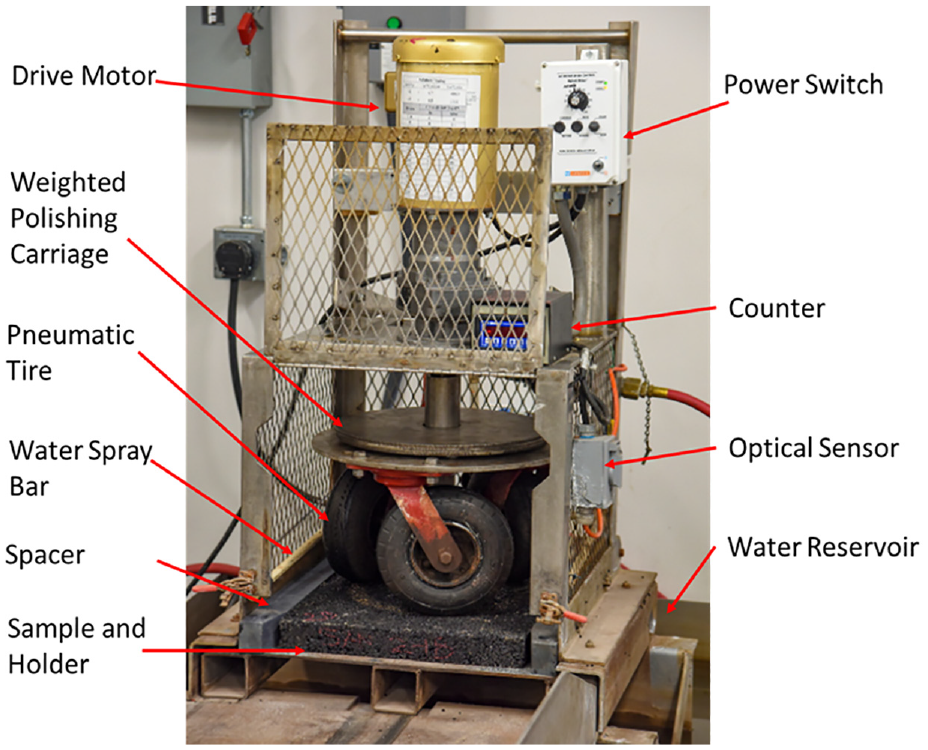
Three-wheel polishing device.
DFT Test
The DFT test was performed on both aggregate ring specimens and mixture slabs. The DFT device consists of a horizontal spinning disk fitted with three spring-loaded rubber sliders (each slider’s length is 0.75 in., width is 0.625 in., and height is 0.25 in.). Water is sprayed in front of the sliders, and a constant load is applied to the slider as the disk rotates on the test surface. The torque is monitored continuously as the disk’s rotational velocity drops because of the friction between the sliders and the test surface. The torque is then used to calculate the surface friction coefficients. The specification followed was ASTM E1911 ( 12 ). Since the HDPE template was designed to fit the DFT equipment for the aggregate ring DFT test, the three rubber sliders will align with the aggregate ring surface once the DFT device feet fit in the foot cups on the HDPE template. A hard plastic frame was fabricated to help support and properly position the DFT device for the mixture slab DFT test.
Three repeated runs were conducted for each DFT test. The results obtained from the DFT were used to estimate the surface friction at different speeds. This research selected two speeds, 20 and 60 km/h, to describe the DFT numbers at high and low speeds. These parameters were estimated as the average of the three repeated runs at the corresponding speed. Using the average instead of a single value provided a more robust analysis and increased confidence in the results. Figure 4 shows the DFT device on aggregate rings (Figure 4a) and mixture slabs (Figure 4b), and an example of measured friction numbers (Figure 4c). Figure 4c shows the high repeatability of this test based on the three repeated runs at each speed. In this study, the researchers did not find significant differences between using the DFT at 20 and 60 km/h for analysis. Therefore, only the results of the DFT at 20 km/h are presented later in this paper.
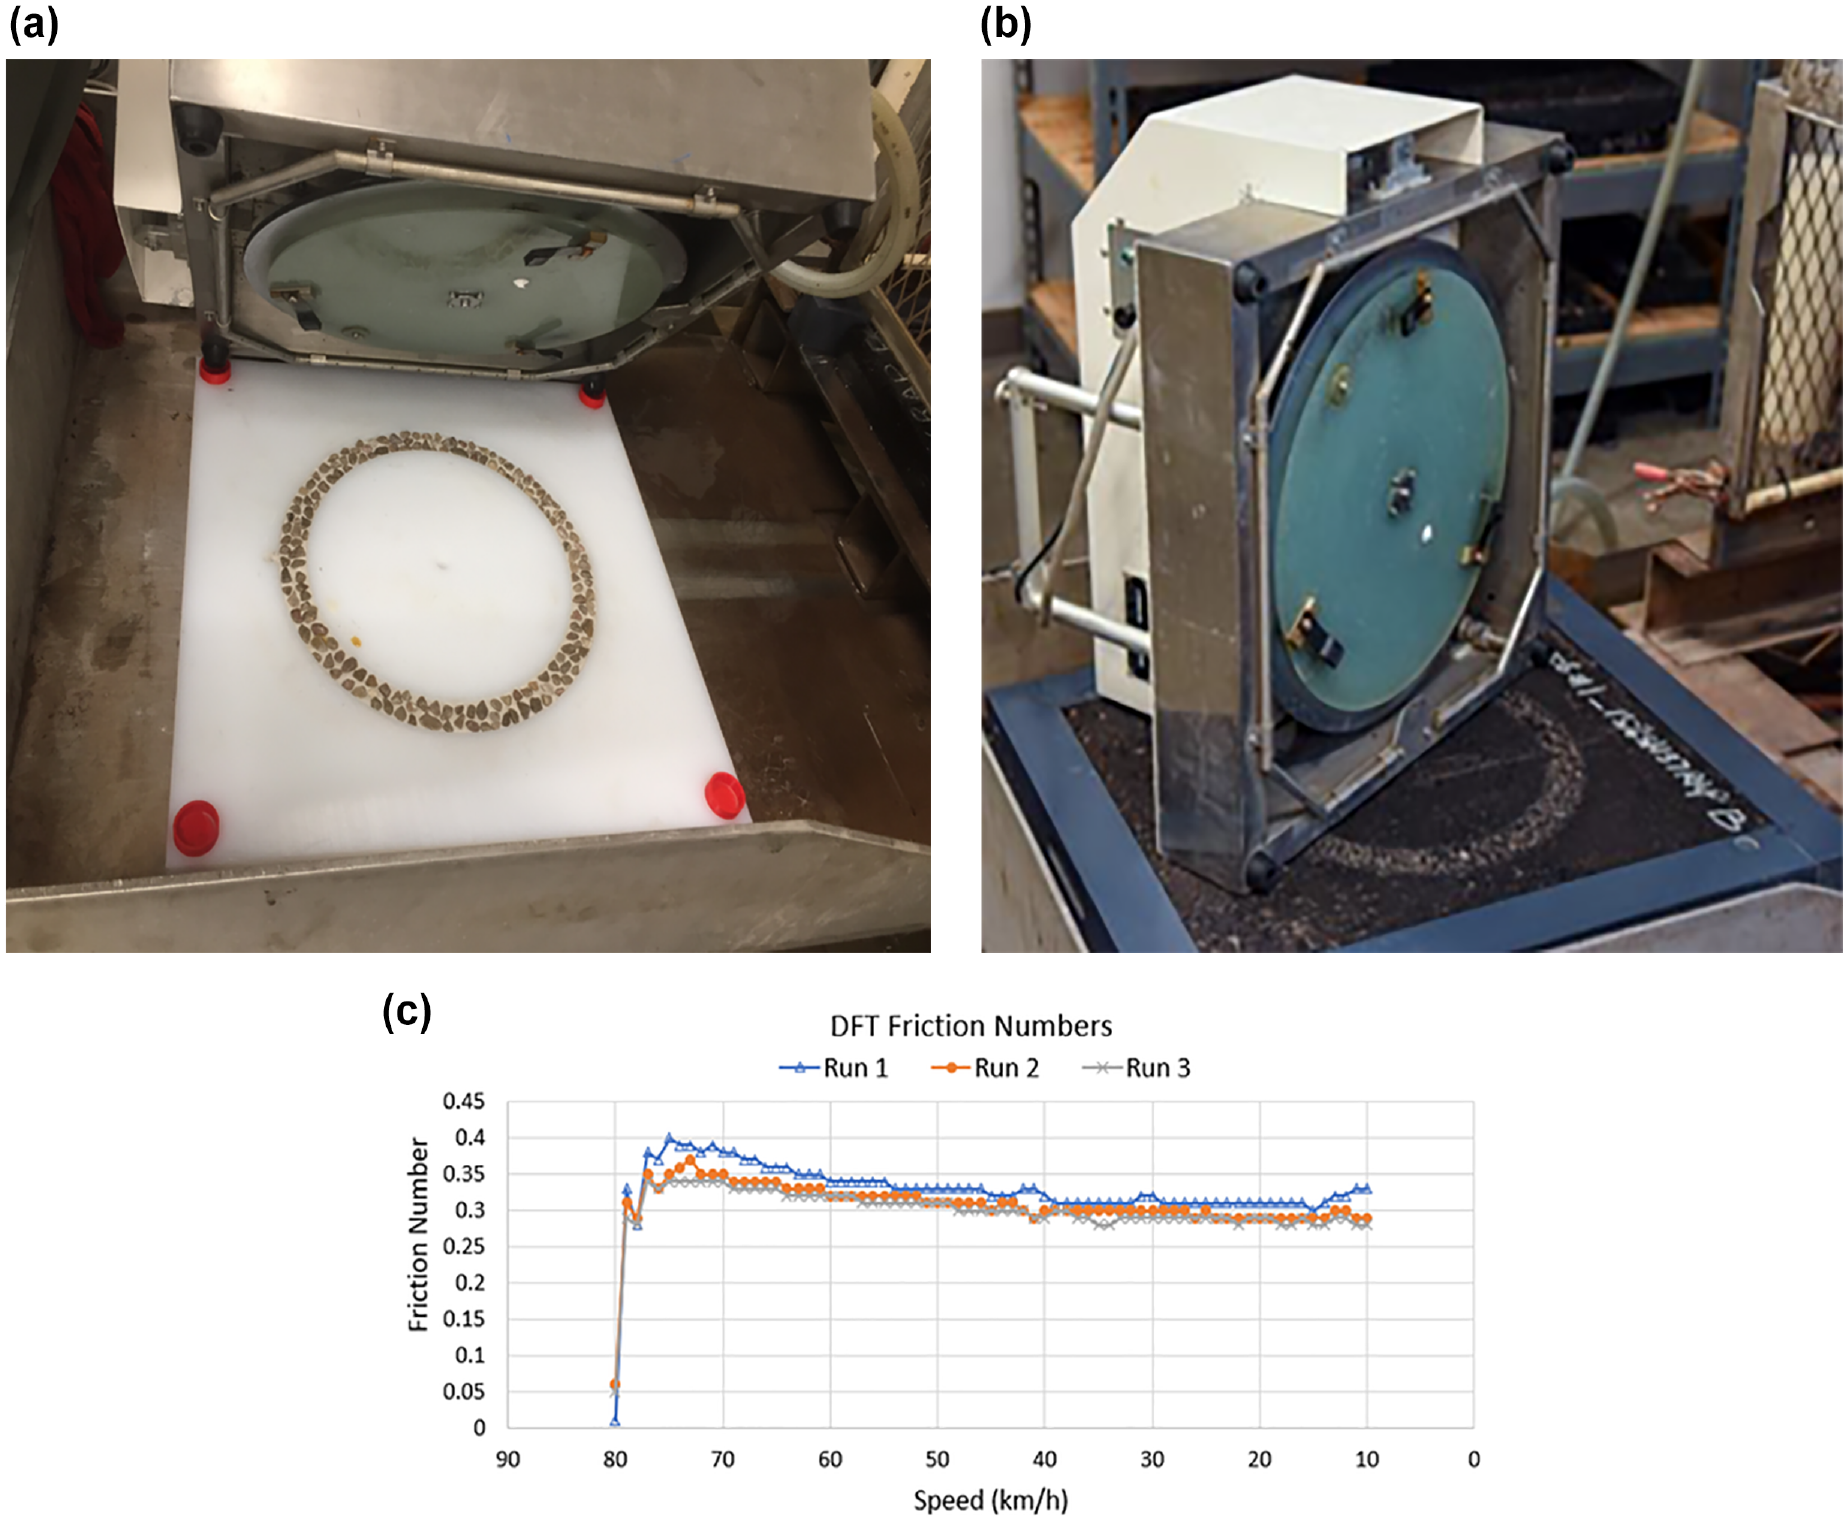
Dynamic friction tester (DFT) (a) the aggregate ring and (b) the mixture slab, and (c) the friction numbers.
CTM Test on the Mixture Slab
The CTM test was conducted according to the ASTM E2157 ( 13 ) standard. The CTM can scan the 892-mm-long circumference of the pavement at a sampling rate of one point every 0.87 mm. The scanned circumference is further divided into eight 100-mm-long segments for analysis. The CTM is used to characterize the macrotexture of the surface. The same frame used for the DFT test was also used for the CTM test. Figure 5 shows that the CTM device is aligned according to the line marked on the frame, ensuring that the CTM laser measured the same polished ring area as the other tests. The macrotexture data was needed in this research to predict the skid number of the field pavement.
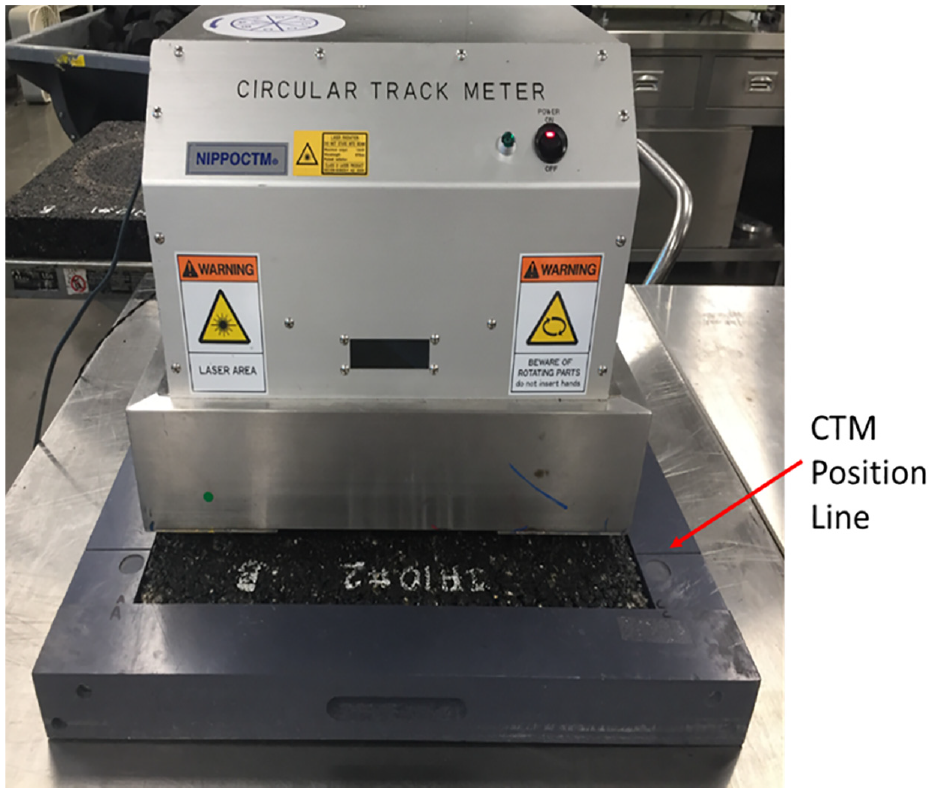
Circular track meter (CTM) on the mixture slab.
Results
RAP and Raw Aggregate Test Results
In this study, the researchers characterized RAP and raw aggregates through sieve analysis, micro-Deval, and aggregate ring DFT tests. The RAP materials include a RAP stockpile from the Knife River Company, a RAP stockpile from the Vulcan Materials Company (used in the original FM 356 surface mixture), a RAP stockpile from El Paso County (used in the original IH 10 surface mixture), SH 37 RAP (SAC-A pavement surface-milled RAP), and laboratory-produced RAP using SAC-B aggregates. Among these RAP materials, the SH 37 RAP was milled directly from the SH 37 pavement surface mixture, and the other RAP materials (except the laboratory-produced RAP) may be a blend from different pavement surface mixtures.
Figure 6 shows the micro-Deval and aggregate ring DFT test results (percent loss) for 12 types of aggregates, including RAP and raw aggregates. According to the BRSQC, the FM 356 sandstone, IH 20 igneous, and IH 10 igneous are SAC-A aggregates. The other raw aggregates are SAC-B aggregates.
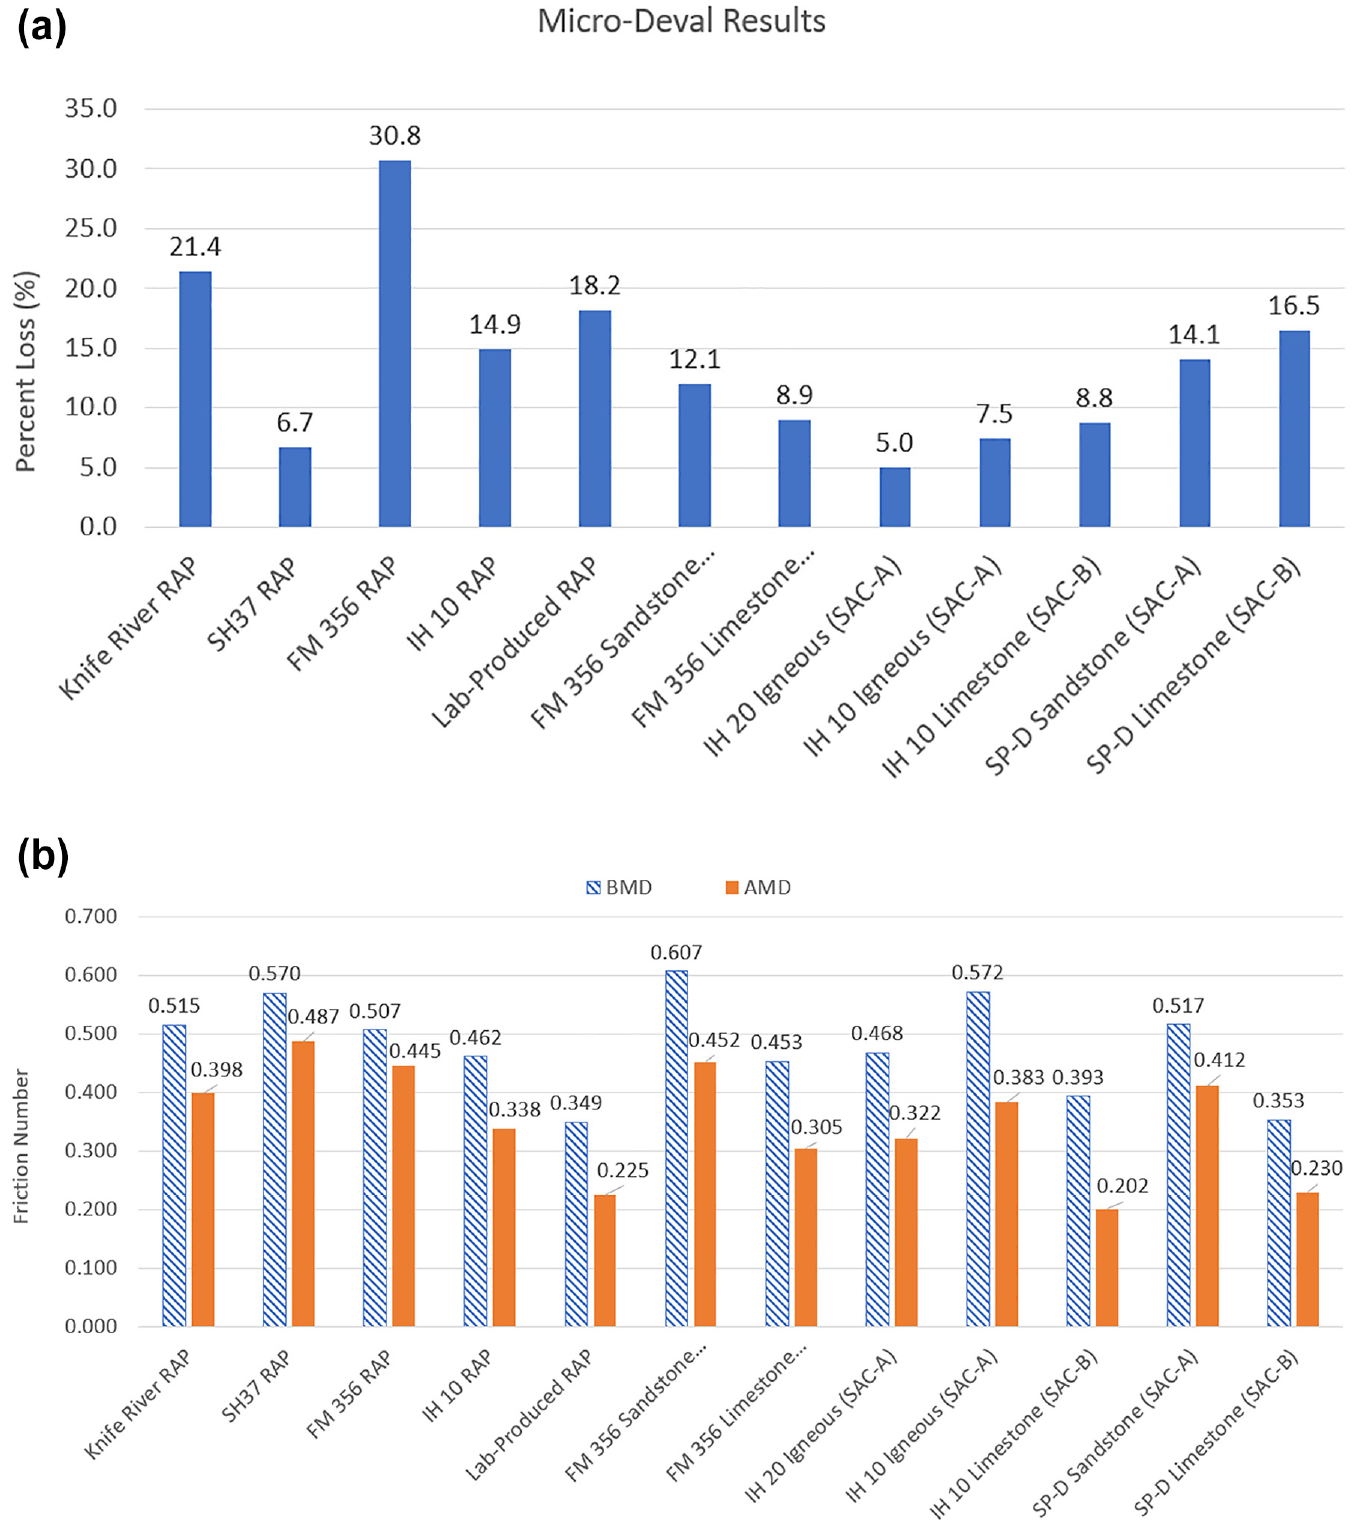
Aggregate performance: (a) micro-Deval and (b) ring dynamic friction tester results.
The test results provide a range of DFT values and an idea of “Good” or “Bad” aggregate with respect to the skid resistance. Overall, the DFT values of RAP don’t seem significantly lower than raw aggregates. The SH 37 RAP has the highest DFT values among the five RAP materials, and the lab-produced RAP has the lowest DFT values. For convenience, the best RAP (SH 37 RAP) was called SAC-A RAP, and the worst RAP (lab-produced RAP) was called SAC-B RAP in this study.
Impact of RAP on Mixture Slab DFT Results
As mentioned before, 20 mixtures were investigated in this study. For convenience, the researchers named the redesigned FM 356 mixtures as follows: FM 356_0 RAP, FM 356_15% RAP (SAC-A), FM 356_15% RAP (SAC-B), FM 356_30% RAP (SAC-A), and FM 356_30% RAP (SAC-B). Accordingly, for the other mixtures, only the “FM 356” needed to be replaced with other names, such as “IH 10,”“IH 20,” or “SP-D.”
Figure 7 shows the DFT results of mixtures with SAC-A RAP and SAC-B RAP, respectively. Each curve shows that the DFT values first increase and then decrease. The maximum DFT values occurred at approximately 500–3000 polish cycles. This increase was caused by removing the excess binder from the surface and exposing the aggregate. After reaching the peak point, the DFT values decreased as the polish cycle increased. The DFT values reached a relatively stable number at around 100,000 cycles.
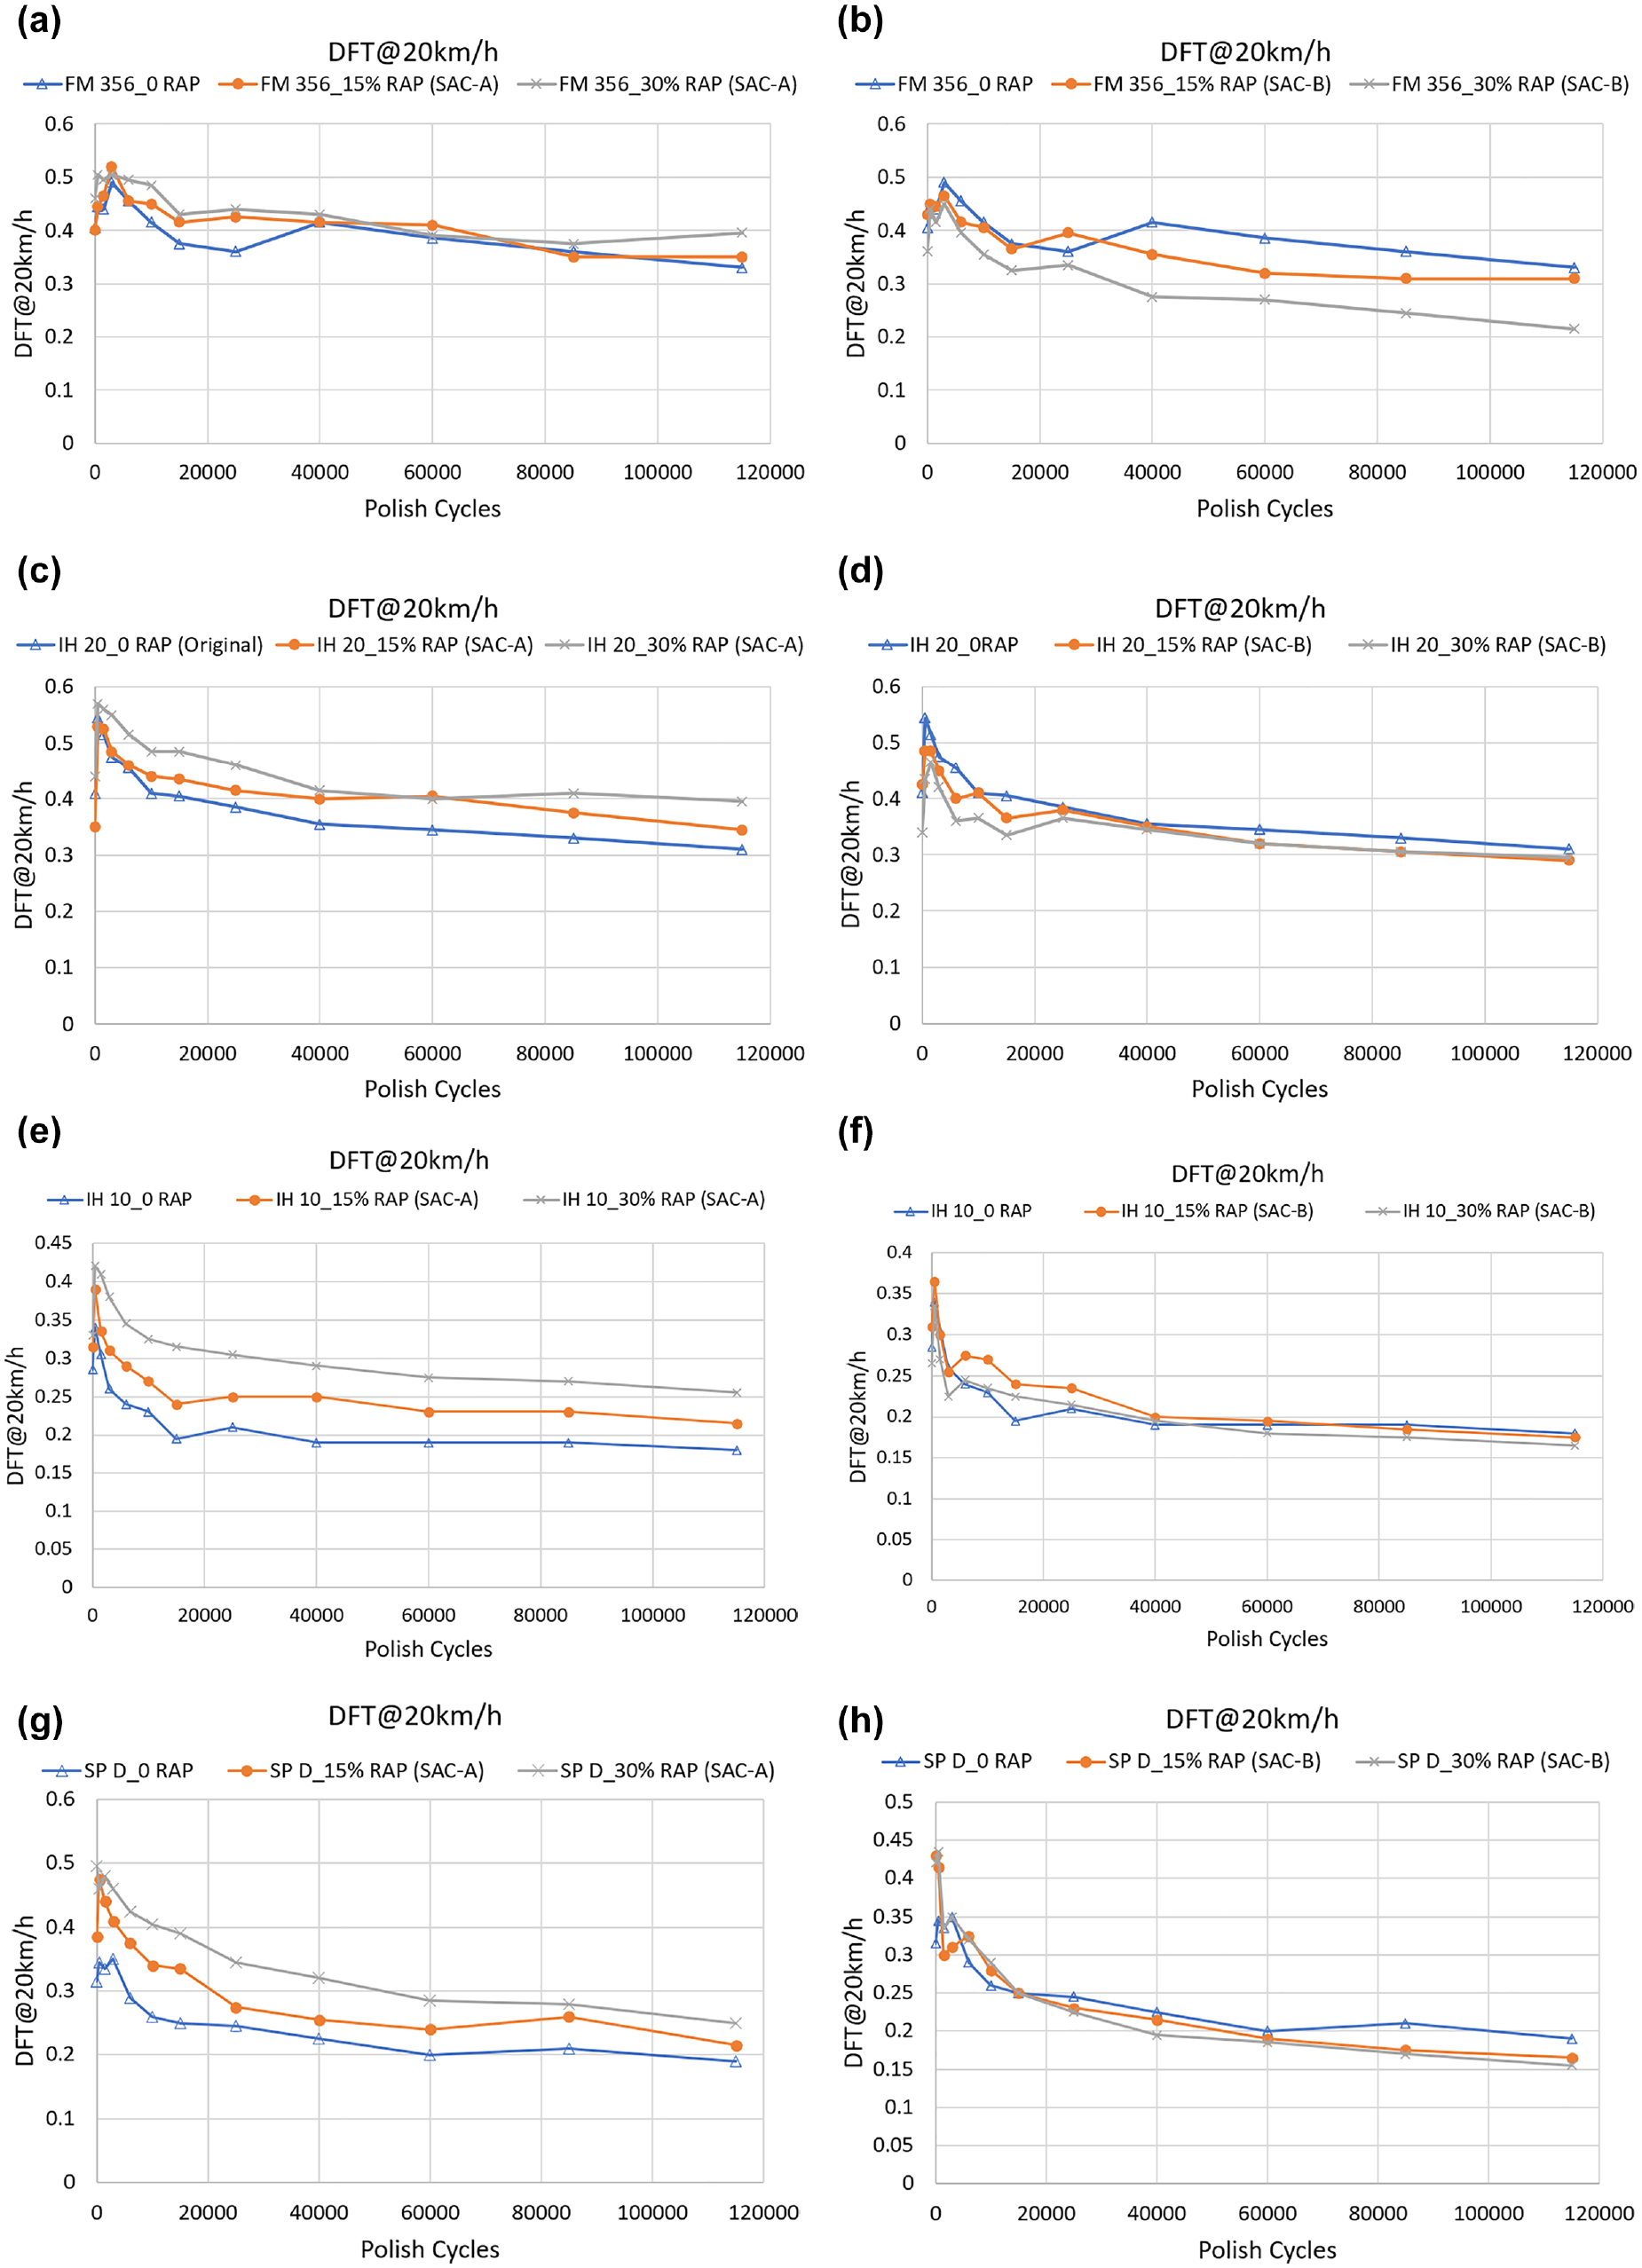
Dynamic friction tester (DFT) results on slabs with (a) Farm Road (FM) 356 Surface Aggregate Classification A (SAC-A) reclaimed asphalt pavement (RAP), (b) FM 356 Surface Aggregate Classification B (SAC-B) RAP, (c) Interstate Highway (IH) 20 SAC-A RAP, (d) IH 20 SAC-B RAP, (e) IH 10 SAC-A RAP, (f) IH 10 SAC-B RAP, (g) Superpave D (SP-D) SAC-A RAP, and (h) SP-D SAC-B RAP mixtures.
Overall, adding SAC-A RAP increases the mixture slab DFT values, while SAC-B RAP decreases the slab DFT values. The dominant DFT ranking is 30% SAC-A RAP > 15% SAC-A RAP > 0% RAP > 15% SAC-B RAP > 30% SAC-B RAP.
Aggregate Blended DFT Results
In this section, the researchers combined the aggregate DFT values into blended DFT values for each asphalt mixture. The aggregate blended DFT calculation method is similar to that used by Maryland DOT ( 14 ) and TxDOT Soils and Aggregates Section ( 8 ). The TxDOT and Maryland DOT methods assume a constant number, 0.3, for all RAP aggregate DFT results since the RAP aggregate DFT is not measured in either method. Different from these methods, the actual measured RAP aggregate DFT result was applied in this study.
The blended DFT calculation was based on the stockpile gradation and the retaining percentage on the No. 4 sieve. The DFT calculation of fine aggregates was assigned the same value as the coarse aggregate if the aggregates were from the same quarry and had the same product code. The DFT values of the sand stockpile were assumed to be 40 (BMD) and 30 (AMD); however, these numbers did not affect the blended results since the percentage of retaining on the No. 4 sieve was 0. Table 1 shows the blended DFT calculation using the mixture IH 20_15% RAP (SAC-A) as an example.
Aggregate Blended Dynamic Friction Tester (DFT) Results of the Interstate Highway 20_15% Reclaimed Asphalt Pavement (RAP) (Surface Aggregate Classification A [SAC-A]) Mixture
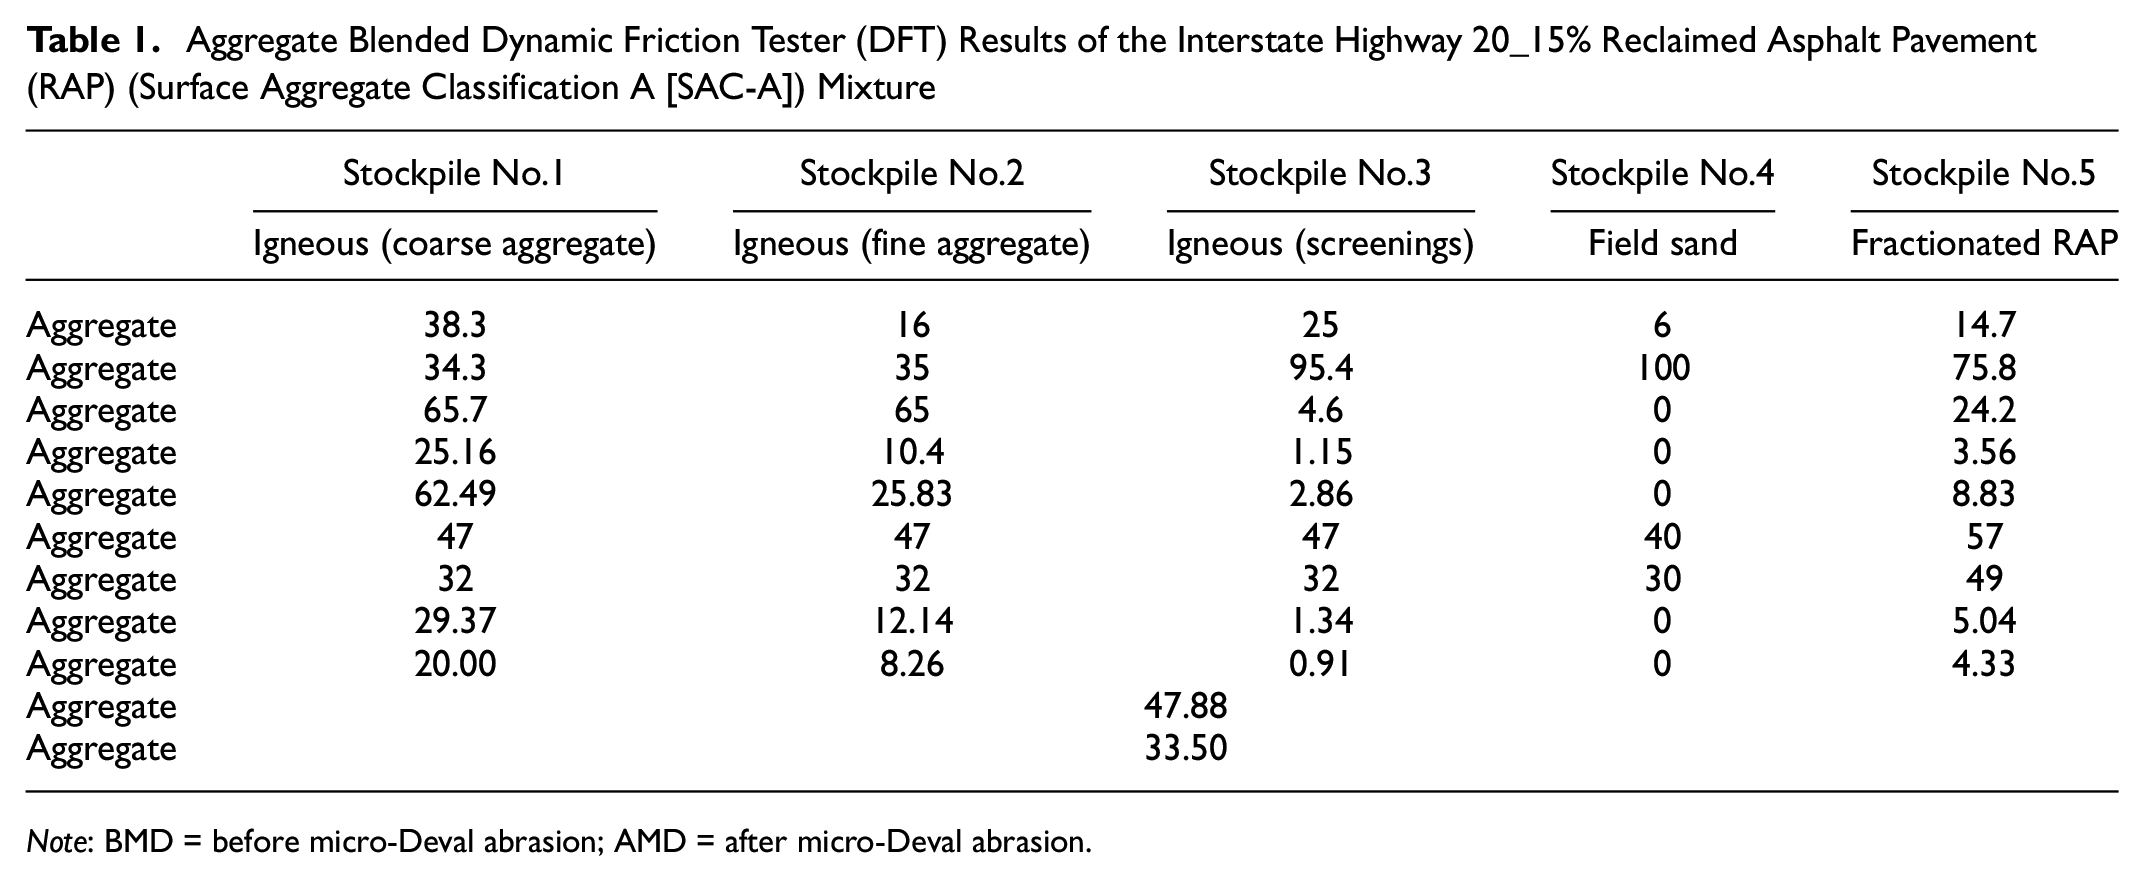
Note: BMD = before micro-Deval abrasion; AMD = after micro-Deval abrasion.
Discussion
Relationship Between Aggregate and Mixture Slab DFT Values
The World Road Association’s Permanent International Association of Road Congress (PIARC) has developed the international friction index (IFI) as a universal method for reporting pavement friction characteristics and harmonizing the results from different devices for measuring pavement surface friction. The model incorporates a DFT value at 20 km/h (DFT20) and CTM measurements (macro-mean profile depth). The IFI is calculated according to ASTM E1960: Standard Practice for Calculating IFI of a Pavement Surface ( 15 ), as follows:


where Sp is the speed constant parameter, MPD is the macro-mean profile depth measured using the CTM, and DFT20 is the coefficient of friction at 20 km/h measured by the DFT.
In TxDOT project 0-6746, a model was developed to predict the skid number (SN(50)) of the asphalt pavement surface ( 16 ):

where SN(50) is the skid number measured at 50 mph (80 km/h). This measurement is conducted by locking the trailer’s left-hand wheel at periodic intervals while a metered amount of water is sprayed on the pavement ahead of the left-hand tire ( 17 ).
After incorporating the slab DFT values (at 3000 cycles) and the CTM macro-mean profile depth values into Equations 1–3, the IFI and SN(50) for each mixture were determined and are listed in Table 2.
Summary of IFI and SN(50) Values
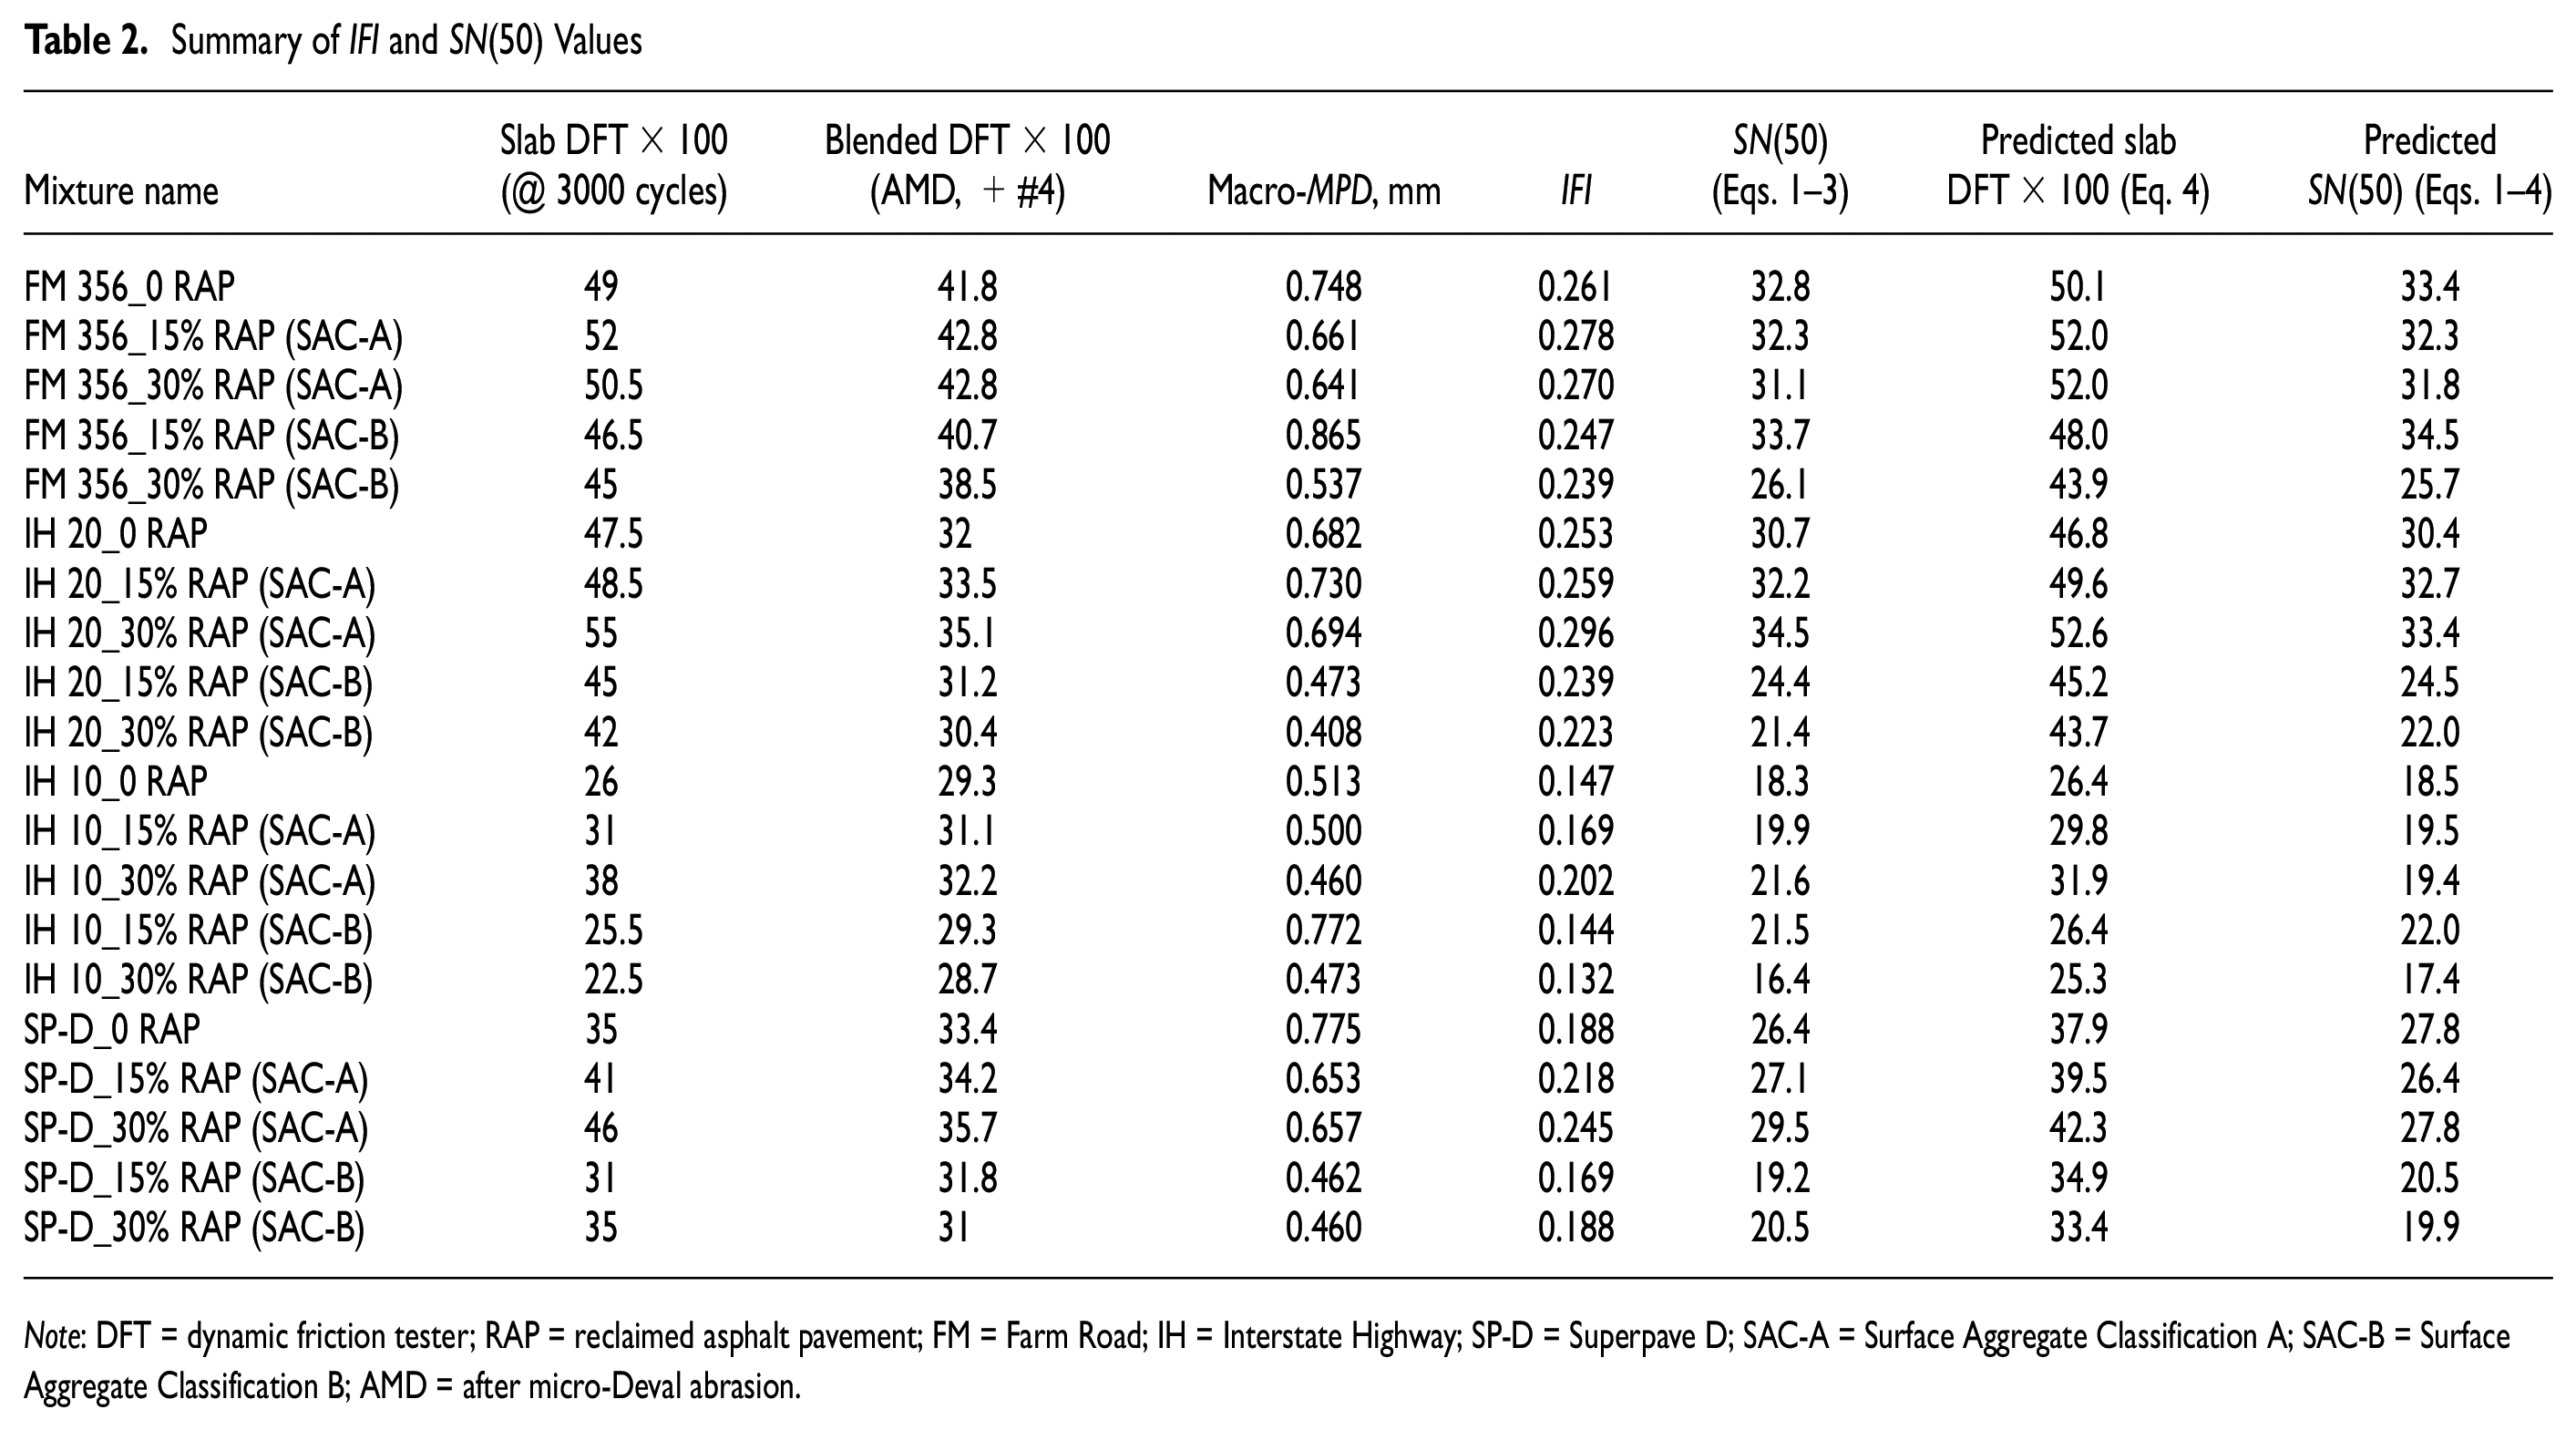
Note: DFT = dynamic friction tester; RAP = reclaimed asphalt pavement; FM = Farm Road; IH = Interstate Highway; SP-D = Superpave D; SAC-A = Surface Aggregate Classification A; SAC-B = Surface Aggregate Classification B; AMD = after micro-Deval abrasion.
The researchers found that there is a strong relationship between the aggregate blended DFT (AMD) and the mixture slab DFT at 3000 polish cycles. The following regression equation was developed to predict the mixture slab DFT at 3000 cycles based on the aggregate blended DFT (AMD):

where DFTslab is the DFT values measured on the mixture slab surface at 20 km/h and after 3000 polish cycles, DFTBlended is the aggregate blended DFT value (AMD) of the corresponding mixture, and G is the gradation adjusting factor (−0.07 for Superpave C, −0.033 for SP-D, and 0.082 for Type D). The regression was conducted using Excel Solver. The sum of squared error (SSE) is 0.162 (using the DFT values, not the DFT × 100), and the standard error of regression is 0.024.
According to Equation 4, the DFTslab for 20 mixtures in Table 2 can be predicted based on the corresponding DFTBlended (AMD) values. Figure 8 compares the measured and predicted slab DFT values of the 20 mixtures. The data can be seen in Table 2 as well.
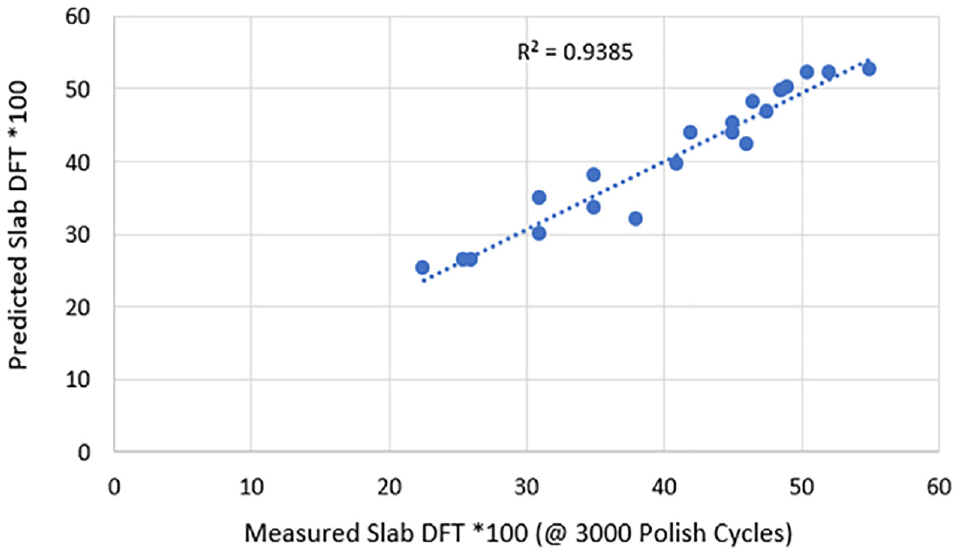
Comparison between the measured and predicted slab dynamic friction tester (DFT) values.
The SN(50) can be predicted based on the aggregate blended DFT values after combining Equations 1–4. Figure 9 shows the SN(50) prediction based on assumed aggregate blended DFT values (0.1–0.6) for Superpave C, SP-D, and Type D mixtures.
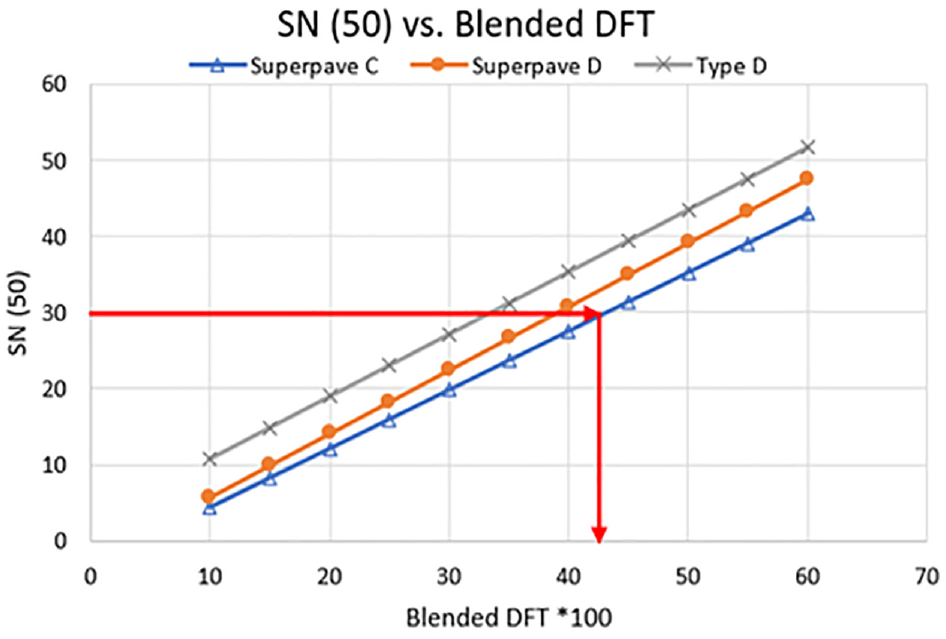
Prediction of SN(50) based on aggregate blended dynamic friction tester (DFT) values.
When predicting SN(50) based on the aggregate blended DFT value rather than the mixture slab DFT value, the mixture slab is assumed not to be fabricated yet, and the mixture’s macro-MPD is unknown. Therefore, an averaged macro-MPD for each type of mixture was determined and used for the calculation. For example, the average macro-MPD for the Superpave C mixture was determined based on CTM macro-MPD measurements of all FM 356 and IH 10 mixture slabs at all polish cycles. The average macro-MPD numbers for Superpave C, SP-D, and Type D mixtures are 0.563, 0.63, and 0.611, respectively. Note that these numbers are a little different from directly averaging the macro-MPD numbers in Table 2.
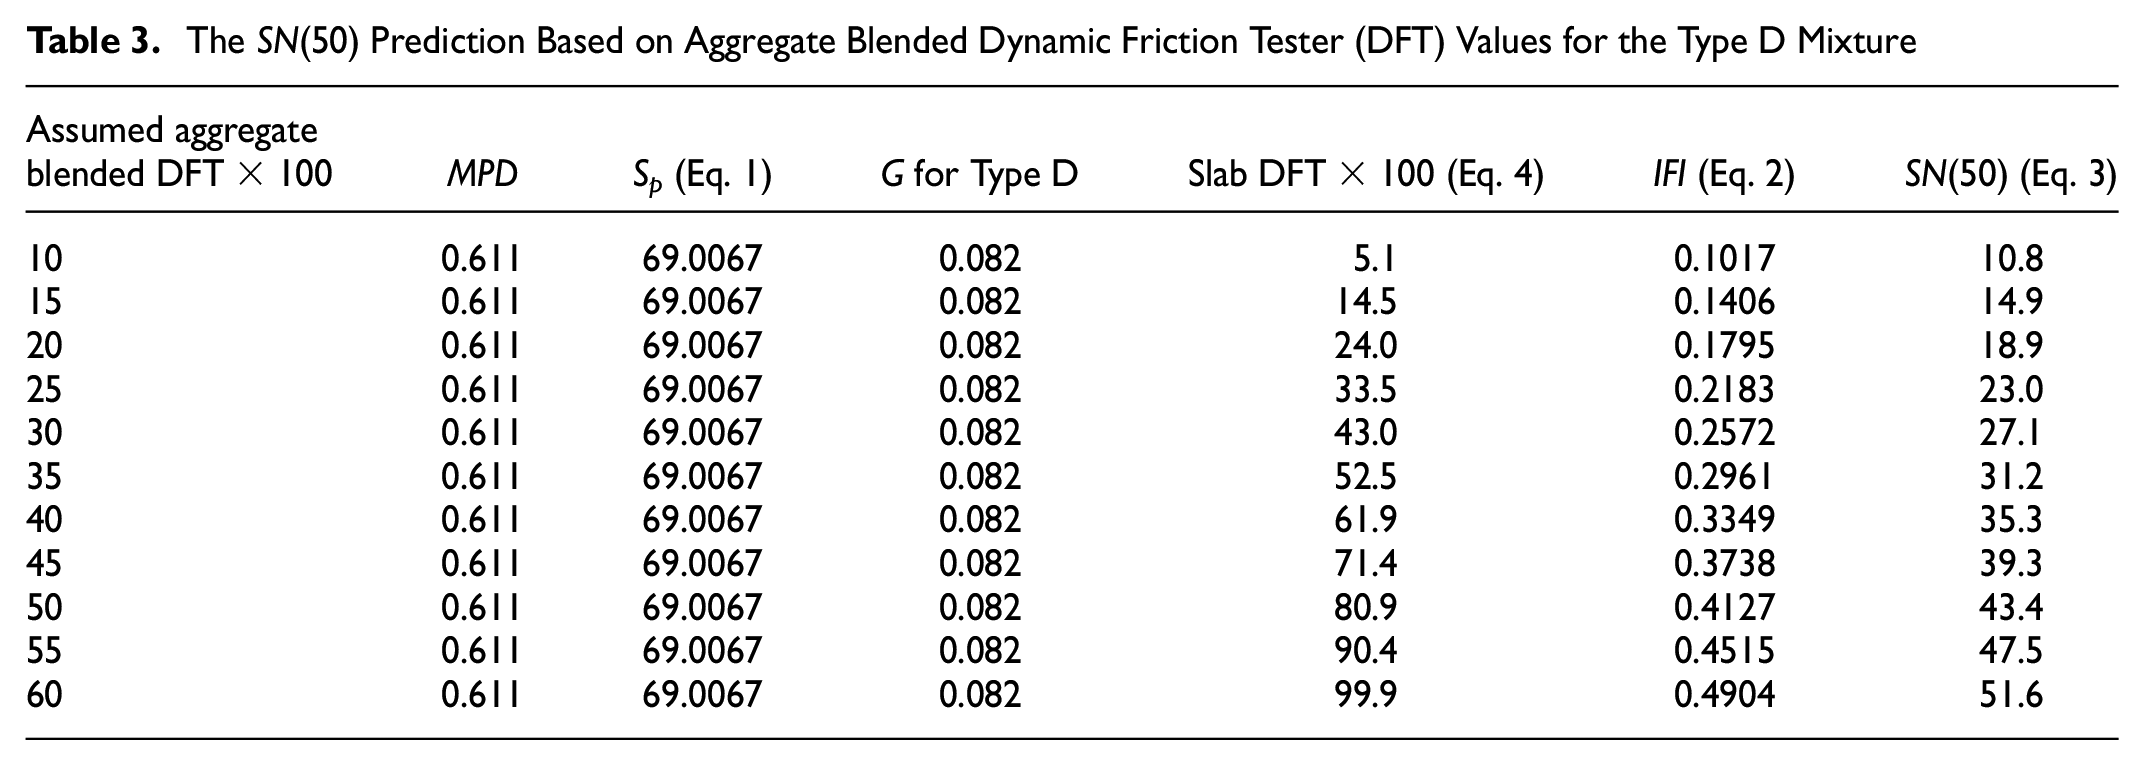
Table 3 shows an example of the development of the Type D mixture’s SN(50) prediction line in Figure 9.
The SN(50) Prediction Based on Aggregate Blended Dynamic Friction Tester (DFT) Values for the Type D Mixture
As seen in Figure 9, if using 30 as a threshold of SN(50), the corresponding aggregate blended DFT value (DFTBlended) after time 100 is 43. Thus, the minimum DFT value (AMD) of 0.43 was proposed as the threshold for rating RAP aggregate as SAC-A RAP. This threshold means that the SAC-A RAP can be a positive contributor to the blended DFT value or at least no worse than an average SAC-A raw aggregate with respect to skid resistance.
Conclusions
This study investigated the impact of RAP on the skid resistance of surface mixtures. Twenty mixtures were designed, which involved four surface mix types, two RAP types, and three RAP percentages. The researchers conducted the skid resistance measurement on RAP, raw aggregate, and mixture slabs.
The test results show that RAP may significantly influence the skid resistance of the asphalt mixture, depending on the RAP percentage and the relative DFT values to the raw aggregate. In general, adding high skid-resistant RAP increases the mixture slab DFT values, while low skid-resistant RAP decreases the slab DFT values. This confirms the potential of using high skid-resistant RAP (e.g., reclaimed from the previous high skid-resistant SAC-A pavement) to conserve SAC-A raw aggregate resources.
The aggregate blended DFT value provides a good indication of the corresponding mixture slab (or pavement) surface DFT value. A higher aggregate blended DFT value usually leads to a higher mixture DFT value for a given gradation.
The relationship between the aggregate blended DFT value sand the mixture slab DFT values was developed based on the test results of 20 mixtures. Further, the blended DFT values were used to predict SN(50). The preliminary threshold for determining the SAC rating of RAP aggregate was proposed based on the RAP aggregate DFT values (minimum 0.43, AMD).
The current research covers limited types of material (raw aggregate, RAP, and mixture gradation). Further investigation is needed to refine the threshold or criteria. Also, the testing of the 20 mixtures was carried out solely on laboratory-fabricated slabs. There is a need to do future work on field pavements and investigate possible differences between frictional characteristics from a laboratory-compacted slab and an actual field pavement.
Footnotes
Author Contributions
The authors confirm contributions to the paper as follows: study conception and design: T. Scullion, F. Zhou; data collection: S. Hu, E. Fernando; analysis and interpretation of results: S. Hu, F. Zhou; draft manuscript preparation: S. Hu, M. Souliman. All authors reviewed the results and approved the final version of the manuscript.
Declaration of Conflicting Interests
The author(s) declared no potential conflicts of interest with respect to the research, authorship, and/or publication of this article.
Funding
The author(s) disclosed receipt of the following financial support for the research, authorship, and/or publication of this article: This study was made possible by TxDOT in cooperation with FHWA. In particular, the guidance and technical assistance provided by the project manager, Tom Schwerdt, proved invaluable. Special thanks are also extended to other TxDOT project monitoring committee members, who assisted with various tasks during the study.