
Abstract
Although work zones pose risks to roadworkers and motorists, undertaking roadworks is important to maintain and upgrade road networks. Many researchers have examined the associations between safety levels and roadwork activities and have produced inconsistent findings. Whereas some researchers have compared safety levels before and during roadwork activities, few compared the safety levels at three stages of roadworks: before, during, and after roadworks, to obtain a comprehensive understanding of the associations. In addition to the inconsistent findings, another significant gap exists in the literature: existing research on all three stages is dated and scarce. To address this important gap, this paper aims to examine the associations between safety levels and three stages of roadworks. Using police-reported crash data from twenty-four high-speed road segments in the regional areas of New South Wales, Australia, this paper presents findings from a statistical analysis of the data to understand how crash rates and injury severity levels changed across the three stages. Results showed that crash rates for all crashes, as well as for fatal and injury crashes, reduced significantly from the before period to the during period, and then further to the after period. Greater reductions in crash rates were also observed for crashes that did not involve a heavy vehicle than the heavy vehicle-involved crashes, crashes that were not related to speeding or fatigue issues than those with such issues, crashes that occurred during weekdays than weekends, and crashes that occurred at straight sections than at curved sections.
Roadworks pose significant risks to roadworkers and motorists alike. Despite the risks, road authorities need to undertake roadworks to maintain and upgrade existing road networks. Many researchers across the world have examined how roadworks are related to crash occurrence ( 1 – 5 ) and injury severity levels ( 6 – 10 ). Studies showed that the presence of roadworks increases the crash rates or crash frequencies ( 2 , 11 ) and the injury severity levels ( 6 , 12 ). In contrast, some studies found lower crash rates and injury severity levels during roadworks ( 13 , 14 ). These contradictory findings highlight that there is a need for further research on this topic to better understand how crash rates (or frequencies) and injury severity levels relate to presence of roadworks.
Among the studies which looked at comparing crash rates/frequencies and/or injury severity levels, most compared these for before roadwork period (i.e., before work commenced) with during roadwork period (i.e., when work zones are active) ( 2 , 3 , 5 , 6 , 11 ). Only a few studies ( 1 , 4 , 13 ) compared the safety metrics for all three roadwork stages: before, during, and after roadworks. Analysis of all three stages is important as this would allow us to obtain a comprehensive understanding of safety levels for road infrastructure projects, including appreciation of project expenditures for safety benefits.
Importantly, the literature has studies reporting findings from the US and Europe, but no relevant studies were found in the context of Australia, from where the current study originates. Furthermore, the existing studies which investigated all three roadwork stages are dated, with the latest being done over a decade ago, suggesting the need for more recent studies on the topic. With significant recent developments in roadwork processes and temporary traffic management tools and techniques, it is expected that the overall safety levels at work zones have improved substantially in recent years. As such, it is important to update the scientific knowledge on the associations between roadworks and safety levels.
This paper aimed to examine the changes in crash rates and injury severity levels at high-speed work zones on regional roads before, during, and after roadwork activities are undertaken. To achieve this aim, police-reported crash data for twenty-four road segments in the New South Wales state of Australia were analyzed statistically to examine the crash rates and injury severity levels for the three stages.
Related Literature
Crashes in work zones have been shown to be significantly underreported in many jurisdictions, including Australian States and Territories ( 15 – 17 ). Although work zones are generally clearly delineated, the classification of a crash occurring within a work zone usually relies on the investigating police officer’s subjective judgment ( 13 , 18 ) rather than crash records being cross-checked against active road occupancy licenses through systems. Despite this shortcoming of the work zone crash data, and because of the unavailability of reliable alternative data sources, police-reported crash data are usually used to examine trends in safety levels at various stages of roadworks and associations between crashes and crash-influencing factors.
Work zone safety issues have been examined under different conditions and utilizing a range of crash-influencing factors. For example, the frequency and severity of rear-end crashes in work zones were analyzed by Qi et al. ( 8 ), and the impact of heavy vehicles on work zone safety was assessed by Mahmood and Kianfar ( 19 ). The effects of environmental conditions, such as time of day and weather conditions, on safety have also been examined for work zone safety ( 20 , 21 ). The layout of a work zone was found to be among critical factors that influence road safety ( 2 ) along with the importance of safety devices used in work zones ( 22 ).
Studies showed that work zones are crash-prone areas during construction, often with an increase in the severity levels ( 2 , 6 , 11 , 12 ). Khattak et al. found 21.5% higher crash rates during roadworks than in the pre-roadworks period ( 3 ). Similarly, Jin et al. also found an increment in crash rates during construction ( 11 ). Rouphail et al. found 88% increase in crash rates during roadworks for long-term work zones ( 4 ). However, no significant increase was recorded for short-term work zones. Contradictory findings were also obtained in other relevant studies ( 13 , 14 ).
To obtain a comprehensive understanding of how crash occurrence and severity levels change at roadworks, it is important to examine the safety levels at all three stages of roadworks: before roadworks, during roadworks, and after roadworks. Such a comprehensive analysis will provide understanding on whether the safety levels are increased or decreased at the three stages. This understanding is crucial for assessing the effectiveness of the road upgrade projects.
To partially address this gap, some studies have evaluated the impact of work zones on safety levels by analyzing work zone crashes and non-work zone crashes ( 2 , 5 , 6 , 11 ). These studies recognized the lack of reliable crash data, especially for the pre-construction phase, which was used as the non-work zone condition. La Torre et al. found that presence of a work zone is likely to increase fatal and injury crashes by around 33% and PDO crashes by 66% ( 2 ).
Studies by Nemeth and Migletz ( 1 ), Rouphail et al. ( 4 ), and Ha and Nemeth ( 13 ) analyzed crash data from the three construction stages (before, during, and after construction). These three studies used data from the USA, with the latest being done over a decade ago. Because of the dated nature of the studies, their results may not necessarily reflect current work zone safety characteristics. This is because current traffic management tools and techniques, data collection methods, and safety management procedures have improved substantially in recent years. Furthermore, inconsistent findings were reported from these studies. Ha and Nemeth found that work zone crash rates decrease as a percentage of all crashes and they are less severe ( 13 ), whereas the other two studies found that crash rate and injury severity levels increased during construction. Taken all together, limited understanding has been obtained to date on how crash rates and injury severity levels vary across the three stages of roadworks, suggesting the need for more research to add knowledge to this important area of road safety.
Methodology
Study Context and Sites
This study was conducted using data from the New South Wales (NSW) state of Australia. NSW has a road network of approximately 185,000 km ( 23 ) and about 7 million registered vehicles, as of March 2022 ( 24 ). Following the scope of the current paper (i.e., high-speed regional road work zones), recently completed regional road infrastructure upgrade projects in NSW were considered as potential sites for inclusion in the current study. The site selection process focused on projects which met the following criteria:
Located on regional, high-speed roads outside of metropolitan Sydney
Construction was largely completed online (online refers to closeness to live traffic lanes, offline refers to construction activities undertaken off the existing road alignment, e.g., a bypass on a new alignment)
Work zones were generally greater than 5 km in length
Work zone duration was greater than 18 months
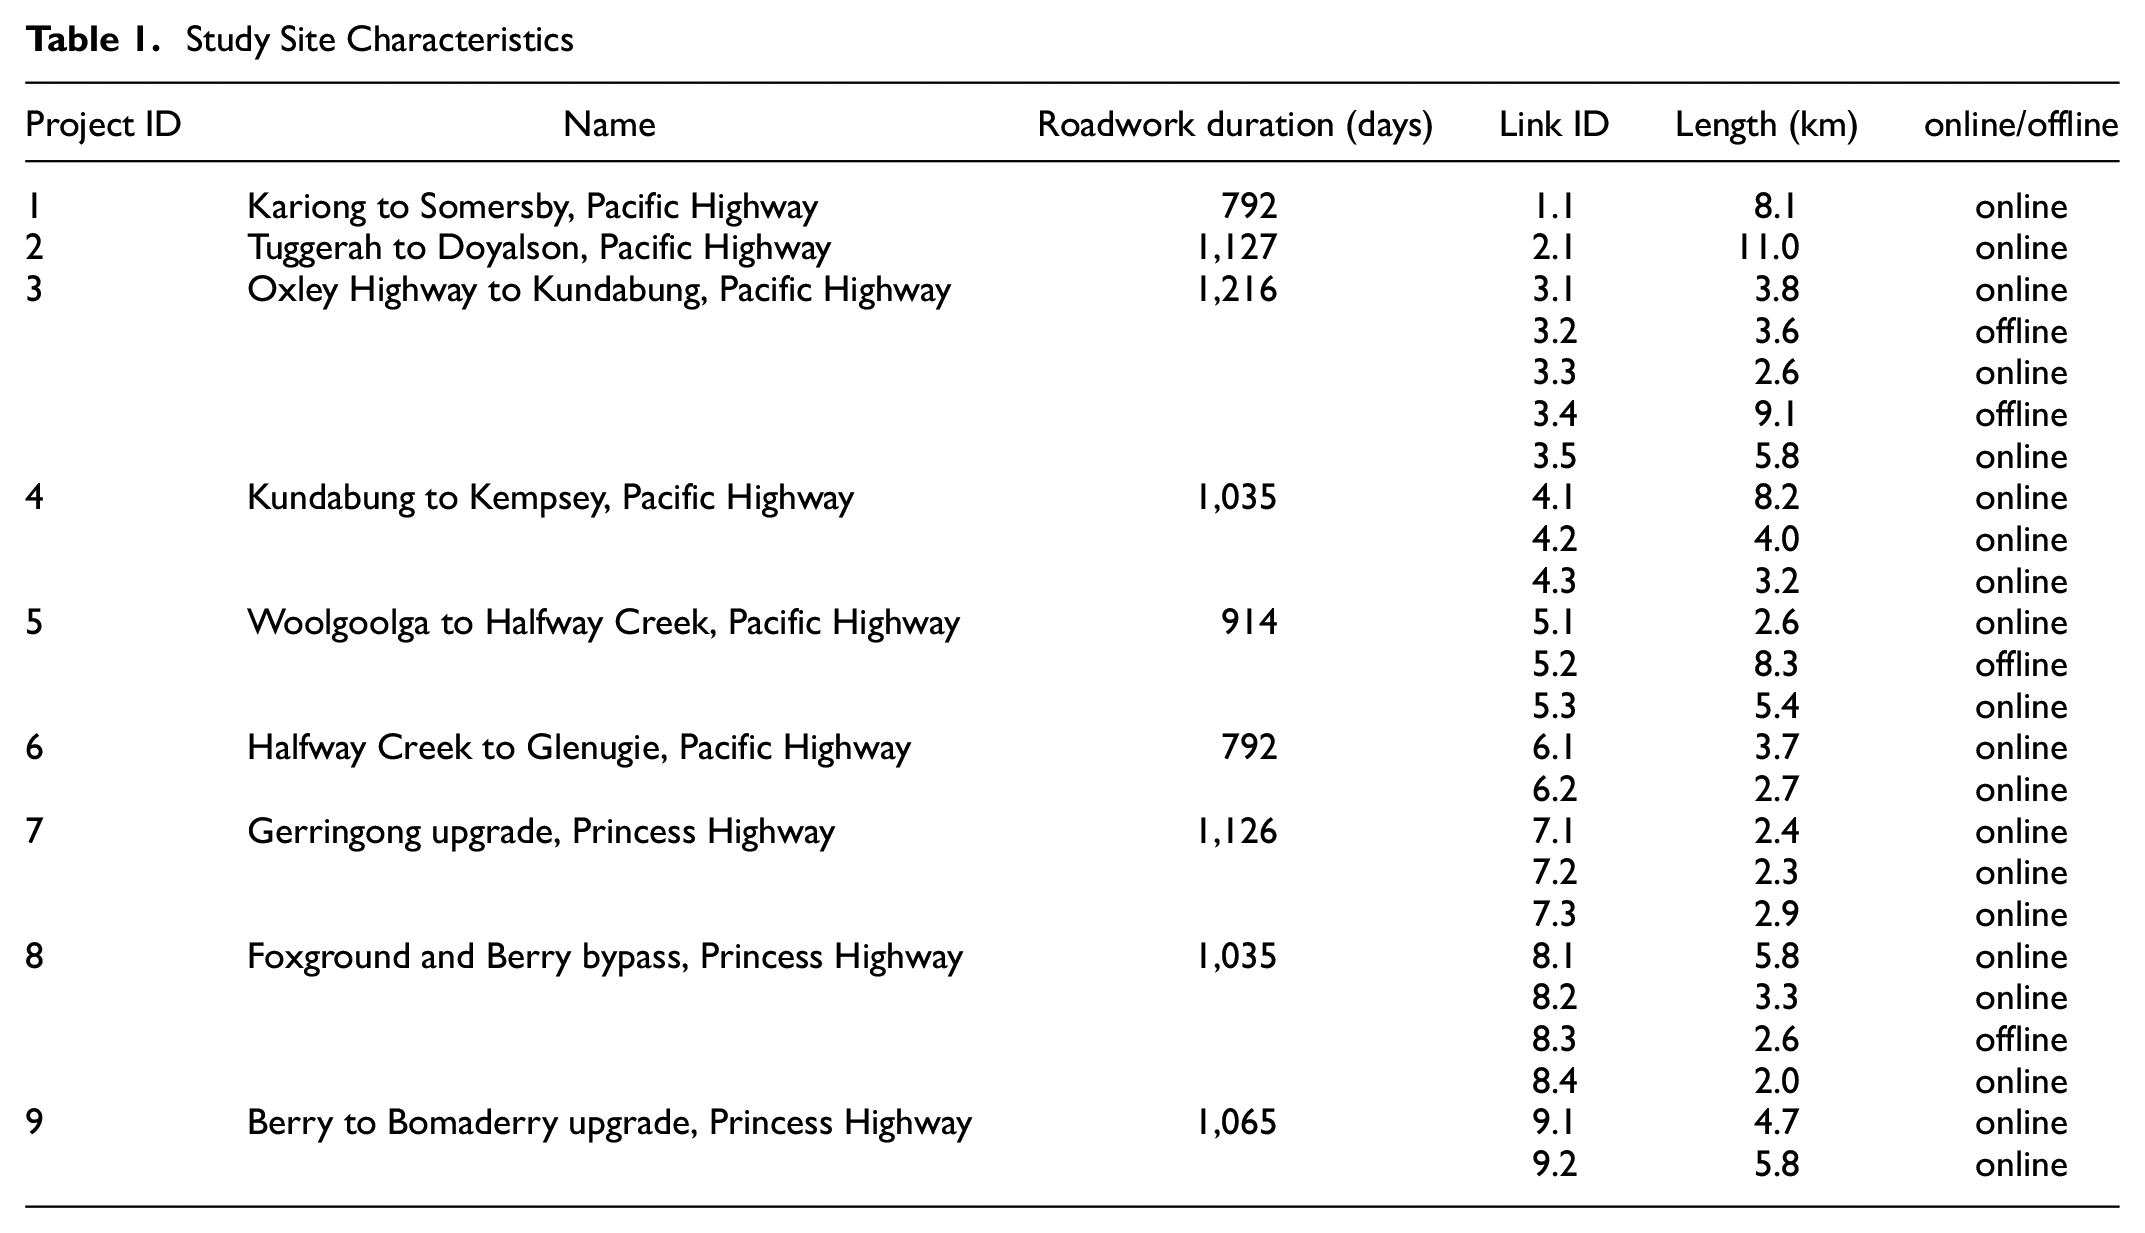
A total of twenty-four road links from nine road expansion projects were selected for the current study. These projects focused on two major transport corridors in NSW, namely the Pacific Highway and Princes Highway, which have both been subject to major upgrades in recent years. Each project length was then divided into links based on whether construction was completed online near existing traffic or offline on a new alignment away from existing traffic. For projects largely completed online, the links were broken up based on existing road network links. The study links were equipped with general work zone controls, for example, dividing a work zone into advance warning area, safety buffer, and work areas, and the use of general delineation devices and stop/slow controls. Although detailed information on the specific safety measures used during roadworks is not available in the databases utilized in the current study, it is noted that specialized safety measures, such as queue warning systems, were not commonly used in the study area.
A summary of the selected sites and their links is shown in Table 1 and their geographical locations are depicted in Figure 1.
Study Site Characteristics
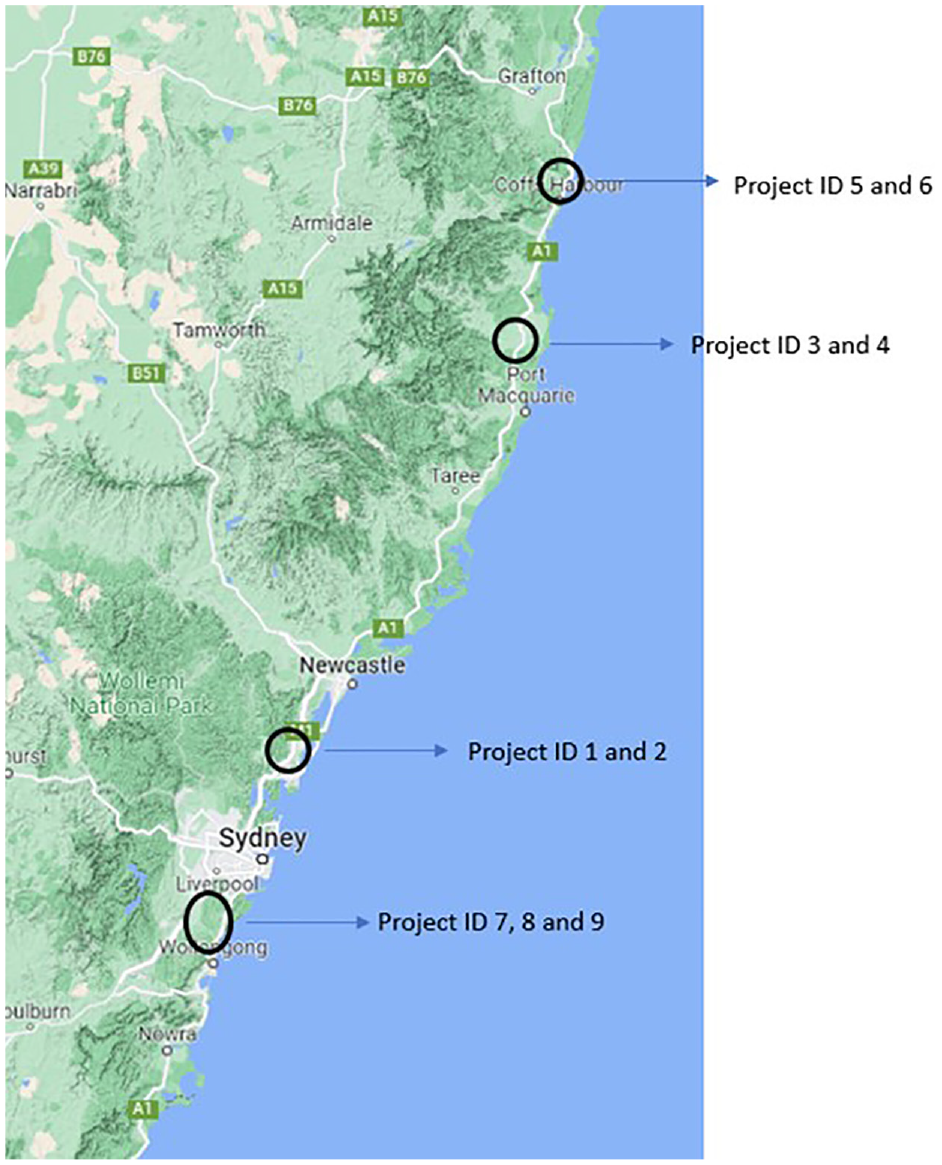
Project locations on a map.
Data
Crash data for the study sites and links were sourced from the Safe Systems Analytics Portal, which is an application that provides users the ability to identify and analyze crashes which have occurred within the NSW road network and reported to police. The portal’s spatial data query tool was used to select crashes that occurred on the mainline carriageways of the selected sites and links.
Crashes that occurred on adjoining or crossroads were removed from the query tool to ensure only crashes likely to be influenced by road construction activities were retained in the dataset. Crashes that occurred on bypass sections of a road were also removed from the dataset to ensure that only the crash data for the upgraded sections were used in the analysis.
Data queries in the portal resulted in the identification of 3,516 crashes which occurred between October 1995 and June 2021 for the selected sites and links. The dataset was coded to classify the crashes into three time periods (noted hereafter as study stages): before roadworks period, during roadworks period, and after roadworks periods. The time periods are referred to “Pre,”“During,” and “Post” hereafter. A five-year period was considered for the “Pre” data. The “During” data were obtained for the duration of the roadworks, as noted in Table 1. The “Post” data were taken for the time periods until when complete and validated crash data were available. This resulted in a final dataset of 1,174 crashes.
Apart from the crash data, characteristics of work zones and roadways were also gathered for the study sites. However, details of the safety measures and work zone technologies used were not available to be extracted for the study.
Data Analysis
The gathered datasets were used to compute different analysis variables, such as crash rates and rates for different injury severity levels. To compare between the Pre, During, and Post stages, it was decided to use crash rates, instead of using crash frequencies, as used in some studies. This was done to account for potential variations resulting from the duration of a study stage, length of road link, and traffic volume on the road links. Existing studies (e.g., Li and Bai [ 25 ]) showed that work duration and work zone length area among the key contributing factors of crashes. Crash rate at a given road link for a study stage was calculated as:

where crash rate is the number of crashes per 100 million vehicle kilometers traveled (100 MVKT) on a road link, AADT is the average annual daily traffic, length of road link is expressed in km, and study stage duration is expressed in days. An average AADT value was used as detailed historical AADT data at small time intervals were unavailable, and no substantial differences in the AADT values were found by applying a linear growth model to the AADT values. Moreover, as the study sites are regional highways and do not have alternative routes for most of the sites, significant changes in traffic volumes during construction were unlikely to occur.
Crash rates were computed for all crashes as well as for different injury severity levels and other analysis variables (e.g., work zone characteristics). The crash rates provided a quantitative comparison between the study stages, and paired t-tests were conducted to examine the statistical significance of the differences in crash rates between two study stages (e.g., Pre versus During, During versus Post, and Pre versus Post).
Results
All Crashes
Crash rates (number of crashes per 100MVKT) for each road link of the study sites are presented in Figure 2. Note that as a result of insufficient time period, the links of site nine did not have any data for the Post stage. Comparison of the crash rates show that for most links the overall crash rates were the highest for the Pre stage and the lowest for the Post stage. This implies that the safety levels at the study links improved after the road upgrade projects were undertaken. For the majority of the study links, crash rates during roadworks were somewhat in between the rates for the Pre and Post stages.
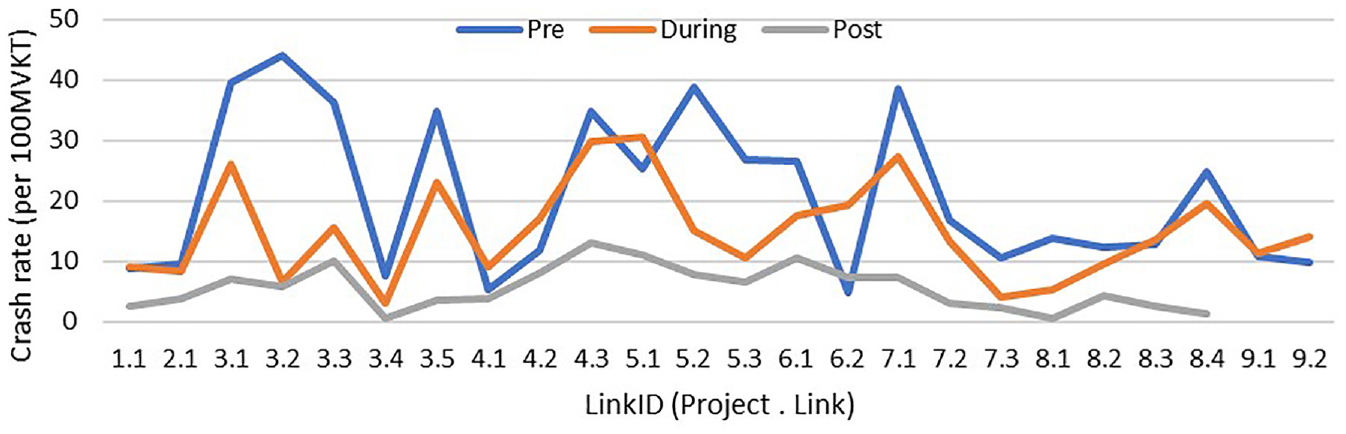
Crash rates per 100 million vehicle kilometers traveled (100 MVTK) for all crashes.
In addition to the overall trends, some sites and links showed distinct characteristics. For example, crash rates at link 6.2 substantially increased during roadworks from the Pre stage, but decreased to the Pre stage level after completion of roadworks. Link 3.2 had the highest crash rates among all study links in the Pre stage and it saw the largest reduction in crash rates during and after roadworks. Link 3.4 appeared to have comparatively low crash rates than other links for all study stages.
The crash rates show substantial reductions from the Pre stage to the During stage and then to the Post stage, and results from the paired t-tests (see Table 2) showed that the reductions are statistically significant. Overall, crash rates decreased by 16.4 from the Pre stage to the Post stage at a statistical significance level of 99%. Although there was a reduction of 6.0 in the crash rates from the Pre stage to the During stage, a larger reduction (9.5) was observed from the During stage to the Post stage, both at 95% confidence level. These findings imply that presence of roadworks does not increase the crash rates; however, greater safety outcomes are achieved after roadwork activities are completed.
Paired t-test Results for Crash Rate Comparison
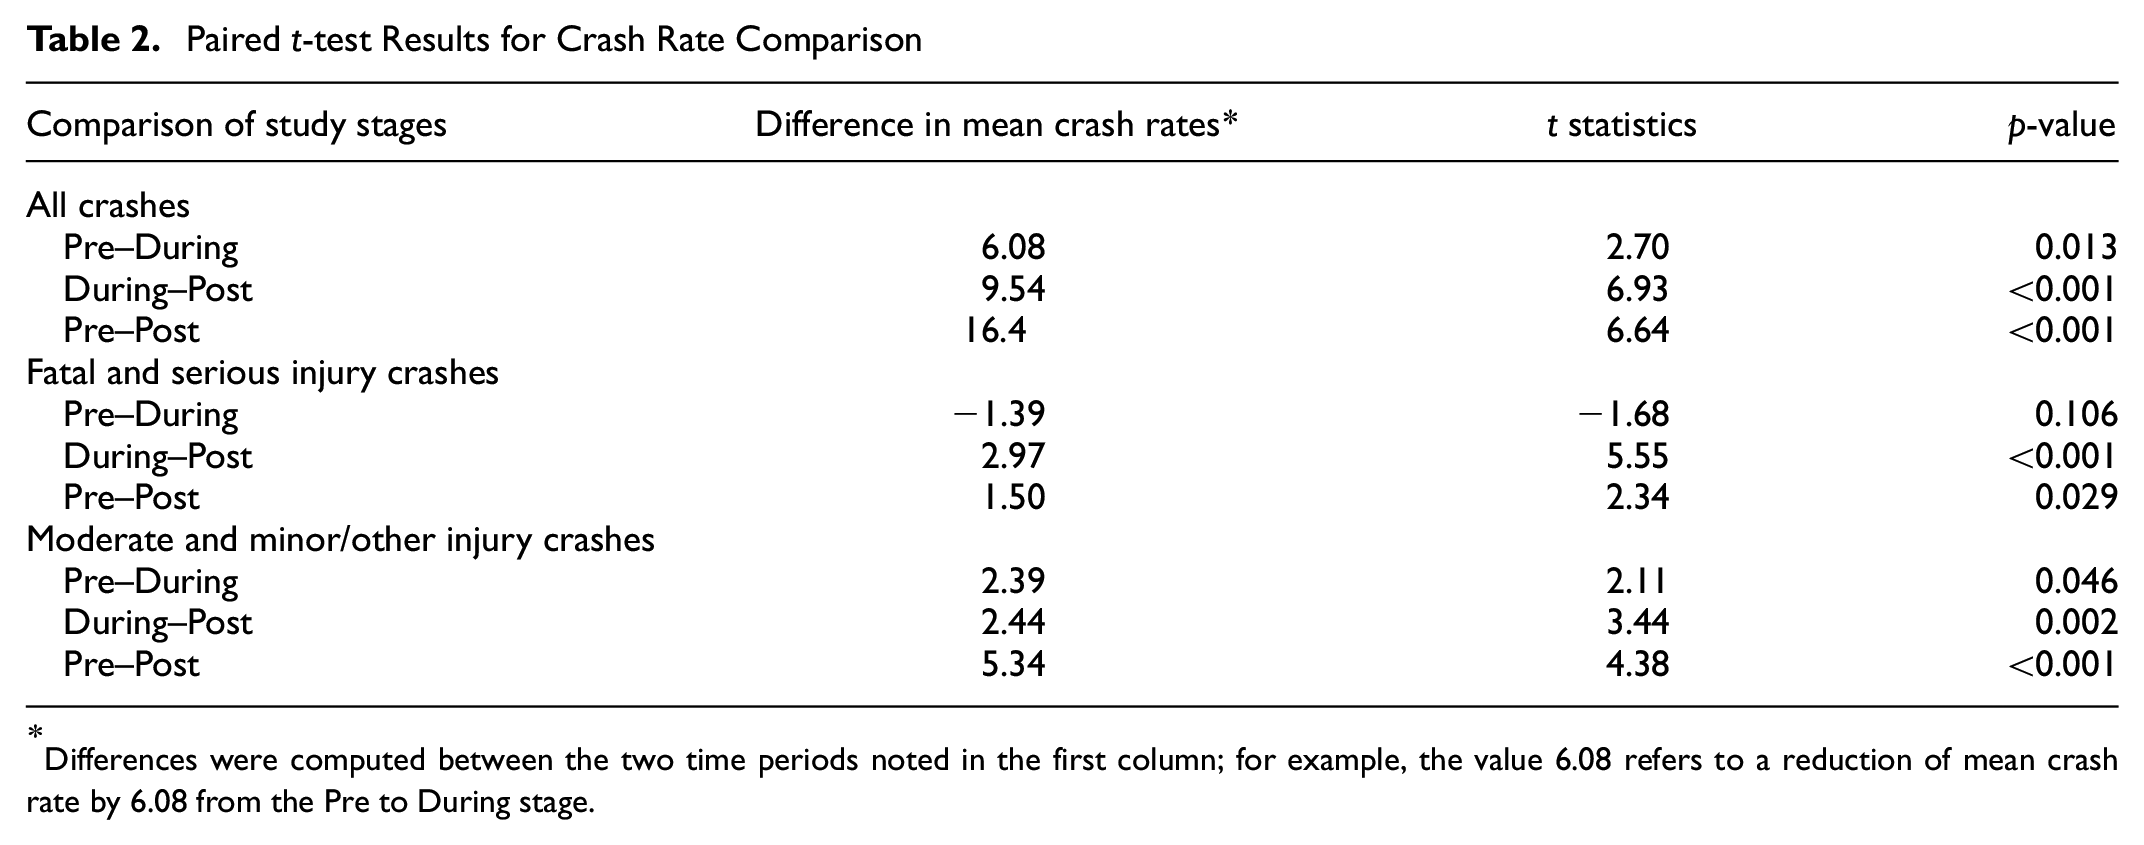
Differences were computed between the two time periods noted in the first column; for example, the value 6.08 refers to a reduction of mean crash rate by 6.08 from the Pre to During stage.
Analysis by Severity Levels
The crash rates were analyzed separately for the different injury severity levels to examine the changes in crash rates for the severity levels. Injury levels sustained by crash-involved road users are coded in the crash data as Fatal, Serious injury, Moderate injury, Minor/Other injury. Because of the small number of observations in the Fatal category, the Fatal and Serious Injury (FSI) crashes were analyzed together. Similarly, the Moderate and Minor/Other Injury (MMI) crashes were considered together for analysis.
Test results showed a statistically significant reduction of crash rates by 1.5 and 5.3 for FSI and MMI crashes, respectively, from the Pre stage to the Post stage. Whereas the MMI crashes had greater reduction from the Pre stage to the Post stage, similar reductions (2.4–3.0) were observed from the During stage to the Post stage for both FSI and MMI crashes at 99% confidence level. In comparison between the Pre stage and the During stage, the rates for MMI crashes were reduced by 2.4 but the results for FSI crashes were not statistically significant.
Analysis by Crash Characteristics
To further examine the differences in crash rates in the three study stages, the rates were analyzed for several crash and roadway characteristics, including types of vehicles involved in crashes, speeding-related crashes, fatigue-related crashes, weekday/weekend crashes, straight/curved road section crashes, type of road, time of day, number of lanes, density of intersections, density of bridges, and type of road pavement. Data were not available to assess the type and duration of roadworks occurring; however, these were predominantly long-term roadwork sites. Because of the limited variability in data for some variables, meaningful results were obtained for a few variables only, as presented in Table 3.
Paired t-test Results for Crash Rate Comparison by Selected Crash Characteristics
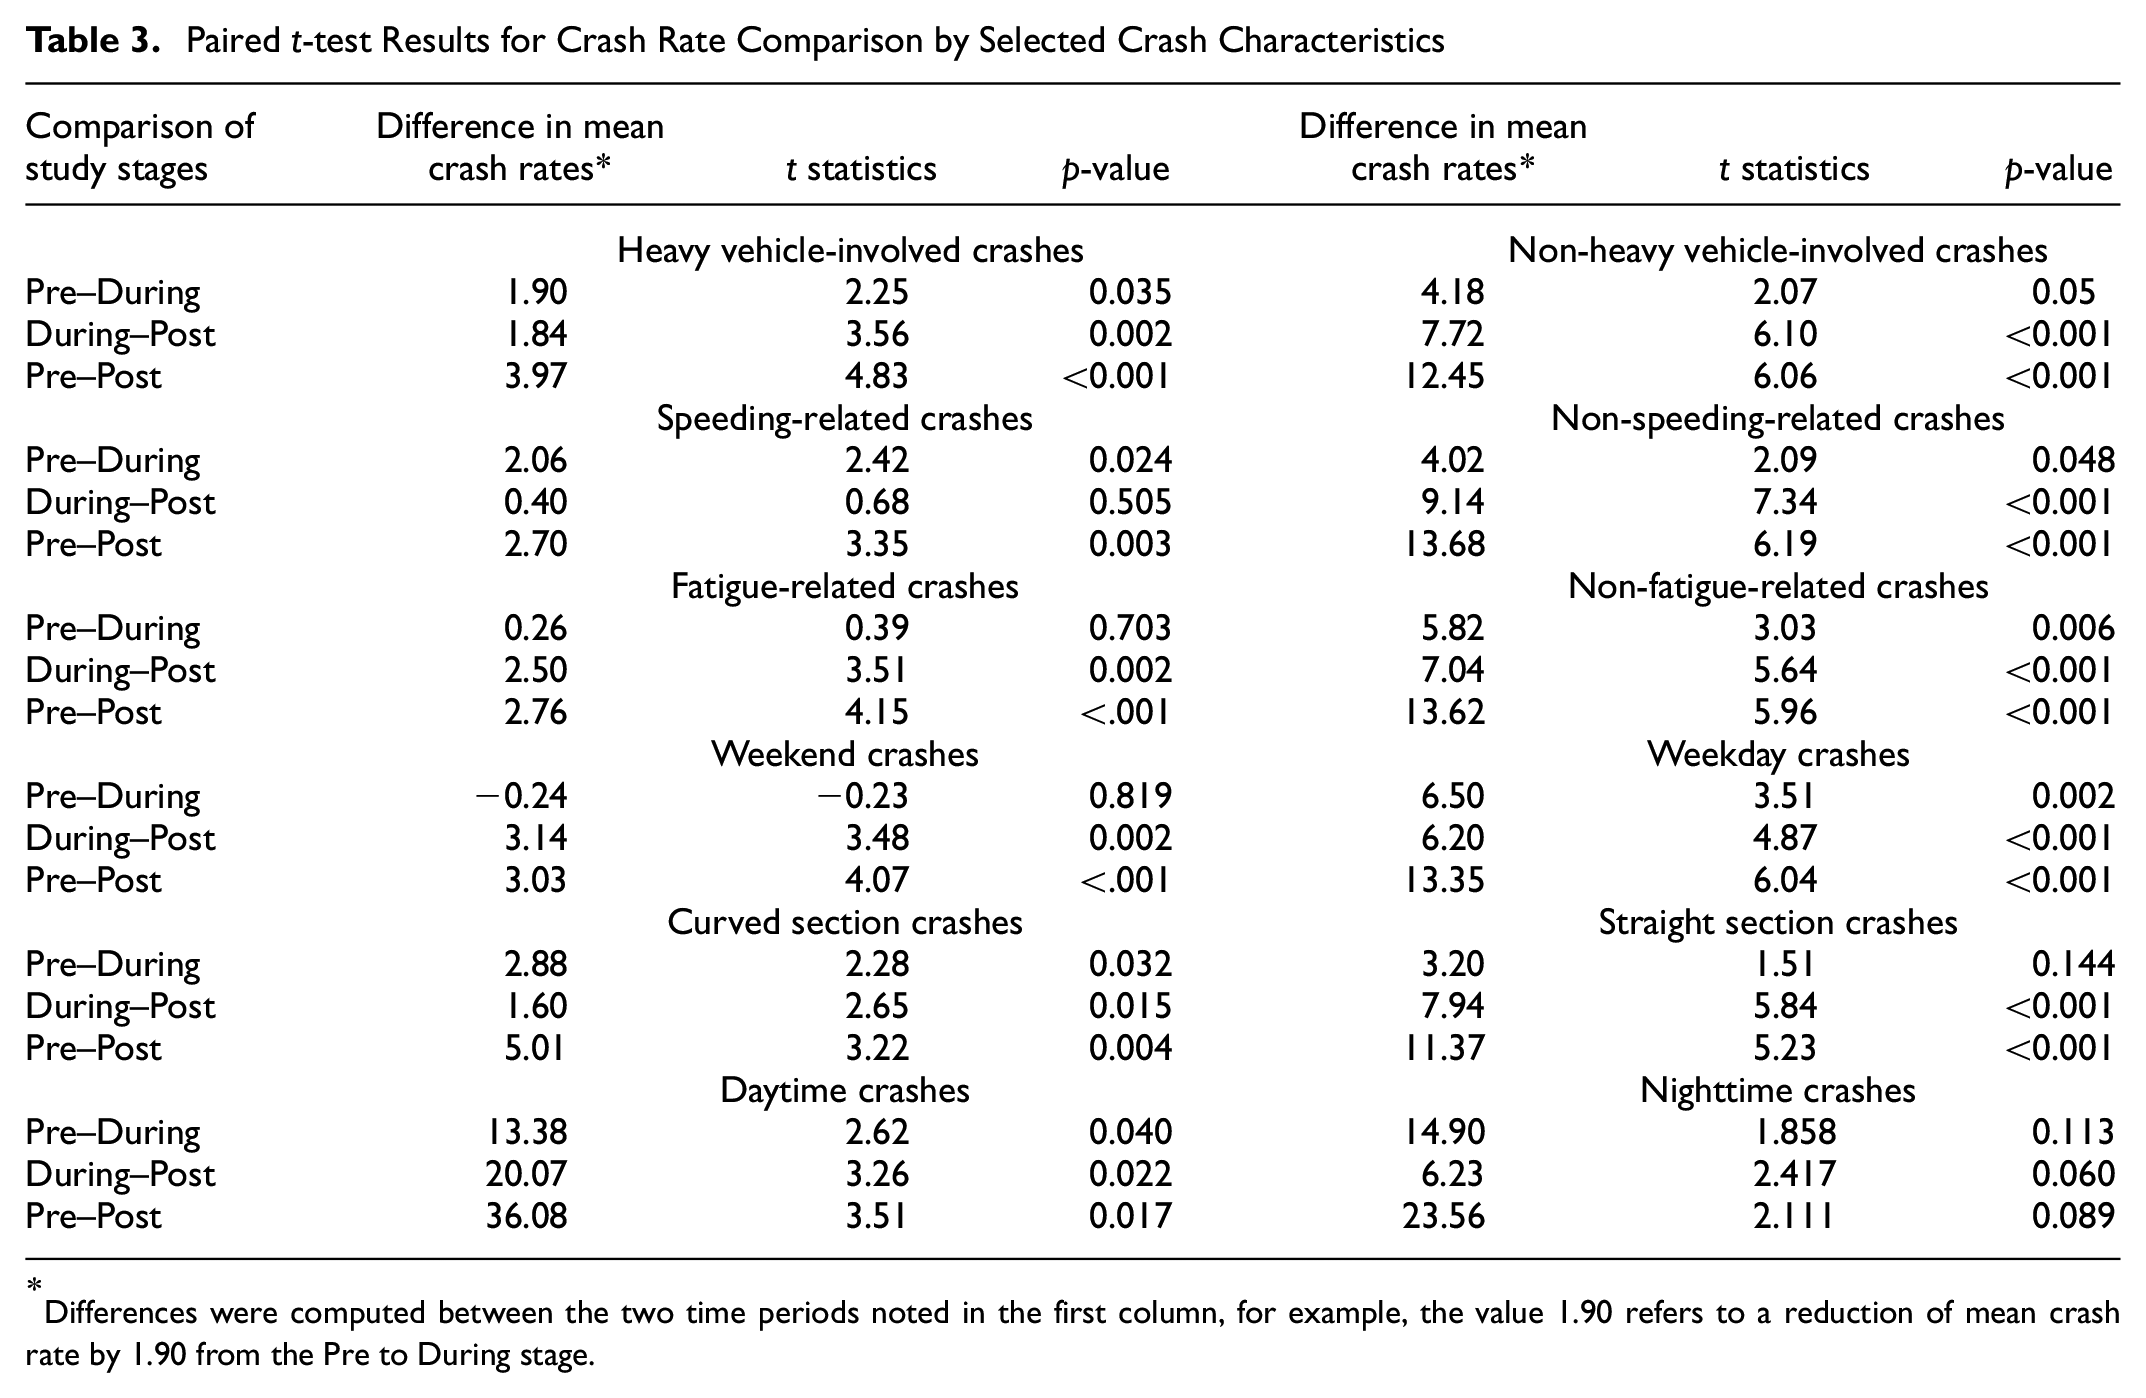
Differences were computed between the two time periods noted in the first column, for example, the value 1.90 refers to a reduction of mean crash rate by 1.90 from the Pre to During stage.
Table 3 shows that statistically significant reductions in crash rates were observed regardless of whether one or more heavy vehicles were involved in crashes. However, greater reductions were obtained for crashes that did not involve a heavy vehicle. For example, a reduction of 12.5 crashes per 100 MVKT was obtained for non-heavy vehicle-involved crashes from the Pre stage to the Post stage, which was substantially higher than the reduction obtained for heavy vehicle-involved crashes (four crashes per 100 MVKT).
Speeding-related crashes were reduced during roadworks; however, no further statistically significant reductions were observed after roadworks were completed. In contrast, non-speeding-related crashes were reduced significantly in all stages and at substantially higher rates than the speeding crashes (13.7 versus. 2.7 crashes per 100 MVKT reductions from the Pre stage to the Post stage).
Similar to speeding-related crashes, the reductions in fatigue-related crashes were also statistically significant and of lower rates than the non-fatigue-related crashes (2.8 versus 13.6 crashes per 100 MVKT reductions). When compared separately for the three study stages, statistically significant reductions from the During stage to the Post stage were found for both types of crashes. However, the reduction from the Pre stage to the During stage for fatigue-related crashes was not statistically significant.
Statistically significant reductions in crash rates were observed for the crashes that occurred on weekdays (13.4 crashes per 100 MVKT reduced from the Pre stage to the Post stage) and at a lower rate for weekends (3.0 crashes per 100 MVKT reduced from the Pre stage to the Post stage). Whereas a statistically significant reduction from the Pre stage to the During stage was observed for weekday crashes, the differences in mean crash rates were not statistically significant for weekend crashes. From the During stage to the Post stage, both weekday and weekend crash types saw statistically significant reductions.
The reduction in crash rates from the Pre stage to the Post stage for straight sections was substantially higher than that for curved sections (11.4 versus 5.0 crashes per 100 MVKT reductions). Similarly, from the During stage to the Post stage, higher reductions were observed for straight sections than curved sections. Whereas the reductions from the Pre stage to the During stage were similar for curved and straight sections, the reductions for straight sections were not statistically significant.
Daytime and nighttime crashes were obtained from seven out of the nine sites. The reductions in crash rates during nighttime were not statistically significant at 95% confidence level, and no conclusive findings were noted between the daytime and nighttime reductions.
Discussion
Although road construction and upgrade works are undertaken to improve the safety and mobility aspects of road network, the literature has produced inconsistent findings on how the level of safety changes at different stages of roadworks, such as the Pre, During, and Post roadworks stages ( 2 , 6 , 11–14). To contribute to this important area of road safety, this paper examined the crash rates at twenty-four road links from nine major high-speed roadwork projects in the regional areas of the NSW state of Australia. Police-reported crash data and characteristics of work zones were analyzed to statistically compare the crash rates (number of crashes per 100 MVKT) using descriptive statistics and paired t-tests. Comparison of all three stages with recent data from an Australian jurisdiction which have not been subjected to such analysis before, marks the key contribution of the current paper.
Analysis of crash rates showed that significant reductions in crash rates were obtained from the Pre stage to the Post stage, suggesting that overall safety has been improved at the study sites substantially, following roadwork improvement works at these major projects. Greater reductions in crash rates were found from the During stage to the Post stage, in comparison with the reduction from the Pre stage to the During stage. Although some sites and road links had varying crash rates, collectively for all sites and road links the reductions were statistically significant. In general, this overall finding is in line with those found in Ha and Nemeth ( 13 ) and Hall and Lorenz ( 14 ), and against those found in La Torre et al. ( 2 ), Daniel et al. ( 6 ), Jin et al. ( 11 ), and Li and Bai ( 12 ). As noted earlier, contradictory findings on the changes in crash rates and injury severity levels during roadworks have been obtained by many studies in the literature.
Although an investigation on the causes of such contradiction in findings was beyond the scope of the current paper, arguably factors other than the presence of roadworks could play a big role. Work zones are complex environments with challenging driving conditions ( 26 , 27 ), thus having various geometric, traffic, and traffic management characteristics across work zones which could influence the overall safety levels. In addition, driver behavioral factors, such as speeding, driving on unfamiliar routes, adaptation to different signage and work zone controls, distracted driving and level of distraction caused by roadwork activities could also influence the overall safety levels. Furthermore, the scope, data, and analysis methodologies used in the existing studies differ substantially, and could have influenced the inconsistencies in the findings of these studies. Future research on a meta-analysis of the findings from existing studies would be useful to investigate the causes and trends in the inconsistent findings. Future research should also focus on understanding the changes in crash rates and injury severity levels for different types of crashes. The presence of roadworks is often associated with an increase in rear-end and end-of-queue crashes ( 8 ). As such, it is important to investigate whether the changes in crash rates and injury severity levels for rear-end and end-of-queue crashes are different from other types of crashes. Understanding the differences for different types of crashes would allow the development of targeted countermeasures for different types of work zone crashes.
In addition to the analysis of crash rates for all crashes, this study also analyzed the rates for different injury severity levels and characteristics of crashes and work zones. Fatal and injury crashes were found to reduce from the Pre stage to the During and Post stages, as also found in other studies ( 13 , 14 ). Greater reductions were found for MMI crashes than for FSI crashes. In contrast, La Torre et al. found a 33% increase in FSI crash rates during roadworks ( 2 ). Work zones usually have lower posted speed limits during roadworks than before roadworks, and once roadwork activities are completed the roads are likely to improve from design and pavement condition perspectives. As such, reduction in injury crashes is expected during and after roadworks.
In relation to crash characteristics, greater reductions in crash rates were found for crashes that did not involve a heavy vehicle than the heavy vehicle-involved crashes, or that were not related to speeding or fatigue issues than those with such issues. The literature showed that speeding is a common issue in work zones ( 26 , 28 , 29 ), often combined with driver inattention and fatigue-related issues ( 27 ). As such, a limited reduction in the rates of crashes involving speeding and fatigue issues is somewhat expected. Studies also show that nighttime active work zones do not result in significantly greater crash risk, mainly because of lower traffic volumes ( 20 ). However, Zhang and Hassan found that daytime crashes are less severe during rainy or foggy weather as a result of higher driver attentiveness ( 21 ). The current study did not allow us to derive conclusions on the effects of driver distraction and reduced roadwork speeds on crash occurrence and outcomes.
A greater reduction in crash rates during weekdays than weekends was observed. However, the data of the current study did not provide additional insights into why this finding was obtained. Future research should investigate the potential effects of time-of-day and day-of-week effects together to better understand how crash rates vary at different time periods. Furthermore, changes in roadway conditions for Pre, During and Post stages such as the width of lanes and other available safety devices could have influenced the results. As this study was done using publicly available data and historical aerial imagery, it was not possible to capture these aspects in the analysis.
Although the current study contributes to the debate in the literature on how crash rates and injury severity levels vary at different stages of roadworks, it has some potential limitations. This study focused on high-speed major roads in regional areas and, therefore, careful attention needs to be paid in transferring the findings to other road types. This study uses crash data from a police-reported crash database, and it is recognized that police-reported crash datasets may have a greater level of under-reporting for non-injury and minor injury crashes than the FSI crashes. In addition, the AADT data used in the current study were taken from traffic-counting stations nearby the study sites and further estimation was made by applying linear growth rates for each respective year of observations, rather than using observed traffic volumes for each project and road link, because of the unavailability of data. It is noted that substantial changes in AADT values are unlikely to be observed, as the study sites are regional highways and alternative routes are unavailable for most sites.
Future research should focus on systematic gathering of exposure and roadwork type and duration data (e.g., short-term and long-term roadworks) to derive further insights into the crash rates before, during, and after roadworks. Another useful extension of the current study will be to control for any potential changes in global crash occurrence processes and improvements in work zone safety processes during the study period using a multivariate analysis approach.
Conclusions
This paper aimed to examine the changes in crash rates and injury severity levels at high-speed work zones on regional roads before, during, and after roadworks. Statistical analysis of police-reported crash data from twenty-four road segments in the NSW state of Australia showed that crash rates reduced substantially both during roadworks and after roadworks were completed. Greater reductions in crash rates were found after roadworks were completed from when the work zones were active, in comparison with the reduction observed from the before roadworks period to the during roadworks period.
In addition to the reduction in overall crash rates, a reduction in fatal and injury crashes was also observed, with greater reduction for the MMI crashes than for the FSI crashes. Greater reductions in crash rates were also observed for crashes that did not involve a heavy vehicle than the heavy vehicle-involved crashes, crashes that are not related to speeding or fatigue issues than those with such issues, crashes that occurred during weekdays than weekends, and crashes that occurred at straight sections than at curved sections.
The findings of this study contribute to the inconsistent findings reported to date in the literature on the effects of roadworks on crash rates and injury severity levels. Insights from Australian work zones as reported in the current study add to the existing literature, which has been produced primarily from the USA and Europe. A particular strength of the current paper is that it provides insights for three stages of roadworks (pre, during, and post roadworks), whereas existing studies have primarily focused on the pre and during stages and those which focused on all three stages are dated. As such, the findings reported in the current study are expected to provide researchers and practitioners updated understanding from recent data with respect to recent roadwork traffic management tools and processes.
Footnotes
Author Contributions
The authors confirm contribution to the paper as follows: study conception and design: D. McClure, S. Siriwardene, A. Debnath, L. Truong; data collection: D. McClure; analysis and interpretation of results: D. McClure, S. Siriwardene, A. Debnath, L. Truong; draft manuscript preparation: S. Siriwardene, A. Debnath. All authors reviewed the results and approved the final version of the manuscript.
Declaration of Conflicting Interests
The author(s) declared no potential conflicts of interest with respect to the research, authorship, and/or publication of this article.
Funding
The author(s) received no financial support for the research, authorship, and/or publication of this article.