
Abstract
To understand the dynamics of an autonomous ridesharing transport mode from the perspectives of different stakeholders, a single model of such a system is essential, because this will enable policymakers and companies involved in the manufacture and operation of shared autonomous vehicles (SAVs) to develop user-centered strategies. The model needs to be based on real data, network, and traffic information and applied to real cities and situations, particularly those with complex public transportation systems. In this paper, we propose a new agent-based model for SAV deployment that enables the parametric assessment of key performance indicators from the perspective of potential SAV users, vehicle manufacturers, operators, and local authorities. This has been applied to a case study of three regions in London: central, inner, and outer. The results show there is no linear correlation between an increased ridesharing acceptance level and average trip duration. Without a fleet rebalancing algorithm, over 80% of SAVs’ energy expenditure is on picking up customers. By reducing pickup distance, SAVs could be a contender for a nonpersonal transportation system based on trip energy comparisons. The results provide a picture of future SAV systems for potential users and offer suggestions as to how operators can devise an optimal transportation strategy beyond the question of fleet size and how policymakers can improve the overall transport network and reduce its environmental impact based on energy consumption. As a result of its flexibility and parametric capability, the model can be utilized to inform any local authority how SAV services could be deployed in any city.
Keywords
Autonomous vehicles (AVs), connected autonomous vehicles (CAVs), and shared autonomous vehicles (SAVs), which are fully automated at level 5 of automation (according to the classification provided by the Society of Automotive Engineers) and fully electric, are thought to be a transformative technology that will address the high demand for transportation in cities. Furthermore, through the deployment of SAVs, high-density cities could reclaim curb space for uses other than increasing the number of parking spaces to accommodate personal vehicles. From the users’ perspective, SAVs have the potential to provide more convenient and quicker journeys than public transportation, although likely at a higher cost.
Numerous models have been developed for understanding the interaction between autonomous ridesharing scenarios and SAVs. However, as outlined by Levin et al. ( 1 ), many of these models are limited by their use of unrealistic scenarios, a congestion modeling approach, grid networks, links with same travel times, and/or very small nodes and fleet sizes. Therefore, new agent-based models employing case studies of real cities have emerged ( 1 – 6 ). However, the research on SAVs is piecemeal, with limited overlap of the findings, and a heavy focus on the perspective of the transportation network operators. Studies have tended to concentrate on determining the minimum fleet size and, thus, potential users might be left asking, “But what do these findings mean for me?” It is often the users who need to be convinced of the technology, services, and functionality of a new transportation system. Therefore, this paper outlines a novel framework with new key performance indicators (KPIs) from the perspective of users as well as that of vehicle manufacturers, operators, and policymakers.
Furthermore, as discovered by Jing et al. ( 7 ), with regard to existing research and models, particularly in relation to AVs in general, the average trip distances and journey times are unclear to the reader. Average trip distances are not only useful for understanding the scale of the model and, indirectly, the setting, for example, the city or suburbia, but according to Fagnant et al. ( 8 ), such information, along with average speeds and travel demand, is important for predicting the system performance. Marczuk et al. ( 9 ) states that the scale of the service area, travel demand, and service rate are key inputs for calculating the required fleet size. Thus, without context, the actual ideal fleet size is irrelevant. In addition, most models have provided minimal information on routing strategy, but this can change the trip distance and, therefore, the entire dynamics of the SAV operation.
In addressing these gaps, we develop a parametric agent-based modeling framework for modeling large-scale SAV operations. In contrast to current models, we define three agent types with distinct properties and decision-making capabilities that are interconnected through an interaction network. The algorithms are tested in three London case studies with varying network layouts, demand intensity levels, and ridesharing likelihood. Thus, this paper provides three main contributions to the state of the art:
An agent-based modeling framework for SAV systems independent of other software based on consolidation of theories and methods to capture KPIs in relation to all stakeholders: users, vehicles, operators, and policymakers.
A new finding indicating that different levels of ridesharing acceptance can have an impact on the operation of the SAV system and on the customer experience.
A new conclusion reporting that with an effective fleet management strategy SAVs have the competitive potential to be more energy efficient than buses in the three regions of London studied.
So that anyone can replicate the framework, we provide transparency with regard to the decision problems of every agent type, such as in our routing algorithm. The modeling framework is designed to be used by any autonomous fleet operator and organizations such as local authorities to help them understand the key challenges they may face and develop strategies on how to regulate CAV fleets within the existing urban infrastructure.
The following section reviews the relevant literature in the field of AVs and SAVs, particularly with regard to agent-based simulations. Next, the methodology and agent-based framework are explained. The model is then applied to a case study: three regions of London. Following this, the results and associated recommendations are discussed. Finally, some future steps are presented and the conclusions are offered.
Literature Review
Ridesharing is offered in practice every day by transportation network companies (TNCs) such as Uber, Lyft, Grab, and DiDi in China, MOIA or CleverShuttle in Germany, and Liftago in Prague in the Czech Republic. Uber, Lyft, and Grab also offer shared rides under the names of UberPool ( 10 ), Lyft Shared ( 11 ), and GrabShare ( 12 ). All operate according to a centralized business model in which the operator and not the individual driver is responsible for trip assignments. Because of the recent High Court ruling in the UK, Uber here allows no direct contact between drivers and users ( 13 ).
SAV systems are situated at the intersection of various research categories: vehicle dispatching of any on-demand mobility services, but especially in the field of AVs; AV routing systems; ridesharing; optimal fleet sizing; charging of electric vehicles, emissions modeling; mode choice and whether the system is independent or integrated with public transportation; and rebalancing of an empty or idle fleet. A summary of the literature review can be found at the end of this section in Table 1. This research addresses every aspect mentioned here.
Summary of Literature Review
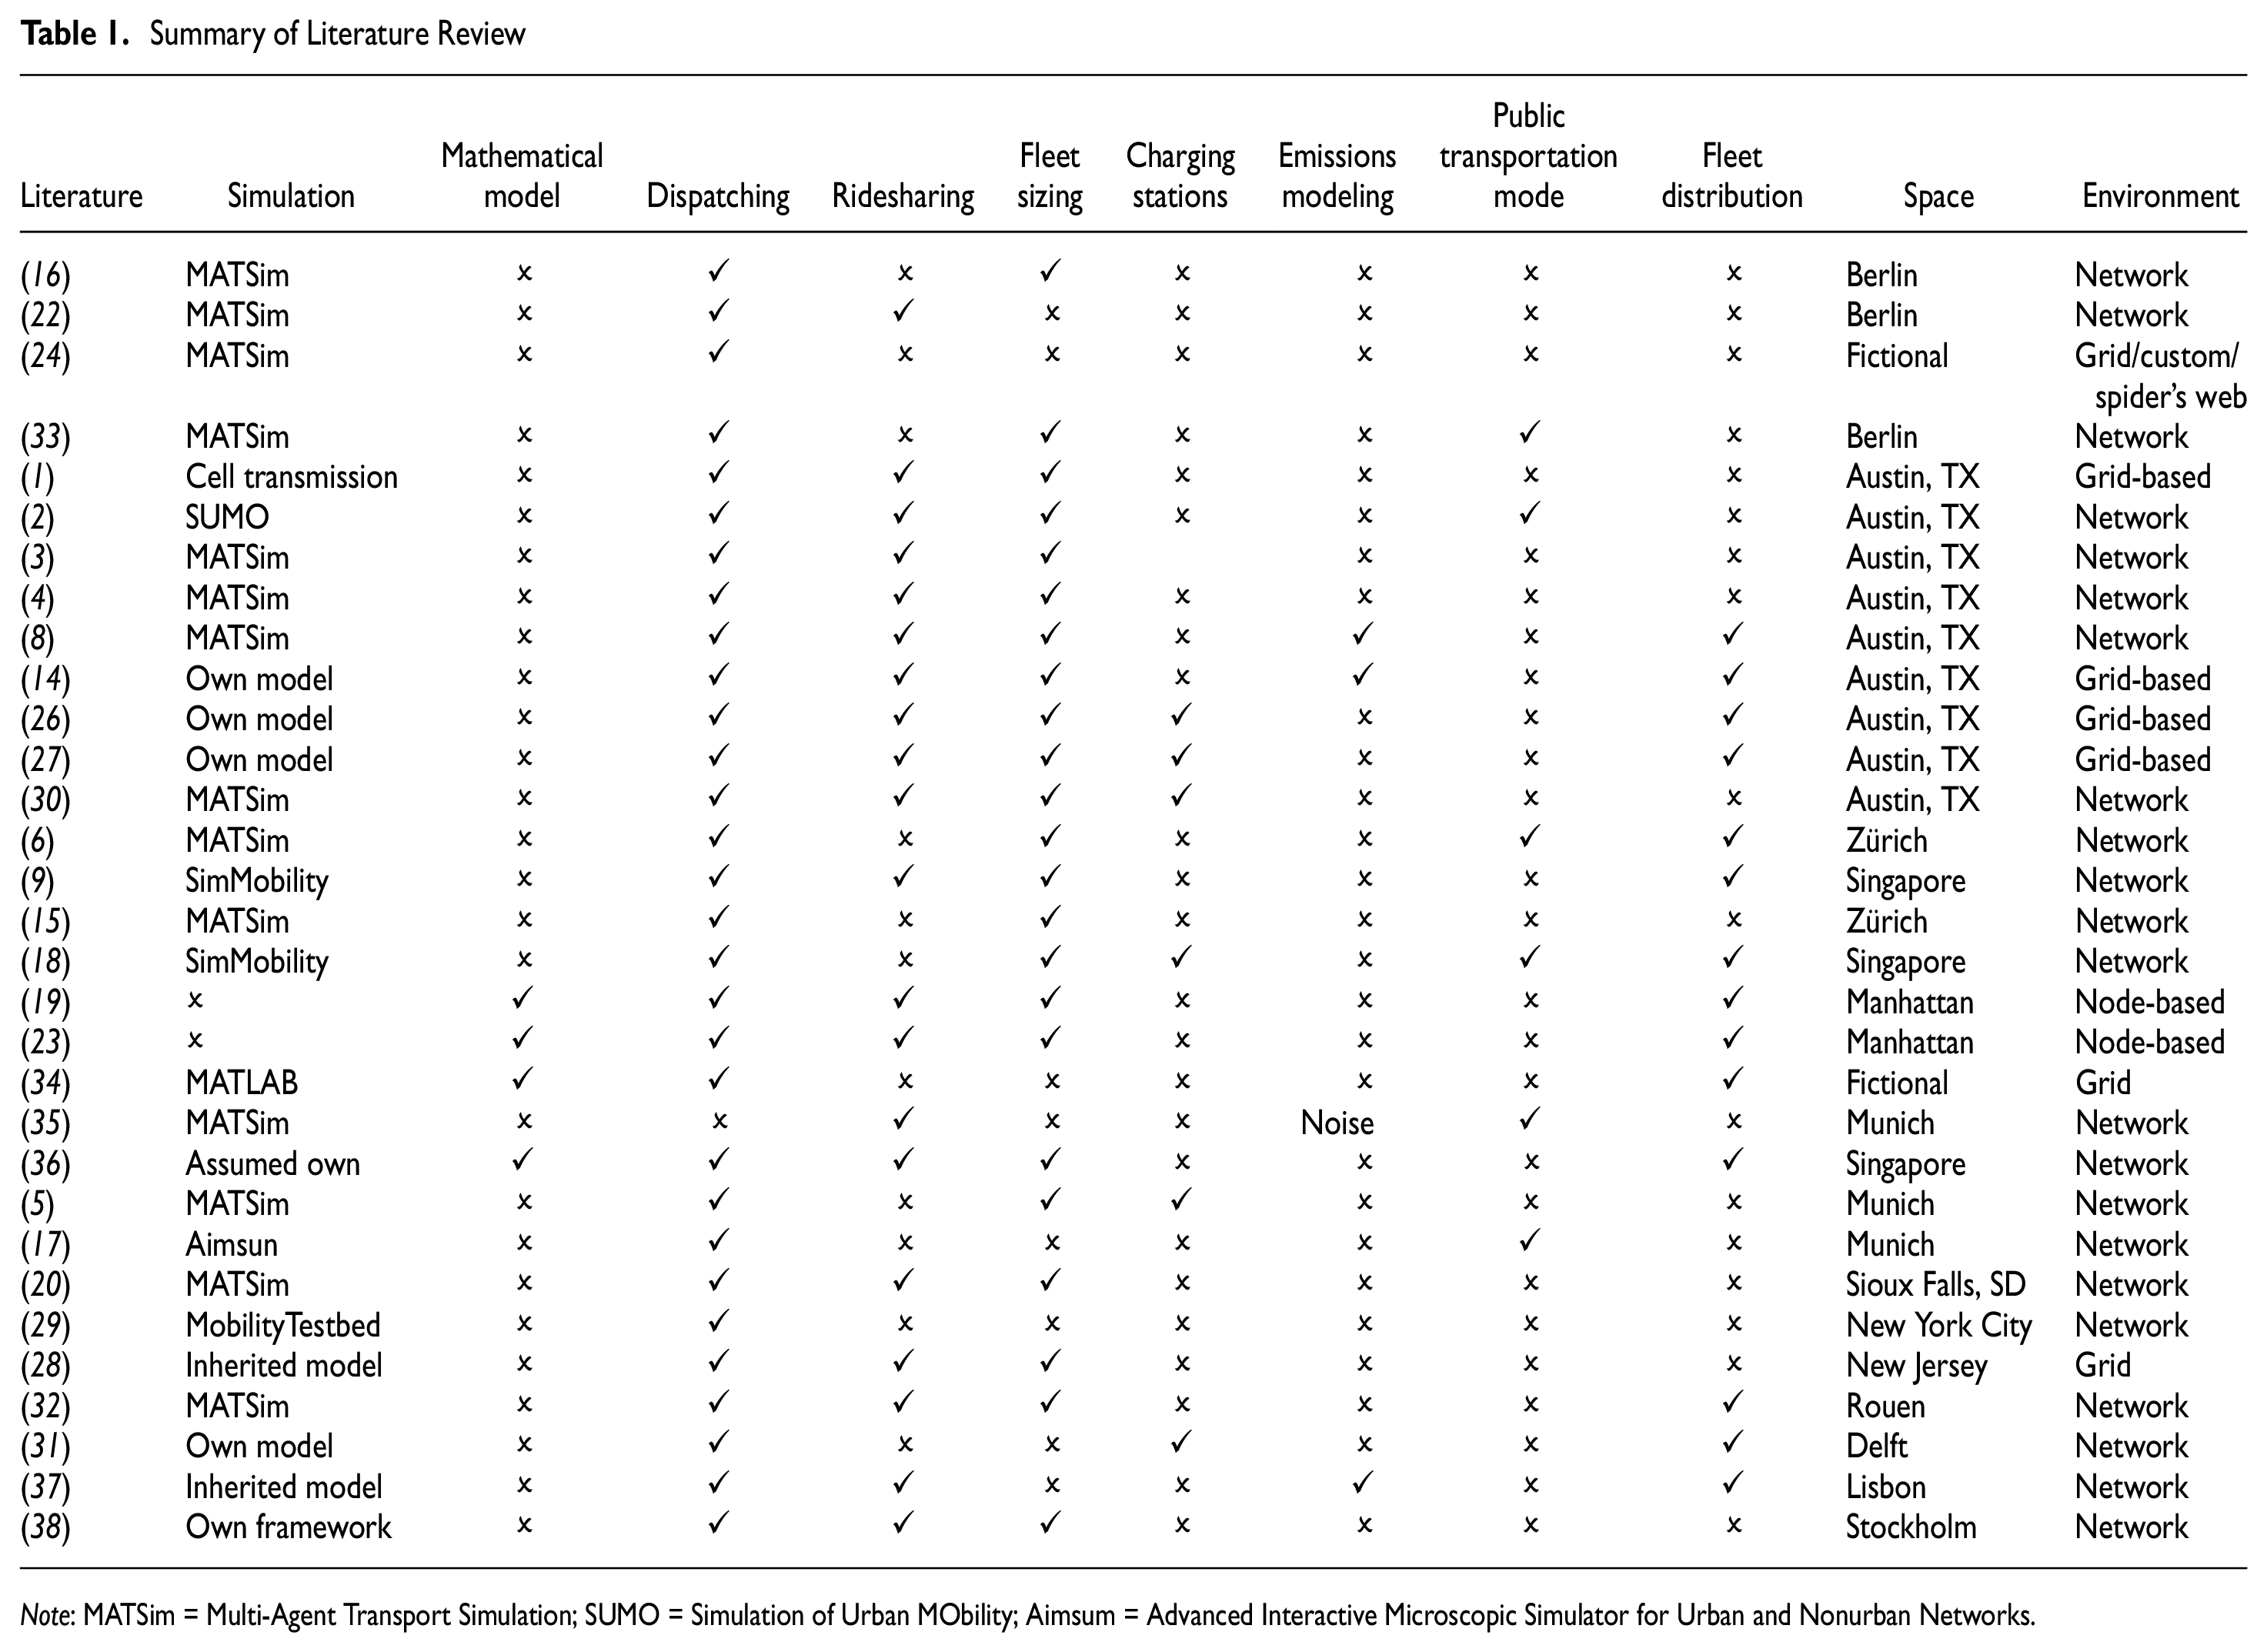
Note: MATSim = Multi-Agent Transport Simulation; SUMO = Simulation of Urban MObility; Aimsum = Advanced Interactive Microscopic Simulator for Urban and Nonurban Networks.
With regard to terminology, as indicated by Jing et al. ( 7 ), the abbreviation SAV is often used by Fagnant and Kockelman ( 14 ). Other authors use the terms AVs ( 15 ), autonomous taxis or aTaxis ( 16 , 17 ), autonomous mobility on demand ( 18 , 19 ), autonomous transit on demand ( 20 ), autonomous connected electric shared vehicles ( 21 ), or shared autonomous electric vehicles ( 3 ). Ridesharing is also termed ridepooling, particularly in Germany, and studies here sometimes consider payloads of more than four seats ( 22 , 23 ). In the literature, the term fleet rebalancing is used interchangeably with relocation and redistribution. Vehicle assignment is also called dispatching or deployment.
Many of the existing simulation-based studies employ networks using an existing agent-based type of transport software, Multi-Agent Transport Simulation (MATSim). Jing et al. ( 7 ) reported that out of the 44 journal articles studied, 20 reported using MATSim. Any model using MATSim is assumed to use its demand-responsive transport or dynamic vehicle routing problem modules based on a memetic algorithm, which is an extension of a genetic algorithm ( 24 ), or Dijkstra’s algorithm ( 8 ), as in Bell and Lida ( 25 ). Some of the studies use real urban road networks; however, in contrast to the cities studied using MATSim, this paper considers a major metropolis: London. Other studies, for example, Fagnant and Kockelman ( 14 ), Chen and Kockelman ( 26 , 27 ), and Brownell and Kornhauser ( 28 ), used models based on a grid system, in some cases a homogeneous one, but such grid-based environments can neglect the realistic traffic flow on the roads. None of the studies explore the effect of different network topologies.
Many of the studies reviewed follow a robust dispatching system, often using first-in-first-out (FIFO), which is similar to first-come-first-served, except for Loeb and Kockelman ( 3 ), who tested the concept of first-in-last-out. Despite using similar algorithms, only some of the studies consider ridesharing and the resulting effect on the required fleet size. For example, a unique proposed algorithm from Shen and Lopes that was tested in New York ( 29 ) deploys AVs by dividing the urban area into separate neighborhoods through an “expand and target” method, but without ridesharing.
Most papers consider electric SAVs and acknowledge the need to consider the charging process. Some, therefore, for example, Fagnant et al. ( 8 ), Fagnant and Kockelman ( 14 ), and Loeb et al. ( 30 ), calculate energy consumption according to varying charging time capabilities, occupancy rate, fleet size, and vehicle range. However, not many papers consider the charging infrastructure required, or the variations possible, although some consider the emissions produced by AV fleets over their life cycle compared with existing fleets.
There is a noticeably limited number of studies on the comparison between SAVs and public transportation. However, Scheltes and de Almeida Correia ( 31 ) provide a case study that considers using AVs for the last mile connection from the railway station to the university campus in Delft in the Netherlands, Vosooghi et al. ( 32 ) predict a modal shift from public transportation and car modes to ridesharing in the Rouen Normandie metropolitan area in France, and Hörl et al. ( 6 ) calculate the financial incentives for users in relation to cost; however, these studies do not compare energy consumption, or examine what the introduction of AVs or SAVs would mean to their respective cities.
Despite the growing number of papers published on this topic, there are several research gaps that remain unexplored. Ridesharing and private travel are explored independently, and this separation does not allow for studying the effect of the customer having a choice with regard to the type of trip desired. Therefore, there is a lack of studies on the ideal scenario for ridesharing acceptance. More discussion can be found in the subsection Research Gaps.
Table 1 summarizes the key literature, including texts not discussed above, and its contribution to different features of SAV modeling. The rows have been combined by overlap of common authors, who may be from the same research laboratories.
Research Gaps
Our literature review reveals the need for a new network- and agent-based modeling framework independent of existing software packages such as Simulation of Urban MObility (SUMO) or MATSim that considers all aspects of SAV operation: dispatching, ridesharing, fleet sizing, charging stations, emissions modeling, public transportation, and fleet distribution. The framework uses a modular format, which makes it adaptable to different optimization problems, routing algorithms, fleet management strategies, and parameters. The advantages of lack of dependence on other software packages are the following: removal of external reliance on package updates and debugging processes; avoidance of the steep learning curve associated with unfamiliar software programs; and increased control and ownership of the model by the researcher. When analyzing the results of other software, the modeler may require much more time to understand what has contributed to these. In addition, programs such as SUMO are more suited to microsimulation. The framework developed is also KPI-focused, taking into account the perspectives of the different stakeholders.
Another gap in the literature is the lack of consideration of the different perspectives of various stakeholders. Current shared mobility platforms (e.g., Uber, Bolt, and Lyft), allow customers to accept or reject their assigned vehicle ( 39 – 41 ) as well as choose to share their ride or not. However, this is not replicated as an input in existing models and neither is it an option in simulation frameworks. Therefore, the literature has been unclear on how sharing a ride would affect the overall performance of the SAV system, and whether a customer should be aware of any potential consequences of doing so. In addition, drivers have the option to accept or decline rides assigned by the operators ( 42 – 45 ), which in the autonomous world needs to be translated as a vehicle responding to an assignment. Although this interaction of an AV responding to an assignment is predicted via an automatic logic system, a simulation framework needs to have the flexibility to test it.
The third gap in the literature is the limited number of studies on how SAVs compare directly with public transportation, as shown in Table 1. A framework capable of comparing different transportation modes can help policymakers make decisions on whether or how to promote SAVs and under what conditions.
Finally, although there is a mix of urban areas and suburbia in the case studies presented in the literature, a comparison within a city would benefit future policymakers and operators because they would be able to see how they would need to change their strategies according to the area the SAVs would be operating in. The response may be different based on the demographics, for example, variations in demand and ridesharing acceptance level, which would have an impact on the operation in general, the ideal fleet size, and the desired locations of charging stations.
Problem Statement
Based on the stated research gaps identified in the subsection Research Gaps, the question the paper seeks to answer is, “How do we model the dynamics of SAVs by considering the perspectives of different stakeholders, that is, users, vehicles, operators, and policymakers, and what needs to be considered when developing such a model?”
To answer the question, we provide the following:
a new framework independent of other software that captures KPIs relating to all the stakeholders involved: users; vehicles; operators; and policymakers;
flexibility of parametric modeling with varying inputs through a modular architecture of the framework;
a comprehensive study in a city that relies heavily on public transportation;
an investigation into the role of ridesharing and its acceptance by the customer and the resulting impact on SAV systems and policies;
an analysis of existing charging stations and the identification of a new possible station network for testing the impact on the dynamics of the SAV system; and
a comparison between a central city location, an inner city location, and suburbia, three different regions with varying environments, demand, and landscapes.
An SAV system is the operation of shared autonomous vehicles managed by a TNC to provide a mobility service that users have requested to travel from one point to another. At a lower cost and higher energy efficiency for a longer journey, users can request to share their ride with other unknown users who have different origin and destination points.
Methods
In our study, we have developed our own agent-based modeling framework specifically for SAV systems so that we have full control without reliance on external software. Using the fundamentals of agent-based modeling ( 46 ), the proposed model is comprised of three key components:
agents;
a network of interactions; and
the environment.
Agents are autonomous individuals or collective entities that are defined by properties, attributes, and states. They have their own decision-making process based on a set of rules, and these form the network of interaction between the agents ( 46 , 47 ), which is defined by the decision problems of each agent affecting others. The environment accommodates the agents; however, it also influences the agents’ actions. For instance, congestion on the environment’s road network can restrict an agent’s movement.
Definitions
As described in the Literature Review section, different terminologies are used in the literature to describe the same concepts. In this paper, we will be using the following terms:
Customer: This is the paying user, whether an individual or a group, and is represented by the lead passenger, who requests the ride and accepts or declines the assignment. A customer can consist of multiple passengers. A customer consisting of two passengers consists of one lead passenger and a co-traveler. In this paper, we use the term customer or user. An equivalent term “rider” is used by some shared mobility companies ( 39 , 48 ).
SAV: A shared autonomous vehicle is a single vehicle in the bigger SAV system.
Operator: The operator is the transportation service company, which is also often referred to as the TNC. The operator is responsible for assigning vehicles to trip requests from customers.
Sharing a ride: A customer can choose to share a vehicle with other customers who have different origin and destination points. A customer can be picked up from anywhere and does not need to go to a designated virtual pickup point; therefore, the ride can be shared at any point during his/her trip. Sharing customers do not have control over the number of people they share their ride with, or the areas where other customers can be picked up from or dropped off at.
Agents
In the context of SAV deployment, three agent types are defined: users; vehicles; and operators. Each agent is unique and has certain properties. Users are potential customers who submit a request for a ride with a pickup and drop-off location, the requested time, and their willingness to share a ride. A vehicle corresponds to an individual SAV, which transports the user from origin to destination. All vehicles are bound by a set of operational constraints relating to the available seats, battery or fuel level, engine type, and an associated cost or routing function. A fleet of vehicles is controlled by an operator agent with particular assignment and management strategies. The outputs for each agent following the agent-based simulations are formulated as KPIs. Although more KPIs can be measured, Table 2 lists only those in the results.
Agents’ Properties, Behaviors, and KPIs
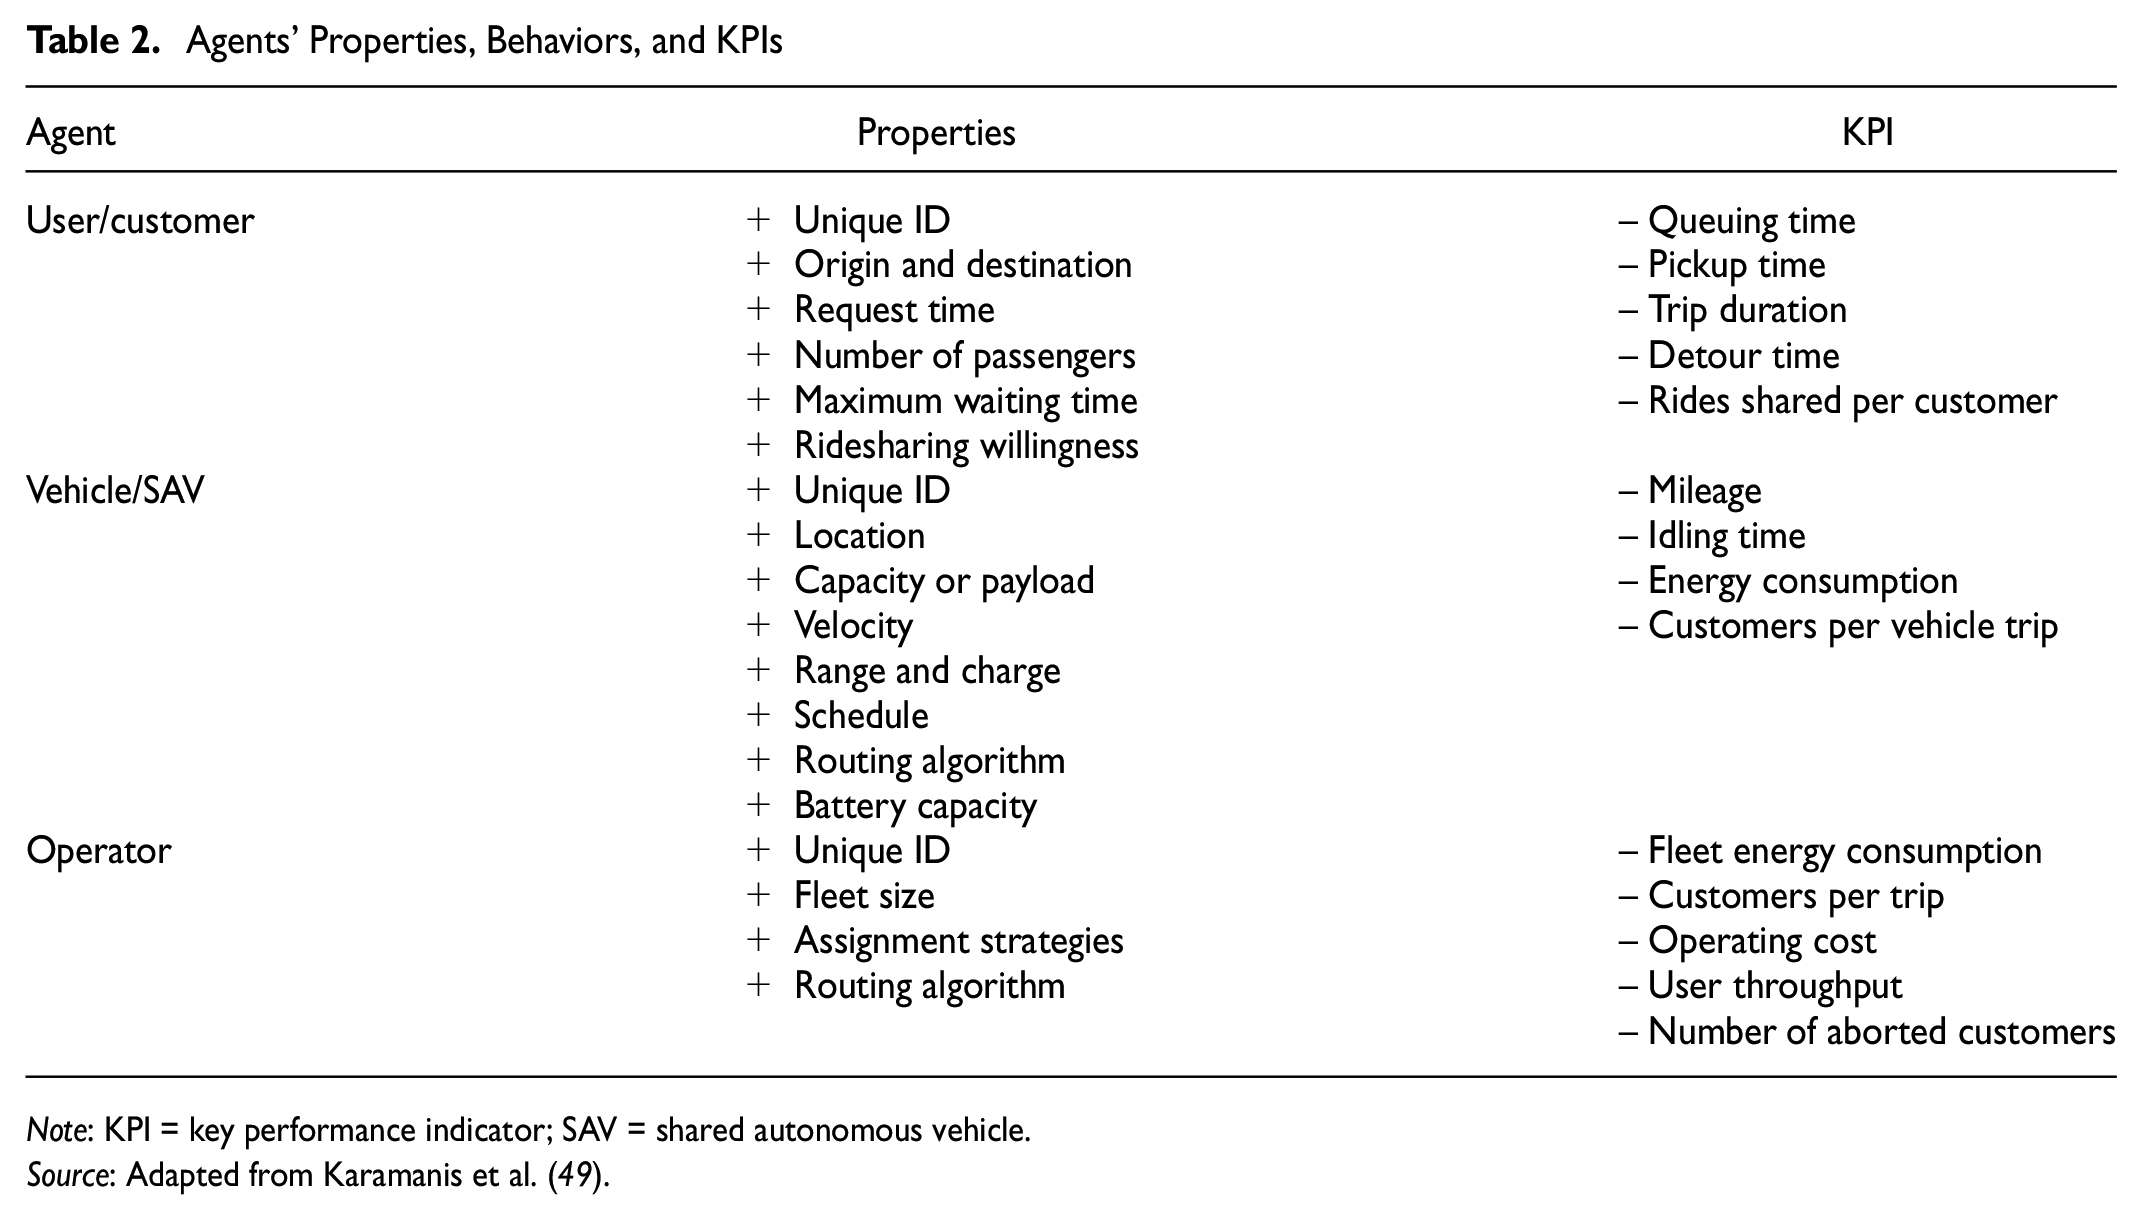
Note: KPI = key performance indicator; SAV = shared autonomous vehicle.
Source: Adapted from Karamanis et al. ( 49 ).
Some of the properties and KPIs are specific to the SAV context. The ridesharing willingness refers to the likelihood of a user being willing to share a ride. This introduces heterogeneity to the user agent type. Queuing time is from the perspective of the user, and it means the time a user is in the queue waiting for a vehicle to be assigned to him/her. This is often used interchangeably with the term assignment time, but can cause confusion because assignment time for the user is different to the assignment time for the vehicle, during which the vehicle waits in idle mode for the next assignment. Assignment time for the vehicle is called idle time in this study. Pickup time is the time between assignment and the vehicle arriving at the pickup point. Detour time is the additional time the user experiences because of the ride being shared with other users. A detour is when a trip is extended to pick up or drop off other users, as explained by Figure 1.
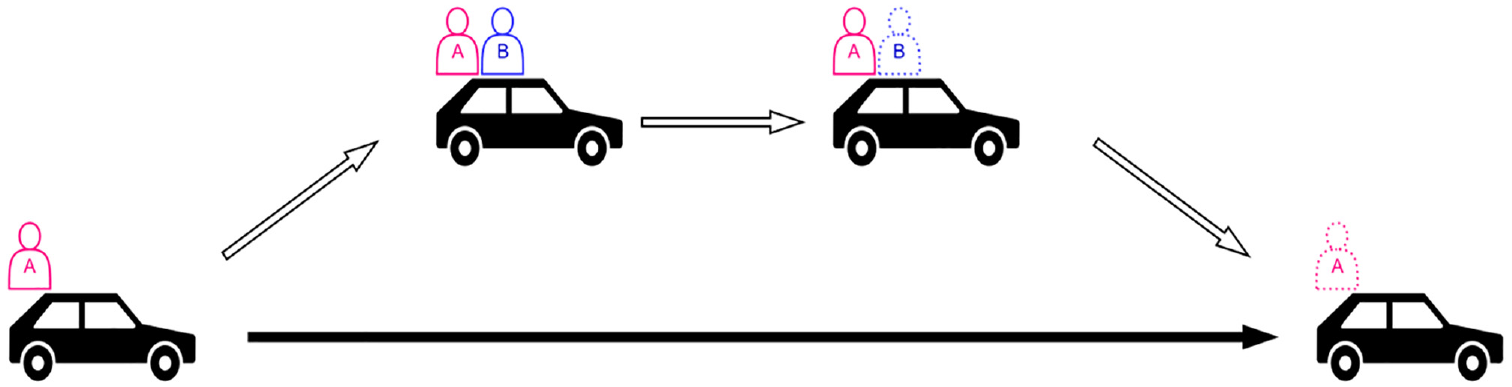
Diagram of a detour that user A experiences.
In ridesharing, new KPIs such as customers per trip and rides per customer, which are not the inverse of each other, are introduced. Conventional AV deployment modeling would not involve these. Customers per trip is a KPI in the interests of the operator, and rides per customer is a KPI in the interests of the customer. Customers per trip is the number of customers sharing a vehicle trip over the longest time the vehicle has at least one customer. Rides per customer is the number of trips a customer may undertake during his/her journey. An example is shown in Figure 2.
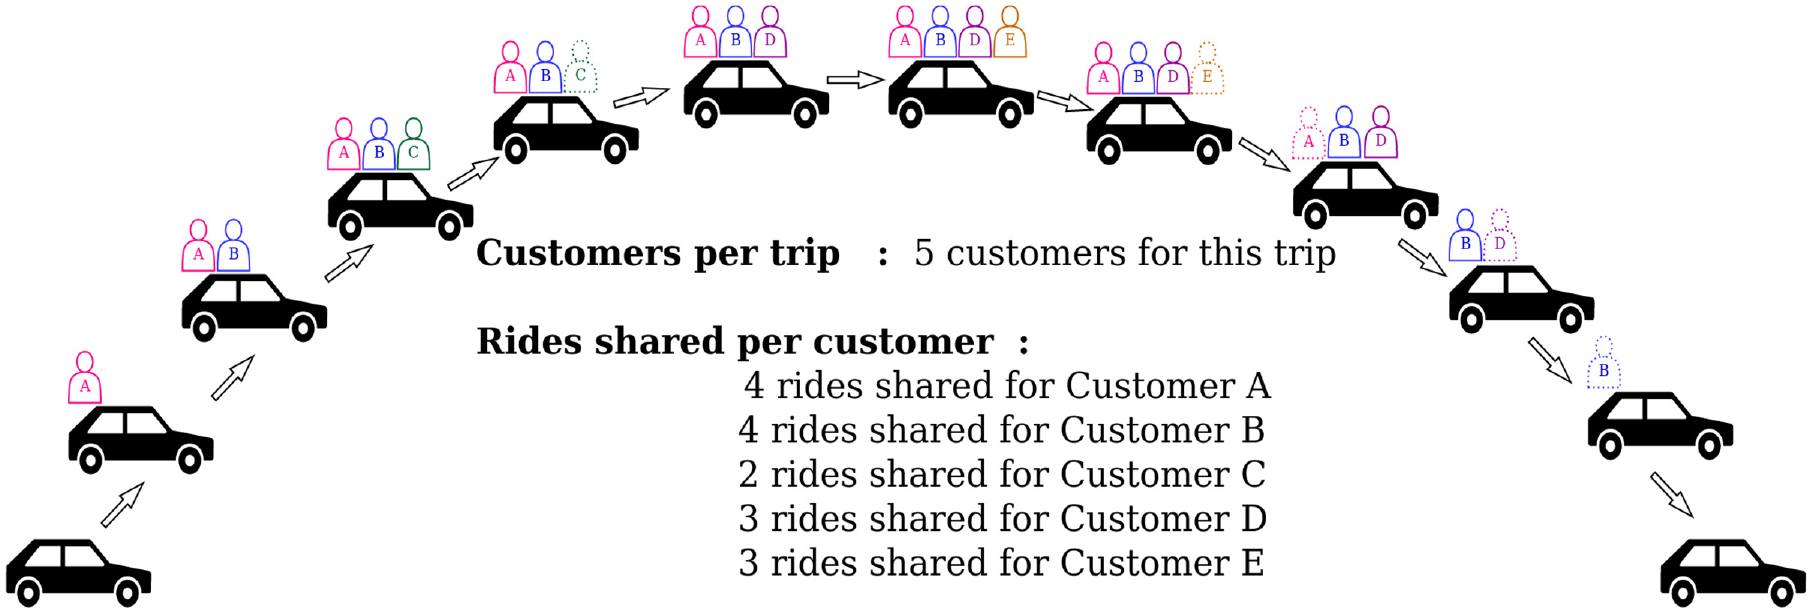
Example of ridesharing KPIs.
If a vehicle picks up customer A, then customer B, then customer C, and then drops off customer C, then picks up customer D and then E, and then drops off customers E, A, D, and B successively, because customer B extends the joint trip taken with customer A, there have been five customers on this vehicle trip.
The metric of rides per customer has been developed for three reasons. First, there is an expected increase in detour time associated with sharing multiple rides, and this may seem unattractive to many customers depending on their preferences.
Second, there is currently an issue with regard to passenger “no-show” ( 10 , 50 ). To give the customer the benefit of the doubt, drivers have an obligation to wait for two to eight minutes for the assigned customer, sometimes at an additional charge depending on the platform ( 10 , 48 , 50–52). If customers consist of multiple passengers, they increase the possibility of delays if one person in the party does not turn up on time. Therefore, to limit this issue, as an example, UberPool has a restriction of two trips per share and a maximum of one or two passengers per rider group, depending on the location ( 10 , 53 ).
Third, other than delays, some passengers may have a preference with regard to the number of strangers they would like to share their journey with. Sharing an intimate car space with one or two strangers may be endurable at a cheaper fare and in the interests of a greener ride for those customers who are conscious of climate change matters. However, even for the same customer base, sharing with 10 strangers throughout a journey may be quite a daunting thought, and the passenger may perhaps prefer to take a bus instead. Therefore, a potential customer may be interested in how many rides they could possibly share within their own journey to decide whether to opt for a shared ride.
Network of Interactions
The network of interactions in the SAV context is based on the process of an operator acting as a broker between the users and vehicles without a direct interaction between the two. A user contacts an operator to request a ride. The operator then responds with an assignment of a vehicle ideally within the expected queuing and pickup time to avoid cancellation. If the user accepts the assignment, the operator sends the assigned vehicle to the requested location. The vehicle then loads the user. Depending on the user’s ridesharing acceptance level, the vehicle goes directly to the destination or picks up or drops off additional users on the way. On unloading of the user, if the vehicle is empty, it enters the idle state. If the charge on the vehicle is low, it is sent to a charging station to be charged. It then goes back to idle state, at which it is ready to be assigned new trips.
Fleet Assignment Strategy
The assignment strategy implemented is based on FIFO heuristics to aggregate assignment optimization. In this queuing structure, users enter the end of a single queue of unassigned travelers on request submission. This has also been implemented by Fagnant and Kockelman ( 4 ), Maciejewski and Nagel ( 24 ), and Malikopoulos et al. ( 54 ). If the customer requests a nonsharing vehicle, the operator assigns the closest vehicle to each traveler sequentially, from first to last in the queue. If the customer requests a shared ride, any available vehicle with enough space to accommodate all the passengers in the user group is considered for assignment. Based on availability, either a sharing vehicle or the closest empty vehicle is assigned.
Fleet Management Strategy
Although the proposed framework has the capability to implement a redistribution strategy in relation to empty vehicles, in this study, an unassigned vehicle remains idle at the last drop-off point to minimize traveling empty. However, there are benefits in redistributing vehicles to reduce the total fleet distance of driving empty. In revious research, Karamanis et al. ( 55 ) introduced fleet redistribution.
As described by Boesch et al. (
15
), the initial geographical distribution of SAVs can have an impact on the simulation results. Therefore, the proposed framework has a warm-up period set at one hour by default, during which all the SAVs are introduced into the network at
Vehicle Routing Strategy
In the proposed framework, the SAVs find the most feasible path using an A* search algorithm. This improves on the Dijkstra algorithm for finding the shortest path through heuristics, thereby reducing simulation time ( 29 , 56–58).
Vehicle Battery Charging Strategy
A charging strategy in which a vehicle dynamically monitors its current charge is implemented. If the charge falls below the recharge threshold, the vehicle needs to finish the current trip and head to the nearest available charging station. The recharge threshold can be dynamic or constant with a safety margin based on the distribution of the charging infrastructure ( 59 ). In the proposed model, a fixed recharge threshold is set at 30%, because this was a suitable value within the scale of operation of the case study.
The time a vehicle spends at a charging station depends on the charging rate of each station and the minimum charged threshold of the vehicle battery before accepting assignment of trips. In the base model, the minimum charged threshold is set at 90%, and the charging rate is set at 2 W/second, because this represents the speed of a 7 kW fast charging station in London ( 60 ). Not all electric vehicles are compatible with rapid charging, so this technology was not included in the base model.
Vehicle Energy Consumption
Whether the vehicle is electric or powered by an engine, an AV has three types of energy consumption. The first is the power consumption of the auxiliary systems of any car, such as ventilation, radio, and headlights ( 61 ). The second is the power required by the sensing and computing subsystems to support the AV system functionality ( 62 ). These first two are particularly relevant to the idle state, at which the vehicle remains switched on to receive any assignments from the operator. The third type is related to driving, and is assocated with the distance traveled, rolling resistance force, aerodynamic resistance force, and slope resistance force. To calculate the dynamic power consumption, the base model of a vehicle is assumed to be a 2018 Nissan Leaf with a gross vehicle weight of 1995 kg ( 63 ) and an average customer weight of 77 kg ( 64 ).
Vehicle Emissions Modeling
For nonelectric vehicles, the emission levels of NOx (nitrogen oxides) and PM (fine particulate matter) were modeled, assuming that the vehicles met the Euro 6 standard. For PM, the hot exhaust emission factors from the National Atmospheric Emissions Inventory ( 65 ) were used to calculate speed-related emissions. For NOx, the instantaneous emission levels were calculated using the parameters identified by Cornec et al. ( 66 ).
Operating Cost Model
We implemented a bottom-up cost function that considers the initial investment in relation to vehicle procurement and then its subsequent depreciation, management, maintenance, and operation, as shown in Equation 1. This can provide a baseline cost for users and information for operators to enable them to develop revenue strategies.

where
Customer Mode Choice
Rather than implementing a choice model, in the proposed framework, the same customers take the train, the bus, and a private car in three separate parallel universes. This is so that the energy consumption per customer with regard to the different modes can be compared. Then, conclusions can be drawn as to how to make SAVs more competitive, and it can be ascertained whether they consume a comparable amount of energy to public transportation or private cars. The average energy consumption is calculated using Wh/trip for each mode of transport.
Customer Ridesharing Willingness
The individual user agent is instantiated with a parameter value based on a uniform distribution of customer willingness to share a ride. If this is below the average, he/she will be assigned his/her own vehicle, and his/her car will not be assigned to any new customers during the trip.
If the number of passengers, that is, the number of people traveling with the main customer inclusively, is equal to the vehicle capacity, they cannot share rides with others. To introduce heterogeneity, a Poisson distribution with an average number of 1.4 passengers is applied, that is, the users will often travel alone. The maximum number of passengers including the main customer is set at the highest capacity of the vehicle.
Environment
The environment of the proposed model is based on the real road network using geographical information system (GIS) data for the areas being studied. The road network is divided into nodes and links, or edges, and the links do not need to be straight lines. All the nodes need to be connected for agents to be able to move from one node to another via the links, which will determine the route. This means the users’ pickup and drop-off points need to be at a node in the network.
The charging infrastructure is also included in the environment. Because of the environment’s network setup, the charging stations are also located at the nodes. Each charging station has two characteristics: available spaces; and charging speed.
The public transportation network and walkways can be included in the environment to analyze mode choice or compare modes. However, these will need to be integrated into the road network and share some of the nodes.
Each node has no restrictions on how many users or vehicles can be there, unless specified by availability at the charging stations. On the other hand, the links have a limitation on the number of vehicles based on their length and the number of lanes.
An advantage of good GIS data is that they provide the road type, number of lanes, and the speed limit. With this information and historical road traffic data, background traffic can be estimated for the time of the simulation. The historical data are often provided in the form of traffic counts on a specific date for a particular road and geographical location (in latitude and longitude). Traffic count is conventionally collected with induction loops, or more recently using above-ground detection sensors. Using a fundamental diagram of traffic flow based on the expected traffic density with a given link length and number of lanes for a headway of 2 s, the count can be converted to a traffic speed. This speed can then be added as an attribute to the relevant link to mimic the background traffic. The underlying traffic can be varied based on the granularity of available historical traffic data.
Agent-Based Modeling Framework
The proposed framework builds on previous research on optimizing the distribution of charging stations ( 59 ), developing double-auction mechanisms for customer–vehicle assignment ( 67 ), and on modeling vehicle redistribution strategies ( 55 ). It also takes into account the baseline framework described by Karamanis et al. ( 49 ). The proposed framework and model has been developed internally at Imperial College London into a simulation model under the name of Delos.
The framework is shown in Figure 3.
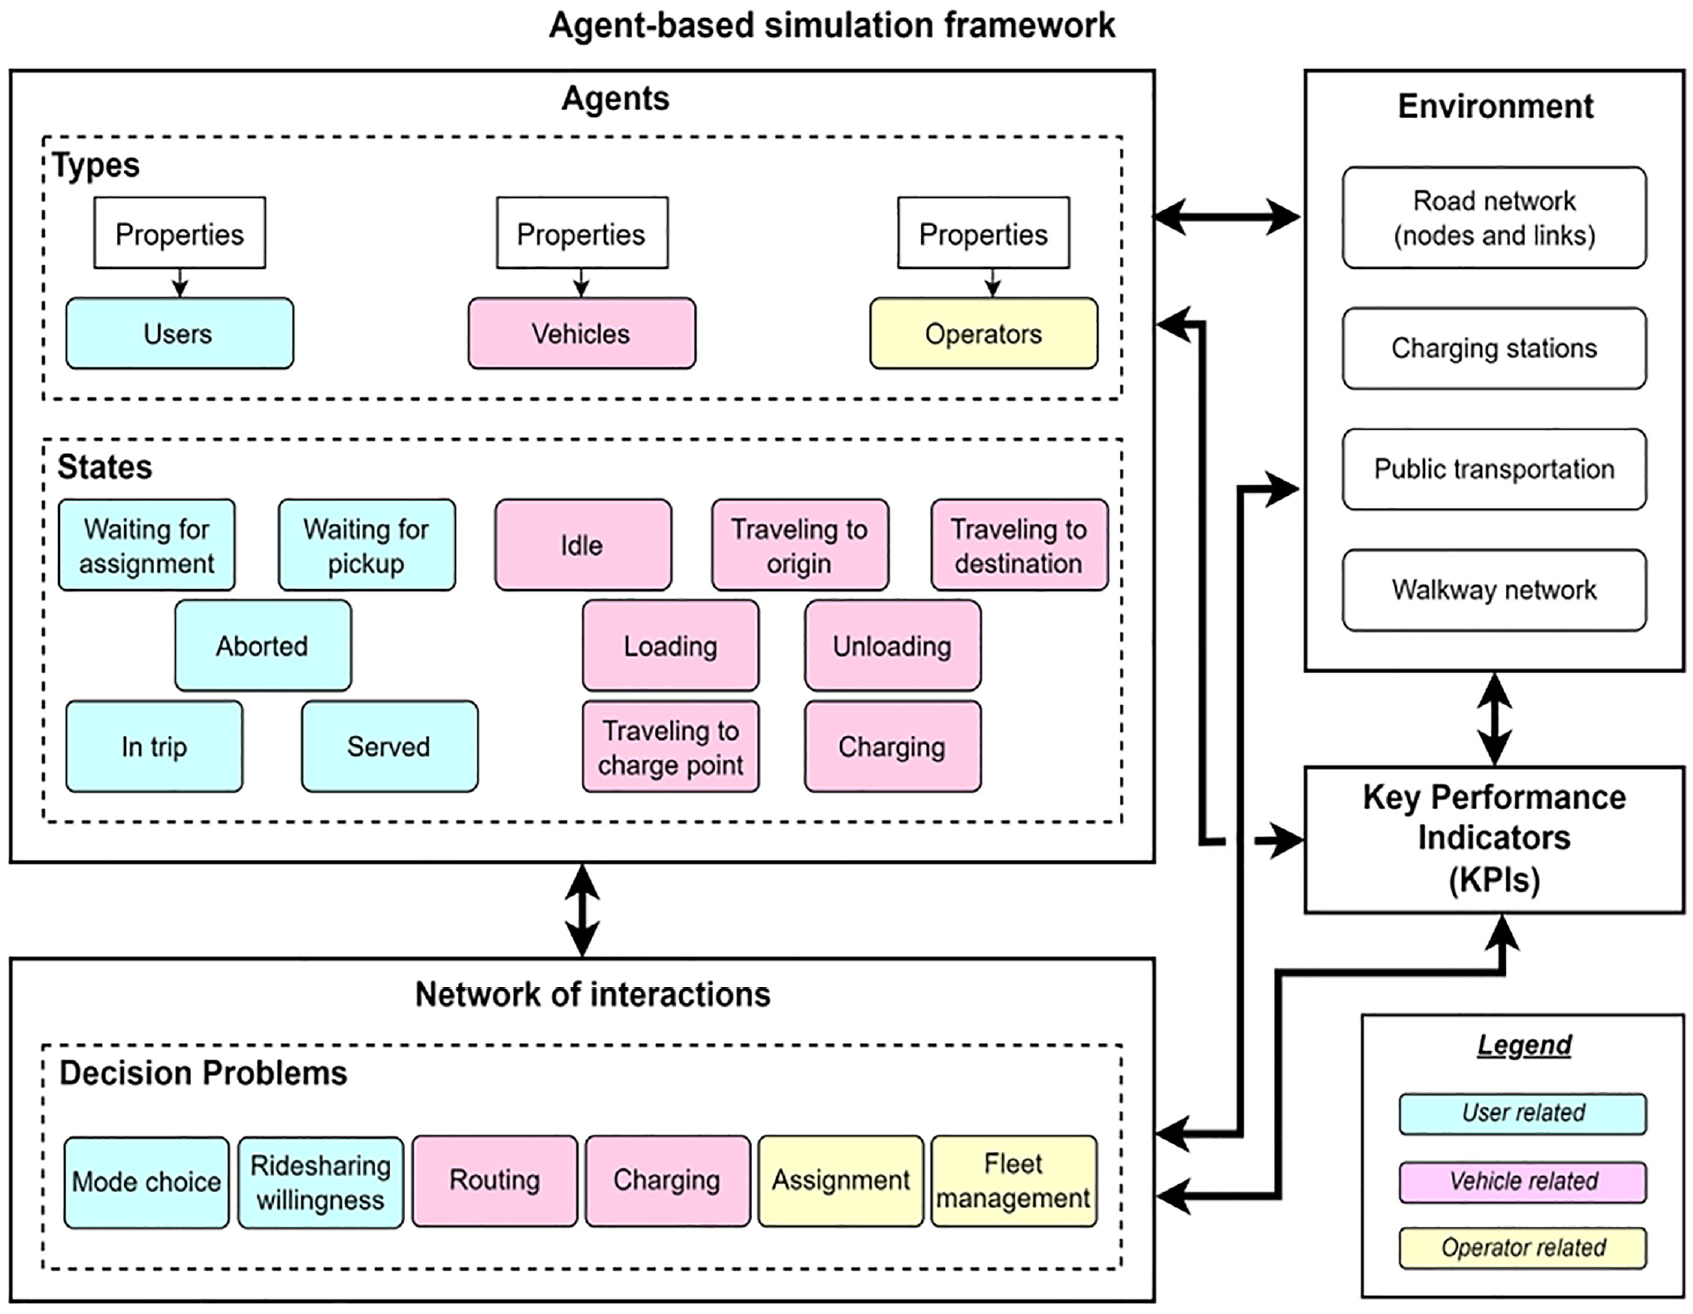
Framework of the agent-based model.
Using the framework with necessary inputs, the KPIs can be measured and analyzed, as can the utilization of the infrastructure. Figure 4, which is adapted from the simulation diagram in Jäger et al. ( 5 ), shows the input and output relationship with the SAV-related agent-based simulation.
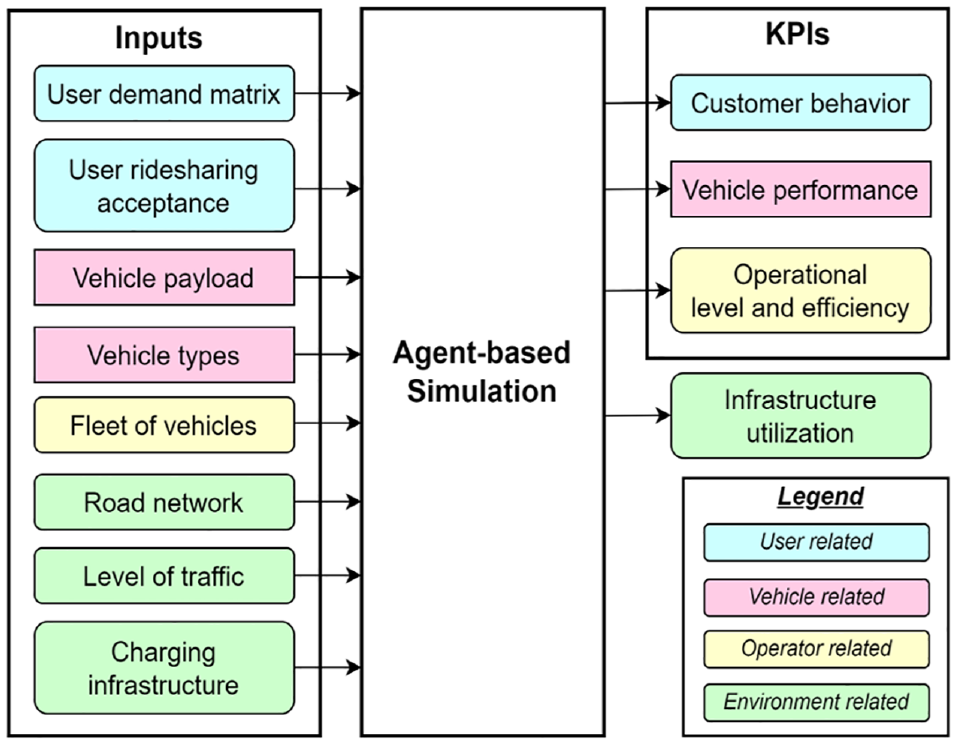
Simulation inputs and outputs.
Case Study
The framework described in the Methods section is applied to a case study of London, which involves considering three different regions of the city: central, inner, and outer. These have been selected according to varying area sizes, population densities, customer base, and traffic dynamics. To provide context, the central region is ≈ 10
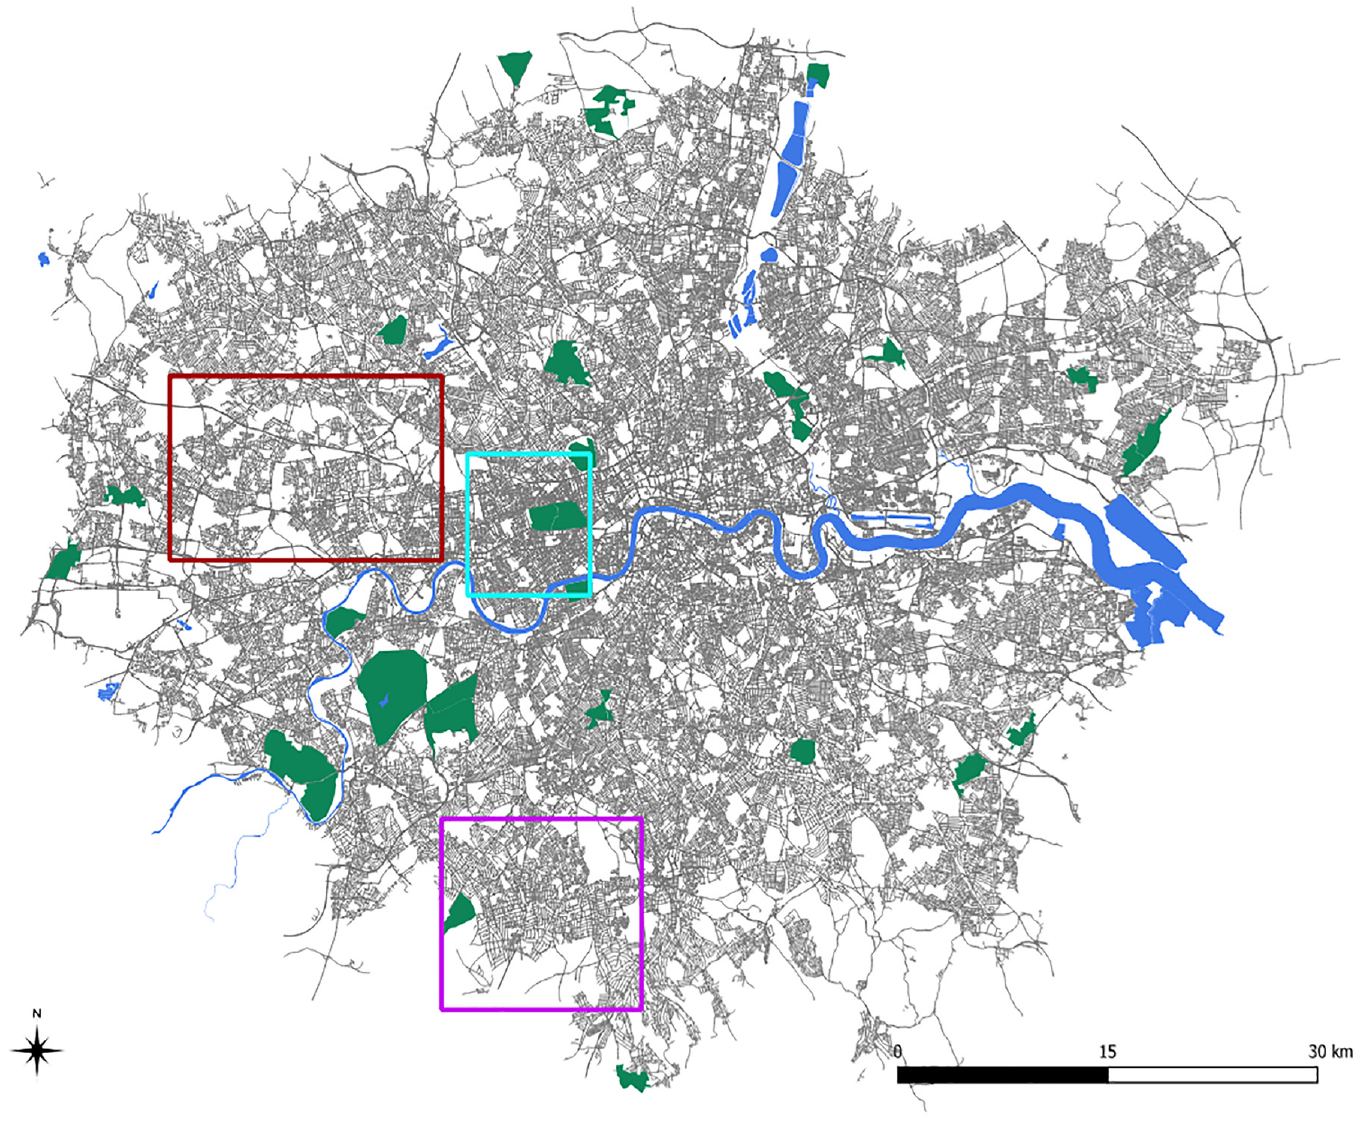
Study regions within London.
Input Data
The inputs were the following:
forecast of demand origin–destination (OD) matrix;
GIS data for roads in London;
GIS data for a zonal system in London; and
vehicle speed on each road segment based on the existing traffic conditions at different times of the day.
In the case study, the demand is distributed based on a forecast of an OD matrix of all travelers and an estimated percentage of travelers using SAVs. The OD matrix is crucial for modeling different environments, because it is the sole representation of the trip types and lengths for this particular geographical location at the time of day the study was carried out. At the normal demand level, this translated to almost 4,000 users per hour in the central region, 1,500 users per hour in the inner region, and 600 users per hour in the outer region. The forecast is based on people traveling from an origin and destination zone rather than exact coordinates of a point. The zones used for the study are based on the London zonal system of Middle Layer Super Output Areas (MSOA) ( 71 ). Each MSOA has a similar population level of a minimum of 5,000 and an average of 7,000 ( 72 ). There are approximately 25 zones in the central and outer regions and 40 zones in the inner region.
The zonal system is also needed to randomize the demand origins and destinations. When generating higher demand levels, the OD matrix was multiplied. To evaluate the dynamics based on higher demand levels, the normal demand level was multiplied by two, and for very high demand levels, the normal demand level was multiplied by three. After the multiplication, the origin and destination points were varied within the start and end zones.
The studied time is a.m. peak hours between 7 and 9 a.m. on a typical weekday. Therefore, the predicted vehicle speed on each link was individually derived from a.m. peak hour traffic count, road type and its associated speed limit, and number of lanes on the road. The historical database of the a.m. peak hour traffic count in London from 1993 to 2021 is publicly available on the Department for Transport website ( 73 ). The road type and number of lanes can be derived from GIS data retrieved from Geofabrik GmbH and OpenStreetMap contributors ( 70 ). The simulation runs for four hours: one hour of warm-up, between 7 and 9 a.m., and one hour of cool-down. The two separate hours surrounding the study time are recommended to simulate a realistic setup, because otherwise, all the vehicles will be available at t=0 and will not provide a service close to the end of the study period. During the four hours, the same average vehicle speed on each link is assumed, because both hours represent an a.m. peak period. For the scale of operation studied and the fleet size, the impact of the ride sharing fleet on the traffic is considered negligible. By end of 2019, a total of 2,661,000 cars and 3,061,000 motor vehicles were registered in London ( 74 ), and the maximum fleet size studied is less than 0.01% of the total number of vehicles registered here.
Parameters
The parameters considered for the research are the following. The numbers in parentheses indicate the number of values within the parameters:
Location (3): central, inner, or outer region of London;
Demand level (3): normal, high (normal × 2), or very high (normal × 3);
Fleet size (21): range between 50 and 250 in increments of 10;
Vehicle capacity (2): 4 or 6;
Ridesharing acceptance (11): range between 0% and 100% in increments of 10%;
Charging locations (2): 20 stations randomly located in the study area or using the charging stations as located in OpenChargeMap ( 75 ); and
Vehicle propulsion (2): electric or diesel.
The model has capabilities of different random seeds for Monte Carlo simulations, but for this study it was kept constant for result comparison of parametric runs to ensure the minimum demand level and that the initial distribution of an AV minimum fleet size remained constant.
Results
Following the list of parameters, results from
To provide a benchmark, a ridesharing acceptance level of 20% and a fleet size of 100 have been highlighted in orange in the graphs showing the results.
Impact of Ridesharing Acceptance Level
Customers per Trip
From the operators’ perspective, the number of users per vehicle trip is of interest to understand the efficiency of the system. The results show that once a minimum operating fleet size is reached, there is no clear relationship between customer sharing ratio and the size of the fleet. However, the ridesharing acceptance level has an influence on the number of customers per trip, making operations more efficient, as shown in Figure 6 for the central region of London.
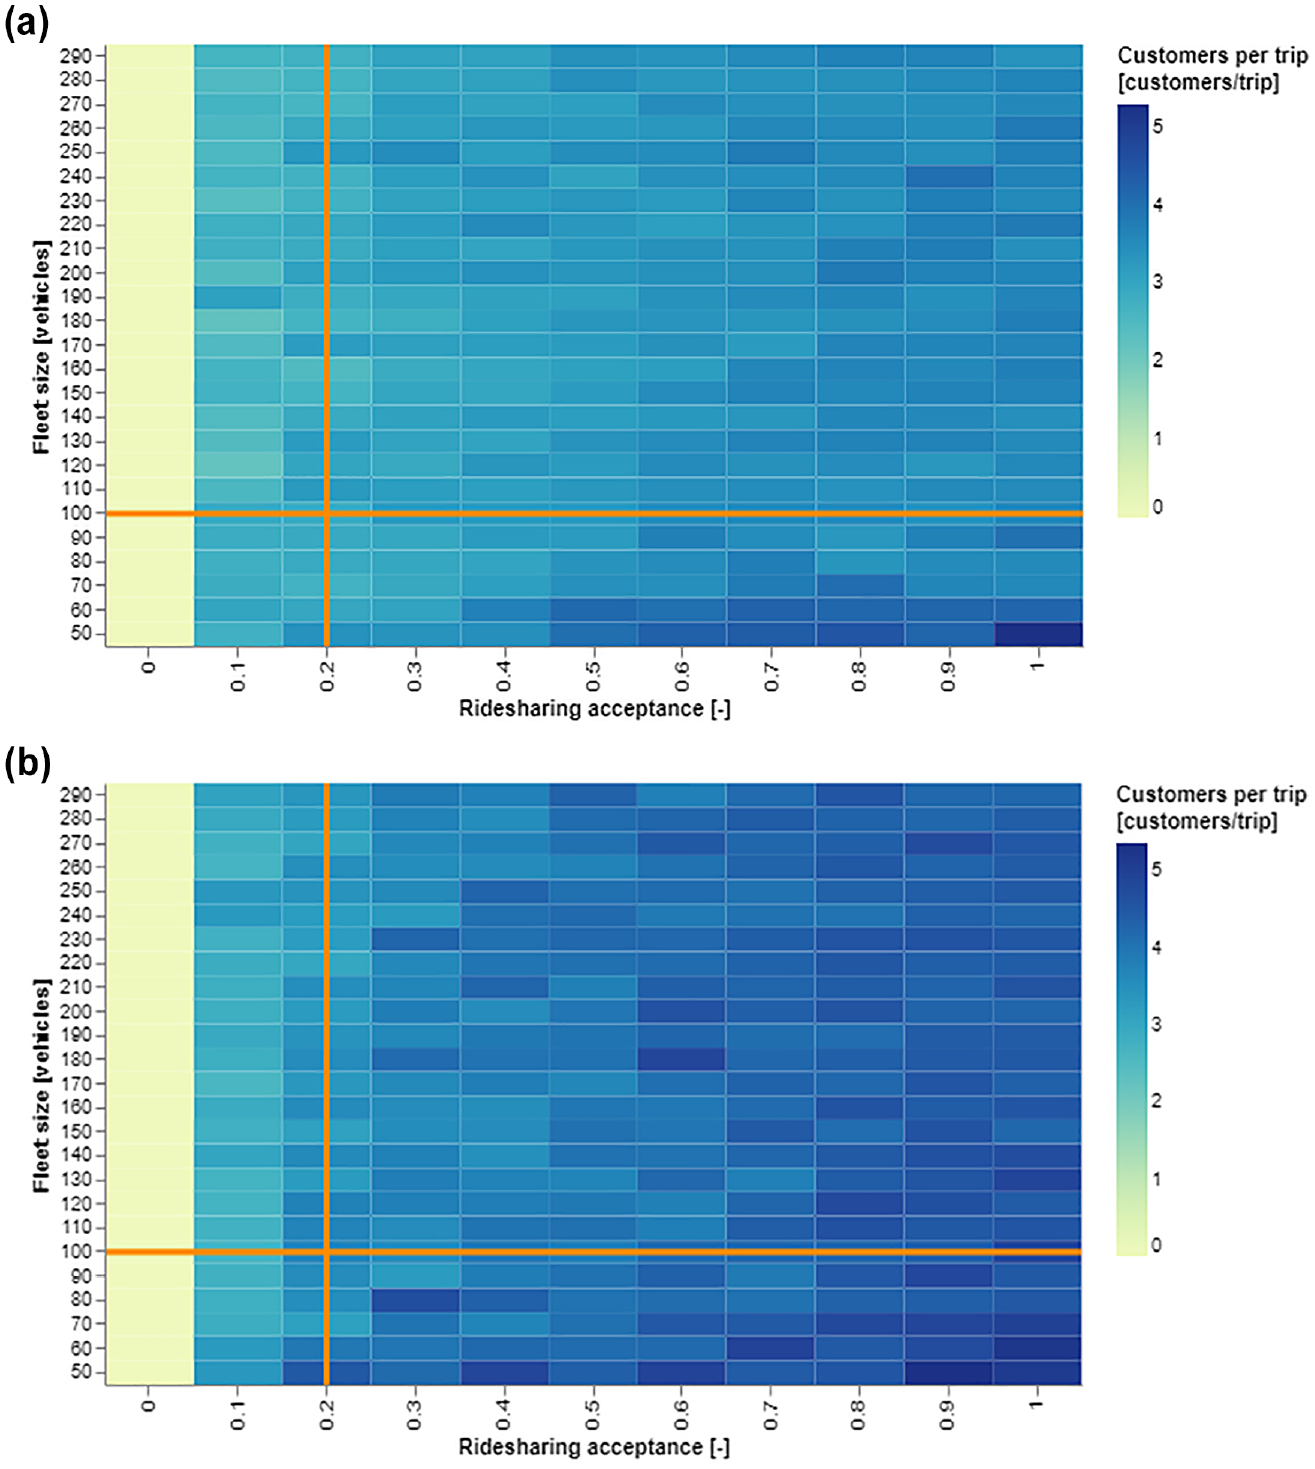
Customers per trip (a) Vehicle capacity = 4 seats and (b) Vehicle capacity = 6 seats.
Rides Shared per Customer
From the customer’s perspective, it may be of interest to understand how many other customers they will be sharing their ride with. For the central region of London, the results show that for normal demand, customers would, on average, share their ride with no more than two other customers in a four-seat vehicle. Even in a larger car with six seats, the customers will only share with more than two other customers if everyone shares during normal a.m. peak hours. From the operator’s point of view, fleet size does not have a large impact on the number of rides a customer needs to share. The results are shown in Figure 7.
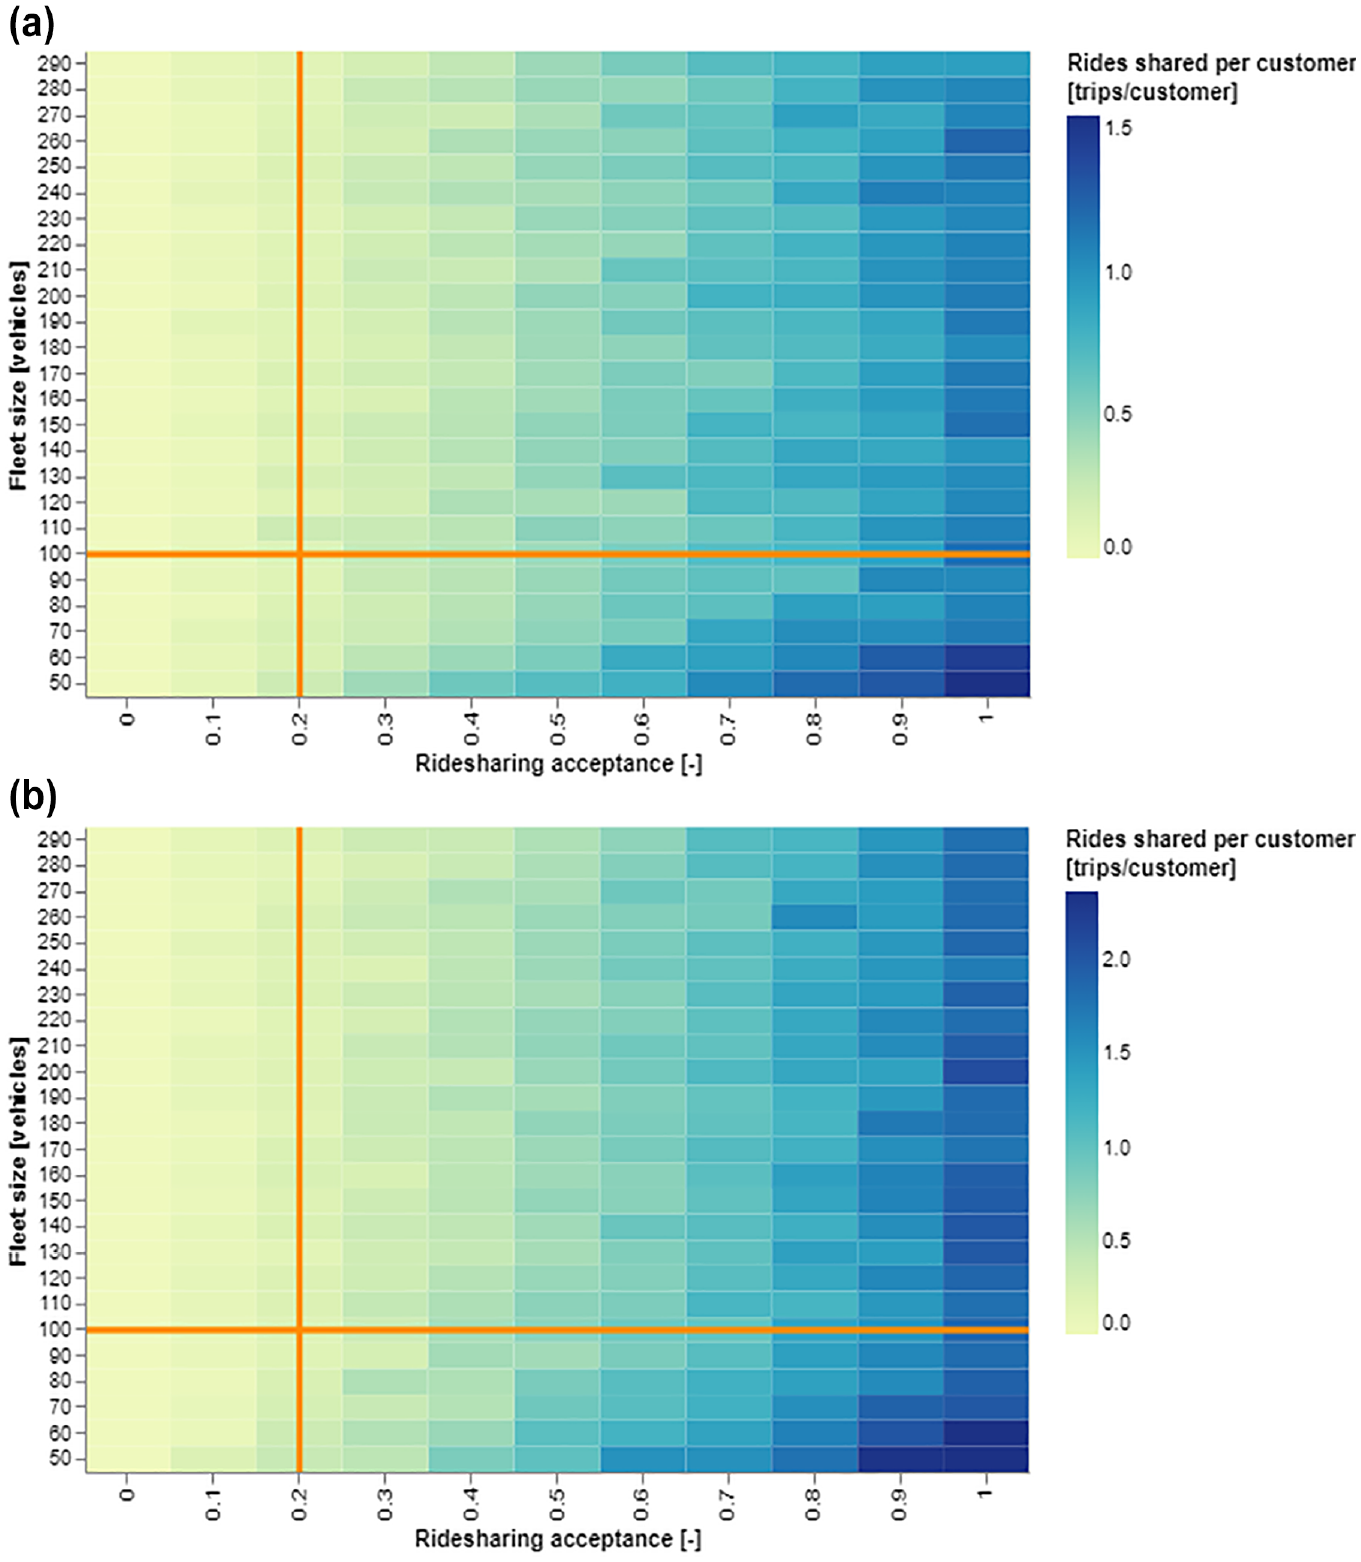
Rides shared per customer (a) Vehicle capacity = 4 seats and (b) Vehicle capacity = 6 seats.
Detour Time
We define detour time as the additional time experienced by a user to pick up and drop off additional customers who share the vehicle. Detours will happen more often with a higher payload because more rides are shared and, therefore, the average detour time will be longer. The detour times for the central region of London are shown in Figure 8. In the model, the maximum detour time allowed is set at 15 min for both vehicle capacity sizes. Although the detour time may seem long compared with not sharing any rides, once shared, the ridesharing acceptance level has minimal impact on the detour. The fleet size influences detours only when there are not enough vehicles to serve everyone.
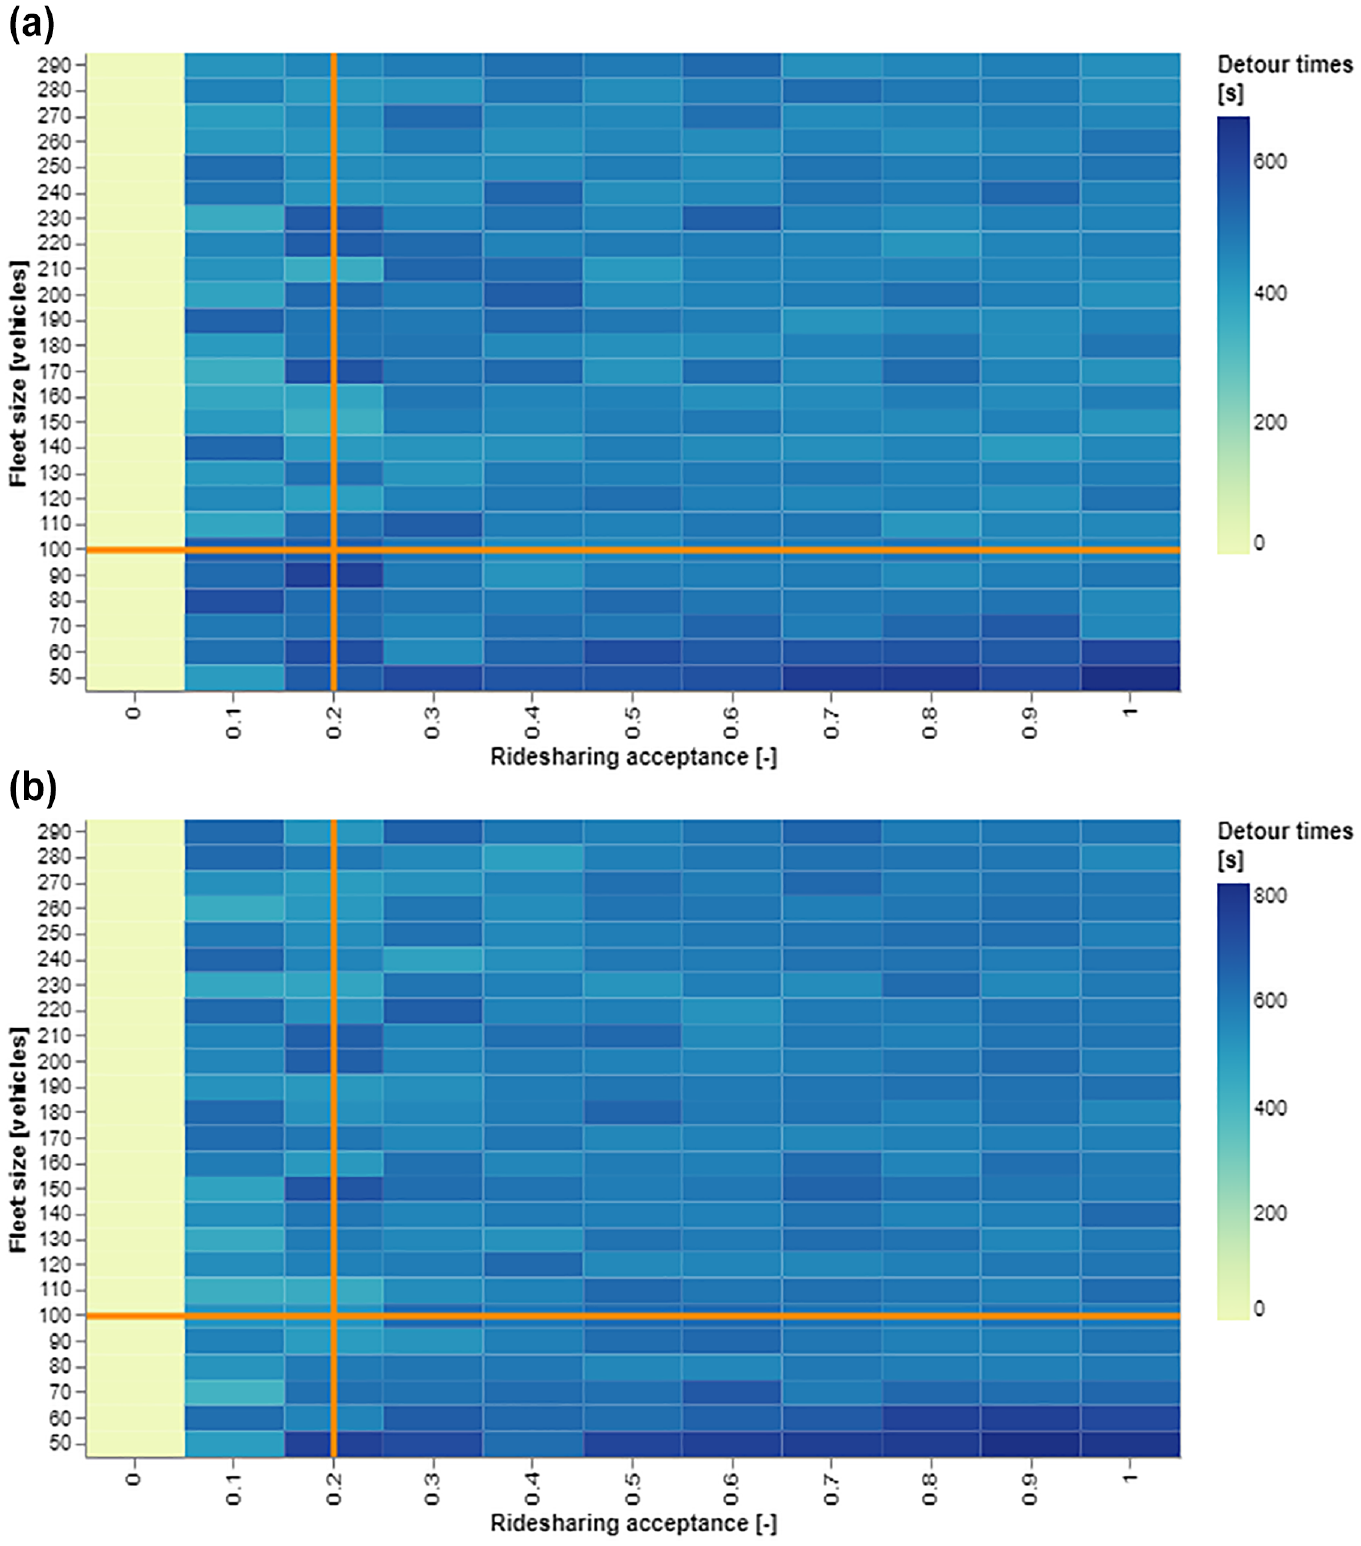
Detour time (a) Vehicle capacity = 4 seats and (b) Vehicle capacity = 6 seats.
Impact of Demand Levels
Vehicle Idle Time
Operators have to be prepared for varying levels of demand and need to ascertain whether their fleets can cope with this. In the inner region of London, based on an average ridesharing acceptance of 20%, the results show that the average idle time diminishes with increased demand levels, although the fleet size can significantly increase the idle time. When the fleet is sized at a highly optimized level with minimal idle time, as the results in Figure 9 show, the SAV system will not be able to withstand a surge of demand.
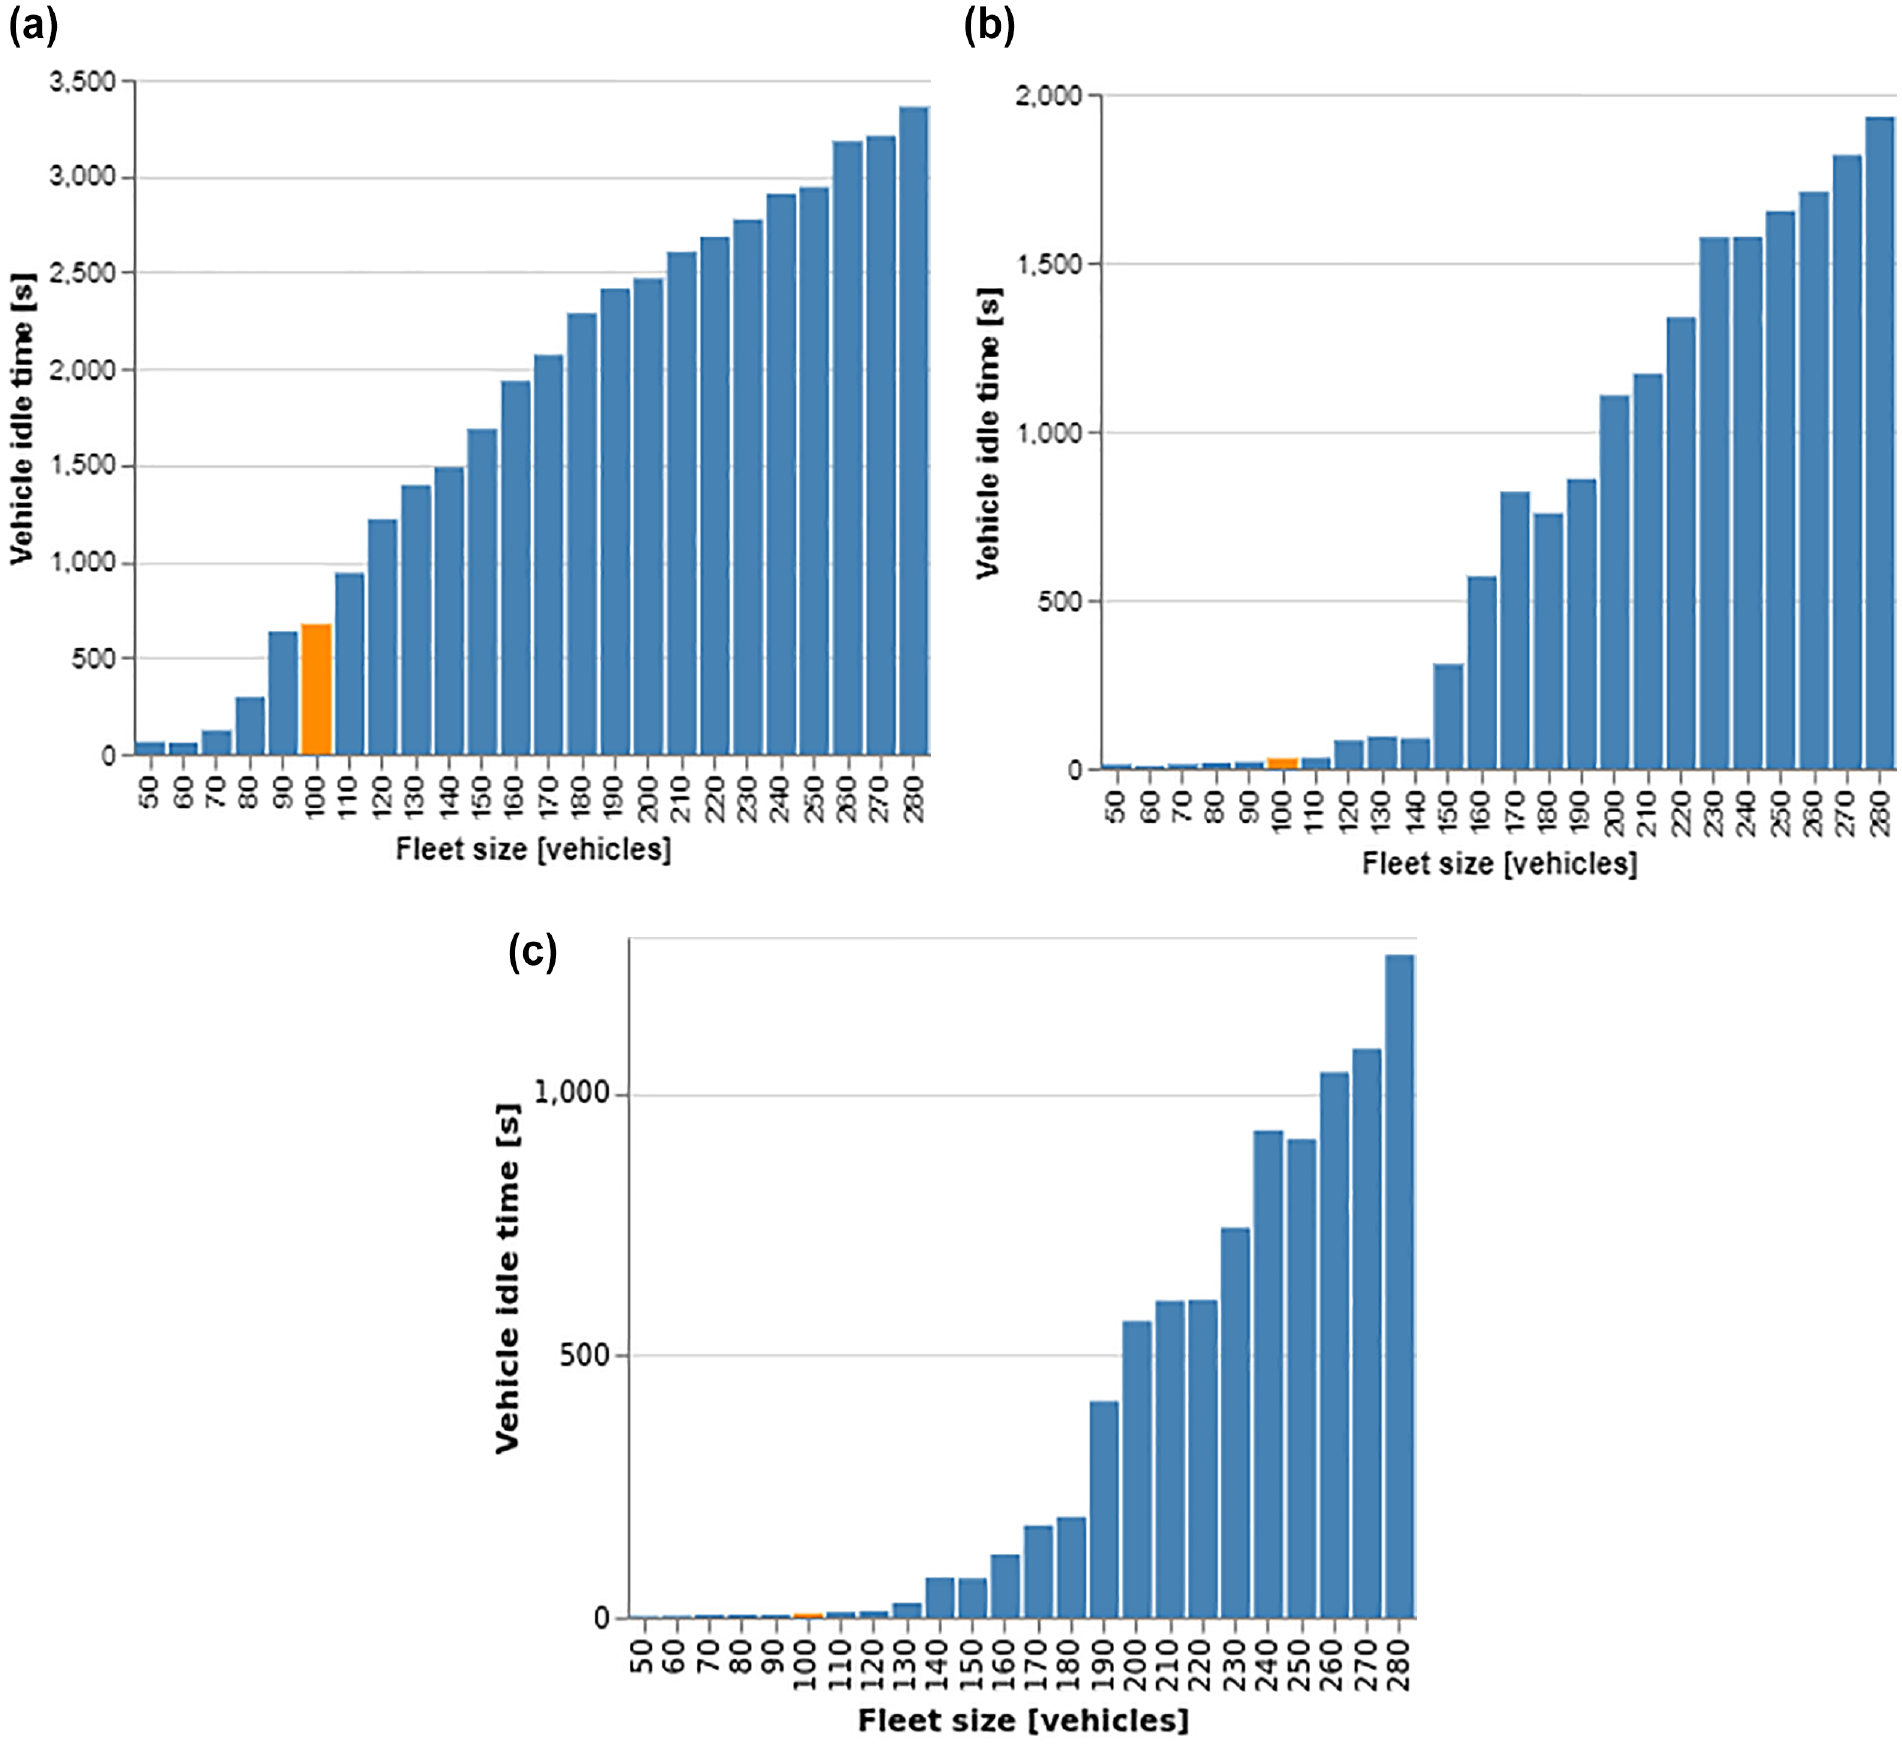
Vehicle idle time (a) Demand = normal a.m. peak hour level, (b) Demand = high a.m. peak hour level, and (c) Demand = very high a.m. peak hour level.
Vehicle Distance Traveled
Other than idle time, the operators also need to know how much a vehicle is being utilized with regard to distance traveled. In the inner region of London, based on an average ridesharing acceptance of 20% at high and very high demand levels, the average travel distance of a vehicle remains similar unless there is an abundance of vehicles, as shown in Figure 10. If the operators wanted to size the fleet with contingency for higher demand, in addition to idle time, the distance traveled by each vehicle needs to be considered. Because the fleet management strategy implemented keeps an empty vehicle in idle mode until the next assignment, the result would vary with different vehicle redistribution strategies.
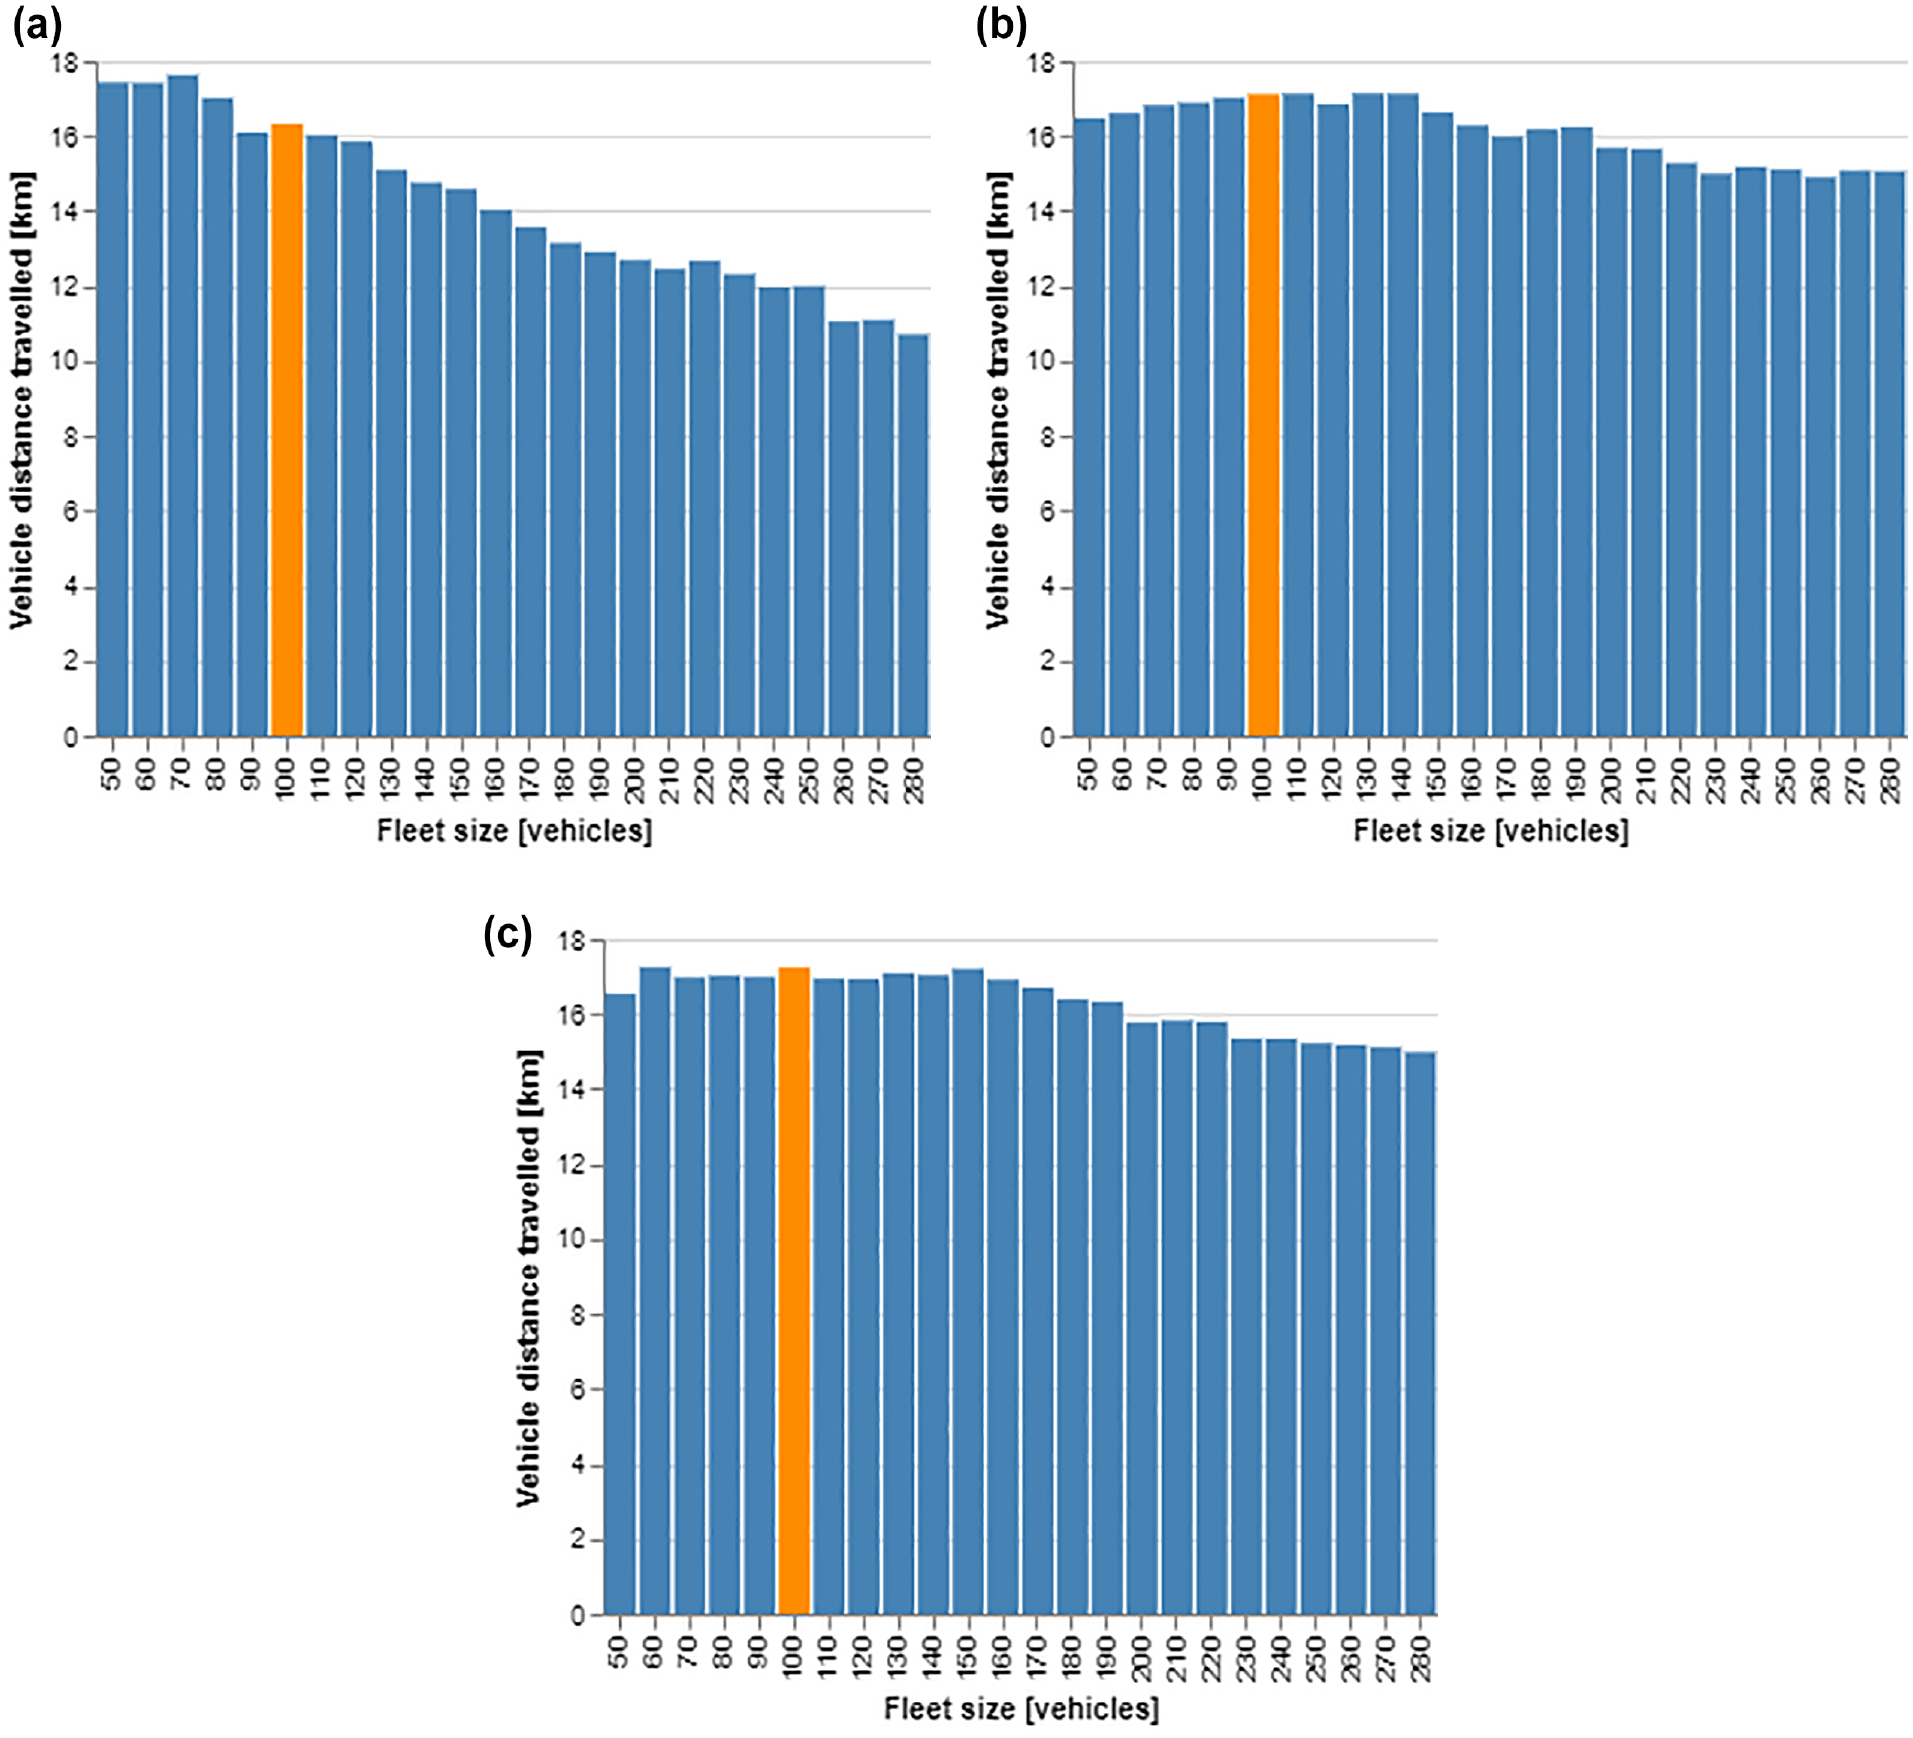
Vehicle distance traveled (a) Demand = normal a.m. peak hour level, (b) Demand = high a.m. peak hour level, and (c) Demand = very high a.m. peak hour level.
Impact of Location on Customer Experience
Trip Duration
To provide context for the impact of the study regions on the trip times, based on a fleet size of 100 four-seater vehicles, trip duration for varying ridesharing acceptance is shown in Figure 11. Despite the central region being smaller than the other two because of its higher density and, therefore, higher demand, the average trip time is similar to the average trip duration in the inner and outer regions. The results also show that although detours on shared journeys may give the users the impression that a journey is deviating from the shortest path, as shown above in the subsection Detour Time, the overall average trip times across all trips are actually similar because shorter trips may still remain unaffected by the willingness to share rides.
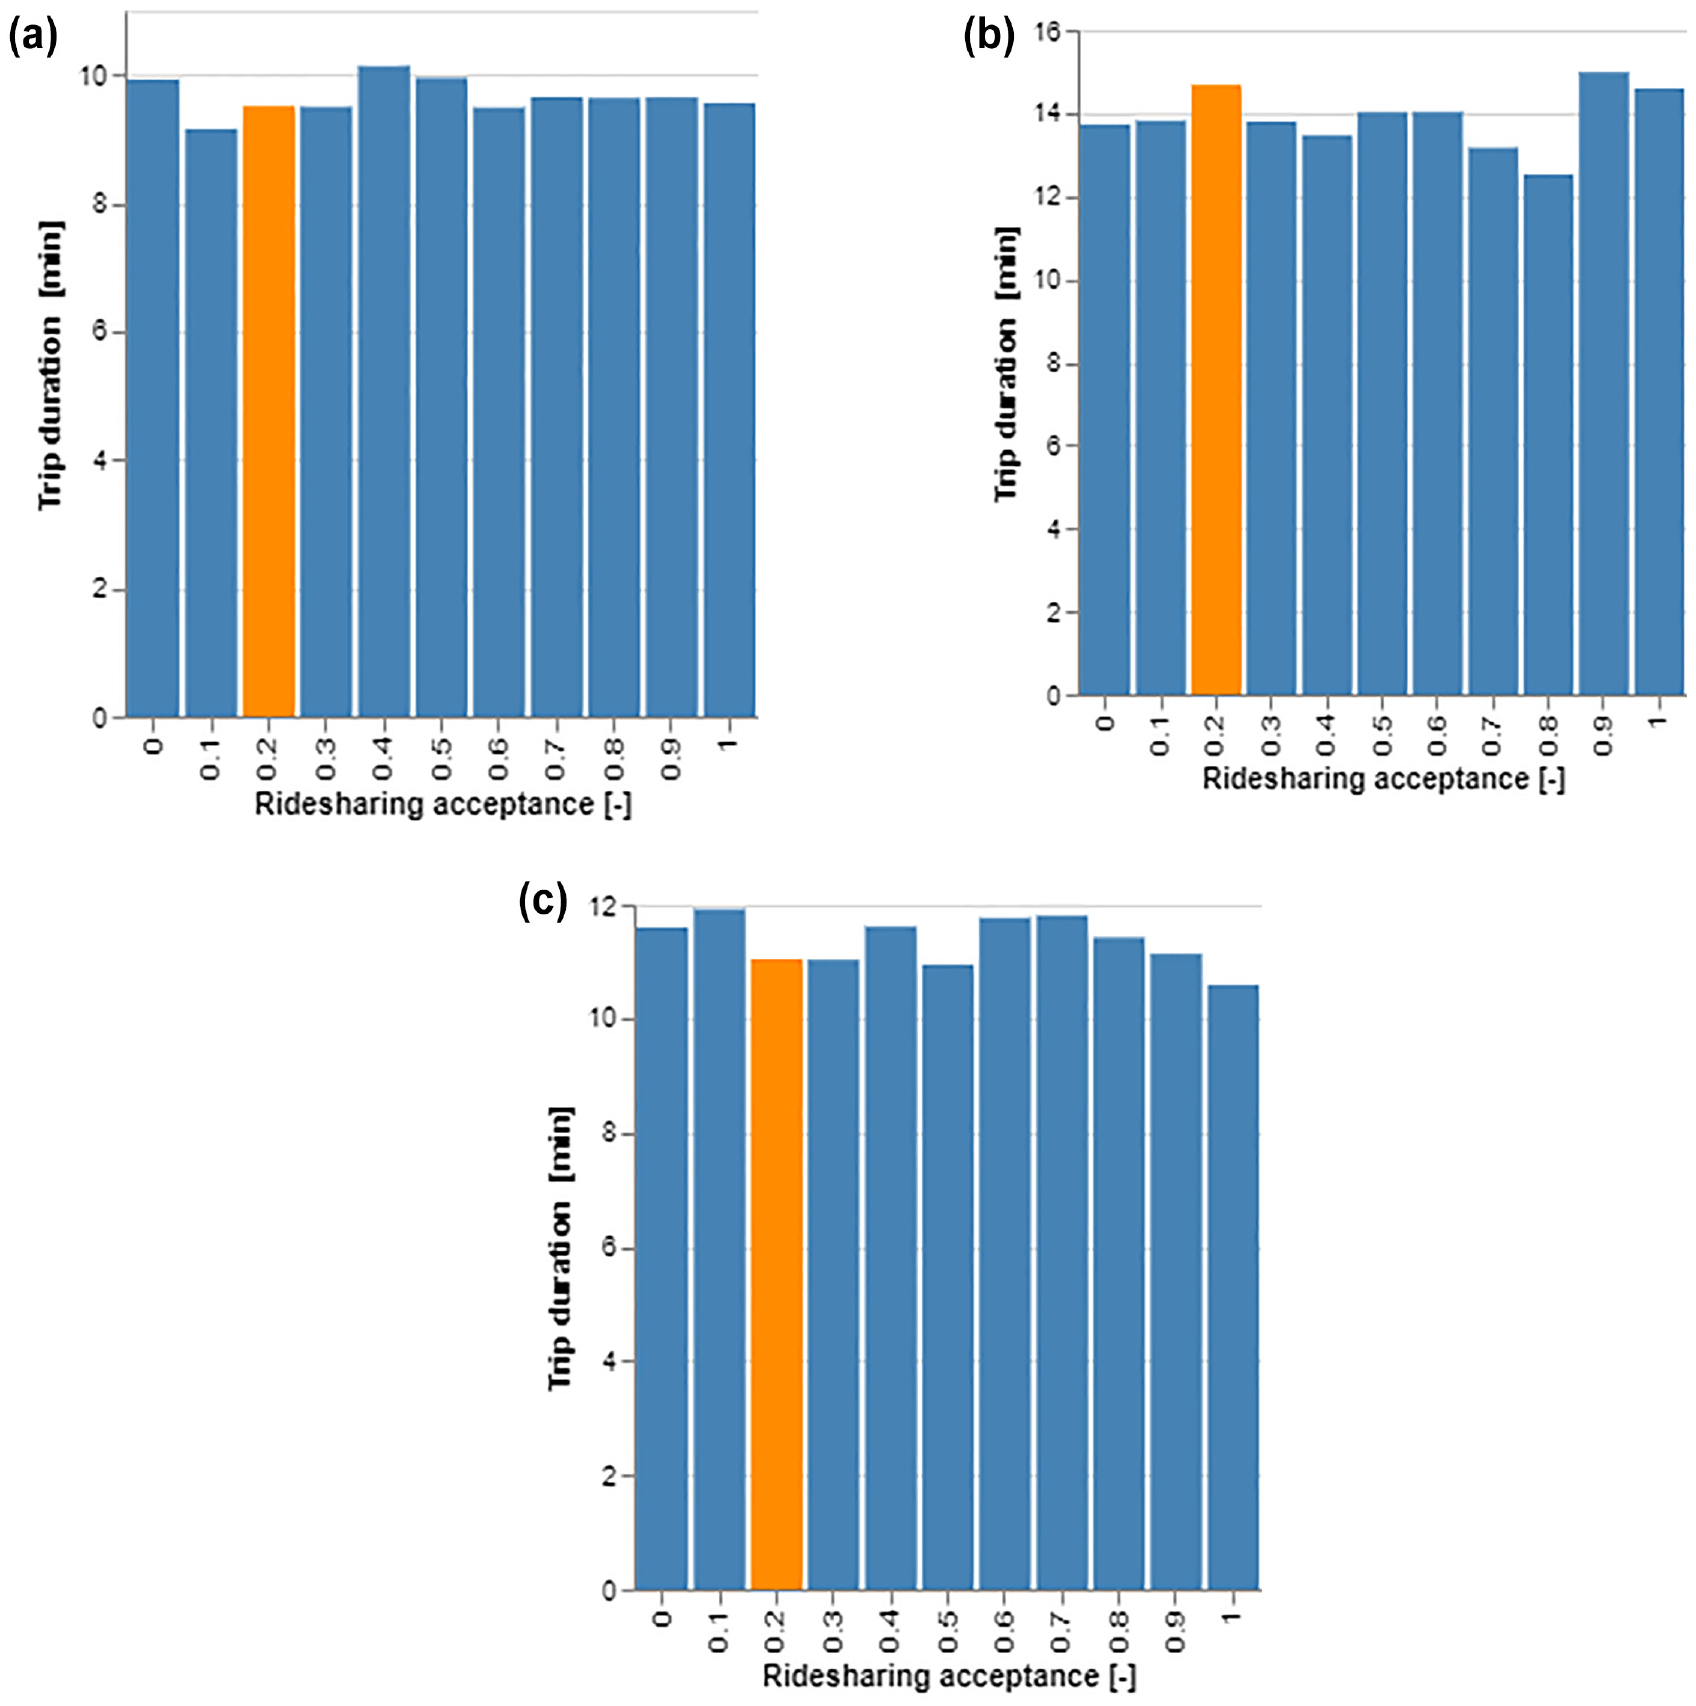
Trip duration in minutes (a) Location = central London, (b) Location = inner London, and (c) Location = outer London.
Queuing Time
In the central region, the ridesharing acceptance level does not have an impact on the queuing time, which is the time between a user requesting a trip and a vehicle being assigned to them, for a fleet of 100 four-seater vehicles at a normal demand level during a.m. peak hours. The queuing time for every ridesharing acceptance level was 1 s, which shows there was always a vehicle available. This is because the fleet size was sufficient to meet the demand. However, with increasing demand and a change in the ridesharing acceptance level, the queuing time can increase to over 1 min. The reason for a rise in queuing time with a higher ridesharing acceptance level with a fixed fleet size is that every vehicle is busy fulfilling multiple trips. In the case of very high demand, the waiting time on average is above 2 min in this particular scenario, because 100 vehicles are not enough to fulfil the high demand at any ridesharing acceptance level. This is shown in Figure 12.
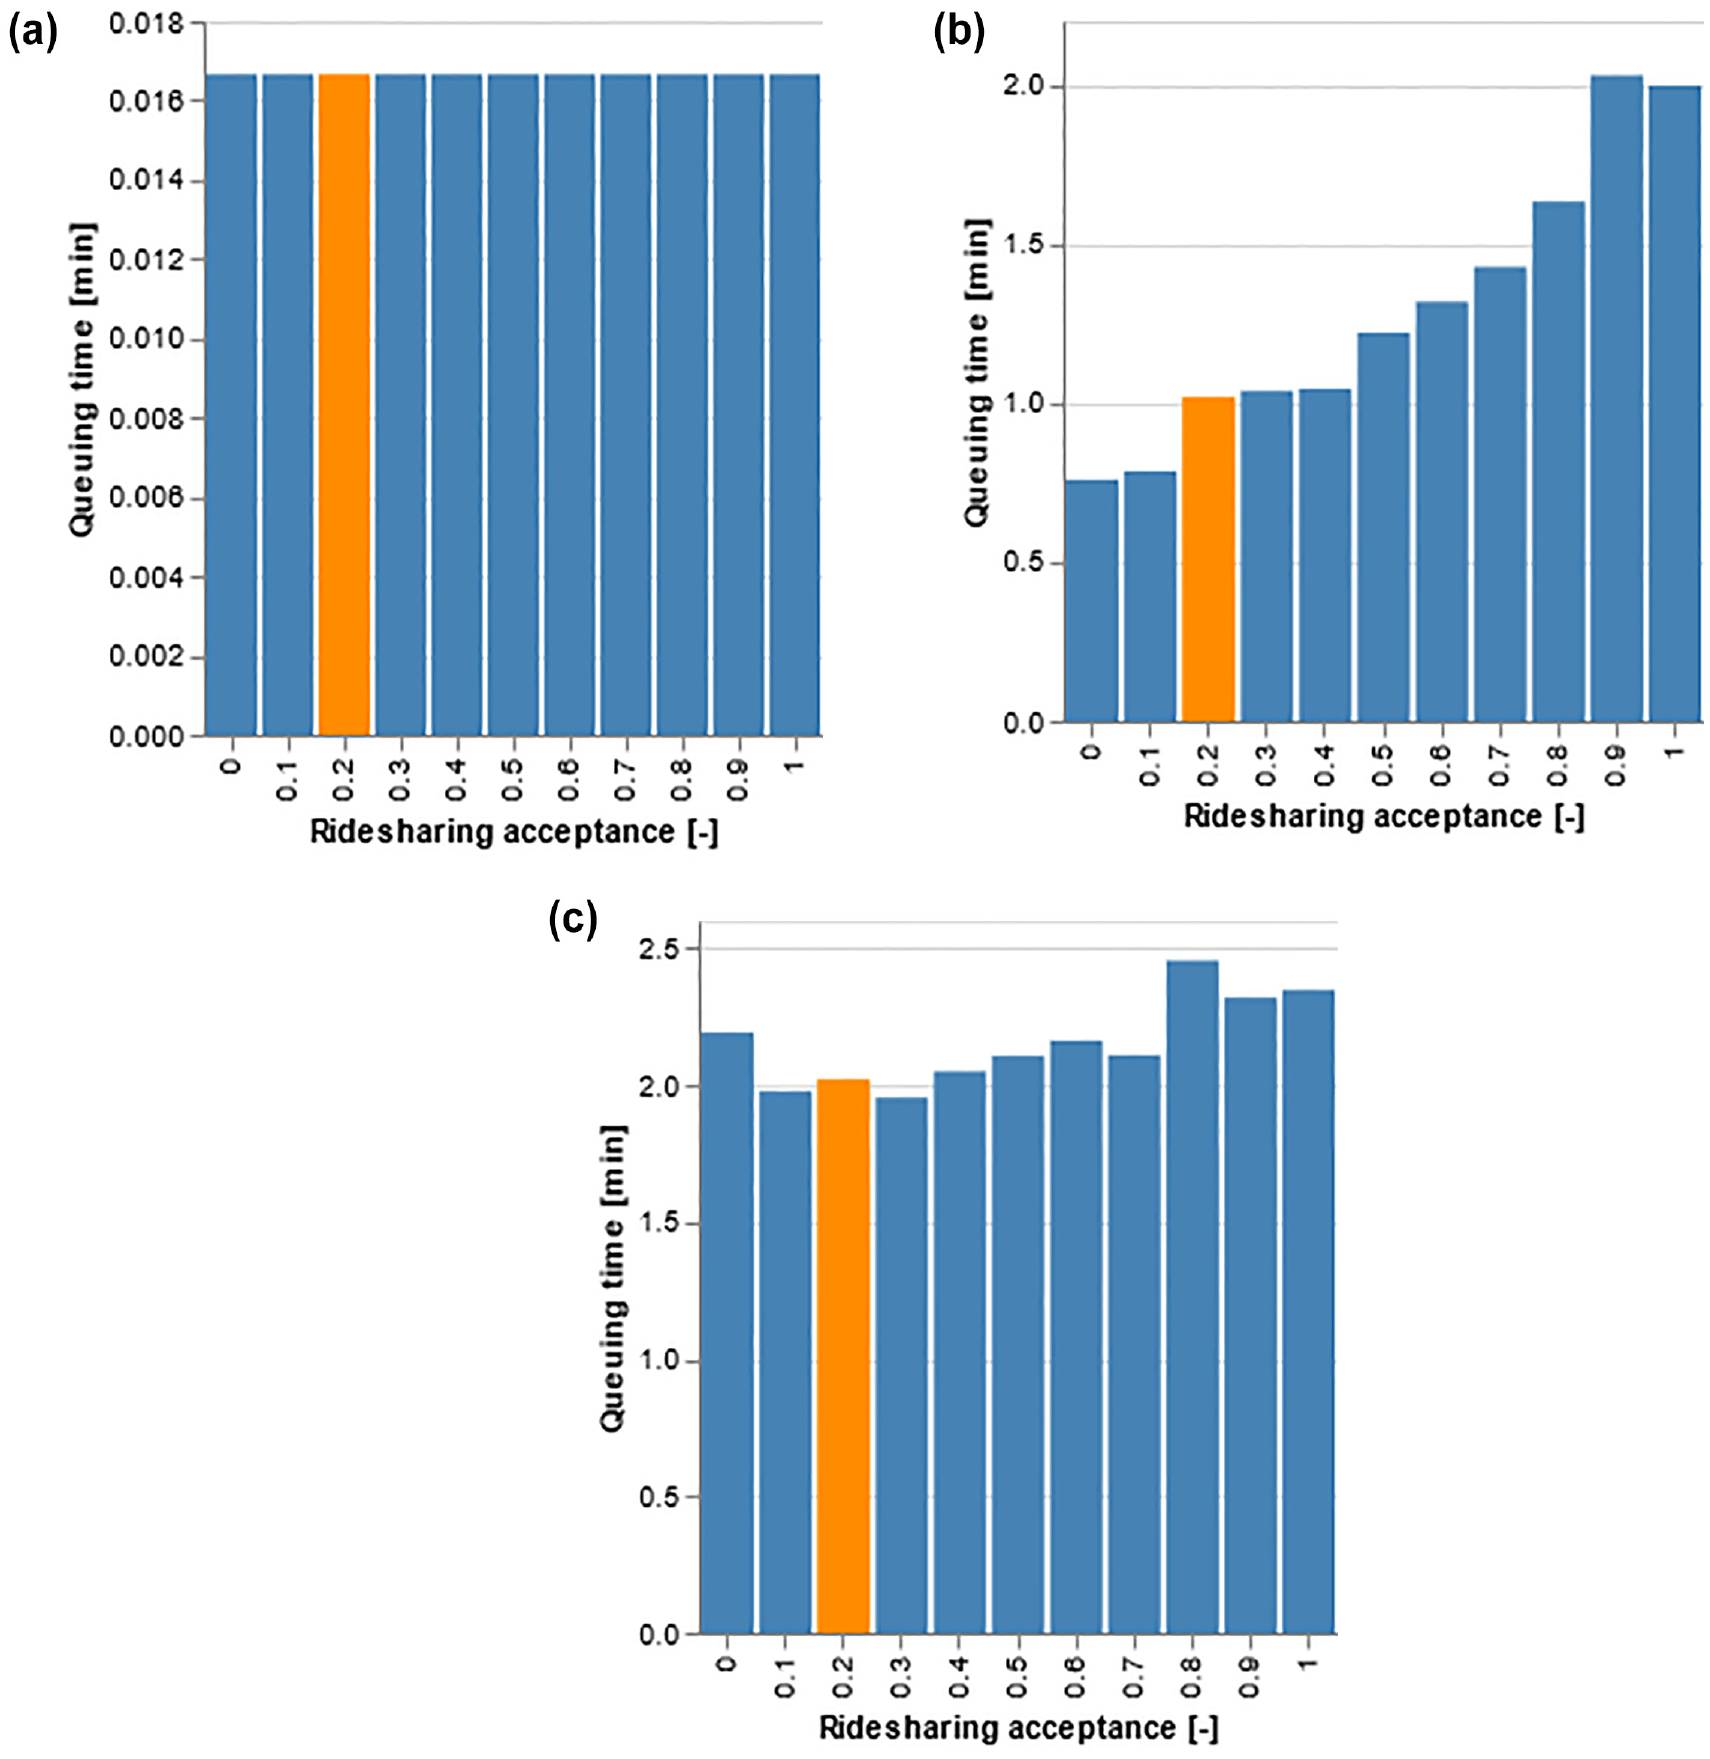
Queuing time in minutes (a) Location = central London, demand = normal a.m. peak hour level, (b) Location = central London, demand = high a.m. peak hour level, and (c) Location = central London, demand = very high a.m. peak hour level.
When observing the queuing time at a ridesharing acceptance level of 20%, the ideal fleet size for very short queuing time increases with higher demand levels, as shown in Figure 13.
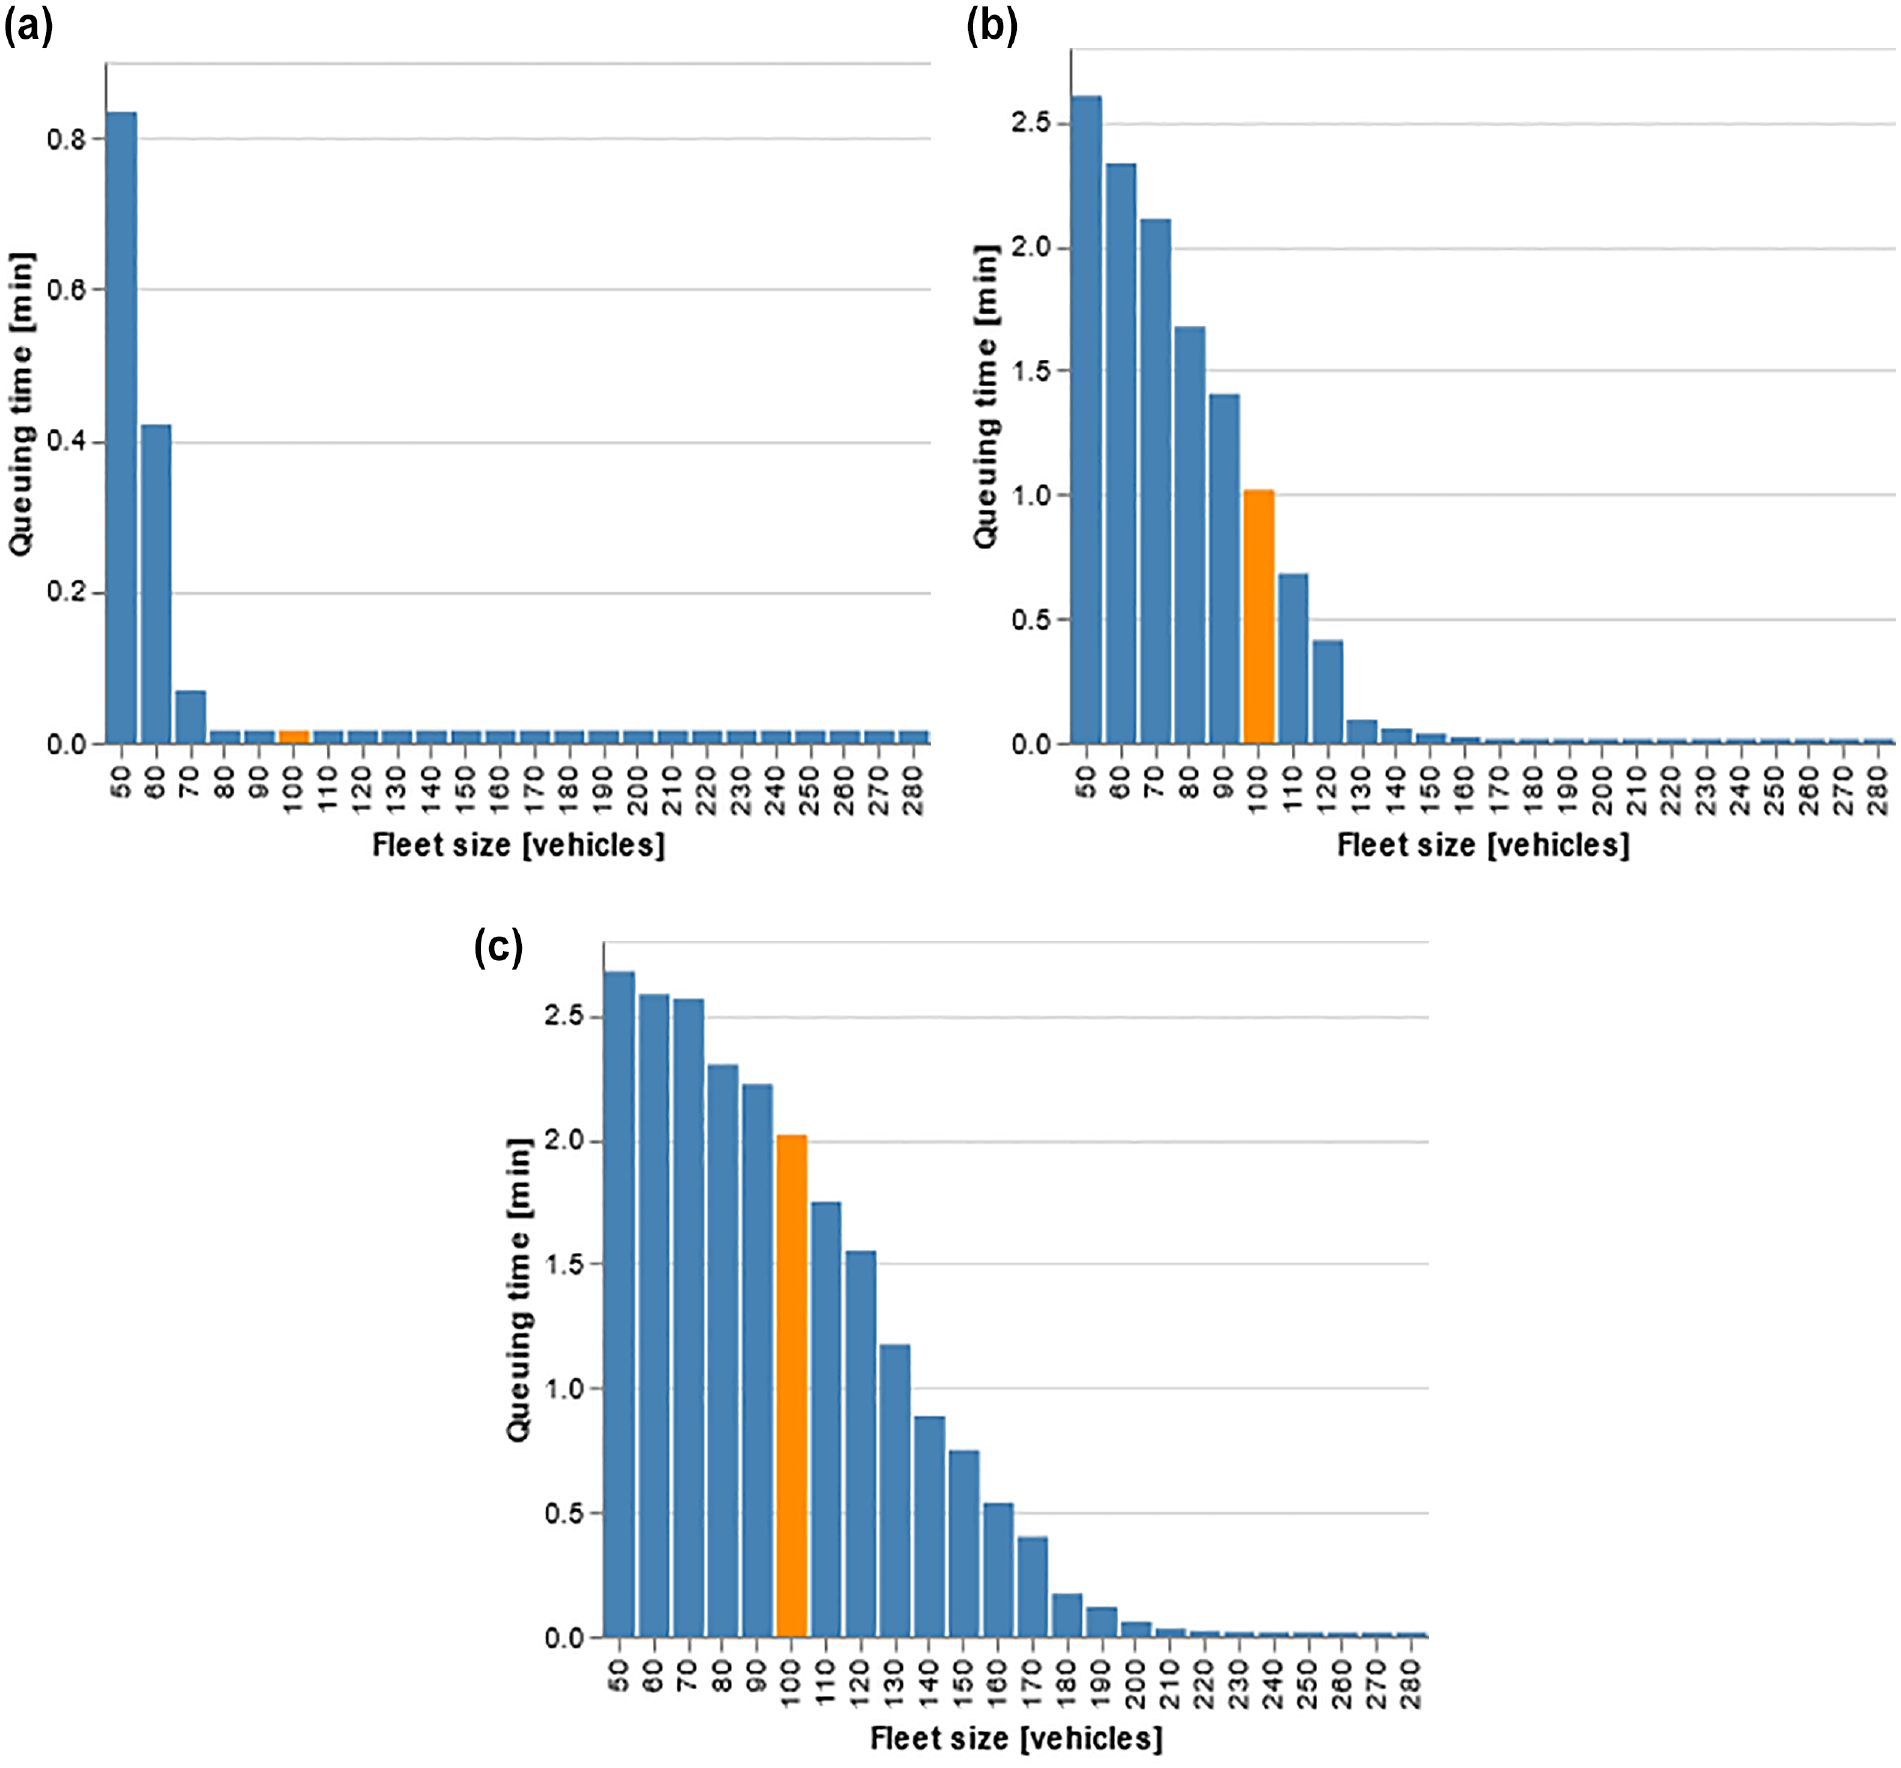
Queuing time in minutes (a) Location = central London, Demand = normal a.m. peak hour level,
Pickup Time
For a fixed fleet and capacity, pickup time can vary with ridesharing acceptance level and the location, as shown in Figure 14. This shows that the strategy for one region of London does not necessarily work in other areas of the city.
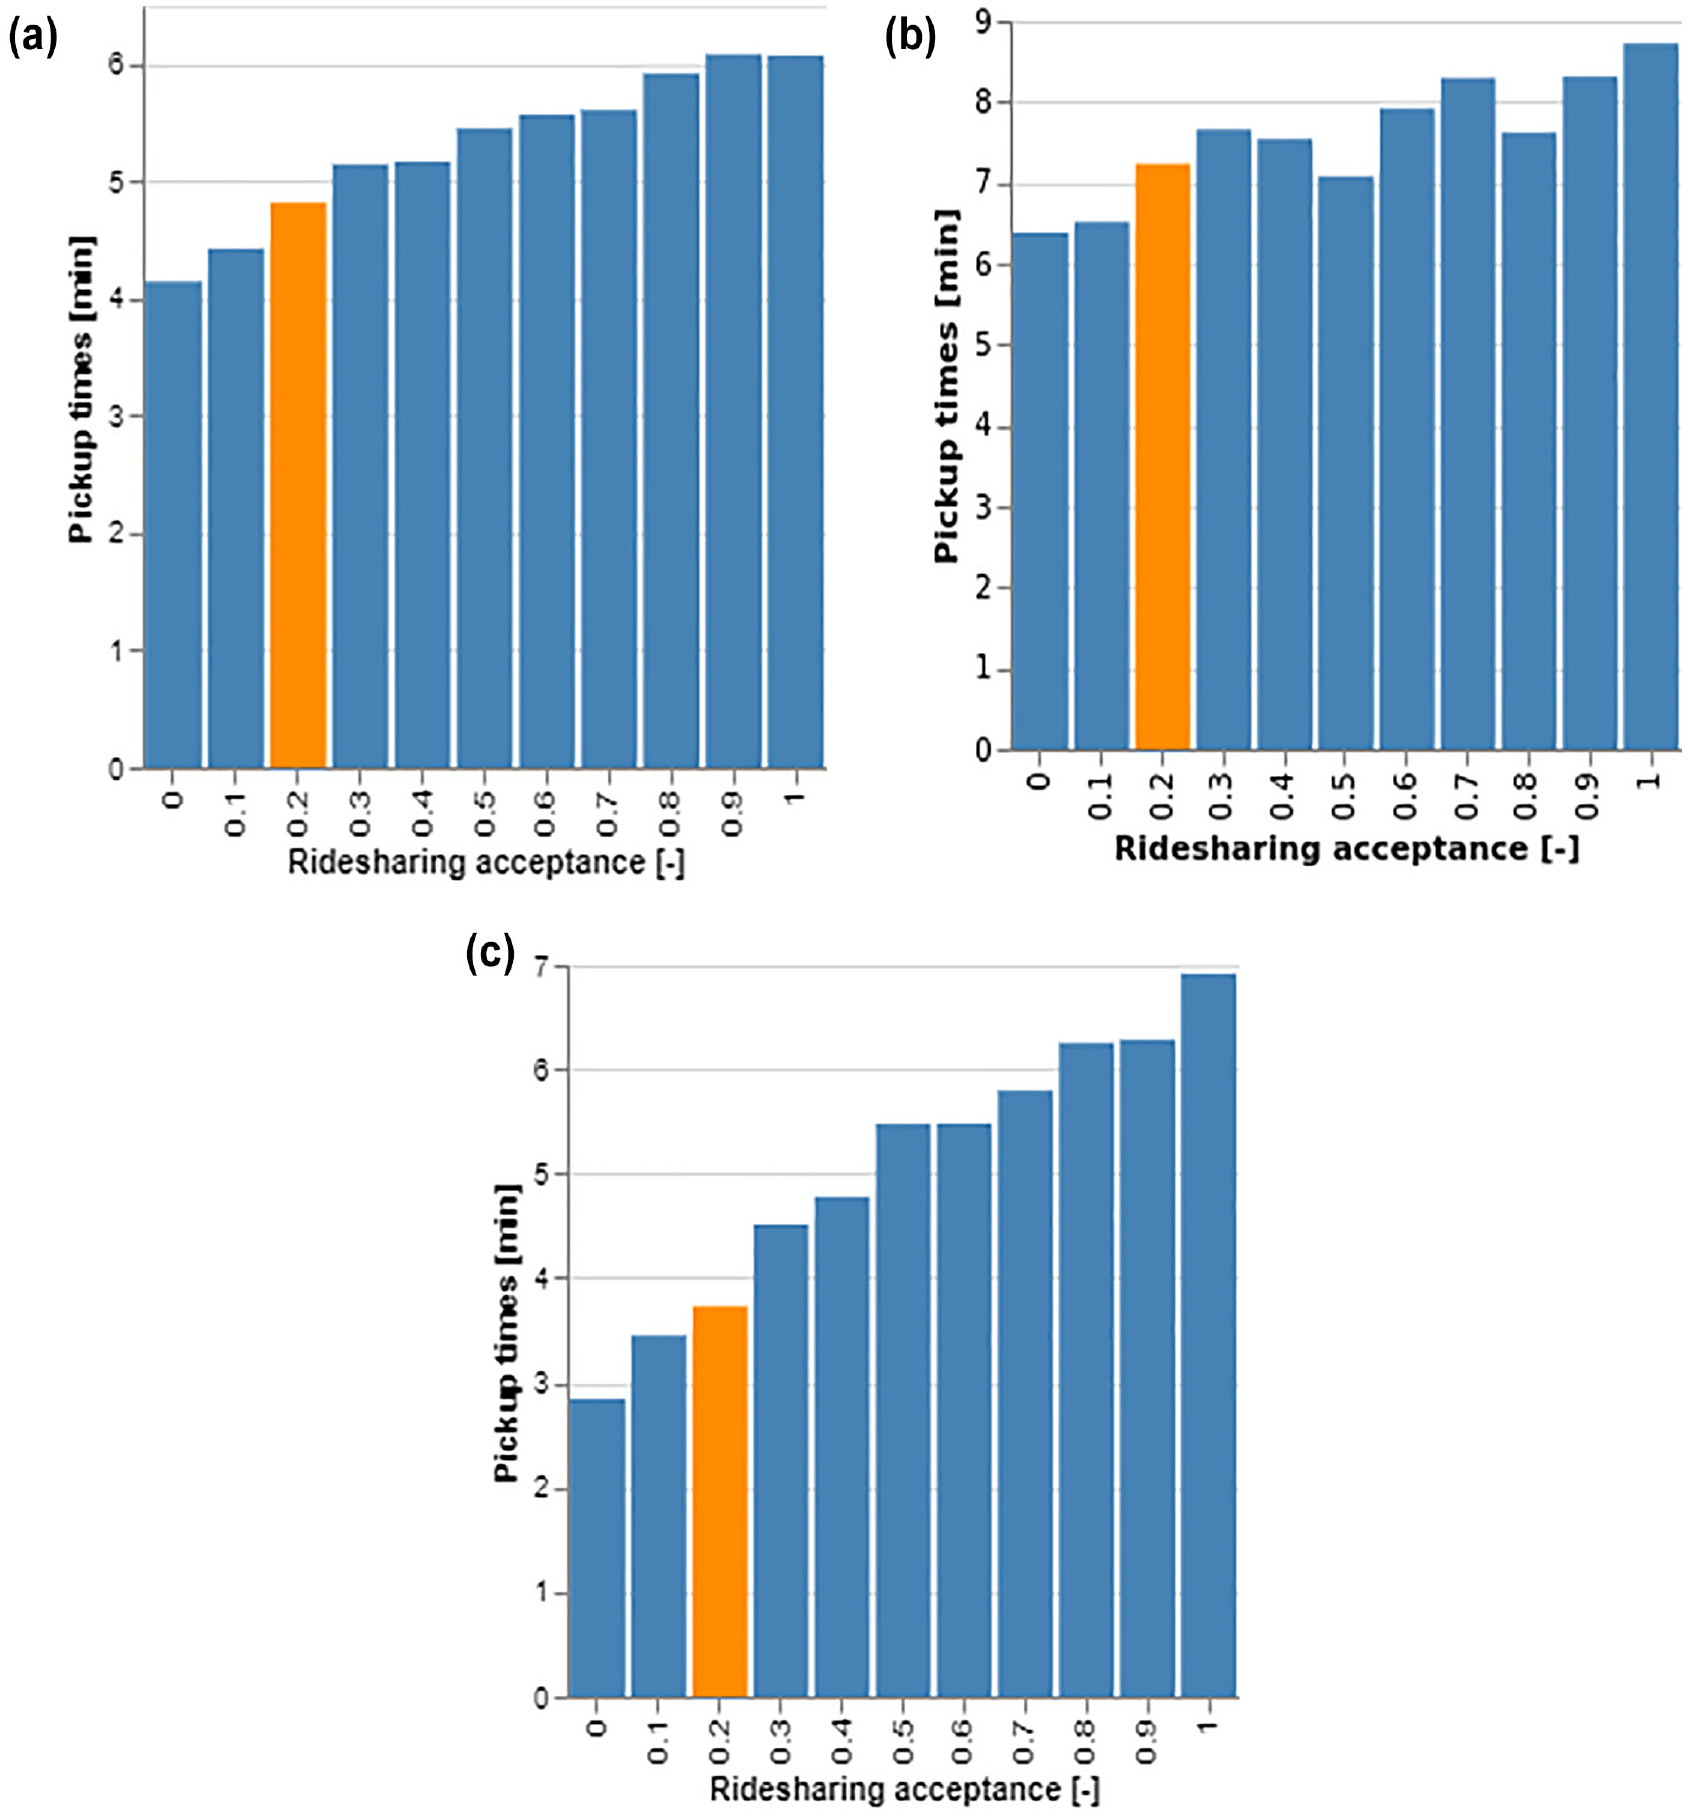
Pickup time in minutes (a) Location = central London, (b) Location = inner London, and (c) Location = outer London.
User Throughput
Different locations in London have different demand levels, particularly central London where there is a higher user throughput than inner London and even more so than outer regions of the city. For example, as Figure 15c shows, a higher number of customers in outer London will be able to complete their journeys using SAVs if the ridesharing acceptance level increases.
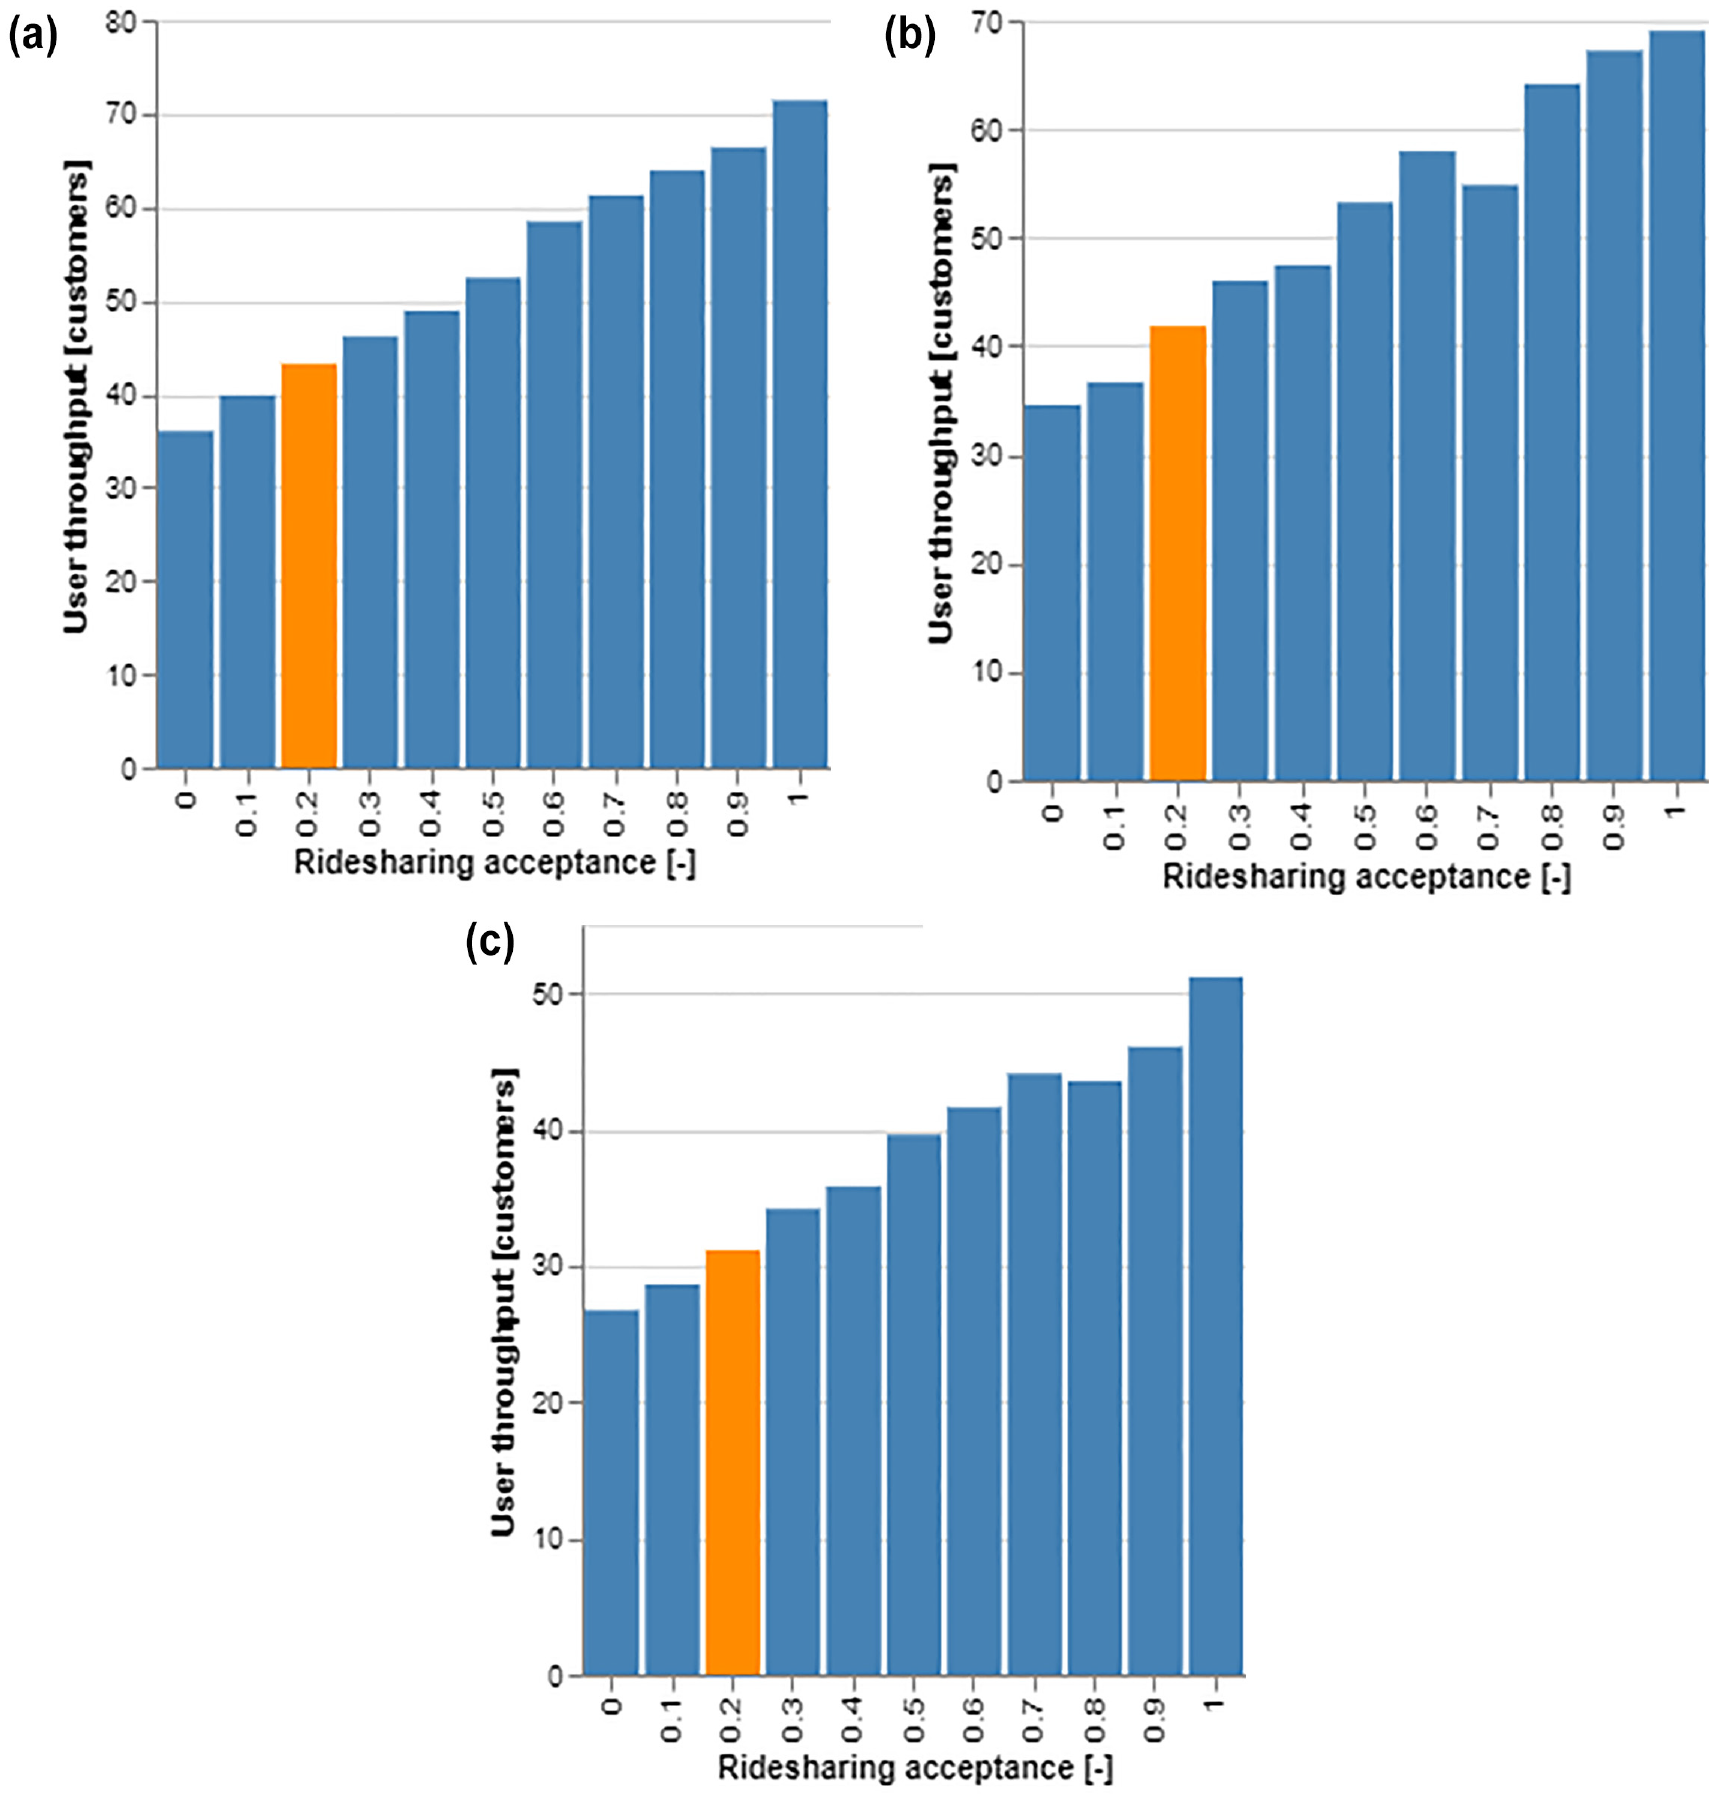
User throughput (a) Location = central London, (b) Location = inner London, and (c) Location = outer London.
Aborted Customers
With an increase in pickup time, the level of customer satisfaction may decrease. However, if users are willing to share rides more, as shown in the subsubsection User Throughput, more trips will be completed. In this study, a maximum waiting time before aborting has been set to 30 min before assignment and 10 min after assignment and before collection. This is based on the assumption that trips are not always necessarily requested directly at the point of origin. For example, a user may request a trip indoors before arriving at the trip origin. In addition, as shown in the results in the subsections Queuing Time and Pickup Time, on average, these thresholds are not met. An increase in the ridesharing acceptance level results in a general trend of a decreasing number of aborted customers, as shown in Figure 16. For central London, there is a drop in the number of aborted customers for a ridesharing acceptance level of 60%, but such outliers are the result of the effects of randomization of trip journeys. Outer London experiences no trip cancellations.
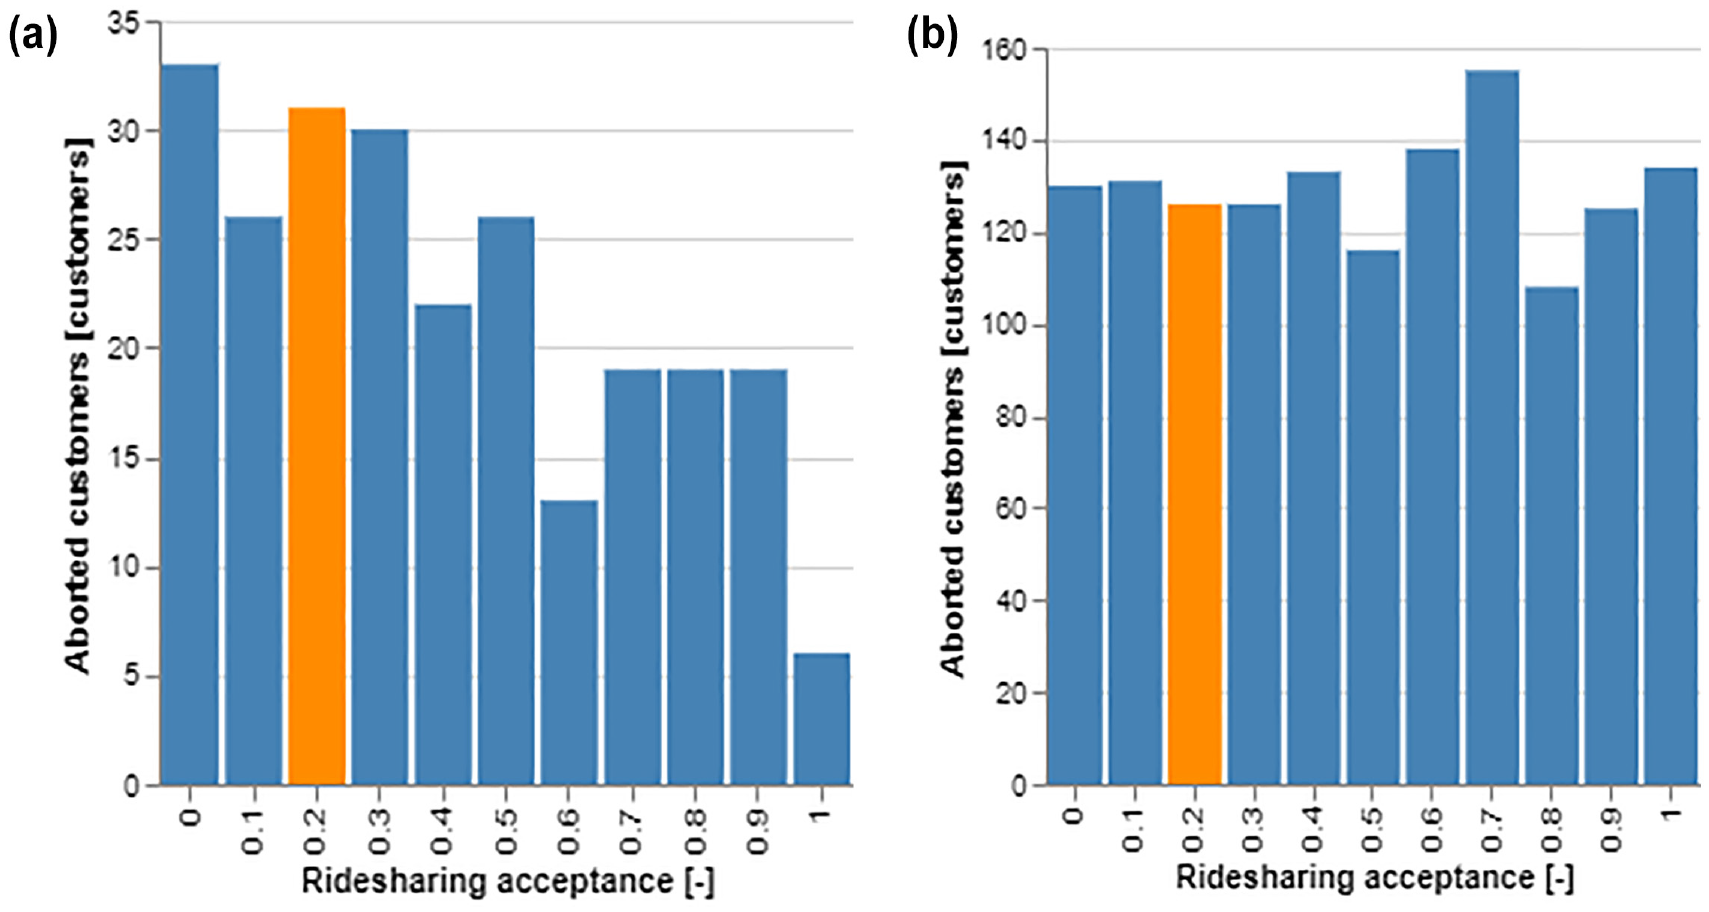
Number of cancelled trips (a) Location = central London and (b) Location = inner London.
Comparison with Public Transportation
The modes of transport that are compared in relation to energy consumption are the following:
Rail: travelers using fixed track transport instead of SAVs;
Bus: travelers using buses instead of SAVs;
Private: travelers using private vehicles instead of SAVs; and
SAV: travelers using SAVs.
Fixed track transport modes include London Underground, Overground, the Docklands Light Railway (DLR), and trains. Separating rail from bus mode is considered necessary for the case study in London because the different management groups mean these currently have separate fare structures.
In 2018, for the London Underground, the total energy consumption for both electricity and gas was 1,337,971,968 kWh ( 76 ). In the same year, a total of 12.6 billion passenger-km was observed for the London Underground ( 77 ). Based on this, 0.106 kWh per passenger-km was calculated for the same. For the DLR, London Overground, and trains, the same energy consumption rate was assumed because of limited public information on the total energy consumption. For buses, energy consumption was calculated based on an average usage of 23% of full capacity, which results in an energy consumption rate of 0.32 kWh per passenger-km ( 78 ). It may be argued that different strategies for scheduling buses may make them more responsive to demand and capable of reaching higher capacity. However, when demand-responsive buses were trialed in London, a system in which customers booked a seat to join at a virtual stop, the results showed they were no more cost-effective than nondynamic scheduling systems ( 79 ). Additionally, London’s strategy for buses is to provide a “turn-up-and-go” service without users needing to check the timetable ( 80 ). This translates into an average headway of 12 min ( 80 ), which is a different strategy to utilizing buses at full capacity.
Energy Usage
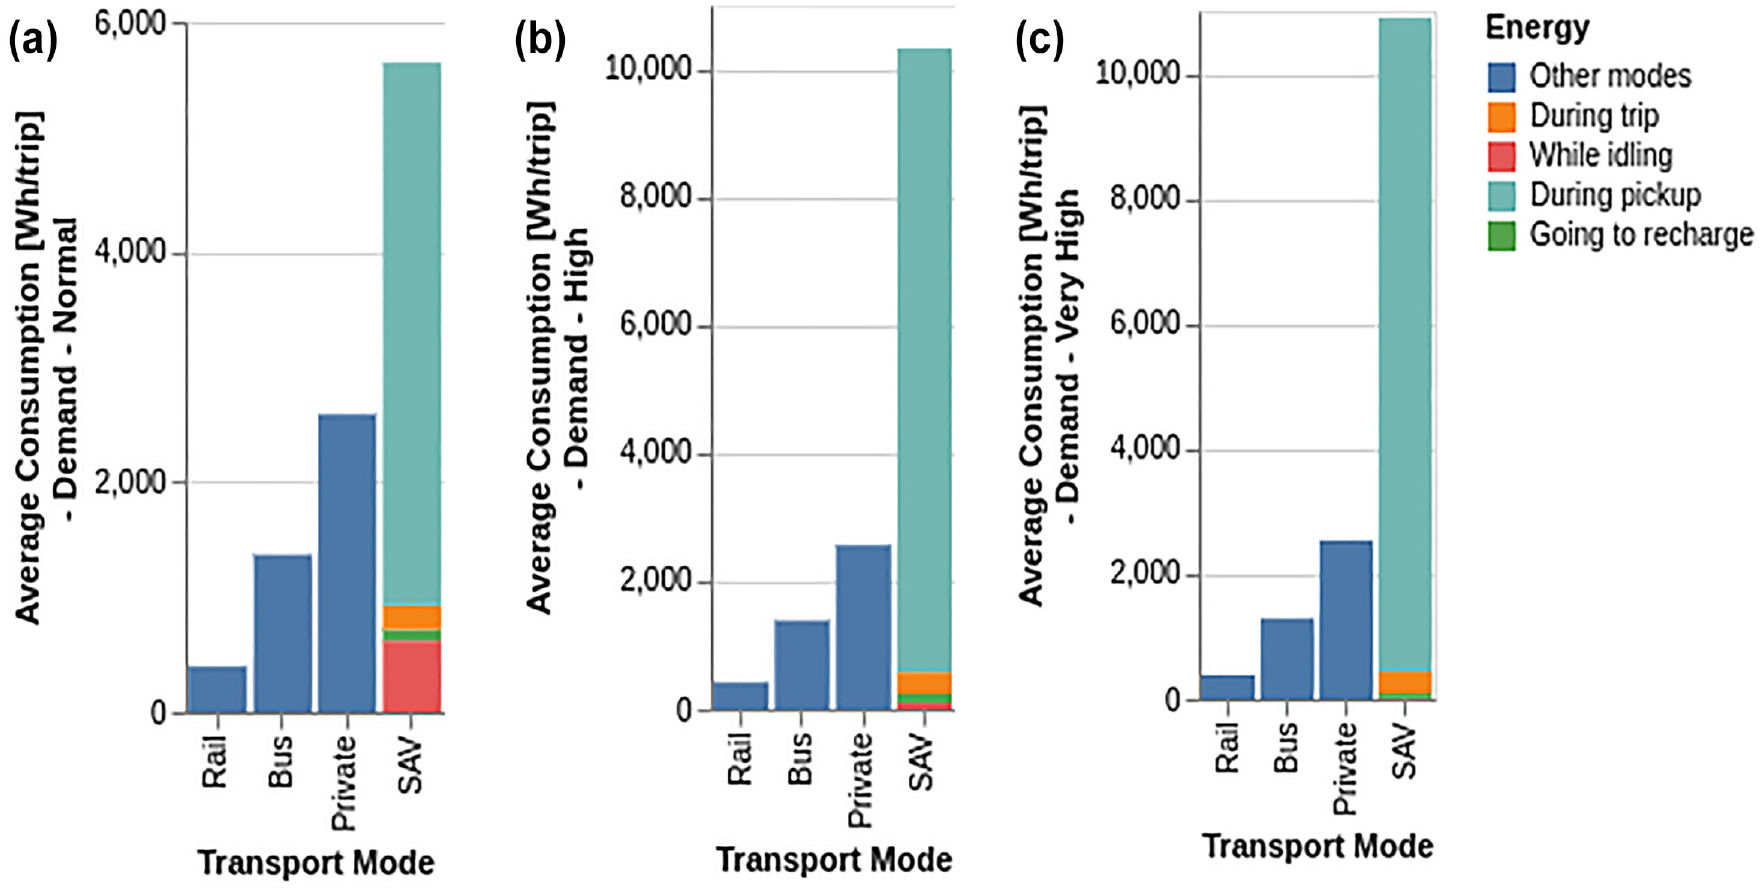
The KPI for energy consumption per trip is used to compare the different transport modes. With increasing demand levels, the energy consumption per trip for non-SAV transport modes decreases. For an SAV fleet size of 100 with 20% of customers willing to share a four-seater vehicle, overall, SAVs consume at least twice as much energy per trip as private vehicles in all three regions of London under different levels of demand. Compared with public transportation, under the same conditions, the SAVs require over five times as much energy per trip. This is a result of long pickup distances, because over 80% of their energy is spent on picking up customers. This could be reduced with a fleet relocation algorithm or a different fleet assignment strategy, which would reduce the long empty distances that SAVs cover. When occupied, SAVs consume less energy than buses and private vehicles per trip because of higher occupancy. This is explained by buses needing to travel even if empty to meet a schedule and by occupancy in private vehicles being lower than in SAVs. In inner London, SAVs have the potential to be more energy efficient during the trip travel when occupied, although the energy consumption during pickup still remains high. Inner London is widely connected with the rest of London; however, the population and demand are not as high as in central London, making the energy consumption per rail trip higher than that of SAVs during the occupied trip journey.
For SAVs to be competitive in relation to energy efficiency, the distance between pickups must be reduced, whether with higher demand density and trip frequencies or a different fleet relocation or deployment strategy that prioritizes reduction of pickup distances. This needs to be investigated further in future work. In the meantime, if the distance between pickups could be reduced to near zero, the energy efficiency of SAVs could be comparable with that of rail, bus, and private vehicles. This result is based on the assumption that the use of other modes remains the same. Once SAVs have emerged onto the transport market, new modal shifts and combinations may change the overall transportation dynamics.
SAVs could make further energy savings if the fleet is sized accordingly to reduce energy expenditure in idle mode. The results show that an SAV fleet size of 100 leads to idle vehicles when the demand is neither high nor very high. Further investigation of SAVs’ idle time based on fleet size is shown in the subsubsection Vehicle Idle Time.
The results for central London are shown in Figure 17, for inner London in Figure 18, and for outer London in Figure 19.
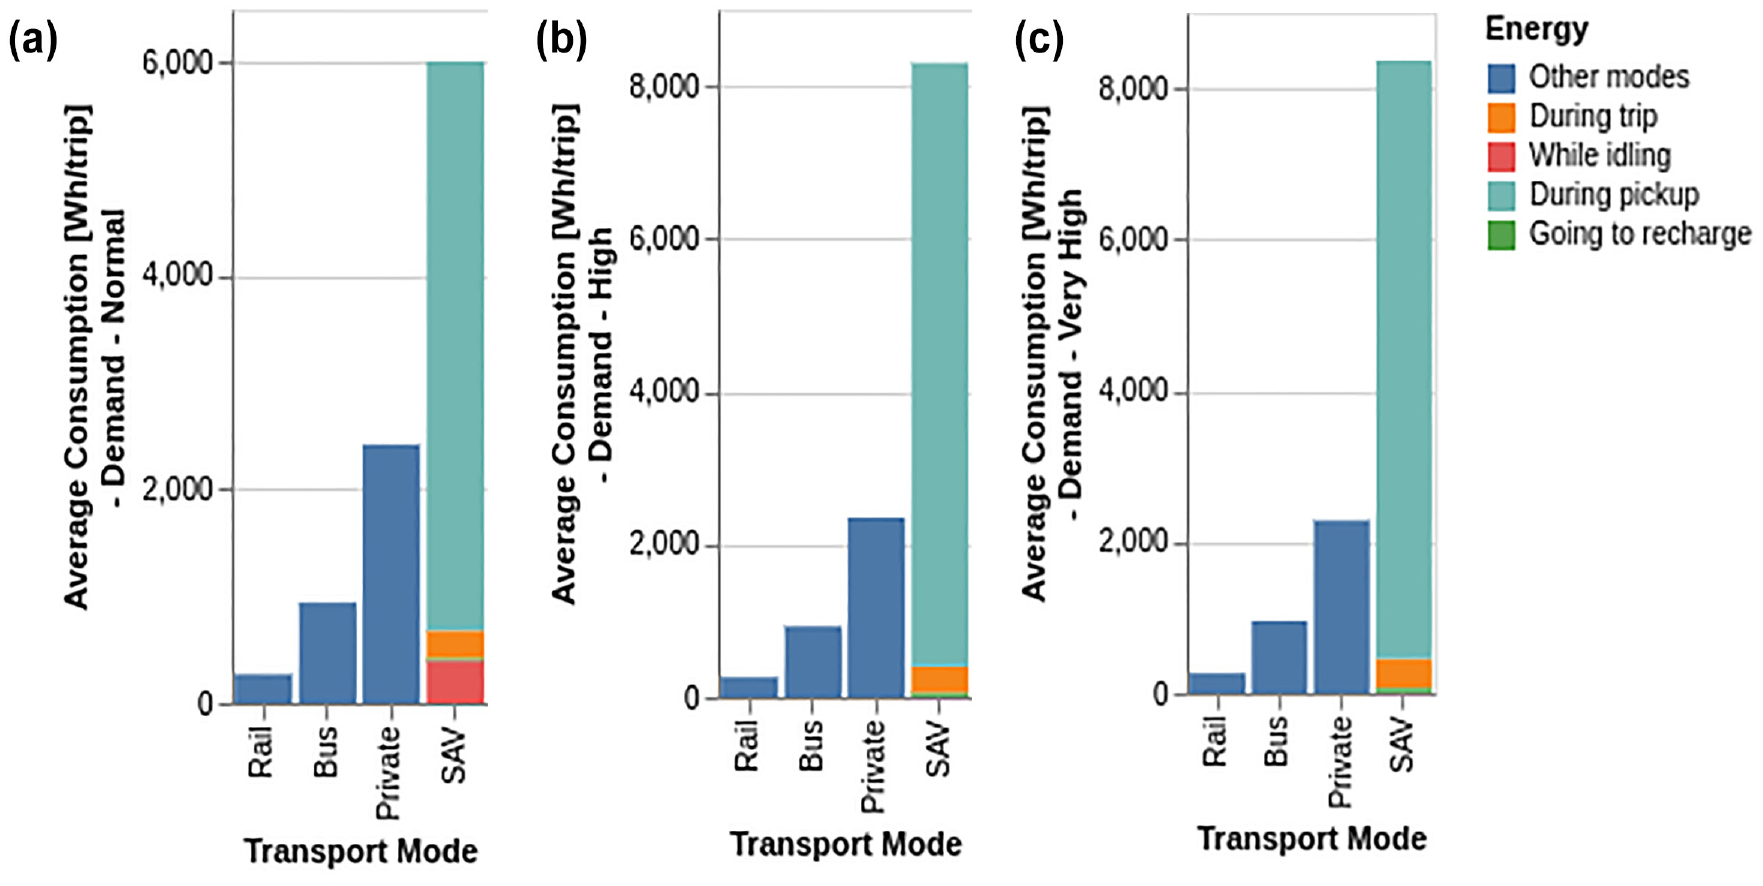
Energy consumption per trip in central London (a) Normal demand level, (b) High demand level, and (c) Very high demand level.
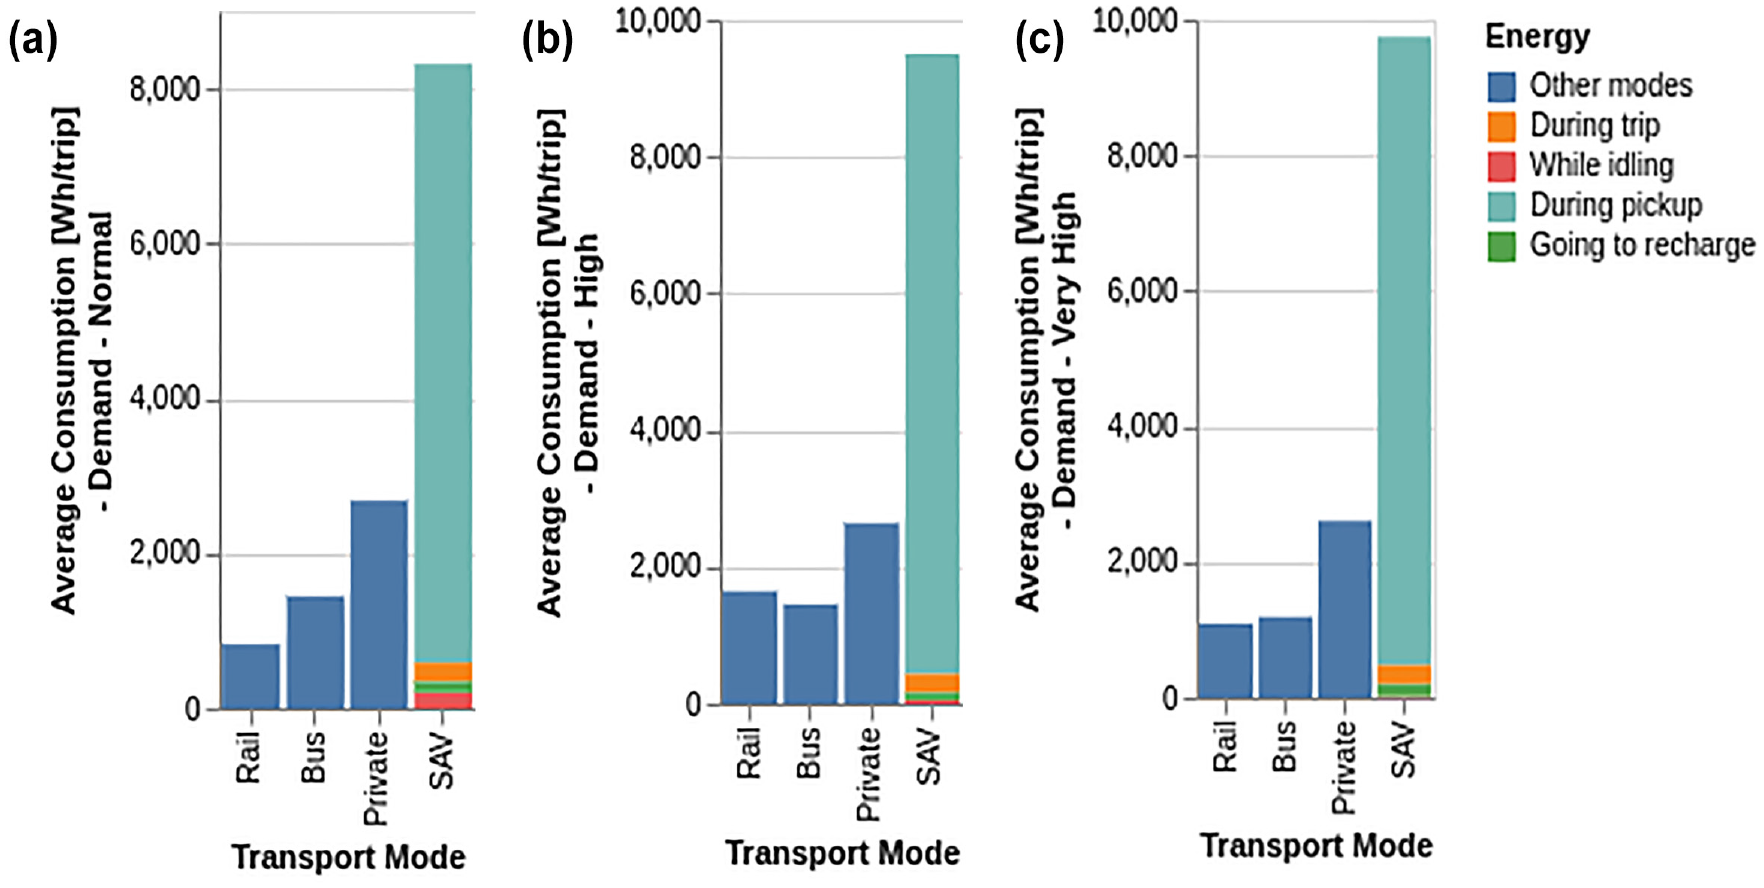
Energy consumption per trip in inner London (a) Normal demand level, (b) High demand level, and (c) Very high demand level.
Energy consumption per trip in outer London (a) Normal demand level, (b) High demand level, and (c) Very high demand level.
Operation-Related Results
Vehicle Operating Costs
In considering the cost factors mentioned in the subsubsection Cost, the operating costs per kilometer have been calculated over the short, medium, and long term. The ridesharing acceptance level has some influence on the cost, but the fleet size will actually drive the operating costs. This is partially because of the initial investment and maintenance cost per vehicle. Results for central London for the near future are shown in Figure 20, for a medium term of five years in Figure 21a, and for a long term of 10 years in Figure 21b.
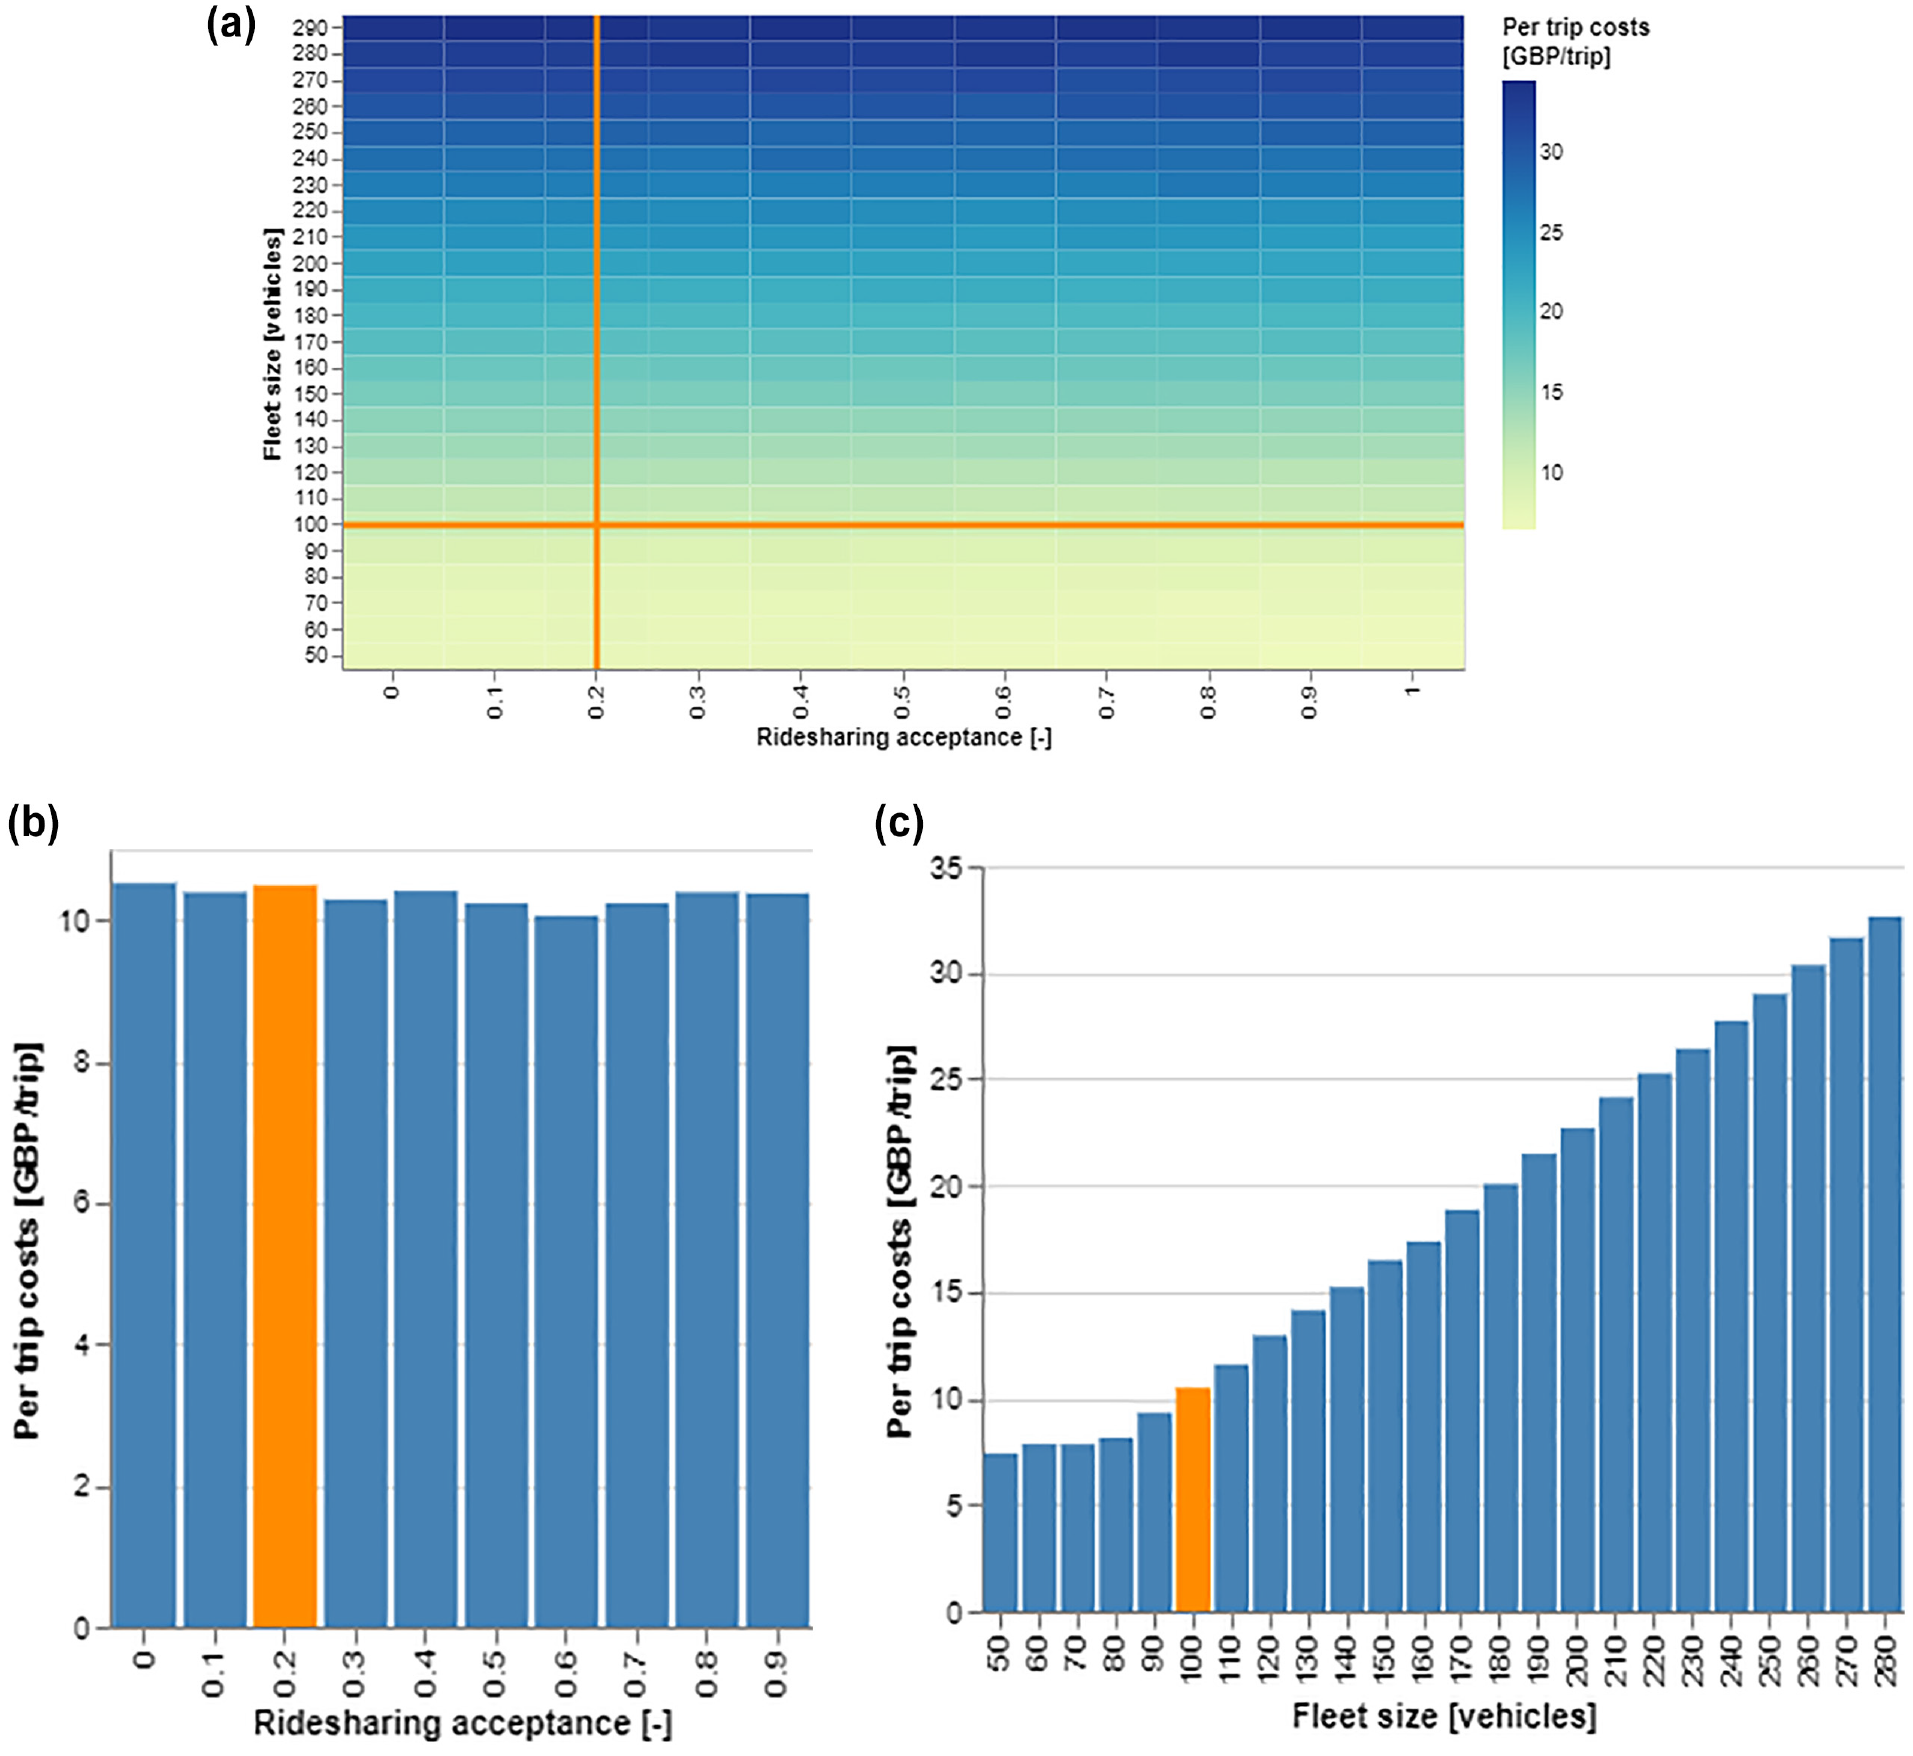
Operating cost per trip: (a) heatmap, (b) variation with ridesharing acceptance at a fleet size of 100, and (c) variation with fleet size at a ridesharing acceptance of 20%.
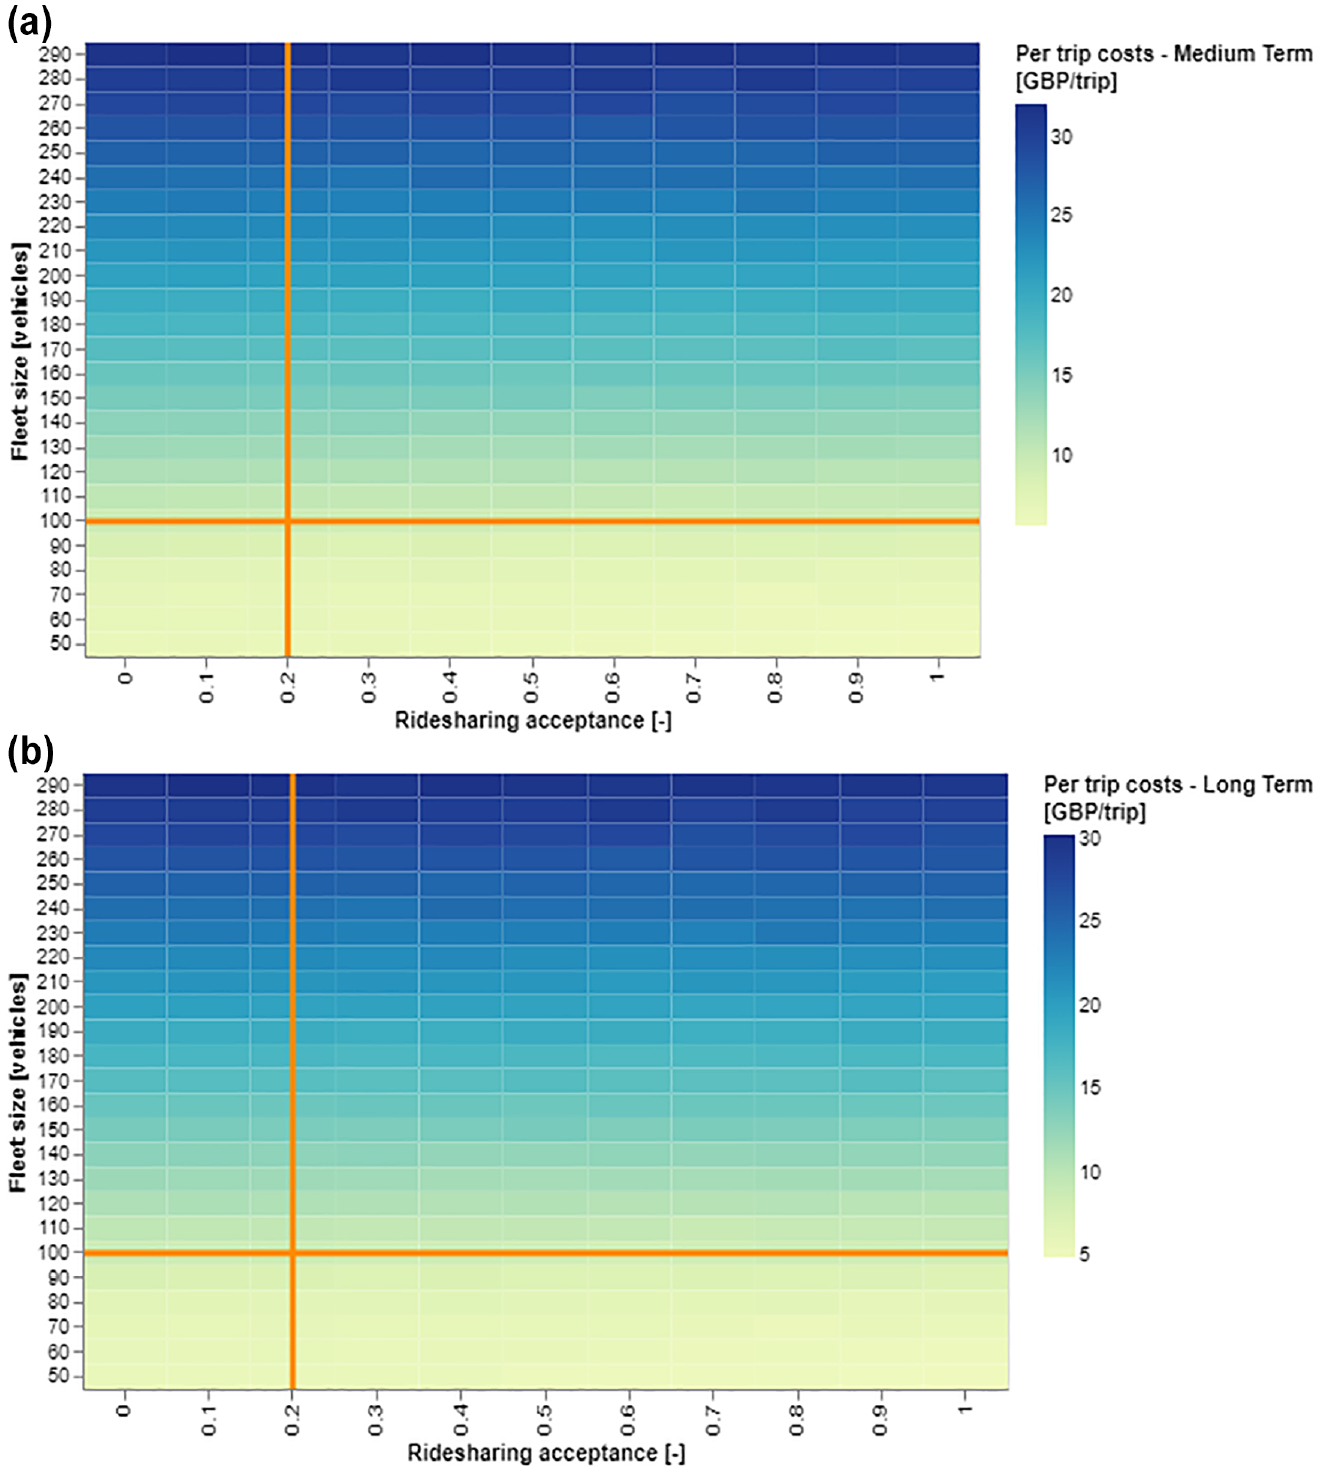
5-year and 10-year forecast of operating cost per trip (a) medium term and (b) long term.
Impact of Charging Infrastructure
The location of the charging stations is of interest to the operators, as well as to the policymakers. Although the results show only a slight decrease in energy consumption per vehicle, and also, therefore, only a small decrease in fleet energy consumption, charging stations that are more spatially distributed than the current network shown in Open Charge Map are shown to be more efficient for the two a.m. peak hours in outer London. Over a duration of a day or a year, the difference will be much more significant. The energy consumption per vehicle is shown in Figure 22 and fleet consumption is shown in Figure 23.
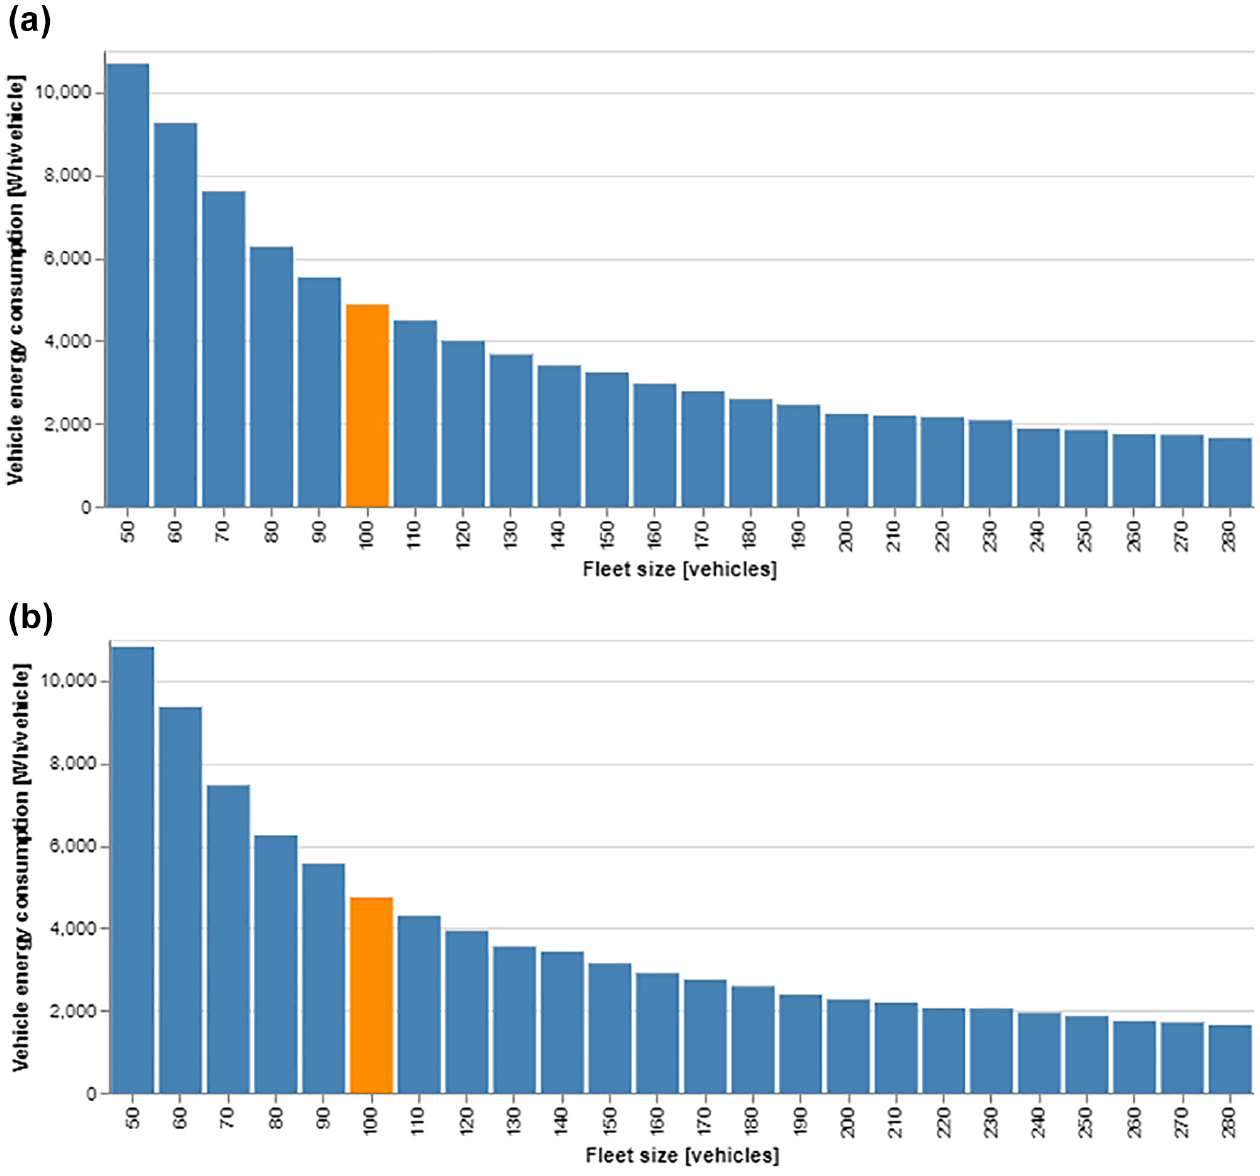
Energy consumption per vehicle (a) Charging station layout = Open Charge Map, and (b) Charging station layout = 20 spatially distributed.
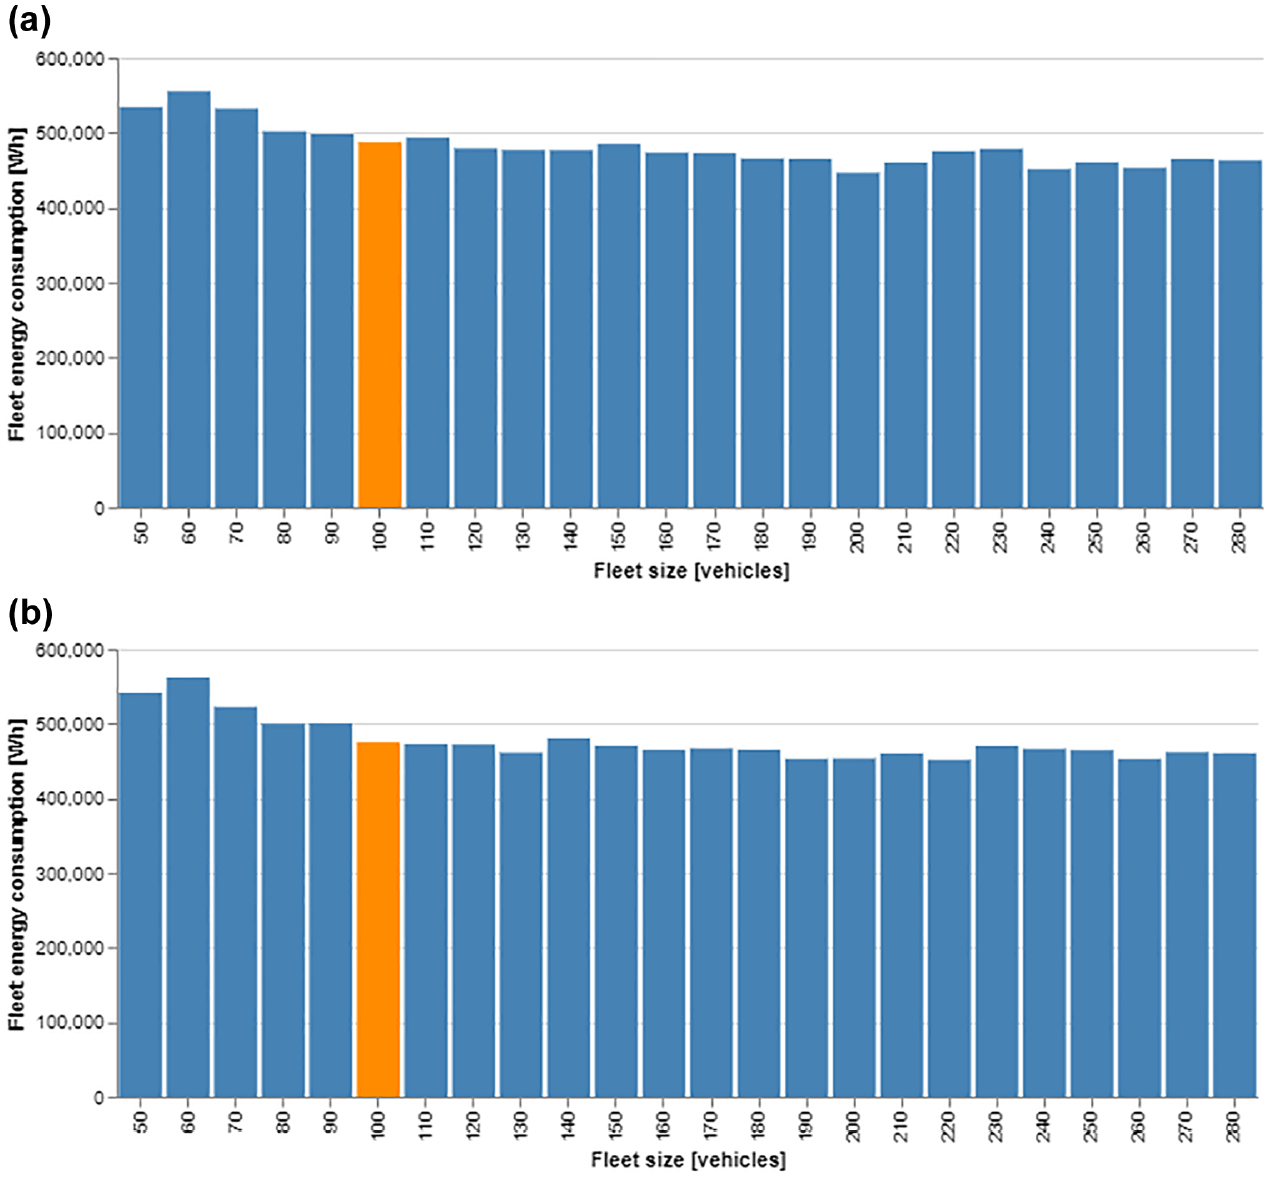
Energy consumption of the entire fleet (a) Charging station layout = Open Charge Map and (b) Charging station layout = 20 spatially distributed.
Discussion
For SAV systems to be successful, a synergy of users, vehicles, operators, and policymakers is required. The responsibility for operating a fleet of successfully functioning SAVs cannot fall to just one stakeholder group, neither should SAVs be seen as a method for satisfying the unreasonable expectations of customers.
Perspectives of Different Stakeholders
Users
The results show that in the areas of London studied, sharing a ride does not have a large influence on the average trip duration for all users even if the detour feels long to individual users. Willingness to share a ride does not change the queuing time either. If users are willing to share more trips, at the cost of slightly longer pickup times and more co-riders, their rides are more likely to be fulfilled.
Vehicle Manufacturers
Apart from the reliability and functionality of the vehicles’ autonomous technology, if their operation is to be managed centrally for better efficiency, an industry standard for an autonomous vehicle capable of being used as an SAV needs to be established, taking into account the requirement for monitoring safety and performance, and computational and connectivity specifications. As results show, in the case study of London, a higher vehicle capacity can lead to more shared trips and higher efficiency, so a variety of payloads may be beneficial.
Operators
Based on the results of the travel times for the case study areas, there should be a minimum fare charge that discourages short trips unless absolutely necessary, because the current average journey seems short and could be walked or cycled. As the results show, the fleet size should not be based on a specific a.m. peak demand because it may not be able to cope with higher demand levels. Because a higher ridesharing acceptance level leads to a lower number of aborted customers, operators could incentivize customers to share rides using price or other means.
The results also show that in the areas of London studied, with only a basic fleet management system, the idle time of a vehicle can be very long, making SAVs an unviable option for future transport based on energy consumption. Therefore, an optimal fleet redistribution strategy would be required to reduce the pickup time and mileage. One of the solutions could be having set pickup or drop-off points that vehicles would go to before entering idle mode. Beyond fleet redistribution, operators need to have a data collection system for monitoring fleet location, performance, and safety to minimize downtime and optimize fleet capability dynamically, online, and in real time.
Policymakers
The results also show the indirect influence London policymakers can have on the cost, emissions, and efficiency in relation to the operation of SAVs. As implemented by Moia ( 81 ), an option for further optimization of SAV systems is to have specific virtual pickup and drop-off points. Moia was forced to do this because of the German regulation that does not allow pickup or drop-off commercially for a long period of time at just any point ( 81 ). Although this may affect customer experience because riders are not able to be picked up from anywhere, it reduces empty vehicle mileage, increases the efficiency of the ridesharing mode and, furthermore, reduces the overall energy consumption by transportation in general. Another method of increasing efficiency is to avoid unnecessary short trips, which can be done by promoting active travel.
The results also highlighted the impact of the location of charging stations. Therefore, policymakers will need to consider the needs of both private electric vehicle and SAV users to develop ideal locations for charging stations that will experience multi-use.
In comparison with other transport modes, the results show that with the right fleet redistribution system, SAVs have the potential to produce energy consumption levels that are comparable with buses. The results also showed that when excluding pickup time, SAVs consume less energy than rail in inner London, unlike in central and outer London. This indicates that an area-specific policy is required, for example, encouraging more SAVs in areas where local rail journeys may consume more energy. If the overall transport policy integrates an SAV system with public transportation and discourages private vehicles, the total energy expenditure from transportation would decrease and much of the curb space would become available because it would not be used for parking. This would also alleviate any congestion issues a large fleet of SAVs could introduce if there is a lack of symbiosis within the transport system. A method of integrating SAVs with public transportation would be to situate the aforementioned virtual stops close to stops for other transport modes, for example, railway stations, which would encourage multimodal transport.
Limitations
This paper provides a framework for modeling the use of SAVs that has been applied to three different regions of London, which means the results are valid only for the areas studied. To model the existing operation of shared mobility, multiple extensions are required. The main four differences between SAVs and nonautonomous shared vehicles that have been identified are in relation to (lack of) competition between vehicles, (automatic) vehicle rejection of assignment, (nonspecific) passenger rejection of assignment, and vehicle loading time.
SAVs form a part of an operator’s centralized transportation system, and the operator aims to maximize profit while delivering the highest possible service performance. However, in today’s real-world setting, each vehicle is driven by someone who is probably more interested in maximizing his/her own profit rather than considering the benefits of shared vehicles and who does not wish to compromise his/her own safety or comfort. For example, many drivers may want to work closer to their home as their shift comes to an end. Such constraints are overridden in an autonomous system via a fleet management strategy that is applied globally to the entire system.
Second, as identified in the subsection Research Gaps, in an SAV system, vehicle rejection of an assignment would be automatic, and an unavailable vehicle would not be assigned to a new trip. The unavailability may be because of a technical failure, the vehicle having no charge, or lack of capacity for a new customer. In an SAV system, the same vehicle could be in ridesharing mode (with no opt-out) or not (depending on charging, any faults) throughout a day. However, in the existing shared mobility system, a driver can reject an assignment based on his/her preferences ( 42 – 45 ). For example, some Lyft drivers appear to opt out of ridesharing mode at times for their own safety ( 45 ).
Third, in an SAV system, it assumed that passengers are unlikely to reject a specific assigned vehicle. Other than a different manufacturer or model of vehicle, there is no driver adding variability to the vehicle type. Therefore, a passenger experiences no surprises when a car arrives. Although there may be cases of a passenger who chose to share a ride changing his/her mind on arrival of the vehicle, these have been assumed to be rare. In current nonautonomous practice, both customer and driver have the option to cancel their assignment ( 39 – 45 ). This may be particularly the case if a customer feels uncomfortable about the assigned driver or does not want a vehicle that cannot accommodate additional luggage; the vehicles also act as the drivers’ personal transport and there may not be a lot of space available in the trunk.
Finally, in the current model, vehicle loading time is assumed to be minimal at 30 s on average. Passengers may be able to enter SAVs more easily and quickly. In nonautonomous operation, loading time is not short, because there is verbal confirmation of customer name and destination between the driver and customer followed by a polite greeting. These security measures could be automated with an SAV. In addition, if SAV systems become a competitive transport mode, more curb spaces that otherwise would have been used for parking personal vehicles would become available for SAVs to pull over temporarily to pick up customers.
These four key differences would need to be addressed to make the model in this study more suitable for general shared mobility that is not necessarily automated.
Future Steps
One of the key next steps for the deployment of autonomous ridesharing is client engagement for better understanding of potential customers’ wishes, expectations, appetite for ridesharing, and requirements for them to gain confidence in the technology. An aspect that needs to be tested is the pricing of an SAV service, which will help develop a revenue strategy for operators. This framework can provide the basis for customer engagement.
Within this framework, the case study has considered the demand within each specified region and not trips that may go beyond the area or originate from outside. One of the next steps could be to model SAV use between the three specified regions to understand the impact of longer journeys on the dynamics of the SAV system. This procedure could be enhanced by an analysis of trip distribution within this wider context to understand trip characteristics. However, cross-area services may not be efficient, as found by Bischoff and Maciejewski ( 33 ).
Another area for further study would be to test various algorithms such as fleet redistribution and assignment methods proposed by Dandl et al. ( 17 ), using forecast demand and customer behavior, among others. In particular, a study on reducing pickup distances could provide new insights in relation to comparison with public transportation. The study could then be extended to include multimodal journeys. Customer heterogeneity could be expanded further and consider different requirements, such as wheelchair access or other visible and hidden disabilities.
Conclusions
This paper presented a modeling framework for ridesharing in relation to AVs and SAVs. The focus was on evaluating strategies and policies from the perspectives of different stakeholders through the parametric modeling of a case study, that is, three regions of a large metropolitan city. Because of its ability to model a range of parameters at once and its inclusion of different decision problems and a network of interactions, the framework can be used by policymakers and operators to engage customers when testing ideas.
Footnotes
Author Contributions
The authors confirm contribution to the paper as follows: study conception and design: P. Angeloudis, J. J. Escribano Macias, R. Karamanis, H. Cheong; data collection: J. J. Escribano Macias, R. Karamanis, H. Cheong; analysis and interpretation of results: H. Cheong, J. J. Escribano Macias; draft manuscript preparation: H. Cheong. All authors reviewed the results and approved the final version of the manuscript.
Declaration of Conflicting Interests
The author(s) declared no potential conflicts of interest with respect to the research, authorship, and/or publication of this article.
Funding
The author(s) disclosed receipt of the following financial support for the research, authorship, and/or publication of this article: This research was carried out as part of the SHIFT project and was funded by the Centre for Connected and Autonomous Vehicles and Innovate UK.