
Abstract
Changes in climatic conditions can directly affect pavement performance. However, accounting for environmental factors in airport pavement design remains a challenge since design methods such as FAA rigid and flexible iterative elastic layered design (FAARFIELD) do not consider moisture and temperature variation as input. Therefore, to address this research gap and improve the resilience of airport pavements, this research proposes a new methodology for the structural design of flexible airport pavements. The proposed methodology in this research was applied to a case study of an international airport in Canada, using actual field data. Five scenarios were evaluated including the current climate, temperature increase, lower matric suction, and two flooding events. The results of the proposed design method showed that the traditional FAARFIELD analysis can possibly overestimate fatigue damage, and underestimate rutting damage. The outcomes showed that climate change can increase pavement damage and shorten the service life from 7 to 14 years in the scenarios evaluated. It was also concluded that the lowering of the matric suction can result in the highest damage levels. Considering the implications of climate change on transportation infrastructure, the proposed methodology can contribute to designing more resilient airport pavements in the future, since it accounts for climate variations, temperature, and moisture changes, as well as extreme events such as flooding over the design life of flexible airport pavements.
Keywords
Structural design of airport pavements mainly relies on the properties of pavement materials, loading conditions, subgrade soil strength, structural configuration, the selected pavement failure models, and the ambient conditions ( 1 ). Accounting for the ambient conditions, however, can be challenging, since the common design practices do not consider the variation in climate-related parameters such as temperature and moisture level as an input for design practices ( 2 ). Failure models (aka damage models) are equations used to convert pavement mechanistic responses into pavement distresses with the goal of quantifying the damage. To obtain the structural responses of flexible pavements, most computer programs use the layered elastic design (LED) approach. The failure models in the link the computed structural responses to the number of coverages a pavement structure can carry, and each aircraft wheel coverage then contributes to the cumulative damage factor (CDF) based on Miner’s law.
According to Miner’s law, pavement damage can be defined as the ratio of the actual number of traffic load repetitions over the allowable number of load repetitions (number of coverages) that a pavement structure can carry ( 3 ). Because of aircraft wander, the number of coverages can differ from the number of passes, and for that reason, the coverage-to-pass (C/P) ratio is incorporated in the analysis. An outline for the pavement structural design steps followed by FAARFIELD is summarized in Figure 1.
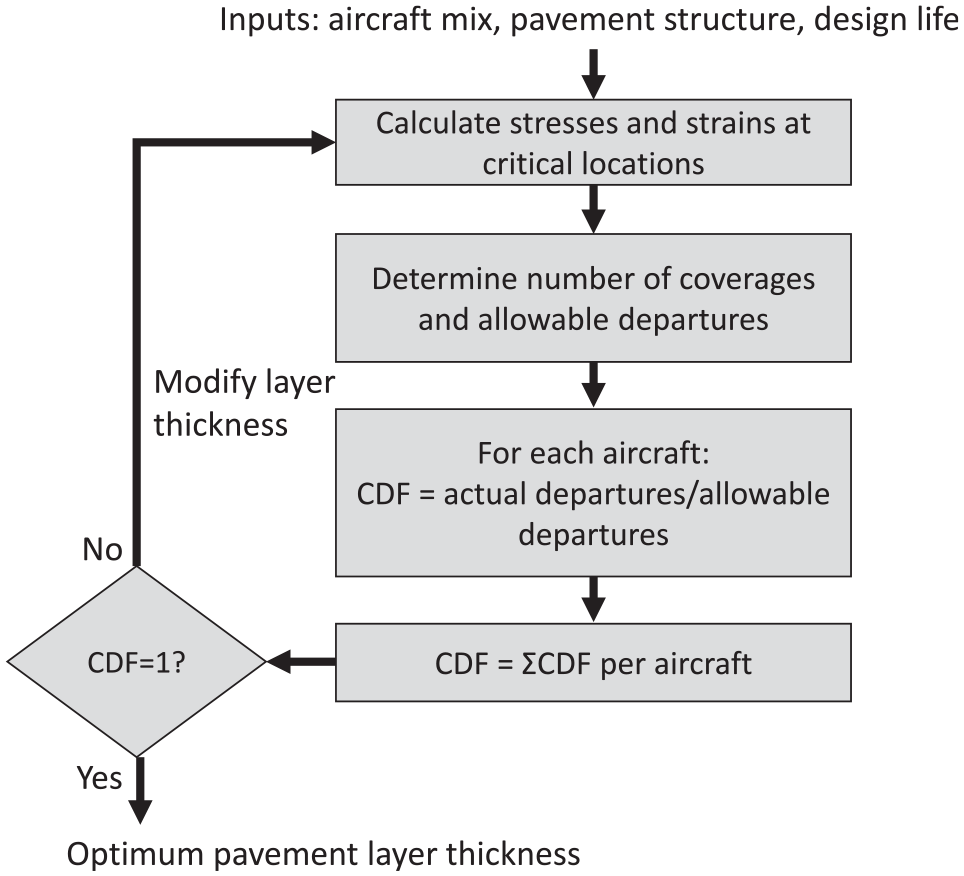
FAA rigid and flexible iterative elastic layered design (FAARFIELD) solution process.
As showed in Figure 1, FAARFIELD repeats a cycle by changing the pavement layer thicknesses until it reaches CDF = 1, which means that the pavement damage reaches 100% at the end of its service life.
Other airport pavement design software available includes Airport Pavement Structural Design System (APSDS, Australia), ALIZE (France), and Pavement-Transportation Computer Assisted Structural Engineering (PCASE, USA). Similar to FAARFIELD, the APSDS, ALIZE and PCASE codes for flexible pavement design are based on the layered elastic theory. All the software uses transfer functions to convert the calculated mechanistic responses to pavement distresses, using equations obtained through full-scale tests. One of the main differences between these design methods is the way that the calibration parameters are used to construct failure models ( 1 , 4 ).
The consideration of climate variation over the pavement service life is essential to incorporate climate change predictions in the current design practices, nevertheless, it is not possible to assess the damage caused by climate fluctuation in FAARFIELD, APSDS, ALIZE or PCASE, since these software packages consider that the pavement materials have constant stiffness values throughout the year and over the design life. There are a few studies that address the effects of climate change on road pavements. Such studies have used the Mechanistic-Empirical Pavement Design Guide (MEPDG) software to assess the impacts of climate change on road pavement performance and design ( 5 – 7 ). The main findings suggest the implementation of strategies that include upgrading binder grade, increasing layer thicknesses, and stabilizing granular materials.
Airport pavements require closer attention than road pavements because they suffer concentrated high-speed loads, and a structural flaw can lead to serious consequences for the safety of the users. However, research on the impacts of climate change on airport pavements has been very limited to date. A survey developed by the Centre for Pavement Transportation and Technology (CPATT) at the University of Waterloo investigated several Canadian airports and their considerations in relation to climate change ( 8 ). The results of the survey showed that airport authorities perceive an increase in pavement distresses because of climate change, and they all agree that the changing environment already has an impact in their current practices to some extent.
Climatic changes have been recently investigated in a variety of airports across Canada and they found that adaptation strategies in pavement materials and design practices were necessary ( 9 ). The need for adaptation strategies has motivated the authors of this research to develop a new methodology that can provide benefits in relation to quantifying the impact of climate change on pavement performance, which can ultimately help with the design of more resilient airfield pavements in the future. Therefore, the main objectives of this paper are to: (a) propose a new methodology for the structural design of flexible airport pavements considering climate variation over the pavement service life; (b) implement the proposed methodology in a case study using actual field data; and (c) perform the analysis of different climate scenarios, including the current climate, temperature increase, lower matric suction, and two flooding events.
Methodology
This research proposes a methodology that enables the structural design of flexible airport pavements considering climate variations throughout the year, and climate change throughout the service life of the facility. This study proposes the following 7-step methodology that can be incorporated in airport design practices and includes: (1) obtaining hourly climatic data; (2) determining and processing the pavement temperature profile; (3) estimating the asphalt concrete (AC) dynamic modulus and the soil resilient modulus throughout the year; (4) calculating pavement stresses and strains; (5) determining the number of coverages and the C/P ratio; (6) calculating the CDF for rutting and fatigue; and (7) adjusting the layer thicknesses if CDF is greater than 1 and repeating the process until the cumulative damage equals 100%. These steps will be further discussed in the following sections, accompanied by the results of a case study that is analyzed under different climate change scenarios. The flowchart in Figure 2 summarizes these steps.
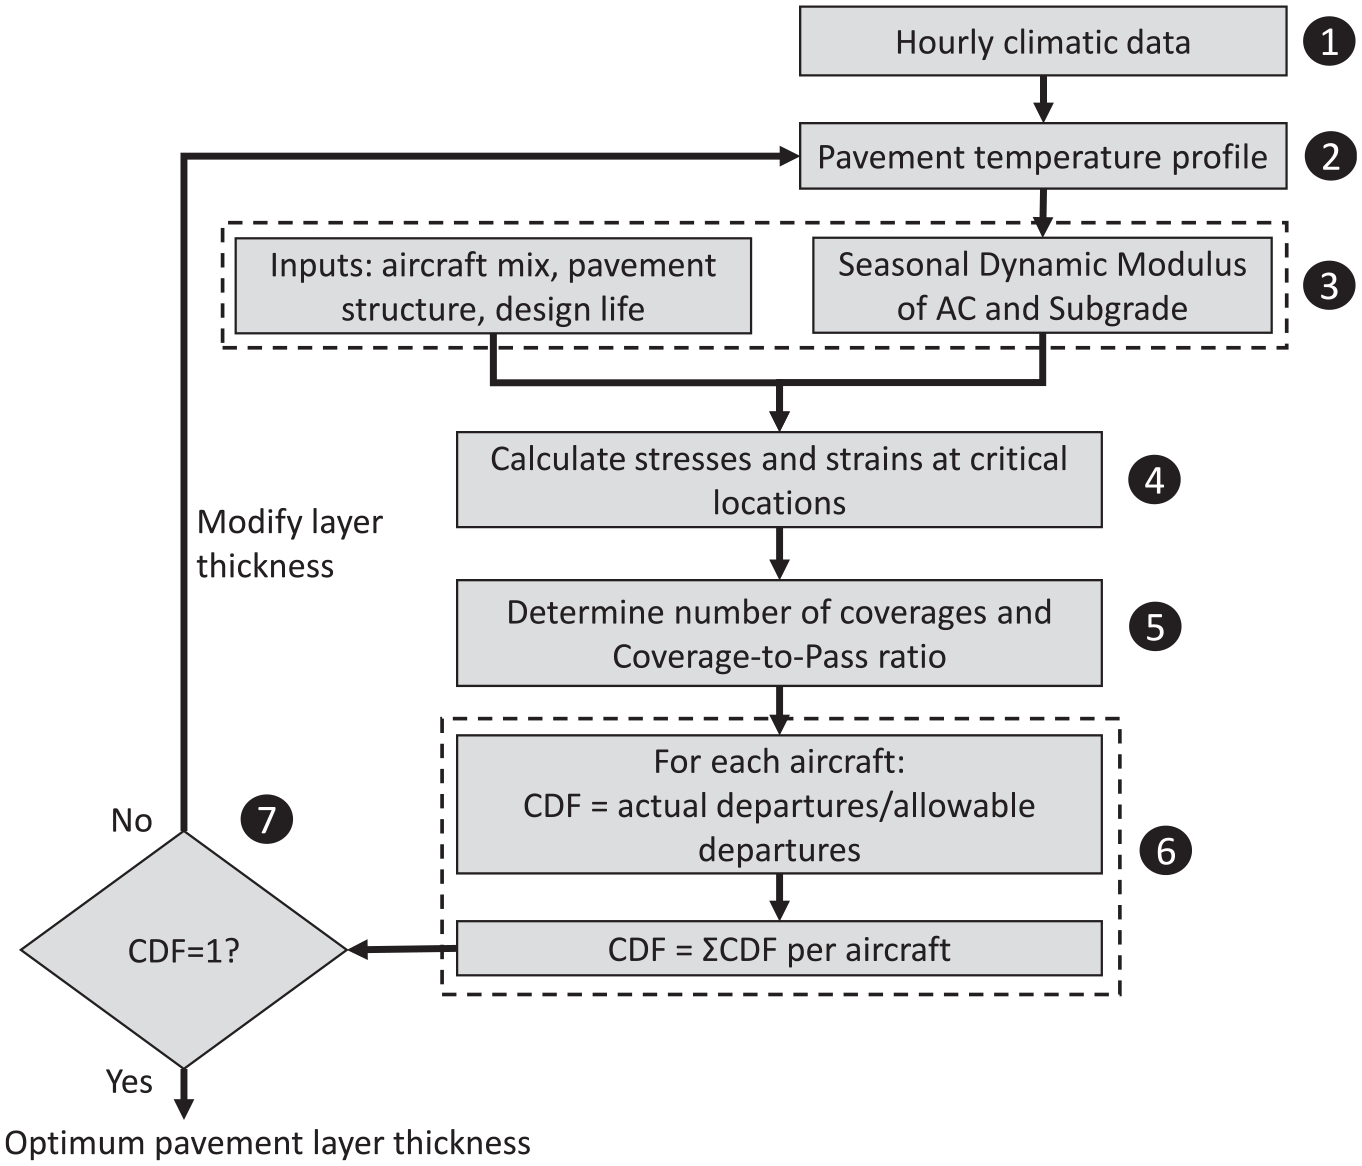
Proposed solution process.
Hourly Climatic Data and Pavement Temperature Profile
Although most of the existing airfield pavement practices rely on the simplified temperature and stiffness scenarios, the modern computational power capability allows researchers to utilize more accurate and realistic climate and climate-dependent parameters. To determine the stiffness of each pavement layer throughout the year, first it is necessary to estimate the pavement temperature profile. Understanding the temperature gradient at different depths throughout the year can be useful to determine the state of pavement subgrade (i.e., frozen, thawed, or unfrozen), as well as the temperature of the AC across the year. The input parameters used for calculating the temperature profile included the climatic data (i.e., air temperature and wind speed), solar radiation as the meteorological data, and pavement surface radiation properties (i.e., albedo, emissivity, and absorption coefficients). The climatic, meteorological, and surface albedo data were retrieved from the National Solar Radiation Database (NSRDB), which is available to the public for free. Then, the temperature gradient was calculated through the finite control volume method ( 10 ). To this end, temperature estimate model for pavement structures (TEMPS) software was utilized. This aspect covers the first two steps of the proposed methodology and provides the foundation for the next steps.
Asphalt Concrete and Subgrade Modulus
Step 3 of the proposed methodology focuses on AC and subgrade modulus determination. The stiffness of the layers, combined with the definition of the aircraft fleet mix, the layer thickness, and the design life, are a crucial part in a solution process that can incorporate climate parameters. This study aims to include the temperature dependency aspect of the pavement materials in the analysis to improve the currently used constant or single-value modulus values. To determine the dynamic modulus of the AC, the modified Witczak’s sigmoidal function was used (
11
). The main model inputs are the loading rate, temperature, binder performance grade (PG), and volumetric design information. The effect of loading rate can be estimated considering a sinusoidal loading, with frequency
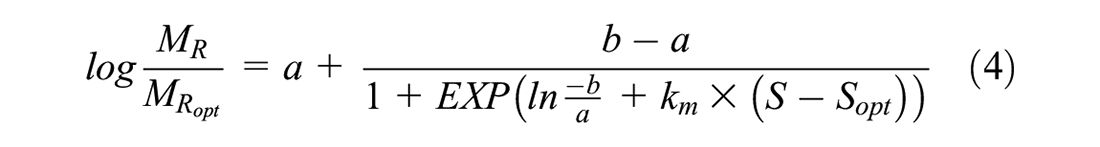
On the other hand, to determine the variations in the resilient modulus of the subgrade soil with time, this research proposes a similar approach to the MEPDG, in which an environmental adjustment factor (

The

The recovering adjustment factor (

The number of hours elapsed since thawing started (
The recovery period (
in which
The unfrozen adjustment factor
As an example, after a flooding event, the water table level is elevated, and most of the layers can reach saturation levels of 100%. As the water drains out of the pavement structure, the matric suction is raised until it reaches its normal suction levels. The damage incurred during the immediate post flooding period (IPFP) can be conceptually defined according to Equation 5 ( 14 );

in which
Evidence shows that the wet-dry cycle does not adversely affect subgrade stiffness, that is, the strength of the subgrade soil can recover after a flood if it is given enough time to dry ( 14 ). Therefore, this research considered that the resilient modulus of the subgrade fully recovers after the water from flooding is completely drained, and the pavement returns to its equilibrium degree of saturation.
Pavement Responses, Coverages, Coverage-to-Pass Ratio, and CDF
This section explains steps 5, 6 and 7 of the proposed methodology by presenting some of the available tools to obtain the pavement responses, introducing how pavement responses are connected to the number of coverages, how to estimate the C/P, and last, by showing the procedures to calculate cumulative damage because of rutting and fatigue.
Flexible pavement design codes typically use the LED approach for its structural analysis ( 1 ), however, advances in knowledge about materials behavior and computer technology have greatly increased the interest in numerical techniques, such as the finite element method. Some of the available LED-based tools for the structural analysis of pavements are: KENLAYER, CHEVRON, DAMA, ELSYM5, BISAR, EVERSTRESS, and NonPAS. The mechanistic-empirical design of airport pavements is an iterative process, which may require several iterations until the optimal design is found. Although more sophisticated techniques can potentially improve the accuracy of the modeling, the required computation time and cost to obtain the necessary input parameters can be an obstacle. Therefore, selection of the right modeling tool to use in the design process for flexible pavements will be a trade-off depending on the nature of the analysis and level of accuracy targeted.
Airport pavement transfer functions connect pavement responses to the number of coverages that the pavement can carry. Coverages can be defined as the number of repetitions of the maximum strain before failure. The number of coverages to rutting failure is defined in FAARFIELD 1.41 by a bilinear model (Equation 6) ( 15 ) and fatigue failure is defined based on the ratio of dissipated energy change (RDEC) model (Equation 7) ( 16 ).
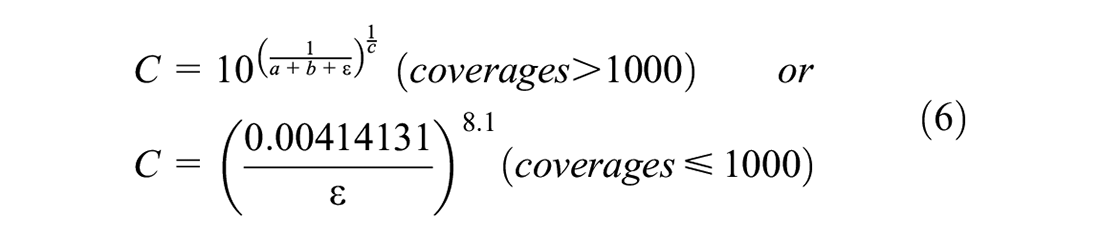
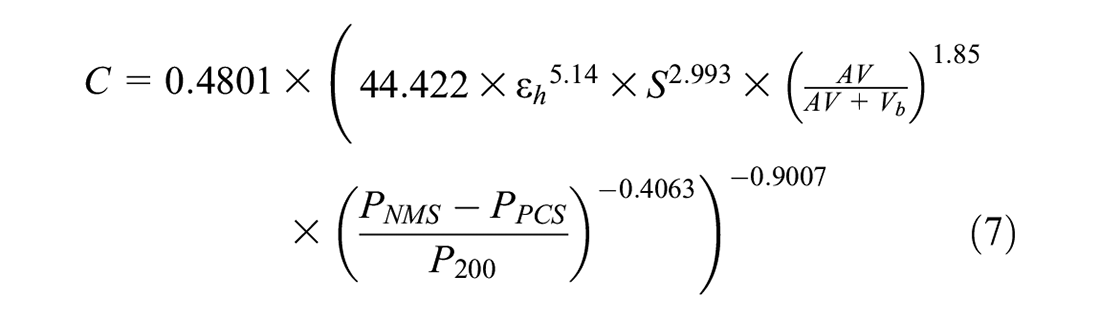
where
Since the number of coverages can differ from the number of passes because of aircraft wander, a C/P ratio needs to be computed. The C/P ratio can be defined as the probability that any part of the effective tire width covers the center point of a given strip, as presented in Equation 8 ( 17 ):
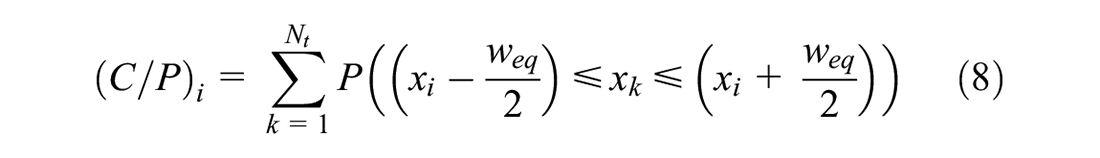
where


In which,

Case Study: Pearson Airport
Toronto Pearson International Airport is the main international airport serving Toronto, its metropolitan area, and its surrounding region. It has 5 runways and several taxiways interconnecting the airport. The soil classification was based on the borehole data provided by the Greater Toronto Airports Authority (GTAA), which indicates that the predominant subgrade material is a Sandy Lean Clay with Gravel with a low to moderate frost susceptibility. The subgrade soil composition includes 8.8% of gravel, 29% of sand, 32.5% of silt and 29.7% of clay. Further details of the subgrade soil is provided in Table 1, such as the plastic and liquid limit, the plasticity index, the percent passing sieve #200
Subgrade Properties at Pearson
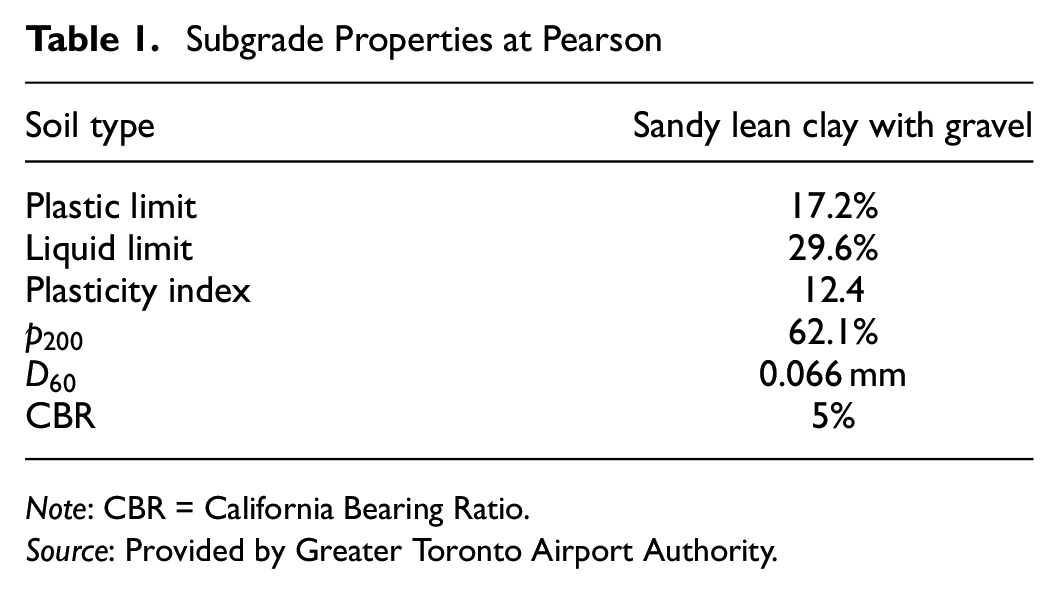
Note: CBR = California Bearing Ratio.
Source: Provided by Greater Toronto Airport Authority.
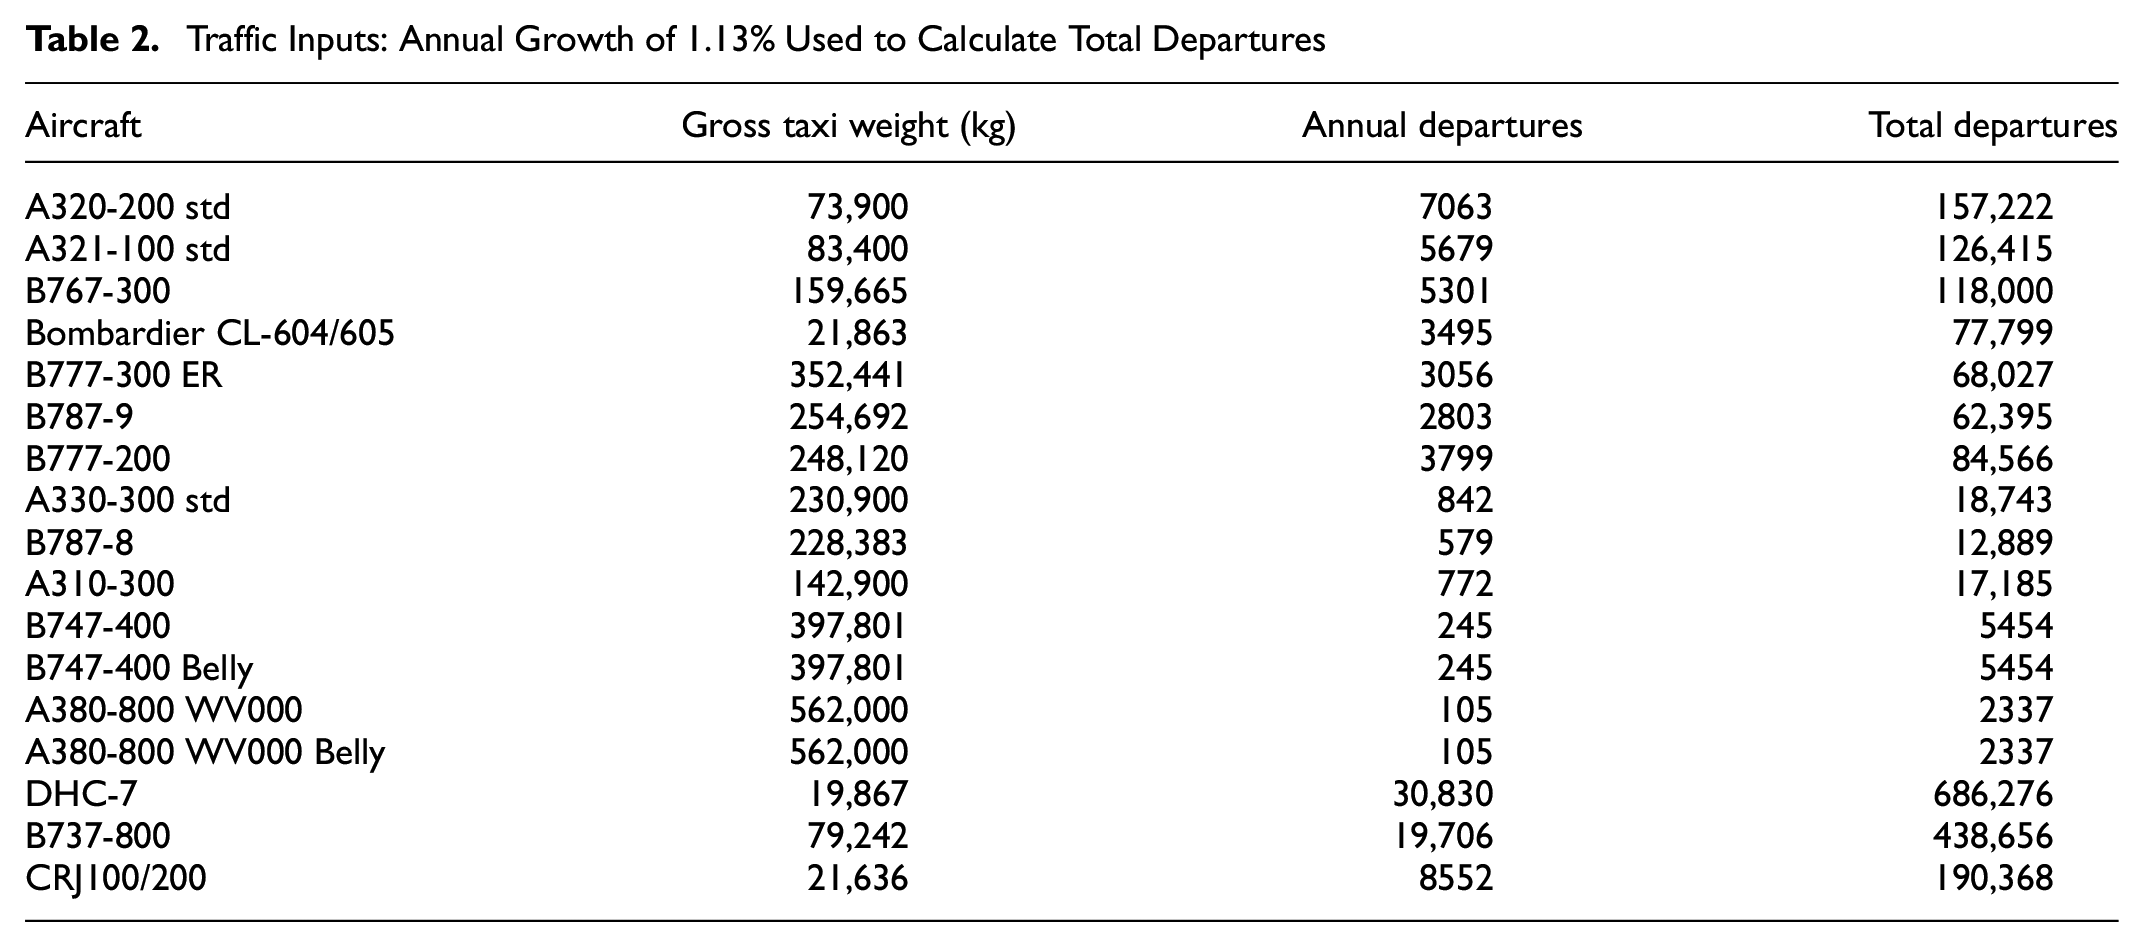
In relation to aircraft traffic in 2019, 50.5 million passengers travelled through Toronto Pearson Airport and about 452,800 flights were handled ( 19 ). In 2020 and 2021 the number of flights decreased drastically because of the COVID-19 pandemic, resulting in 32,899 and 6,383 flights in 2020 and 2021 respectively. It is believed that the number of flights will resume its normal levels in the next few years, and Toronto Pearson Airport will continue to grow in the long term. For this reason, the traffic information used in this analysis will be based on the total operations in 2019, and the growth predictions will be based on the airport master plan published in 2018 ( 20 ). The airport master plan predicts that takeoffs and landings will grow at a rate that ranges from 1.13% to 1.5%. Considering the impact of the COVID-19 pandemic, the authors assumed the lowest growth rate prediction of 1.13%.
An airport runway design is greatly influenced by the type of aircrafts serving an airport. To perform the structural design of a runway, first it is necessary to define the aircraft fleet mix, that is, the percentage of aircraft, by type or category, that operate at the airport. Runway 05-23, managing 45% of the aircraft operations, is the busiest runway in the airport ( 21 ). The aircraft fleet mix proposed was developed based on the traffic data records from 2019, according to data provided by the GTAA and is presented in Table 2.
Traffic Inputs: Annual Growth of 1.13% Used to Calculate Total Departures
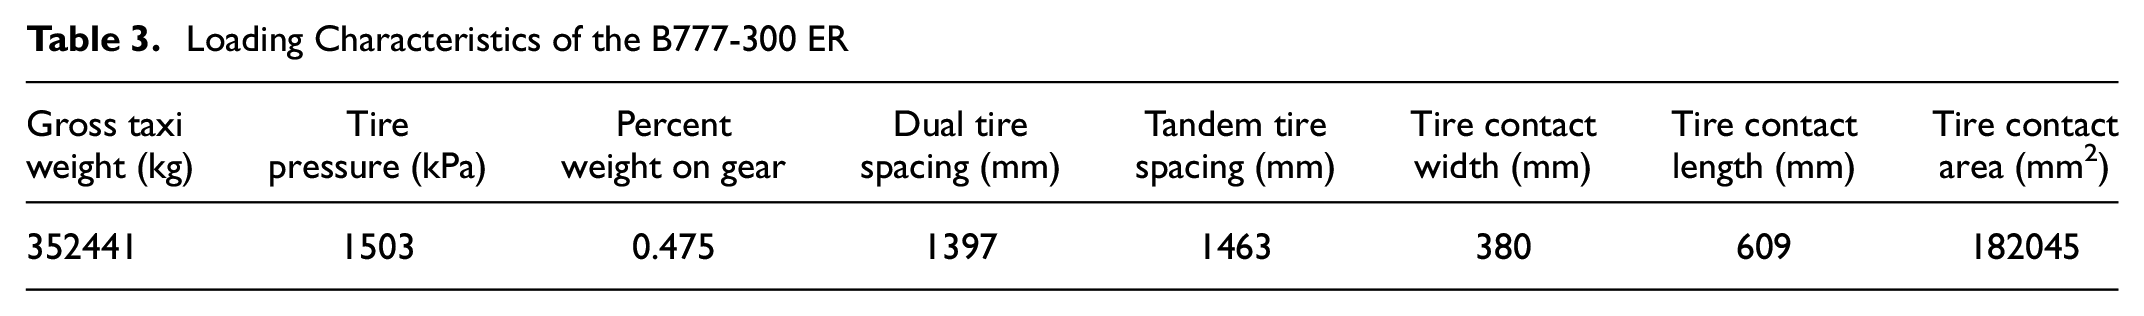
It is a common practice to consider the aircraft wheel load to have a circular contact area with a flexible pavement. FAARFIELD, however, defines the wheel contact as elliptical, following the guidelines given by Huang ( 22 ), in which the contact length is about 1.6 times longer than the contact width. Table 3 presents the loading characteristics of the B777-300 ER is the most critical aircraft in the mix because it causes the highest damage to the pavement.
Loading Characteristics of the B777-300 ER
Existing Runway Structure and Materials
According to the GTAA, the pavement structure from a typical flexible runway in Toronto Pearson Airport consists of three layers, namely an AC layer of 125 mm thickness, followed by a granular base of 300 mm and a granular sub-base of 900 mm. The materials have similar characteristics to the standard materials from FAARFIELD.
According to Steward ( 23 ) and GTAA information in 2021, the overall pavement thickness of Toronto Airport runways has not been updated since 1993, and the runways were designed for the critical aircraft is the one that causes the highest damage to the pavement among the aircraft fleet mix at the time, which was the B747-400. It is expected that newer aircrafts such as the B777- 200LR/300ER, A340-500/600, and A380 are all more critical for the determination of a suitable pavement structure, and that failure to improve the pavement structure will result in reduced service life.
The AC mix used in this research was collected at Toronto Pearson International Airport and analyzed in the Centre for Pavement and Transportation Technology (CPATT) (
9
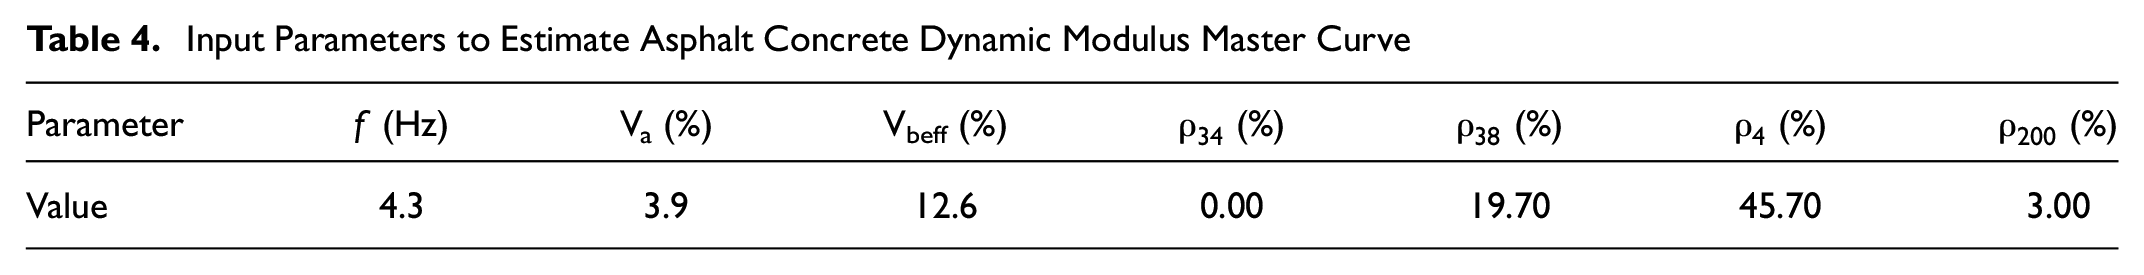
). The binder was a PG 70-28J, and the mix binder content was 5.2%. The percentage air voids of the mix were found to be 3.9% and the voids in mineral aggregate (VMA) were 16.5%. The original binder viscosity at 77ºC was calculated as 0.93 cPoise. A summary of the input required to calculate the dynamic modulus of the mix is presented in Table 4. In this table, f is the loading rate, Va is the air void content, Vbeff is the effective binder content, and
Input Parameters to Estimate Asphalt Concrete Dynamic Modulus Master Curve
FAARFIELD Design
The hot mix asphalt standard material in FAARFIELD is the P-401/403. This material has a fixed modulus value pre-set in the program of 1,379 MPa (i.e., 200,000 pounds per square inch (psi)). The manual affirms that this modulus was conservatively chosen and corresponds to a pavement temperature of approximately 32°C ( 24 ), therefore, the software considers that the pavement stiffness would perform as it was under 32°C all year long. Therefore, the modified Witczak model was used to calculate a modulus that would be more coherent with the AC described in the previous section. This was achieved using the mix gradation parameters, PG, initial air voids, effective asphalt content, aircraft characteristics such as tire pressure, weight and speed, and lastly, temperature. The resulting modulus of the hot mix asphalt at 32°C was therefore found to be 1,721 MPa, which is 25% higher than the standard AC stiffness used in FAARFIELD.
The required data for the design in FAARFIELD consists of the soil resilient modulus or CBR, the layer materials, and traffic, all of which were defined in the previous sections. Table 5 presents the thickness of the pavement layers for a design life of 20 years, as well as the modulus and Poisson ratio attributed in FAARFIELD.
Pavement Design by FAARFIELD
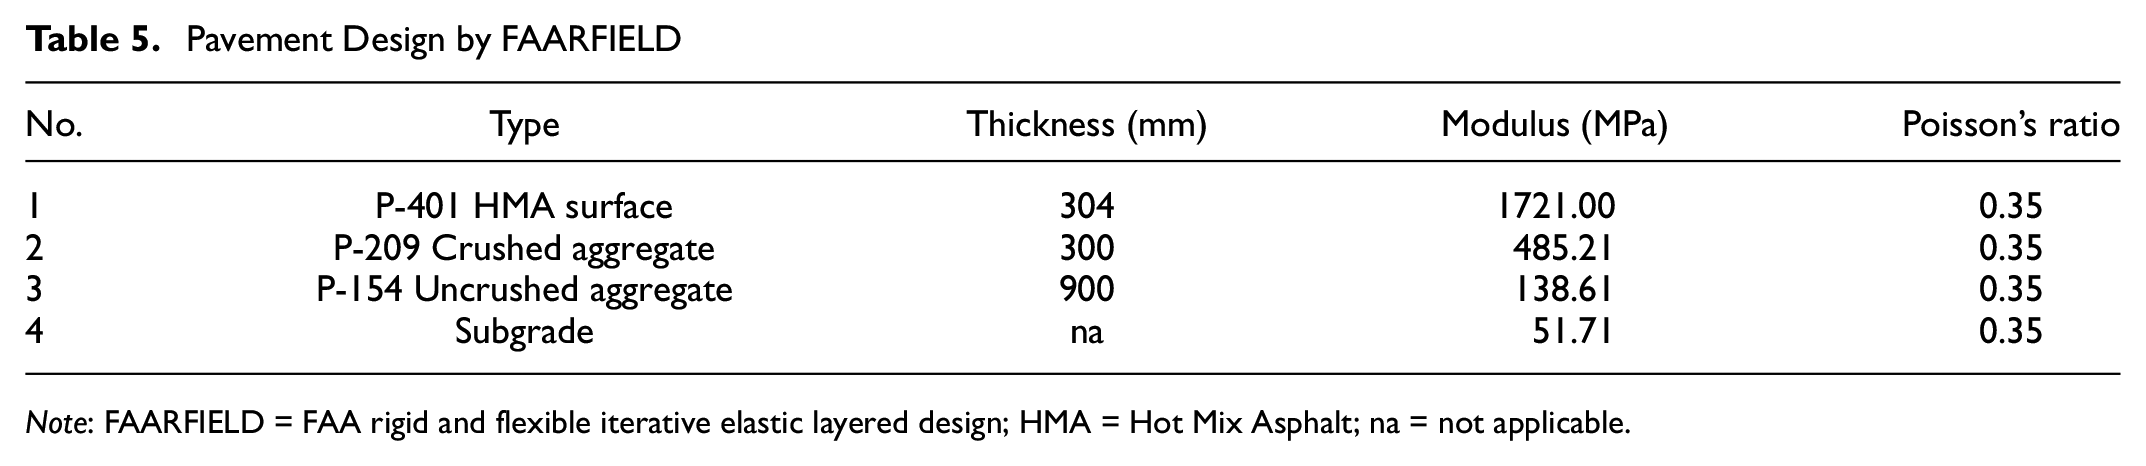
Note: FAARFIELD = FAA rigid and flexible iterative elastic layered design; HMA = Hot Mix Asphalt; na = not applicable.
The pavement design in FAARFIELD shows the need for a more robust structure than that currently in place, since when maintaining the base and sub-base layer thickness constant, the AC was 179 mm thicker than the present layer. The CDF results demonstrate that the B777-300 ER airplane contributes about 99% of the rutting damage, while the B787-900 contributed 1%, and the rest of the mix made a negligible contribution to the rutting damage. Table 6 presents the cumulative rutting and fatigue CDF of the aircraft fleet mix from FAARFIELD, and its respective pass to coverage ratio (the inverse of C/P).
Cumulative CDF and P/C Ratio From FAARFIELD
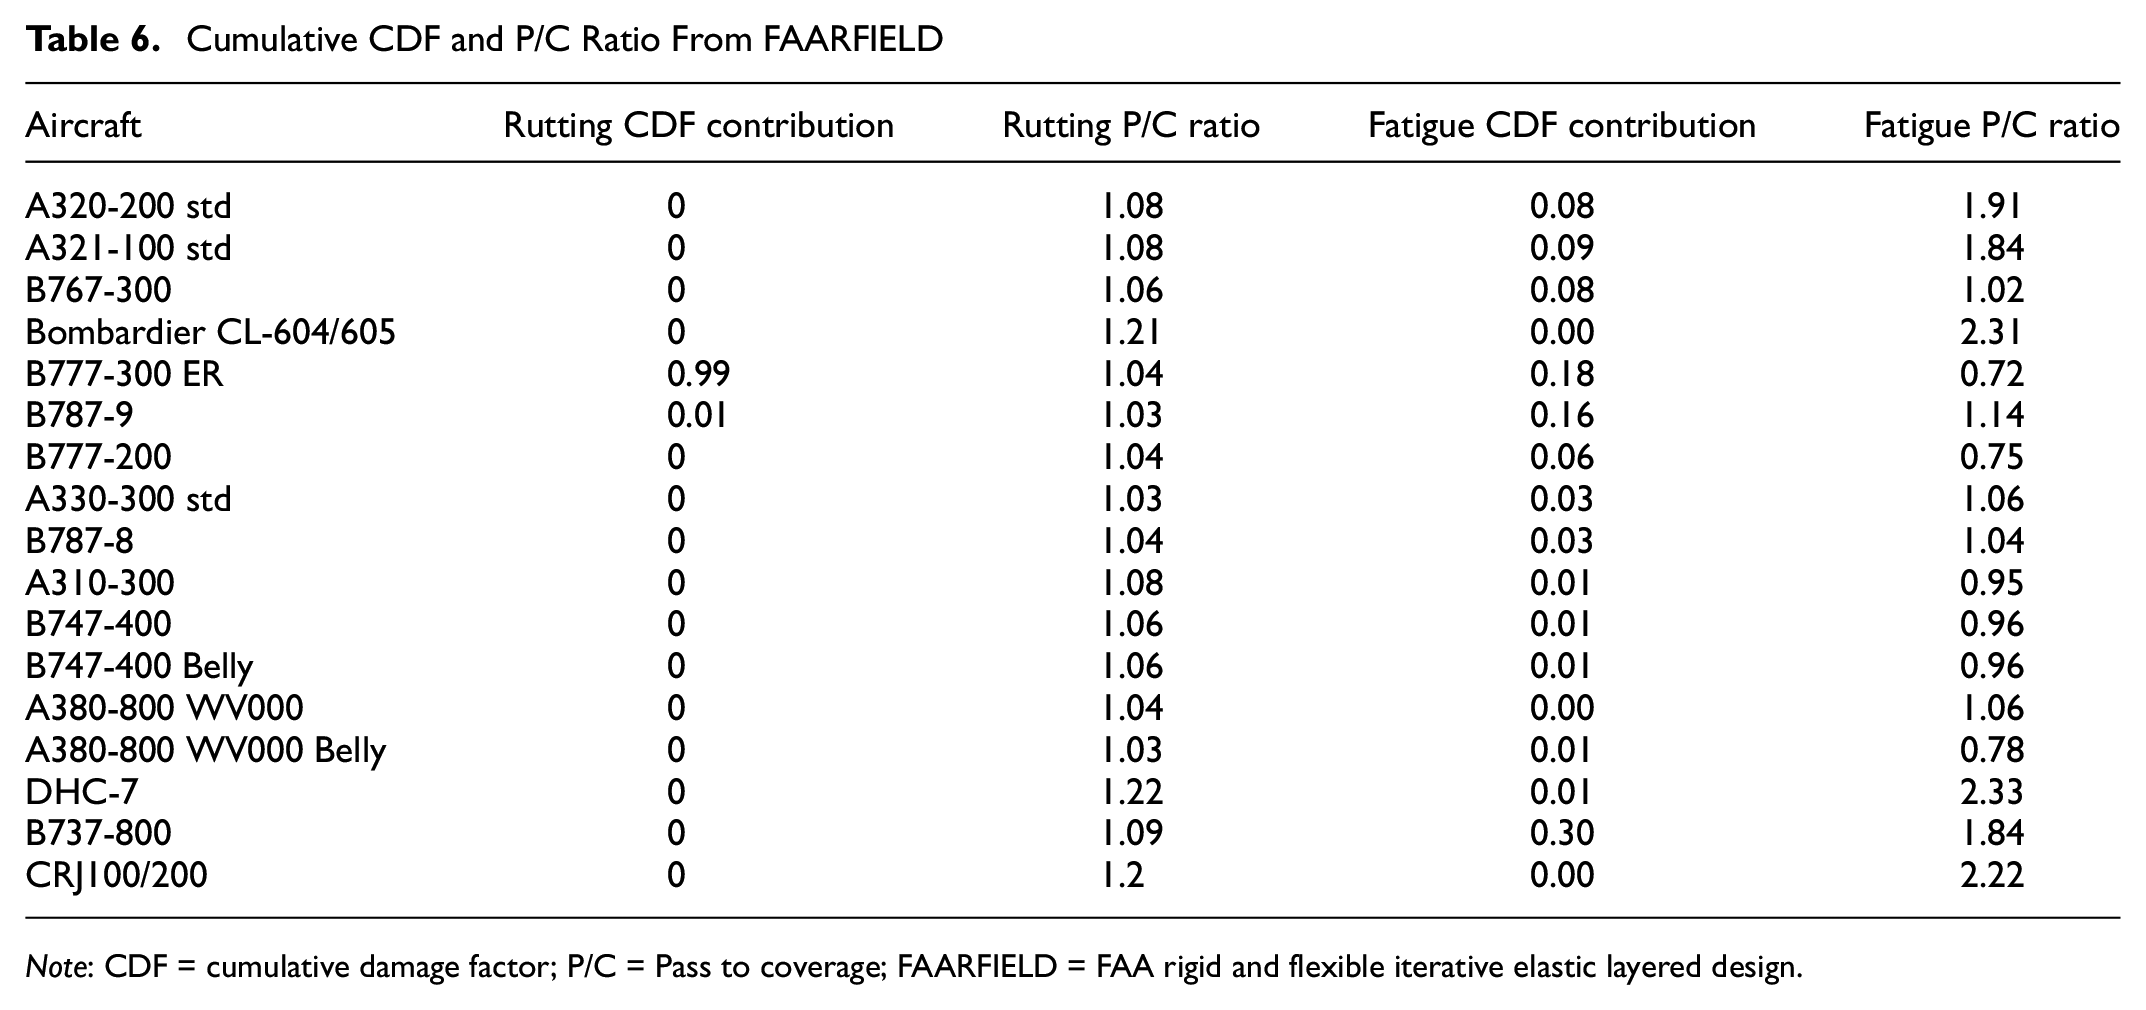
Note: CDF = cumulative damage factor; P/C = Pass to coverage; FAARFIELD = FAA rigid and flexible iterative elastic layered design.
Validation of Python Codes
The equations described in the methodology section to calculate rutting and fatigue damage were implemented in Python codes, developed by the authors. To verify the damage codes, the authors calculated the CDF caused by the B777-300 ER under the same circumstances considered in FAARFIELD. The first part of the verification process was to certify that the P/C values for the B777-300 ER were the same as those presented in Table 6 (i.e., 1.04 for rutting and 0.72 for fatigue). To that end, the aircraft wander was defined as 178.8 cm, the lateral distance from the centerline of the runway to the centerline between the tires was considered to be 548.5 cm, and other aircraft characteristics were defined according to Table 3, which resulted in P/C values of 1.036 and 0.716 for rutting and fatigue, respectively. The P/C values resulting from the Python codes, when rounded, are essentially equal to FAARFIELD.
The same structural conditions defined in Table 5 were used to obtain stresses and strains through KENLAYER (circular tire contact) and ABAQUS (circular and elliptical tire contacts). The model in ABAQUS was built using an 8 cm mesh near the loads and a 30 cm mesh in the rest of the model; the contact between layers was defined as rough, and the model dimensions were 12 × 12 m wide, by 13.504 m deep (the subgrade being 12 m deep). A boundary condition was defined at the lateral walls of the simulated pavement elements which prevents it from moving in the horizontal direction but leaves it free to move in the vertical direction. The bottom of the subgrade element was constrained from any movement. This type of boundary condition is usually imposed to represent the confinement of the soil. Figure 3 shows the subgrade divided in half for a better perspective (ZY view), with model contours/lines in deformed shape, colors representing the compressive strains scale.
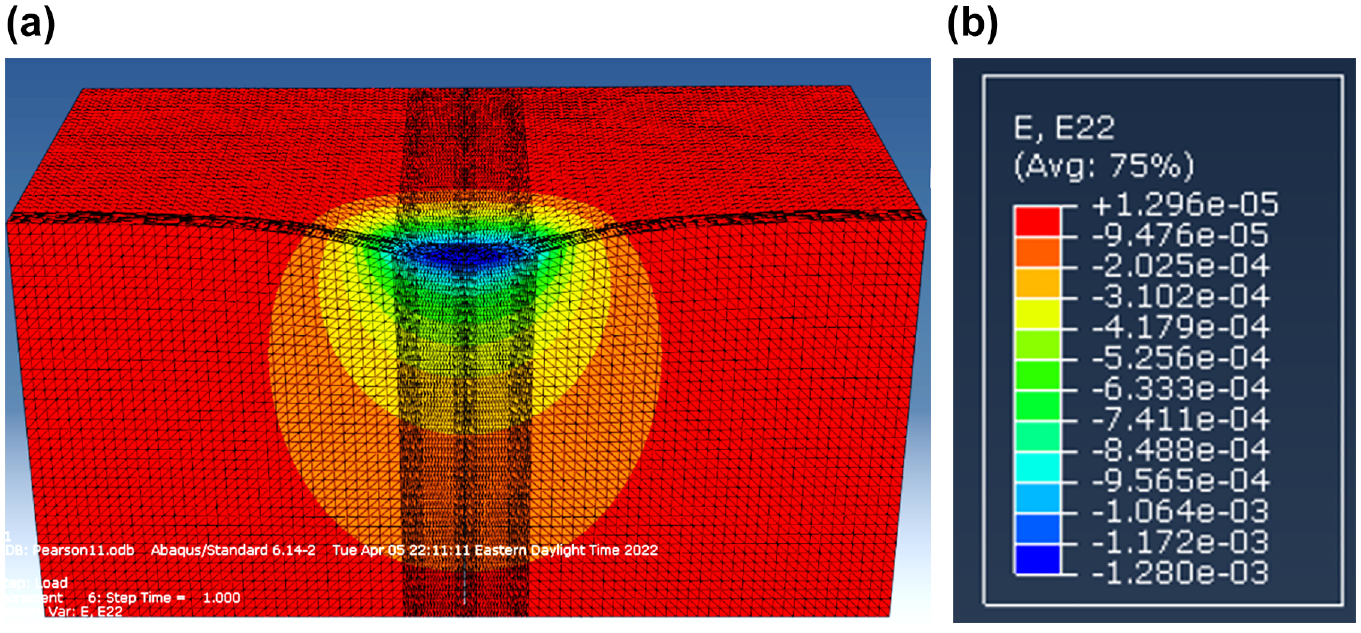
Compressive strains at subgrade in ABAQUS: (a) model contours and (b) compressive strains scale.
The results of maximum compressive strains at the top of the subgrade layer and maximum tensile strains at the bottom of the AC layer for both ABAQUS and KENLAYER are presented in Table 7.
Pavement Responses
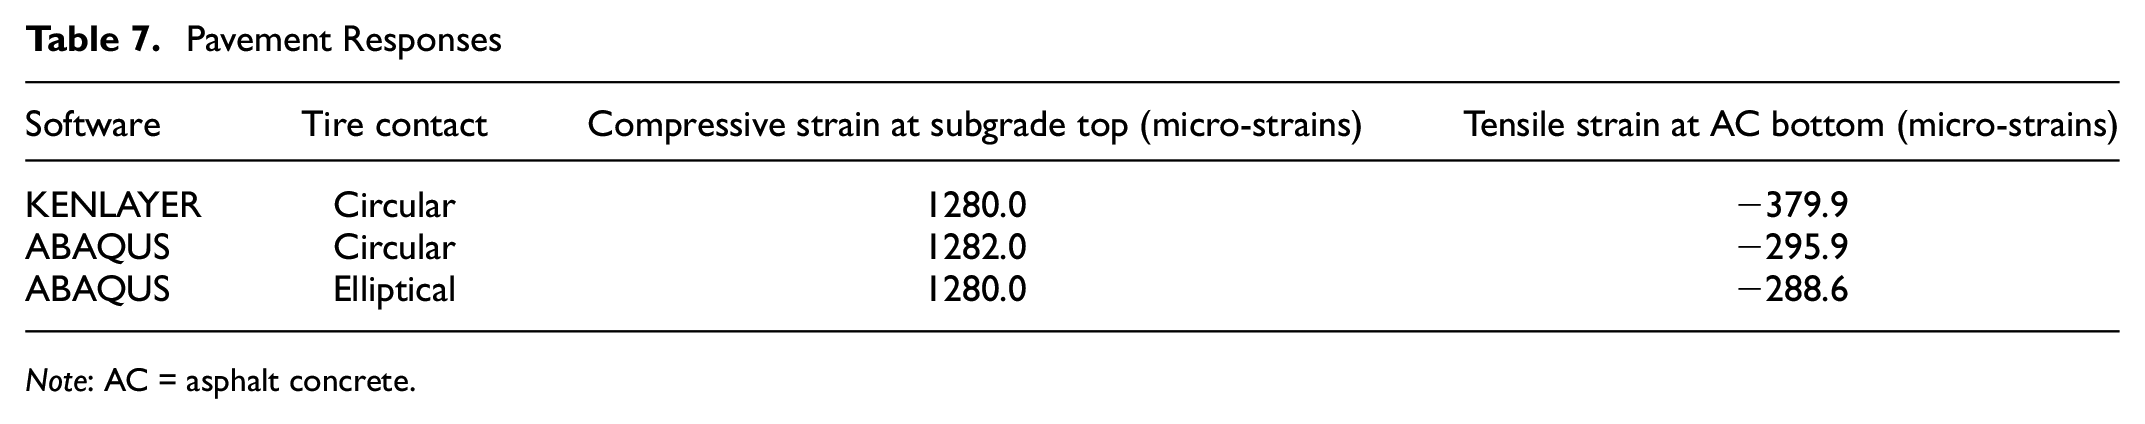
Note: AC = asphalt concrete.
The results for compressive strains at the top of the subgrade layer were very similar for both KENLAYER and ABAQUS, with almost no difference between the strain for circular and elliptical contact areas (0.15% difference). However, the tensile strains at the bottom of the AC layer exhibited a considerable difference of about 28% between the two models with circular contact area from KENLAYER and ABAQUS. The difference in tensile strain values between the circular and elliptical footprints in ABAQUS was about 2.5%.
FAARFIELD uses LED to obtain the pavement critical strains. Generally, when LED is used for flexible pavement design, it is assumed that each tire has a circular contact area, because of the axisymmetric nature of the LED. FAARFIELD, however, considers the contact area to be elliptical. Most of the existing LED-based programs only allow for modeling a circular contact area, and therefore KENLAYER was used in this study. The critical pavement responses were then used to estimate the number of coverages to failure. The CDF was calculated based on 68,027 B777-300 ER departures in a 20-year design period. The results of the cumulative rutting damage over the design period can be seen in Figure 4.
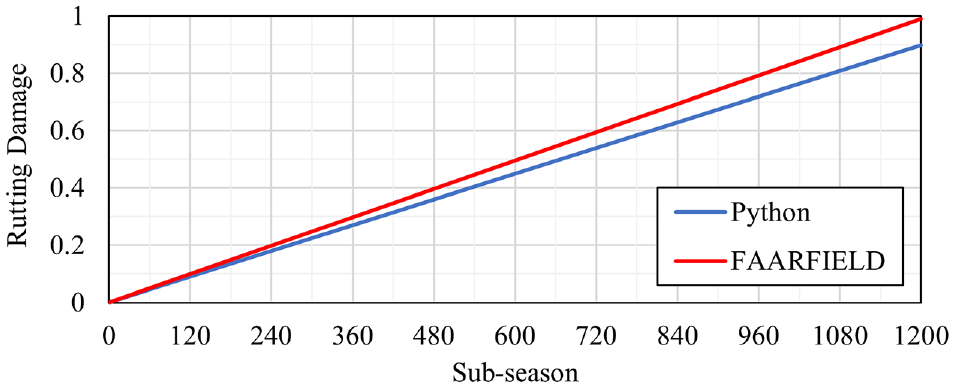
Rutting damage at validation phase.
As previously mentioned, FAARFIELD attributed a cumulative damage of 0.99 for the B777-300 ER over the design period. The calculations implemented in Python resulted in a damage of 0.90 for the same aircraft, that is, a difference of −9%. The authors attribute the difference in the results to the tire contact shape, which was assumed to be circular instead of elliptical. Knowing the limitations in duplicating FAARFIELD procedures, the codes implemented in Python were considered satisfactory.
Climate Analysis
As temperature and saturation changes through the year, so does the stiffness of the materials. The first step in performing an analysis that considers climate variations throughout the year is to estimate the pavement temperature gradient along the pavement depth. To that end, hourly climate data from the past 10 years was retrieved from the National Solar Radiation Database, for the years 2010 through 2019, and averaged. The data obtained included the air temperature, wind speed, solar radiance and albedo at the Toronto Pearson Airport site. To determine the pavement temperature gradient, the finite control volume method was used through TEMPS.
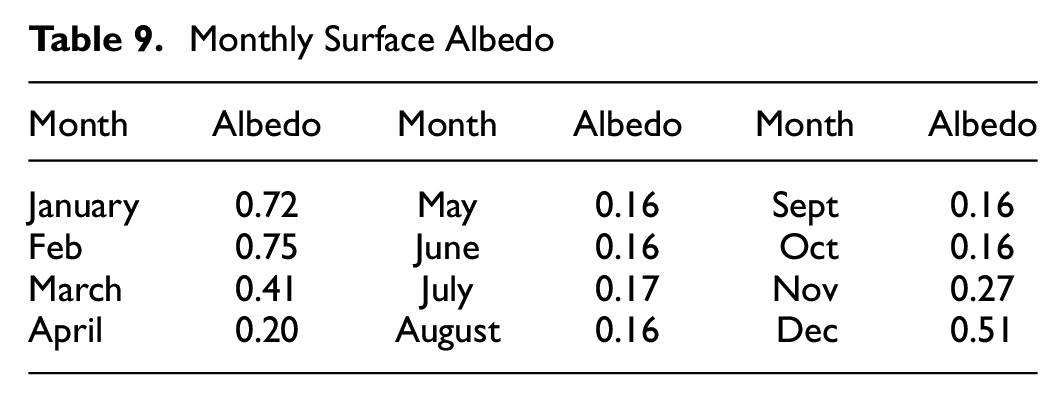
The material properties necessary to calculate the pavement temperature profile include the conductivity and density, which were extracted from the existing literature ( 25 ), as well as the material colors and specific heat capacity, which were defined according to typical values suggested by the TEMPS software. The pavement material properties are presented in Table 8. The surface albedo was obtained through the NSRDB and averaged per month, as presented in Table 9. Lastly, emissivity and absorption were both considered to be 0.93.
Material Properties
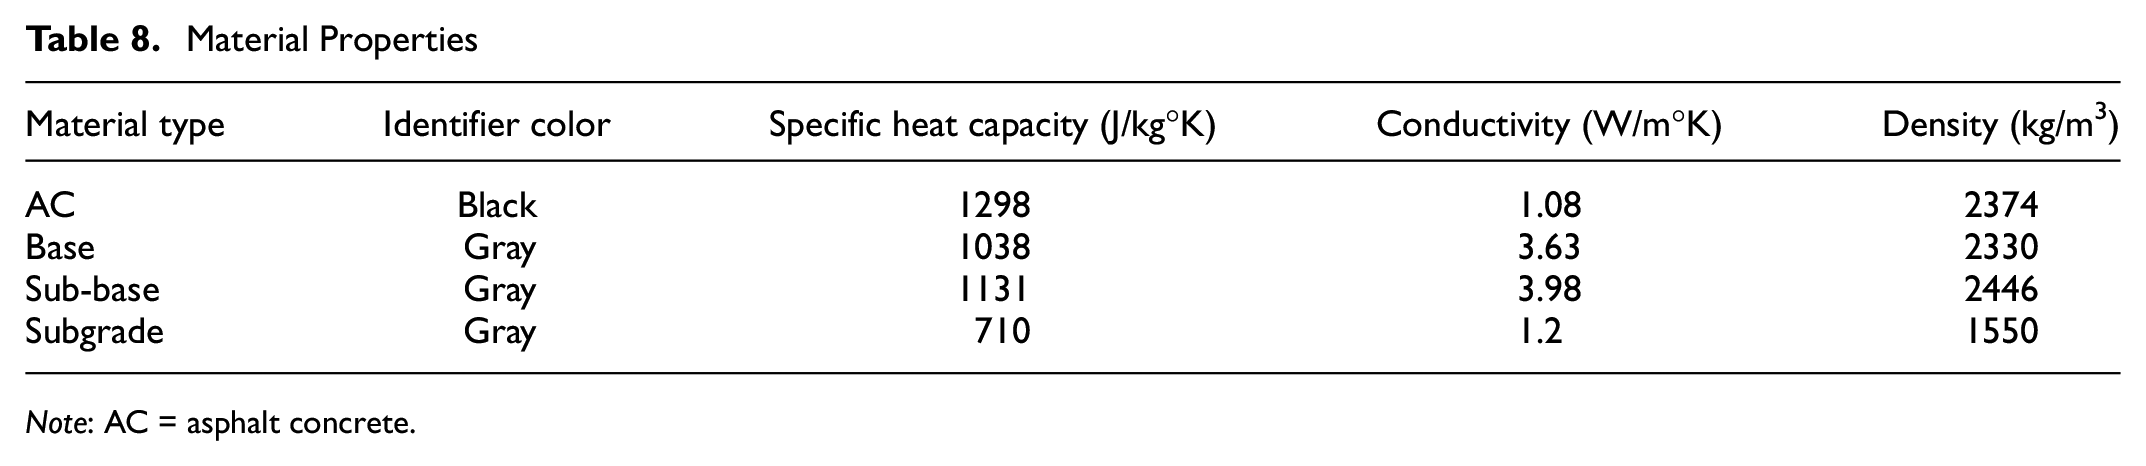
Note: AC = asphalt concrete.
Monthly Surface Albedo
The pavement temperature gradient was generated based on a mesh of 1 cm. The results from TEMPS are presented in Figure 5.
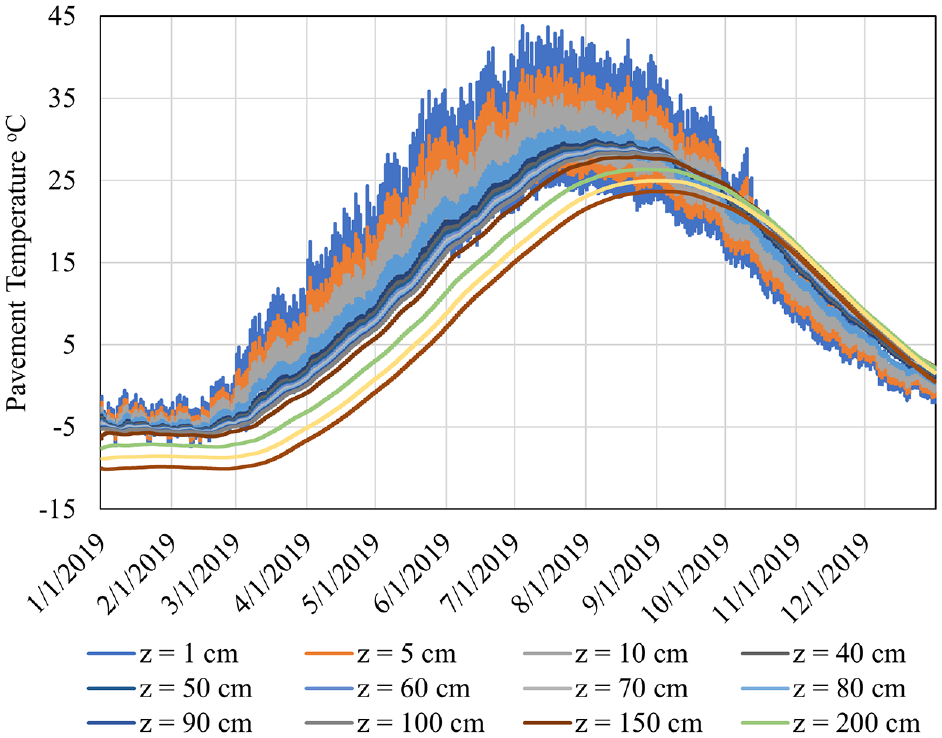
Pavement temperature profile from temperature estimate model for pavement structures (TEMPS).
Figure 5 indicates that the maximum temperature at a depth of 1 cm is 44°C and that the temperature at deeper layers changes at a lower rate than that at the upper layers. The AC temperature was used to estimate the resilient modulus of the AC through the year using the modified Witczak model (13). The pavement temperature profile was then used to obtain the number of hours elapsed since thawing started (
Resilient Modulus (
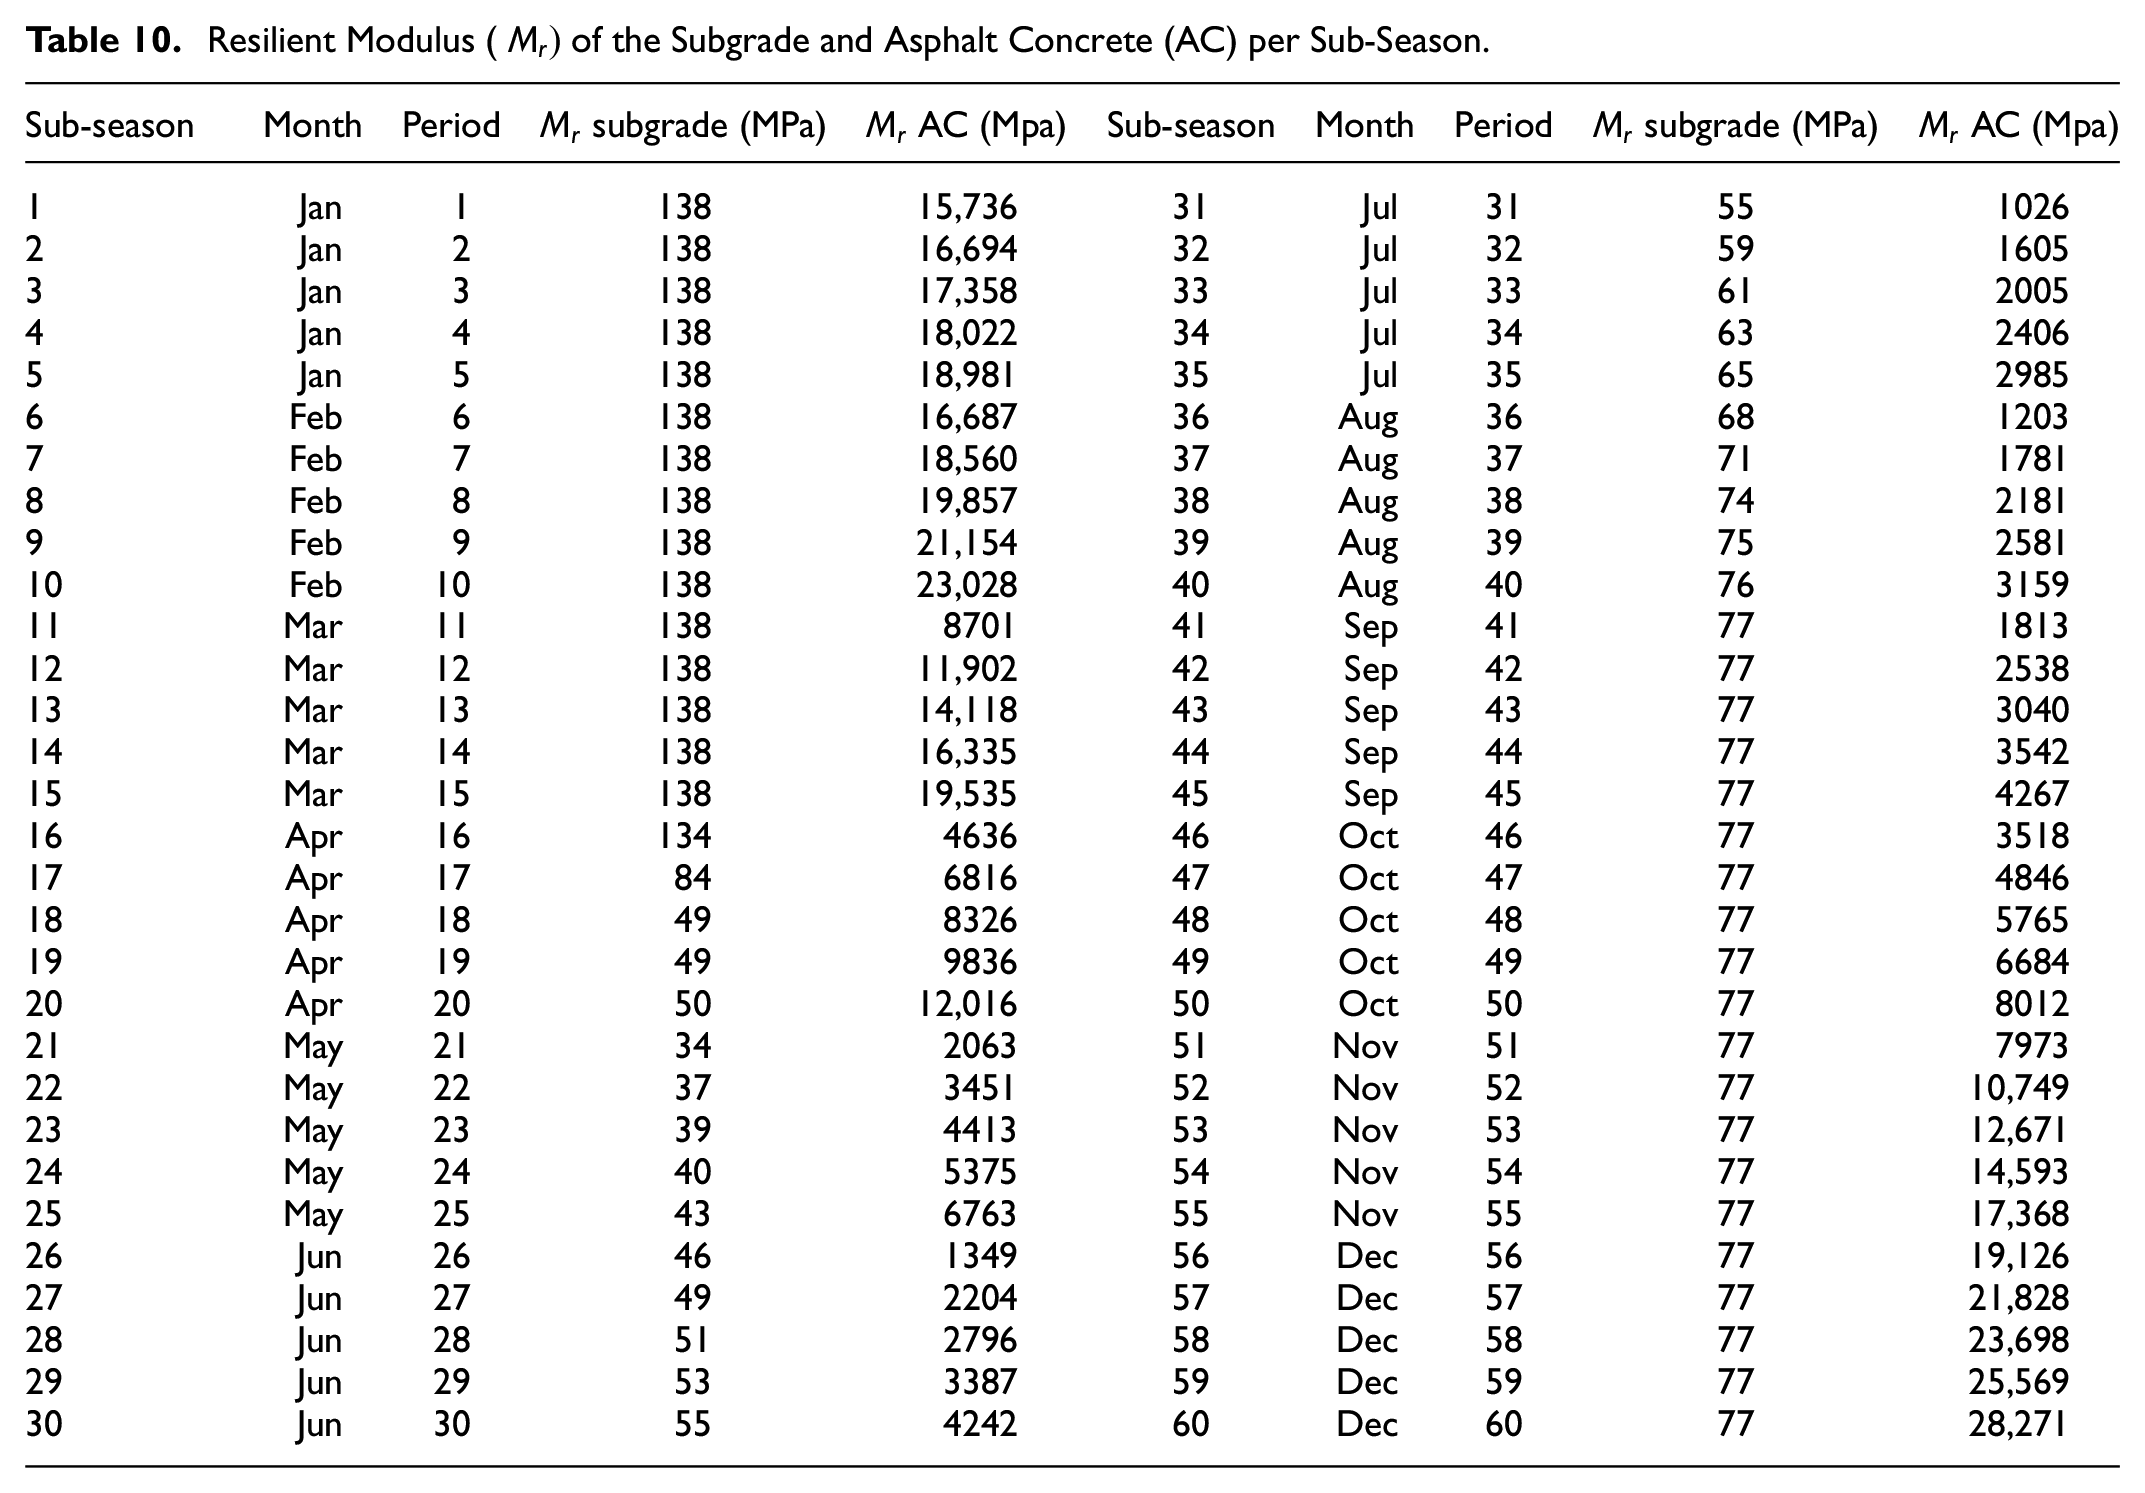
At this point, the critical pavement responses could be calculated through KENLAYER, considering the change in the resilient modulus of the AC and subgrade layers at each sub-season. The responses enabled the calculation of the number of coverages to failure, and consequently the estimation of the cumulative rutting and fatigue damages. The same steps proposed in this section were followed to evaluate five climate scenarios including: (1) current climate; (2) temperature increase; (3) lower matric suction; (4) flooding event 1, and (5) flooding event 2.
Climate Scenarios
Current Climate
The current climate scenario considers the hourly temperature records from 2010 to 2019, and the matric suction as 293 kPa. A comparison of the rutting and fatigue damage caused by a B777-300 ER is presented at Figures 6 and 7, considering the proposed methodology versus FAARFIELD. Figures 6a and 7a illustrate the damage at the end of one year while Figures 6b and 7b show the estimated damage at the end of 20 years.
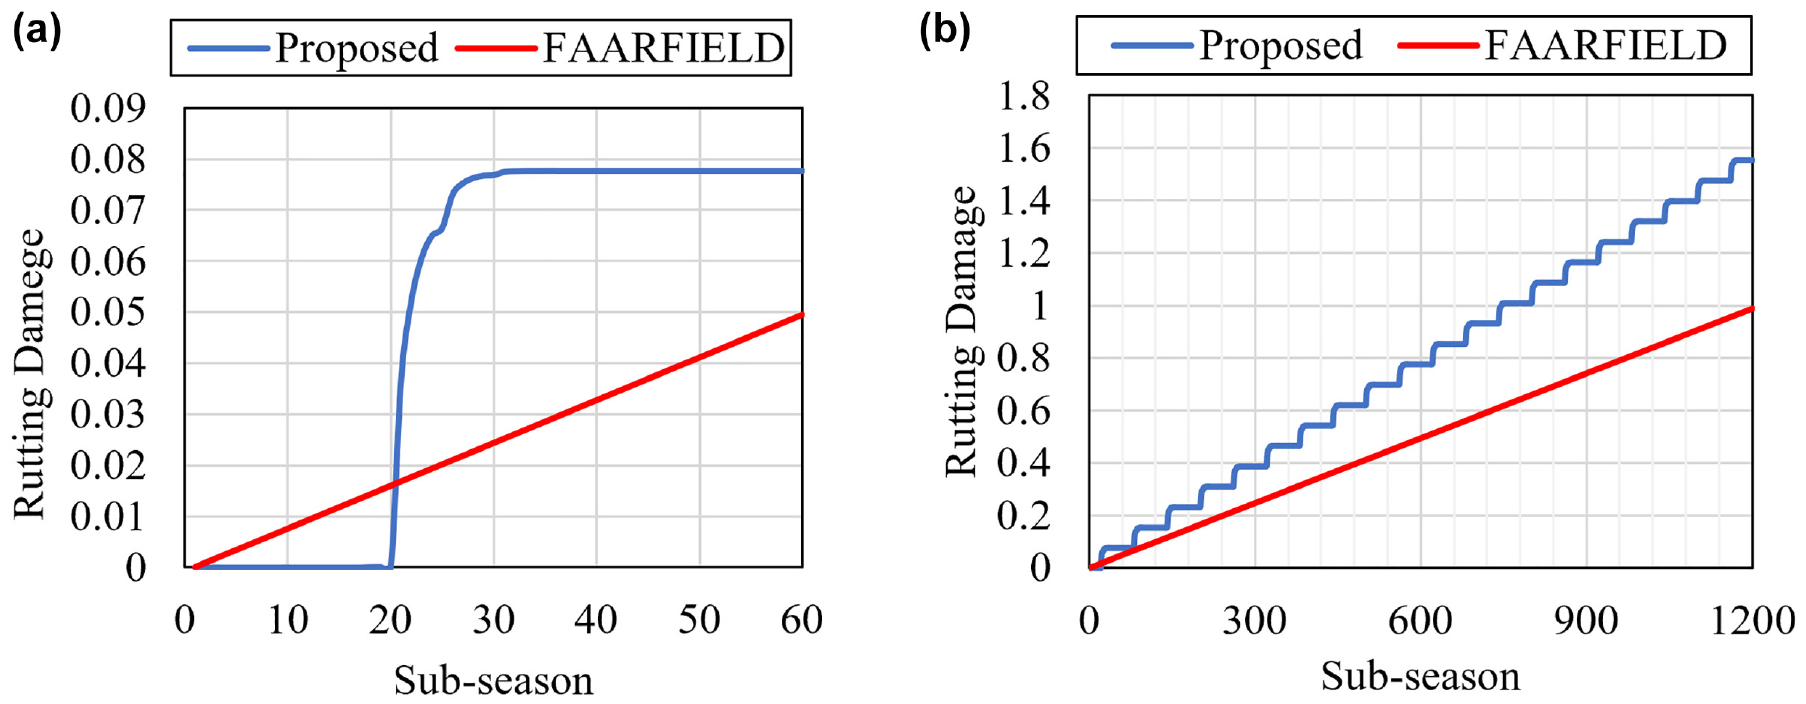
Cumulative rutting damage under current climate scenario: (a) over one year and (b) over twenty years.
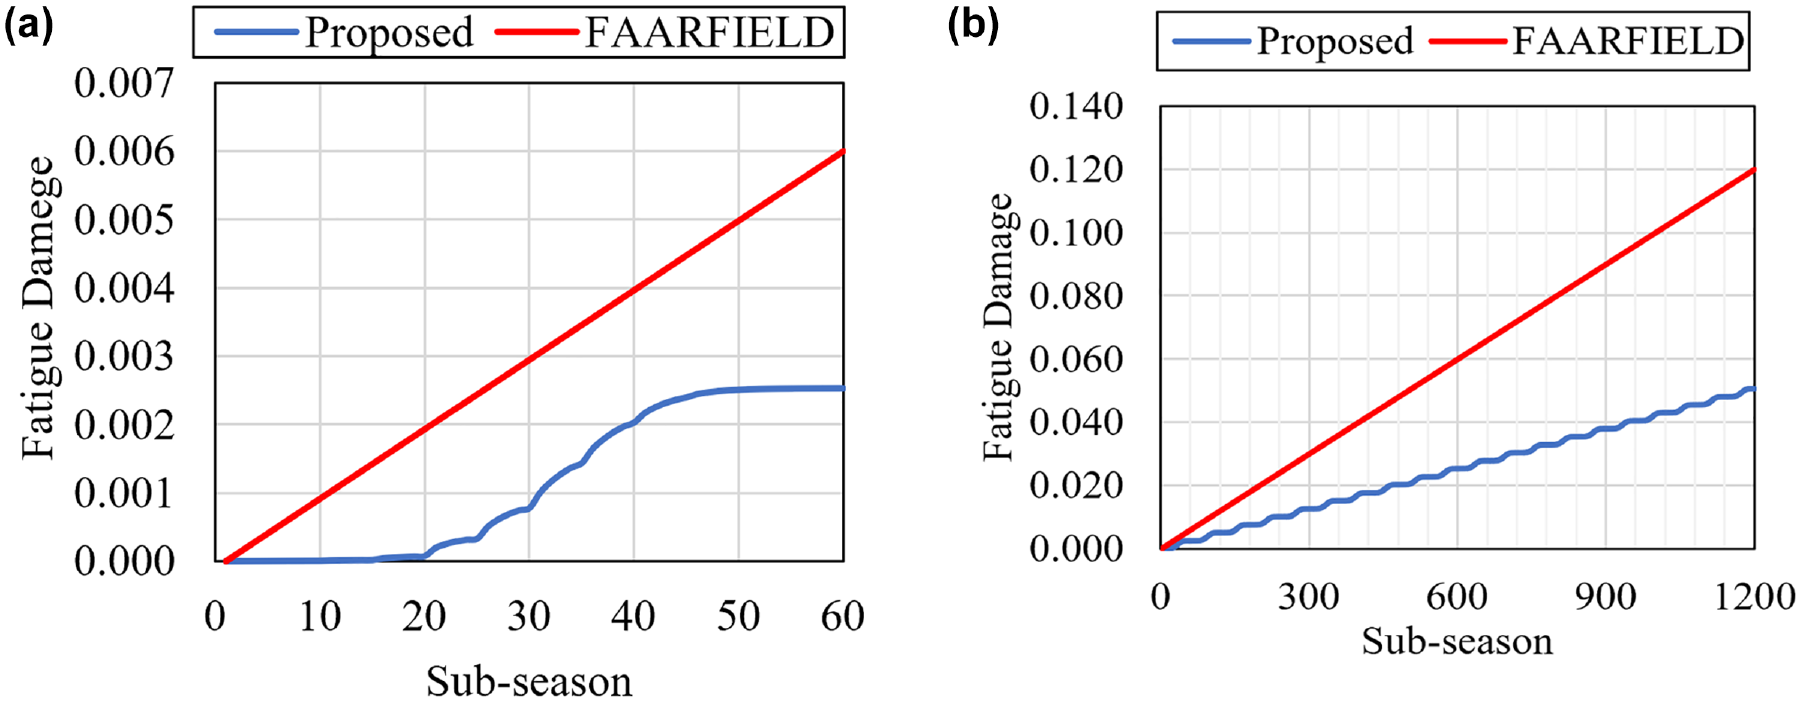
Cumulative fatigue damage under current climate scenario: (a) over one year and (b) over twenty years.
It is possible to notice from Figure 6a that the most significant rutting damage occurs during sub-seasons 20 to 30, which are equivalent to the months of May and June. The total damage caused by the B777-300 ER over the 20-year period is 1.55, compared to 0.99 from FAARFIELD, therefore, the rutting damage predicted from the proposed methodology is 57% higher than the predicted damage from FAARFIELD. From the results of Figure 6b it is suggested that current climate assumptions result in a shorter service life than FAARFIELD by about 7 years because of the increased rutting damage.
In relation to the fatigue damage, Figure 7a shows that the most significant damage occurs during sub-seasons 20 to 45, which are equivalent to the months of May through to the middle of September. Figure 7b shows that the total fatigue damage estimated through the proposed methodology is lower than that proposed by FAARFIELD; the software indicates that the total fatigue damage caused by the B777-300 ER over the 20-year period is 0.12, while in the proposed methodology it is 0.05068. This can be mainly attributed to two reasons: first, the amount of damage during the cooler seasons is very low, considering that the pavement layers are frozen and, therefore, very stiff during this period; second, the proposed methodology was based on the specific characteristics of the asphalt mix, such as the percentage of air voids and the effective asphalt content, which are superior to the default values considered in FAARFIELD, lowering the total fatigue damage.
Temperature Increase
There are a few mathematical methods to project future weather, among which the morphing method is one of the most well-known approaches. A web-based application called “Weather Morph: Climate Change Weather File Generator” can be used to generate hourly future weather data for many locations across the world considering four gas emission scenarios in three time-horizons: 2020s, 2050s and 2080s ( 26 ). The temperature increase scenario of this research used data available at http://139.62.210.131/weatherGen/, under gas emission scenario RCP 8.5 in the year 2050. The matric suction was set at 293 kPa. Combining the proposed methodology with this hourly dataset, a comparison of the rutting and fatigue damage caused by the B777-300 ER can be made, which is presented in Figures 8 and 9, which show the proposed methodology versus FAARFIELD.
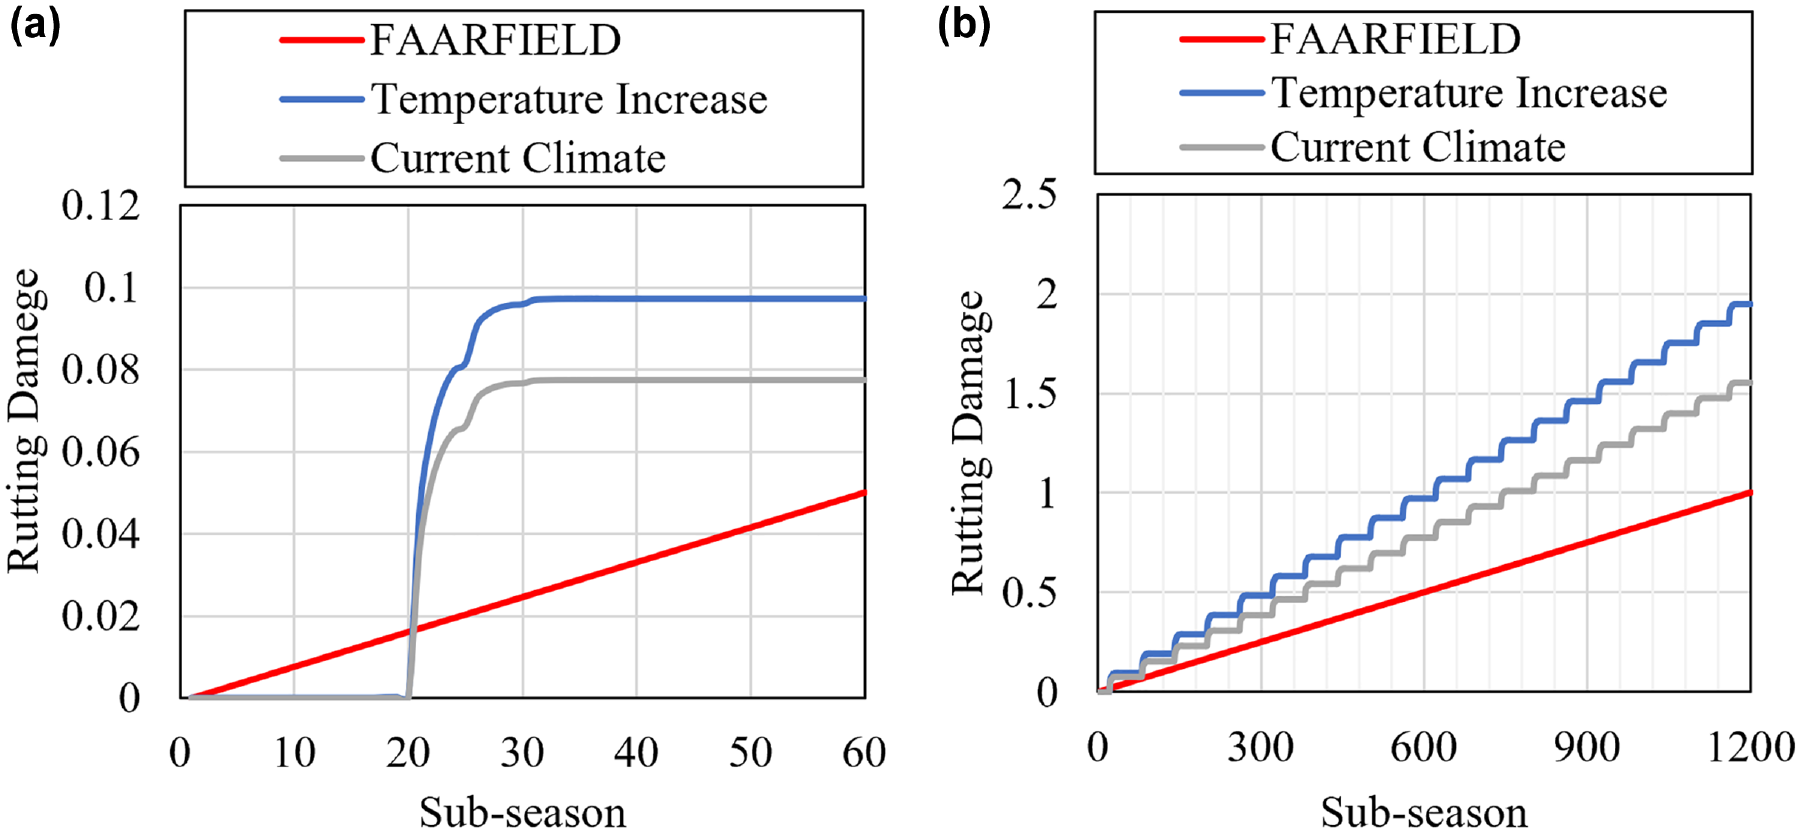
Cumulative rutting damage under temperature increase scenario: (a) over one year and (b) over twenty years.
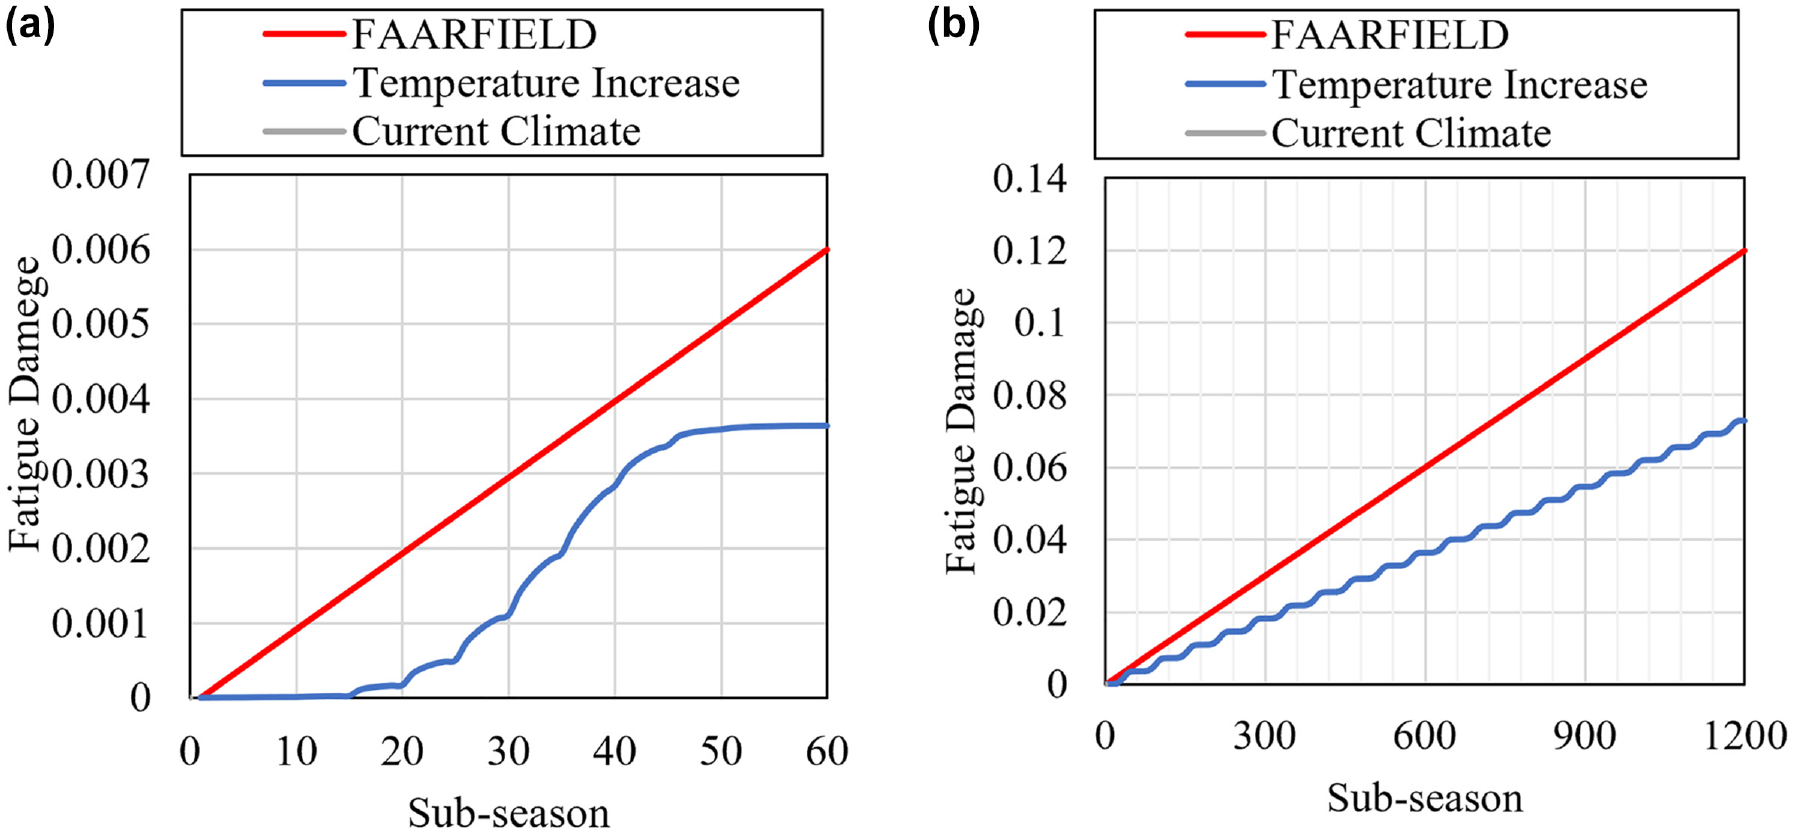
Cumulative fatigue damage under temperature increase scenario: (a) over one year and (b) over twenty years.
As indicated by Figure 8, the total cumulative rutting damage at the end of the 20 years would be 1.95 under the temperature increase scenario, as compared to a damage value of 1.55 from the current climate scenario using the proposed methodology, or 0.99 according to the traditional FAARFIELD method. Therefore, when considering the potential increase in temperature because of climate change, rutting damage can be 25% higher than the current climate scenario, and 97% higher than the conventional design based on FAARFIELD, which suggests a shortening of the service life of the flexible airfield pavement by about 10 years.
Figure 9b shows that the total fatigue damage under the temperature increase scenario is 0.0723, compared to 0.05068 from the current climate scenario, or 0.12 according to the FAARFIELD method. Even though the total fatigue damage predicted by the proposed methodology is still smaller than FAARFIELD, it increased by 43% compared to the current climate analysis. Therefore, the results from a potential rise in temperature, if not associated with changes in moisture levels or flooding events, will be more critical in relation to fatigue damage.
Lower Matric Suction
Under the lower matric suction scenario, past temperature records were considered to be similar to the current climate scenario, while the matric suction was assumed to be 49 kPa. The matric suction is the soil capillary pressure. The smaller the capillary pressure, the higher the soil’s ability to retain water. Therefore, lower matric suctions will lead to higher degree of saturation in the soil.
The effect of changes in matric suction on the expected pavement damage can be investigated through the use of the proposed methodology based on the adjustment of the modulus values. Results for rutting and fatigue damage, based on B777-300 ER operations are therefore presented in Figures 10 and 11.
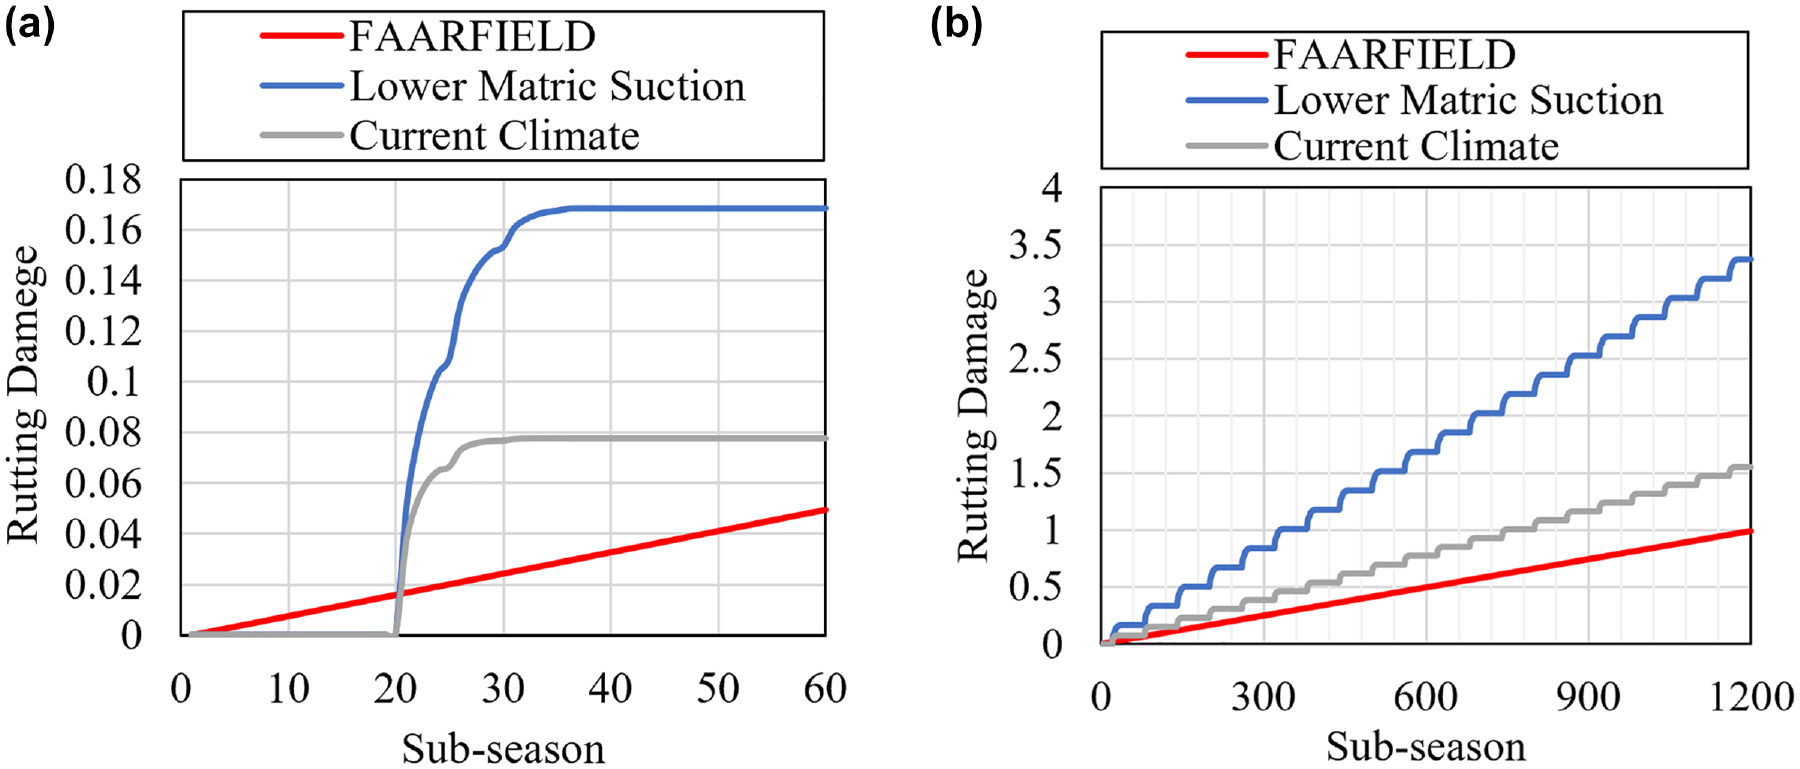
Cumulative rutting damage under lower matric suction scenario: (a) over one year and (b) over twenty years.
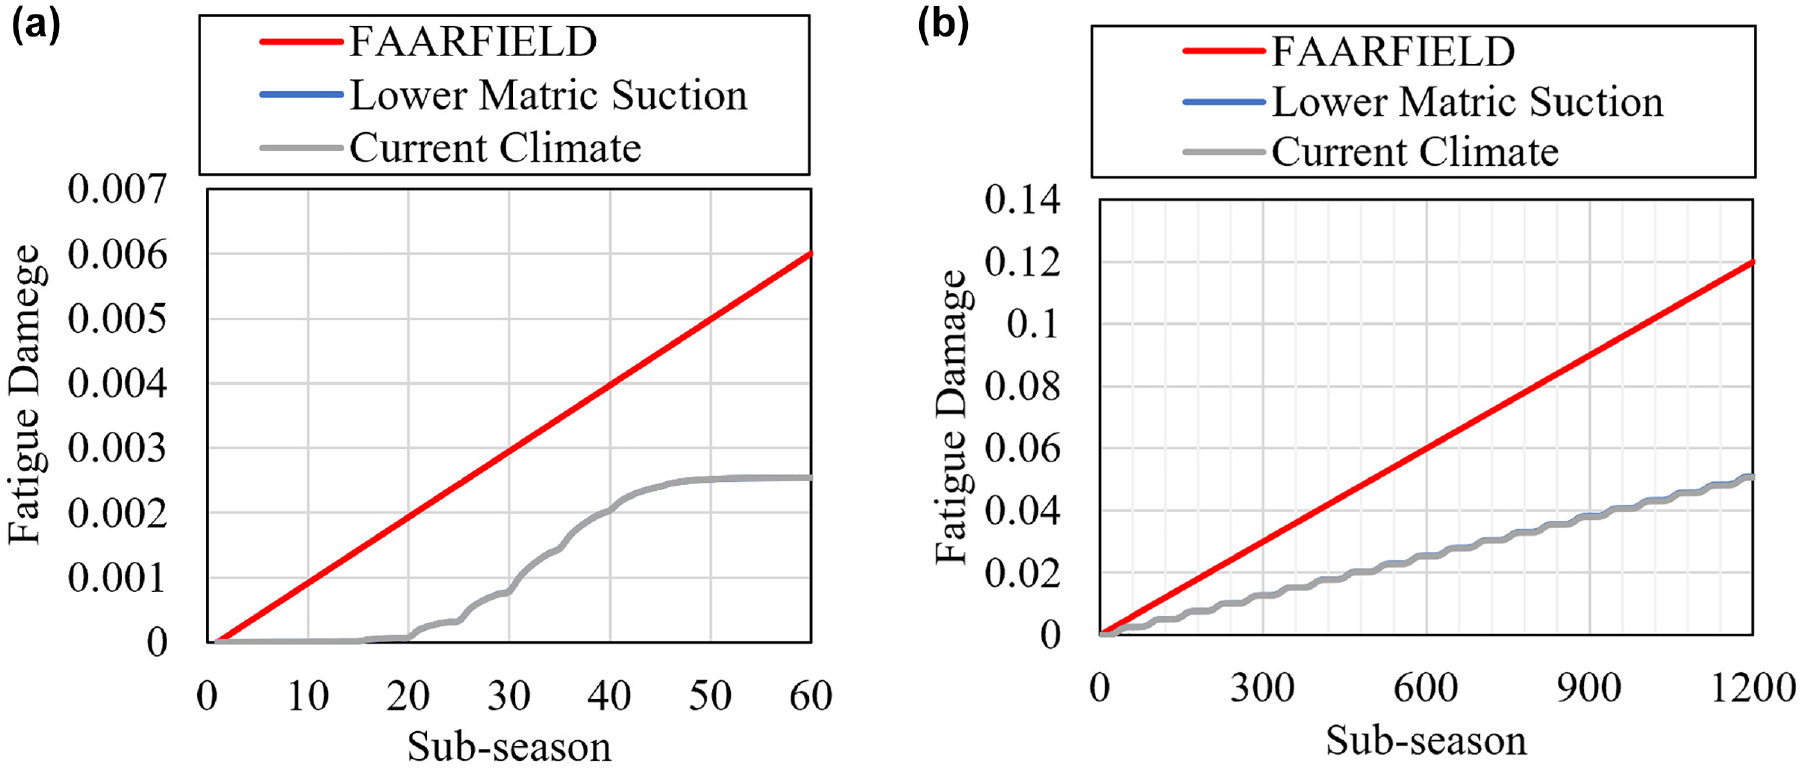
Cumulative fatigue damage under lower matric suction scenario: (a) over one year and (b) over twenty years.
By comparing the results from the previously discussed scenarios and the lower matric suction scenario, as demonstrated by Figures 6a, 8a and 10a, it can be seen that the high damage season was extended when saturation levels were higher. The annual result in Figure 10a shows that high rutting damage levels occur in this case through sub-seasons 20 to 35, which is equivalent to the months of May, June and July, that is, one month more than that predicted by the current climate analysis. Figure 10b shows that the total rutting damage at the end of 20 years in this case was calculated to be 3.37, compared to 1.55 from the current climate scenario and 0.99 from FAARFIELD. It can therefore be concluded that increasing the subgrade soil saturation level because of the lowering of the matric suction results in an increase in rutting damage of 117% when compared to the current climate scenario, and 240% when compared to the traditional FAARFIELD analysis, resulting in a pavement service life of only 6 years.
The fatigue results from Figure 11, on the other hand, indicate a total fatigue damage of 0.05074, which is less than 1% higher than the results from the current climate scenario (i.e., 0.05068). However, it is still much lower than the damage of 0.12 predicted by FAARFIELD. Therefore, fatigue damage was not significantly influenced by the lowered subgrade soil stiffness because of the lowered matric suction.
Flooding Events
It was demonstrated in the lower matric suction scenario that changes in the saturation level can affect the total predicted damage over the service life of flexible airfield pavements. Therefore, under this scenario the effect of an extreme event such as flooding is further evaluated. This analysis considered the additional damage from a flooding event, by simulating a condition in which the subgrade would be completely saturated because of intense precipitation. It is reasonable to assume that this hypothetical scenario occurs in the summer, starting on August 13th.
In the occasion of a flooding event, the soil would be completely saturated, and the matric suction would equal zero (0). As time goes by, the soil would drain, and the matric suction would slowly recover to the equilibrium level of 293 kPa. To evaluate the effects of the rate at which the soil matric suction recover, over pavement damage after a flooding event, two scenarios were evaluated, one assuming the matric suction increase at 50 kPa/sub-season until it reaches 293 kPa, and another with the matric suction increase at 25 kPa/sub-season.
In Scenario 1, the soil returns to its equilibrium matric suction in 36 days, and in Scenario 2, the equilibrium matric suction is reestablished in 72 days. The results from scenario 1 are presented in Figures 12 and 13.
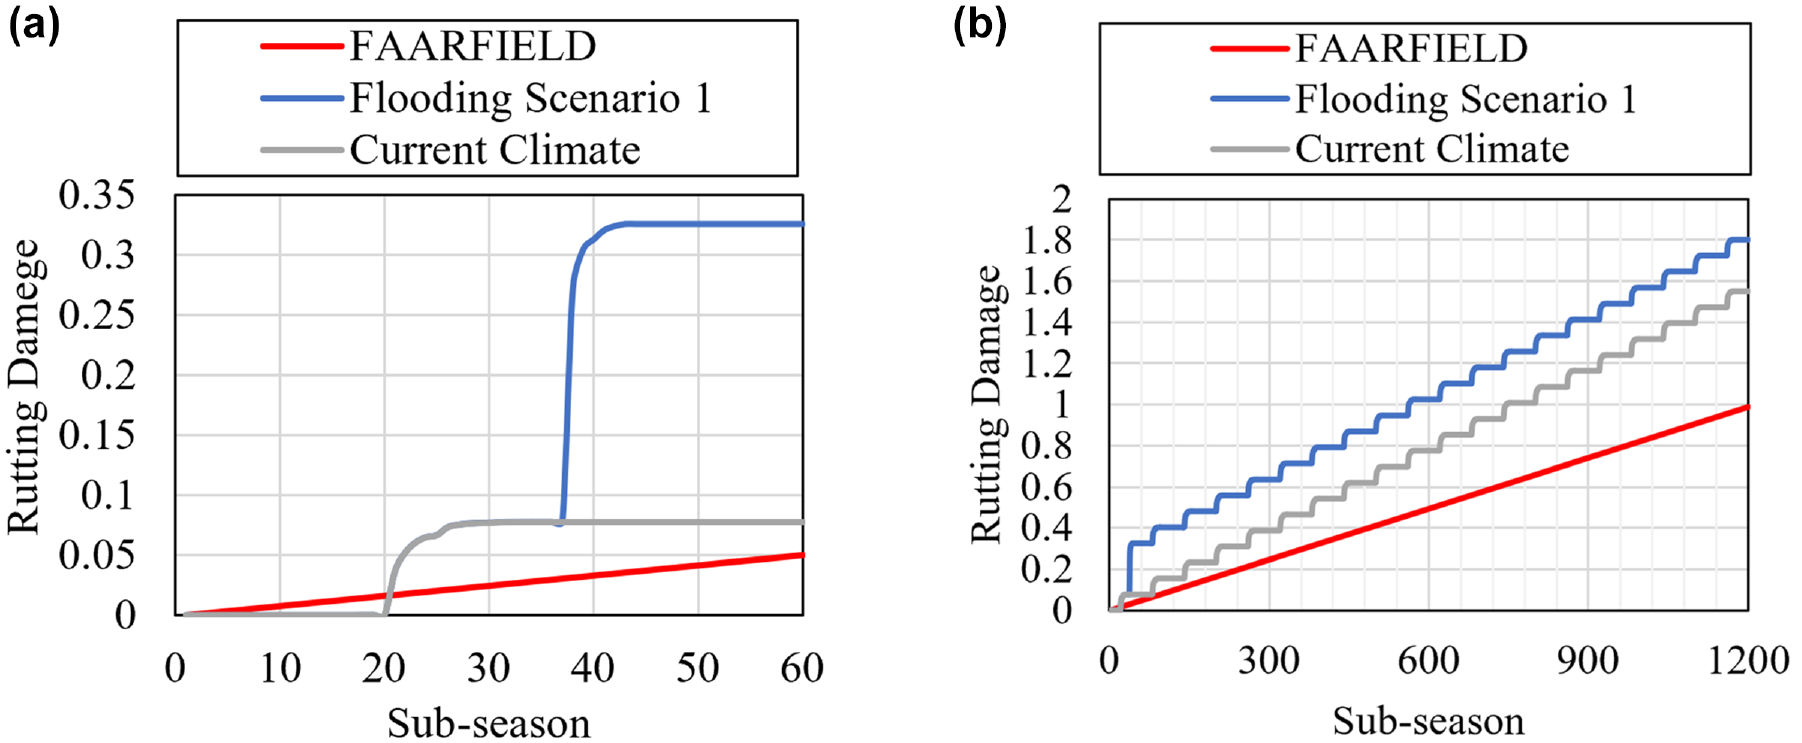
Cumulative rutting damage under flooding scenario 1: (a) over one year and (b) over twenty years.
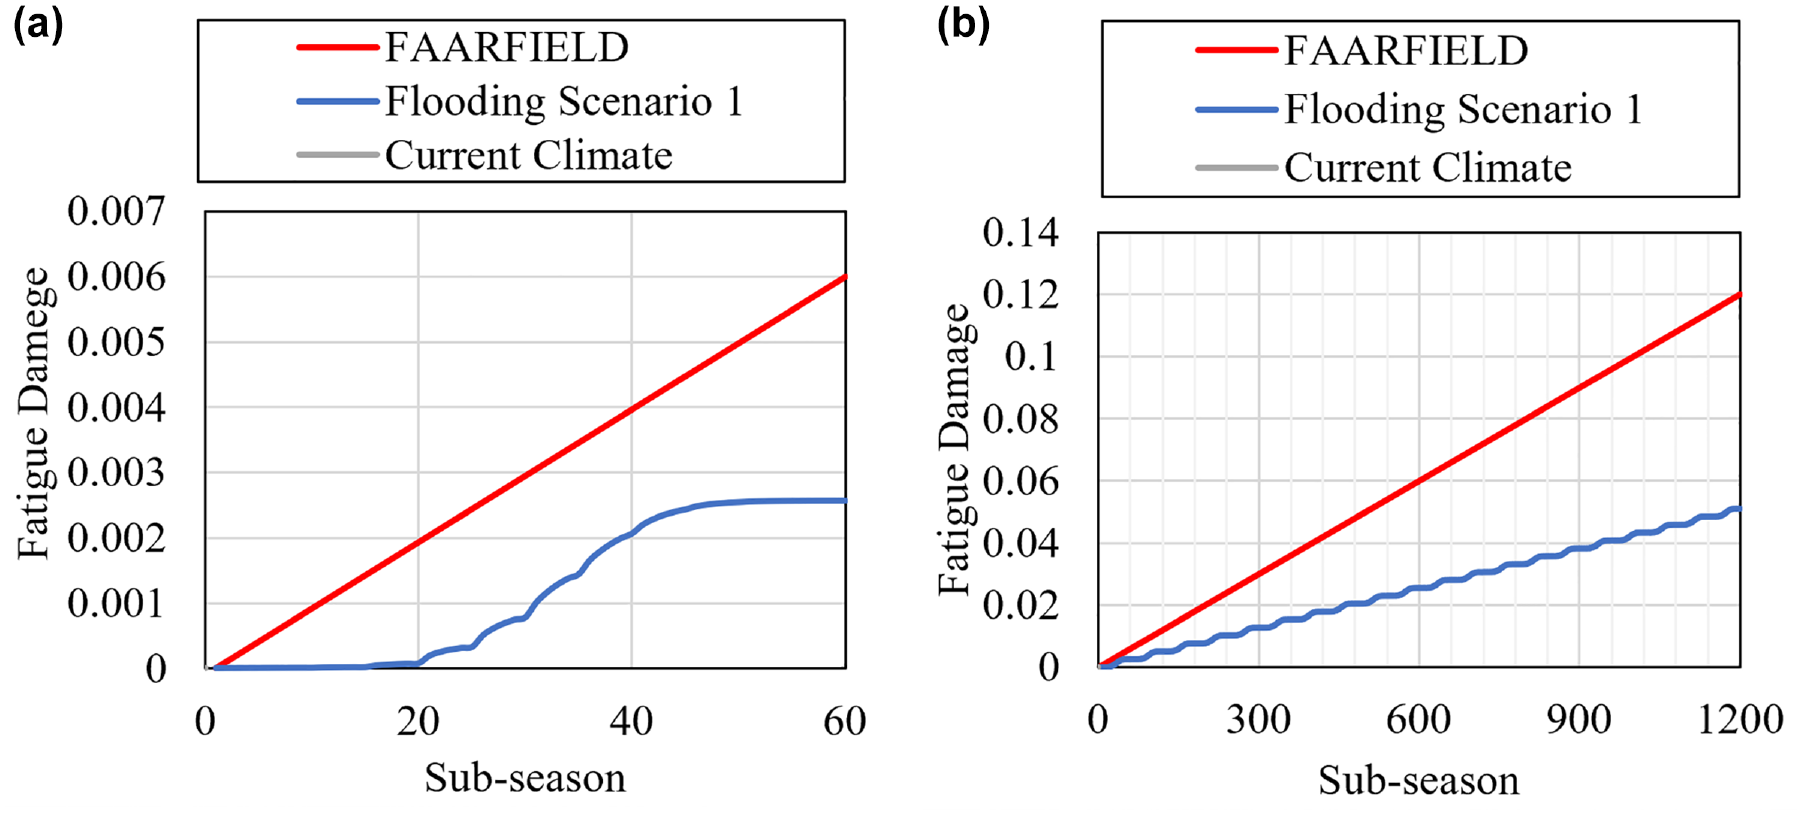
Cumulative fatigue damage under flooding scenario 1: (a) over one year and (b) over twenty years.
The total rutting damage during the year in which flooding scenario 1 happened was found to be equal to 0.3, as presented in Figure 12a, which is equivalent to about 6 years of damage under normal circumstances (CDF = 0.99 over 20 years). The total rutting damage over 20 years, presented in Figure 12b, was accounted at 1.80. Therefore, the total rutting damage under the flooding scenario 1 is 16% higher than the damage predicted by the current climate scenario and 82% higher than the rutting damage predicted by the traditional FAARFIELD method.
The yearly fatigue damage, on the other hand, increased less than 1% when compared to the current climate scenario. It should be noted that this outcome may be associated with the fact that this scenario only considered the weakening of the subgrade because of the flooding and did not account for any stiffness reduction in the base, sub-base, and AC layers. In an actual flood event, however, those layers may also get affected, which will most likely increase fatigue damage as well as rutting. The results from Scenario 2 are summarized by Figures 14 and 15.
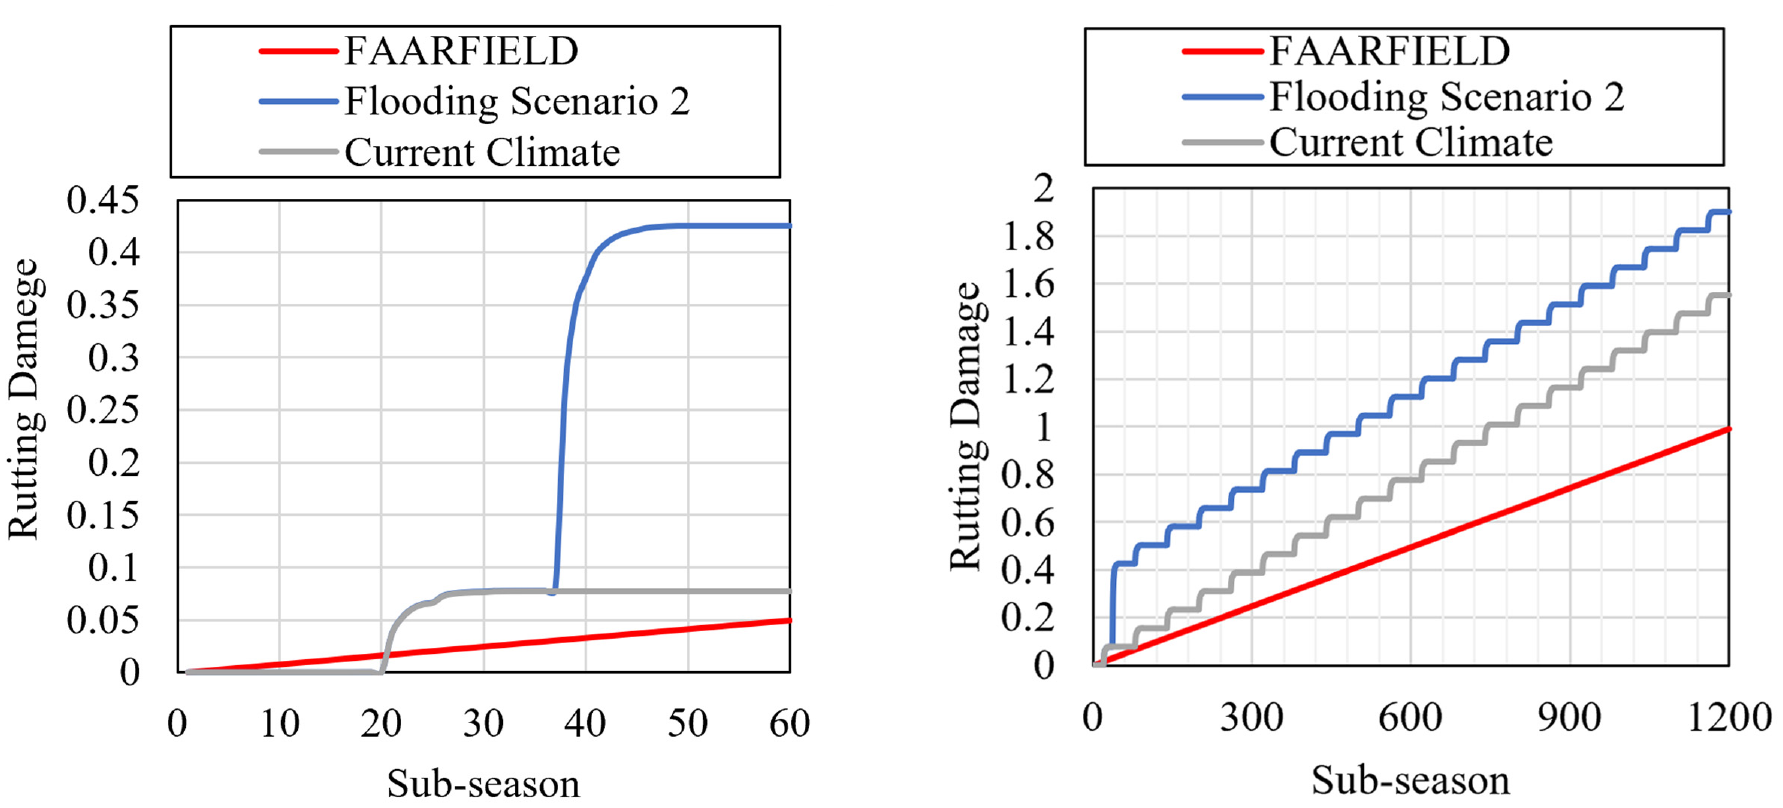
Cumulative rutting damage under flooding scenario 2: (a) over one year, and (b) over twenty years.
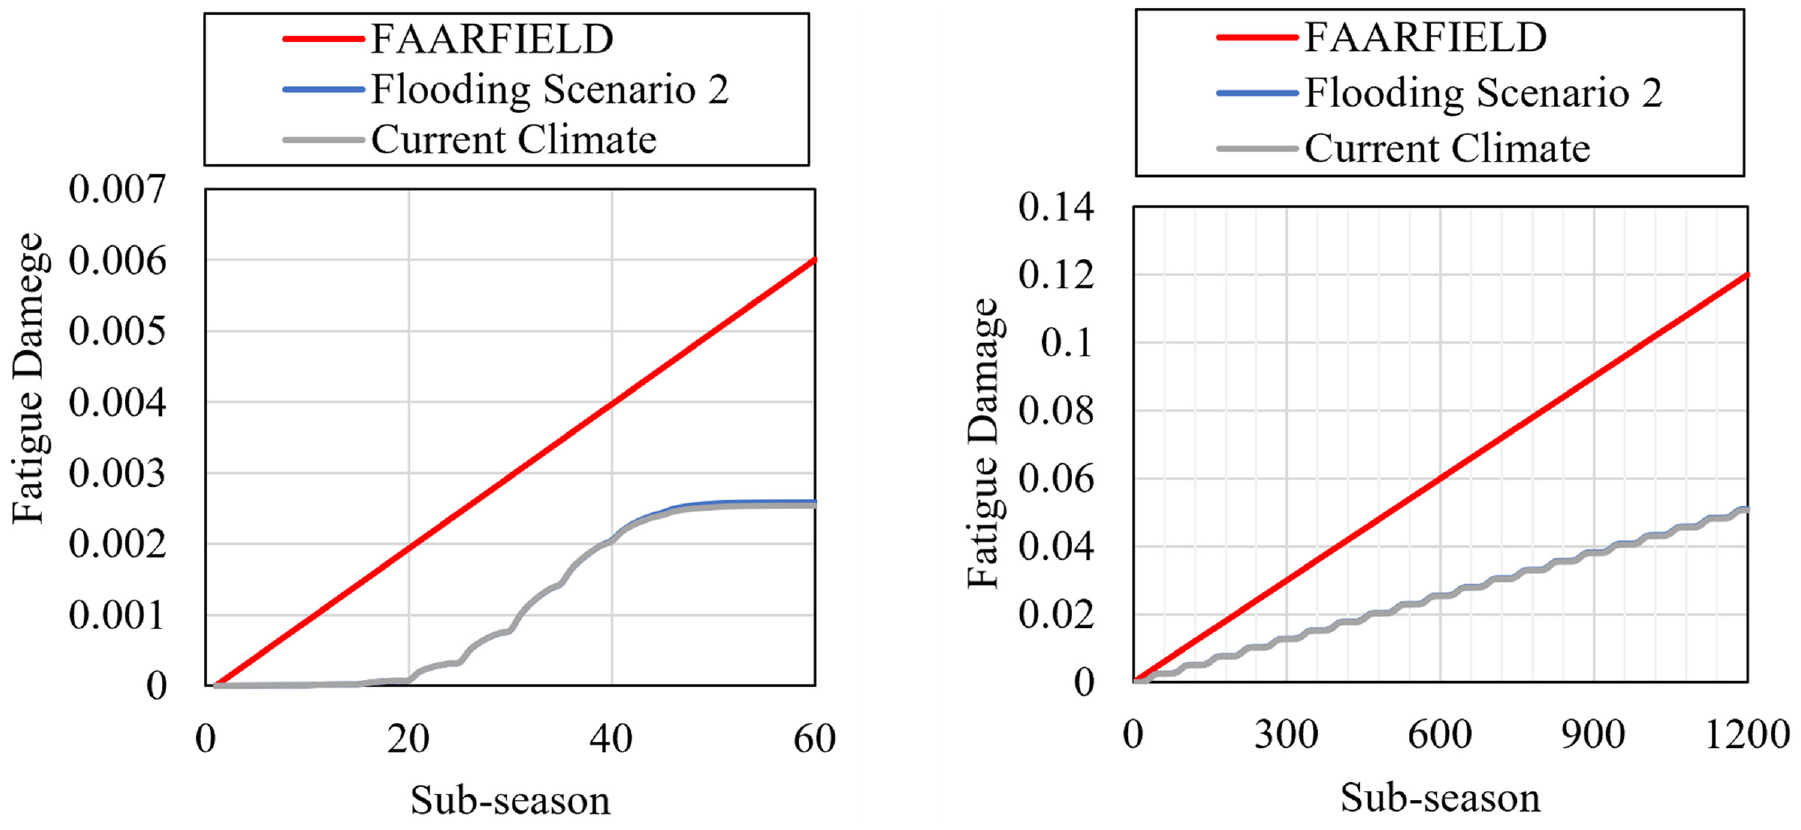
Cumulative fatigue damage under flooding scenario 2: (a) over one year, and (b) over twenty years.
In this scenario, the total rutting damage at the end of year 1 was 0.43, as can be seen in Figure 14a, which is equivalent to 8.7 years of damage under normal circumstances (CDF = 0.99 over 20 years). It can be noted in Figure 12b that the rutting damage over 20 years was accounted at 1.90. The rutting damage under the flooding event Scenario 2 is 22% higher than the damage computed in the current climate scenario and 92% higher than the damage predicted by the traditional FAARFIELD method. The yearly fatigue damage under the flooding Scenario 2 was less than 1% higher than the damage predicted by the current climate scenario. Such results are consistent with flooding scenario 1, in which the flooding event presented a neglectable increment to the fatigue CDF.
Discussion
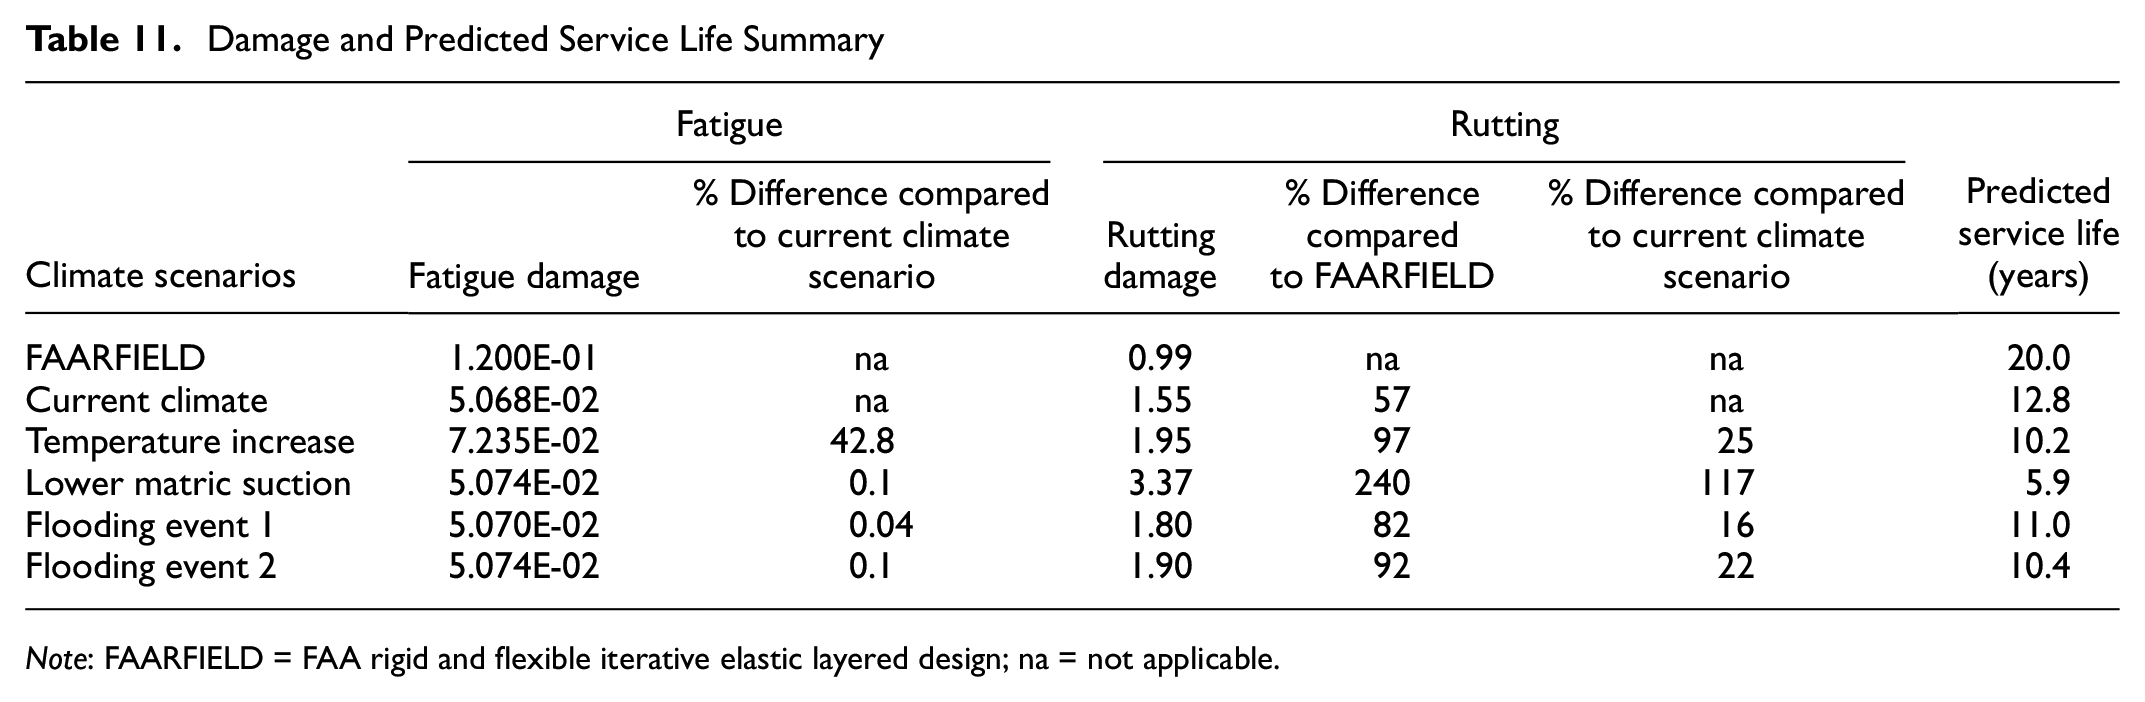
The cumulative rutting and fatigue damage, as well as the predicted service life from all scenarios evaluated in this study is summarized in Table 11.
Damage and Predicted Service Life Summary
Note: FAARFIELD = FAA rigid and flexible iterative elastic layered design; na = not applicable.
The fatigue damage estimated through the proposed methodology in all the scenarios was found to be smaller than the total damage estimated from the traditional FAARFIELD analysis. This can be explained in light of FAARFIELD considering that the AC stiffness is constant throughout the year and equivalent to a temperature of 32°C. However, the damage during the colder seasons was calculated to be much less since the pavement layers are frozen during this time. Among all the climate change scenarios evaluated, fatigue damage seemed to be little affected by changes in soil saturation, which is present in the lower matric suction and flooding events scenarios. However, the effects of the temperature increase scenario indicated fatigue damage that is 43% higher than that in the current climate scenario.
All the scenarios demonstrated greater rutting damage than predicted through FAARFIELD. The current climate scenario was based on past temperature data from 2010 through 2019 and a matric suction of 293 kPa, and it resulted in rutting damage that was 57% greater than that estimated through FAARFIELD, and a reduction in service life of 7 years. The effects of higher temperature under the temperature increase scenario suggested rutting damage that was 25% greater than the damage predicted by the current climate scenario and a service life that was 2.6 years shorter. By comparing the impact of temperature increase on rutting and fatigue damage, when the scenario is not associated with changes in moisture, it is possible to conclude that a potential rise in temperature because of climate change can be more critical in relation to fatigue damage. It is important to note that this scenario simulated temperature predictions corresponding to the year 2050, with average temperatures of about 5°C above the current scenario.
Flooding scenarios 1 and 2 showed an increase in rutting damage of 16% and 22% when compared to the current climate analysis. The impact was greater for flooding scenario 2 as it was based on a slower matric suction recovery rate after flooding than scenario 1. The pavement service life could be reduced to 11 years in flooding scenario 1 and 10.4 years in scenario 2, if no rehabilitation measures were taken after the event.
The results of different climate change scenarios showed that the greatest rutting damage occurred in the lower matric suction scenario. Lower matric suction directly affects the equilibrium saturation level and lowers subgrade stiffness during both the recovery and unfrozen seasons. The results showed that the decrease in matric suction could increase damage by approximately 117% compared to the current climate scenario, and decrease the pavement service life to only a few years.
Given the results of analysis of the lower matric suction scenario, it is important to recognize that matric suction can vary though the year because of variations in rainfall, evapotranspiration, ground water table levels, and pumping of water from wells, and it is difficult to predict if suction will rise or decrease in certain regions because of the effects of climate change. Although there is strong evidence of rising temperatures and an increasing incidence of extreme weather events such as flooding in Canada, it would be hard to make predictions about future matric suction levels. If an airport experiences a significant rise in subgrade saturation levels in the future, the airport authorities would typically have to monitor saturation levels and drain the excess water in a more efficient way, or enhance the pavement structure or impose operational limitations for certain periods of time.
The fleet mix used in the analysis, although realistic for Toronto Pearson Airport, would not necessarily represent other airports, where the amount and nature of traffic may be different. In the case of airports that do not handle B777-300 ER operation, damage is more likely to be evenly distributed among the aircrafts in the fleet mix. Although the finding that climate change can increase pavement damage and shorten service life is likely to remain relevant in the analysis of other airports, the percent increase in damage and the decrease in the service life of airport pavements will vary from one airport to another.
It should be noted that this research only considered the conventional flexible airport pavements (i.e., AC on top of unbonded granular layers) of Toronto Pearson International Airport in the analysis. The pavement damage results would likely change if different layer thicknesses, stabilized materials, or unconventional structures were used. Furthermore, the traffic and fleet mix data used in this investigation were pertinent to the selected airport facility, and may not represent traffic and fleet mix data for other airports.
Conclusions
This research proposed a new methodology to analyze the structural design of flexible airport pavements which took into account climate-induced impacts on the predicted pavement performance. The methodology was applied to the case of Pearson International Airport, using actual field data. To assess the possible effects of climatic parameters and climate change on airport pavement performance, the methodology was first cross-verified by the design of a flexible pavement structure using FAARFIELD to ensure that a total CDF of 1 was achieved. Then, the same layer thickness resulting from the FAARFIELD design was used to evaluate current climate and climate change effects on the CDF of the most critical aircraft (i.e., B777-300 ER) from the traffic fleet mix operated at the airport. A total of five scenarios were evaluated in the research, including current climate, temperature increase, lower matric suction, and two flooding events.
The results of the proposed design method showed that the traditional FAARFIELD analysis can possibly overestimate fatigue damage, and underestimate rutting damage. The results for fatigue and rutting damage from the proposed methodology show that climate change can increase pavement damage and shorten the pavement service life by 7 to 14 years in the scenarios evaluated. The proposed methodology can yield major benefits in quantifying the impact of climate change, which can ultimately facilitate the design of more resilient transportation infrastructure including airfield pavements. The proposed method takes account of climate variations, temperature increase, and extreme events such as flooding in the design of flexible airport pavements.
Footnotes
Author Contributions
The authors confirm contribution to the paper as follows: study conception and design: Paula Barbi and Pejoohan Tavassoti; data collection: Paula Barbi and Pejoohan Tavassoti; analysis and interpretation of results: Paula Barbi and Pejoohan Tavassoti; draft manuscript preparation: Paula Barbi, Pejoohan Tavassoti and Susan Tighe. All authors reviewed the results and approved the final version of the manuscript.
Declaration of Conflicting Interests
The author(s) declared no potential conflicts of interest with respect to the research, authorship, and/or publication of this article.
Funding
The author(s) received no financial support for the research, authorship, and/or publication of this article.