
Abstract
Transportation agencies need information about the potential effects of climate change on the volume, quality, and treatment of stormwater to mitigate potential effects of runoff on receiving waters. To address these concerns, the U.S. Geological Survey and the Federal Highway Administration used the Coupled Model Intercomparison Project tool and the Stochastic Empirical Loading and Dilution Model to perform space-for-time stormwater quality analyses. This study indicated that spatial variations in precipitation statistics within and adjacent to southern New England are greater than projected climate-related changes for the centroid of this region. A dilution-factor analysis indicated that highway runoff would become a greater proportion of downstream flows if average event volumes or time between event midpoints increase and would become a smaller proportion of downstream flows if event durations increase. Highway-runoff yield analyses for total phosphorus (TP) indicate that uncertainty in water quality statistics results in variations in long-term average yields from about 1.69 to 7.96 times higher than the lowest TP values simulated. In comparison, variations in precipitation statistics cause yield variations that ranged from 1.41 to 1.76 for the different simulated concentrations. An analysis of stormwater treatment indicated that uncertainties in runoff treatment variables are also larger than the magnitude of climate variations. This study does not question the potentially large climate-related changes in hydrologic and hydraulic variables expected to occur in the foreseeable future. It does indicate that uncertainties in the current data and potential effects of land use change on stormwater quality and treatment variables are larger than the projected effects of climate change.
Keywords
The U.S. Federal Highway Administration (FHWA) and state departments of transportation (DOTs) are developing the information and analytical techniques needed to assess and mitigate the vulnerability of transportation systems to the adverse effects of climate change because such changes may threaten the nation’s investment in transportation infrastructure ( 1 , 2 ). The FHWA has developed the Coupled Model Intercomparison Project (CMIP) data processing tool to process complex climate change information into statistics needed to support decisions by transportation engineers and planners ( 3 ). The FHWA CMIP tool uses downscaled global climate model outputs and generates various temperature and precipitation statistics. These statistics can be used by transportation agencies to assess the magnitude of potential hydrologic changes and estimate how they may affect transportation infrastructure. The main focus of such efforts has been on estimating the potential hydrologic and hydraulic effects of climate change to build resiliency into the transportation system ( 4 ). DOTs also need information about the potential magnitude of changes in flows, concentrations, and loads of highway-runoff constituents with changes in weather that could prompt regulatory attention and therefore changes in the design, construction, and maintenance of structural stormwater quality mitigation measures.
Climate change is increasing air temperatures and changing precipitation patterns across the globe, causing indirect and direct effects on streamflow and surface-water quality. In the northeastern United States, the location of this study, air temperatures and annual precipitation are projected to increase, with an increased proportion of precipitation falling during extreme events ( 5 , 6 ). Potential effects of climate change on flows, concentrations, and loads of stormwater have been observed and hypothesized. The greatest climate-related changes in downstream water quality constituent concentrations are expected to occur from increased non-point source pollutant loadings. However, it can be difficult to distinguish the effects of climate change on runoff and downstream water quality from changes in land use and land management practices ( 7 – 11 ). In a study using stormwater runoff data from the National Stormwater Quality Database across the United States, Behrouz et al. ( 12 ) determined that event mean concentrations in stormwater runoff depend on both catchment and rainfall characteristics. Concentrations in stormwater were most affected by the characteristics of land use, precipitation depth, and duration, and less by catchment size and antecedent dry periods ( 12 ). In some cases, the effects of climate change on downstream water quality may be more substantial than those resulting from changes in land use or urban development ( 7 ). However, Ryberg and Chanat ( 11 ) evaluated water quality and climate trends in data from sites across the conterminous United States and found that management practices had a larger effect on constituent concentrations at some sites than climate change effects did at many sites. Pyke et al. ( 13 ) evaluated the potential effectiveness of low impact development for reducing the effects of stormwater on surface water for different precipitation patterns and found that stormwater runoff and pollutant loads were most affected by changes in impervious cover, followed by precipitation volume and event intensity. Therefore, in the face of inevitable changes in climate and population, active management of land use and stormwater mitigation measures will be needed to mitigate adverse effects of these changes on receiving-water quality.
The potential effects of climate change on non-point source runoff yields and receiving-water quality can be assessed by using a space-for-time climate change approach. Using the space-for-time approach, potential effects of climate change on streamflow and water quality can be explored by substituting geographic differences in climate variables (temperature and precipitation) for temporal changes in the same variables projected by climate models. This approach is based on the assumption that the spatial relations between climate and characteristics of hydrologic variables, such as streamflow, at different locations are like those observed between climate and the variable over long periods of time at a given location. The approach was introduced into ecology by Likens ( 14 ) as an alternative for long-term longitudinal studies of climate change and has since been used in hydrologic studies to predict streamflow changes in ungauged basins, to develop more robust calibration parameters for hydrologic models, and to predict climate-dependent indices ( 15 , 16 ). Runoff generation and receiving-water quality are influenced by variations in precipitation characteristics and temperature ( 7 – 12 , 17 ); these variables may change geographically (in space) and with climate change (in time). Therefore, simulation results showing variation from place to place (in space) can indicate the potential magnitude of changes that may occur at a given location over time as the climate changes.
Purpose and Scope
The purpose of this paper is to assess the potential effects of climate change on highway-runoff flows and loads in southern New England (SNE) by using planning-level space-for-time analyses. These analyses include a current-period precipitation analysis, a climate change analysis, and several space-for-time highway-runoff loading analyses. These analyses were conducted to provide practice-ready information that DOTs can use to evaluate information needed to assess potential effects of highway runoff on receiving waters now and in the future. These analyses compared the magnitude of spatial variations in precipitation statistics with the potential magnitude of climate change predictions by using precipitation statistics from the current era with climate projections processed by the FHWA CMIP data processing tool. The Stochastic Empirical Loading and Dilution Model (SELDM) developed by the U.S. Geological Survey (USGS) in cooperation with the FHWA ( 17 , 18 ) was used to simulate stormflows and long-term average yields by using the spatial precipitation data with selected event mean concentration (EMC) statistics for total phosphorus (TP). TP was chosen as the water quality constituent for discussion because of the abundance of EMC measurements for this constituent in the region. These simulations were performed as part of a SELDM modeling study by the USGS in cooperation with the FHWA and Connecticut, Massachusetts, and Rhode Island DOTs; an archive of the simulations is publicly available in Granato et al. ( 19 ). An empirical relation from the literature was used to evaluate the potential effects of climate change on stormwater treatment. These analyses, however, were limited to comparisons between temperature effects on the settling velocity of sediment and variations in grain size and specific gravity. The climate change analyses described in this paper were not included in the original SNE study ( 19 ); this paper represents a new interpretation of existing simulation results.
Current-Period Precipitation Analysis
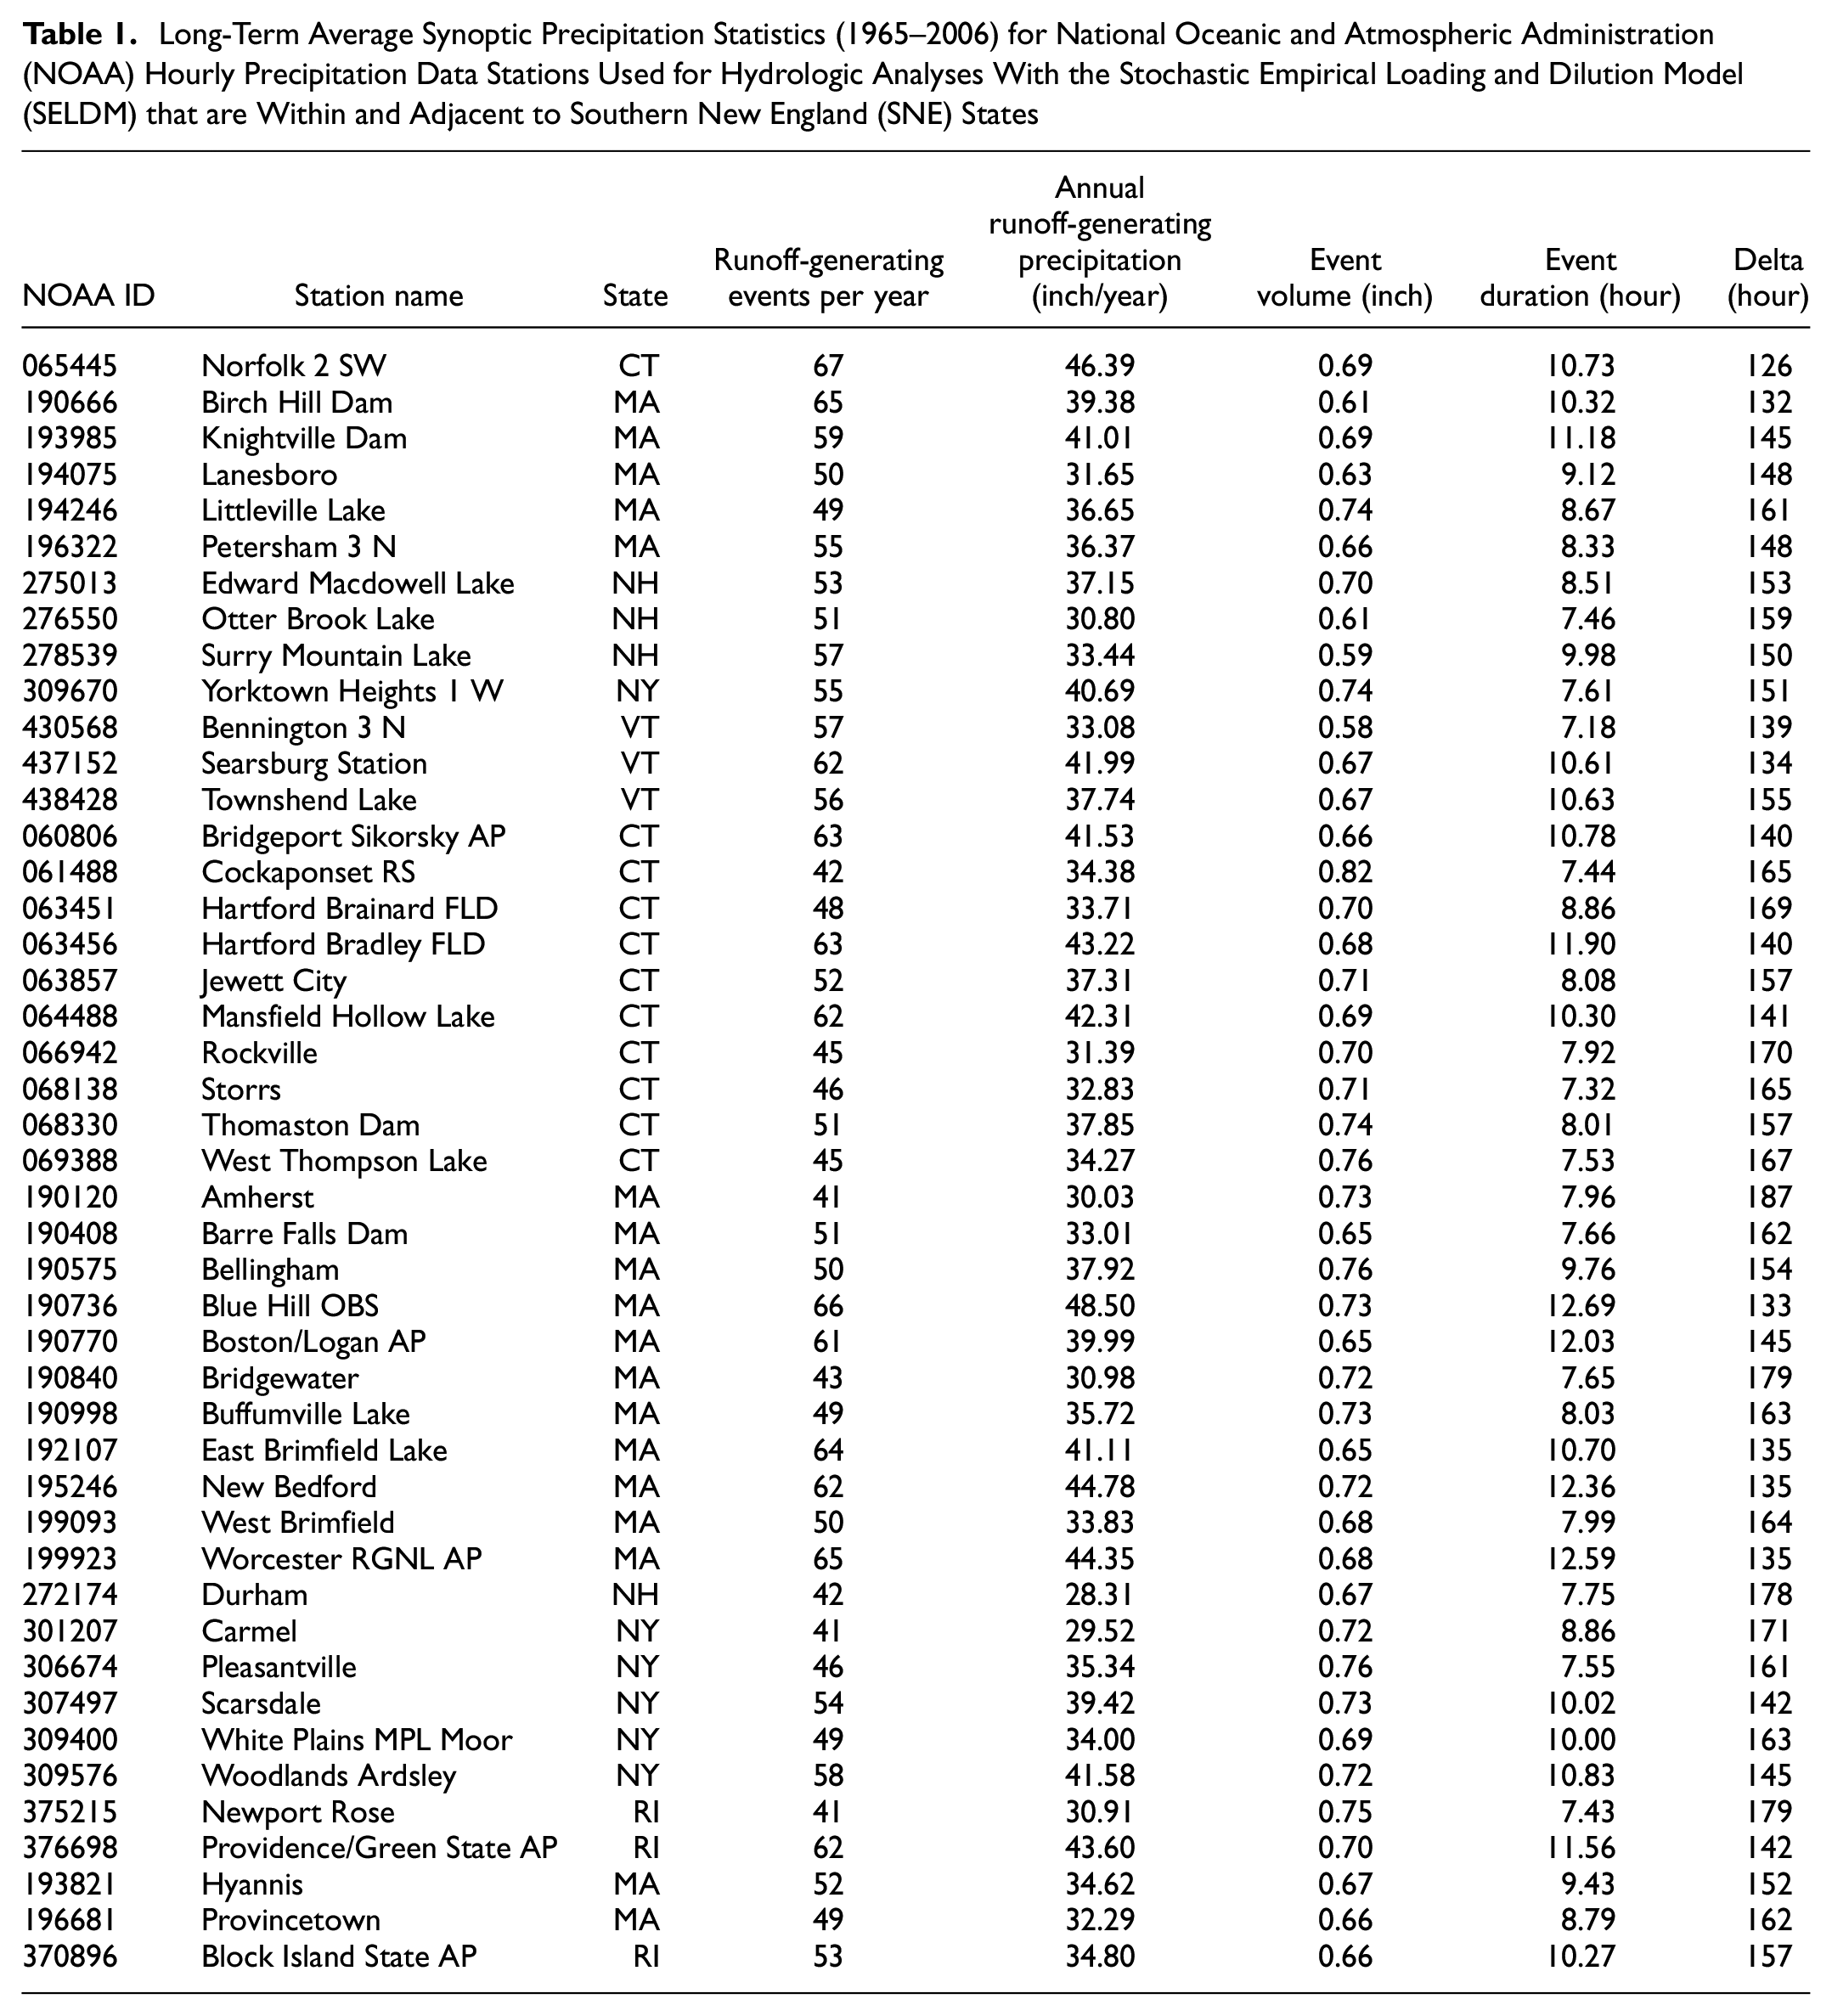
Precipitation statistics covering a wide range of climatic conditions were needed to perform a space-for-time analysis of climate change. In this study precipitation statistics from National Oceanic and Atmospheric Administration (NOAA) hourly precipitation data stations with at least 25 years of data from 1965 to 2006 were used to simulate current conditions with SELDM ( 17 , 19 ). Forty-five selected NOAA stations within and adjacent to the SNE area were selected to represent conditions within SNE and provide a range of statistics that may characterize future conditions within the region (Figure 1, Table 1). SELDM uses the U.S. Environmental Protection Agency (EPA) definition of runoff-generating precipitation events, which are commonly known as the synoptic event statistics ( 17 ). The EPA definition of a runoff-generating event, or storm event, which is based on hourly values, has a minimum interevent time of 6 h and a minimum volume of 0.1 in. of liquid precipitation. The total annual volumes shown in Table 1 are expected to be less than the measured annual totals because they do not include volumes from events with less than 0.1 in. of liquid precipitation. SELDM simulates a random multi-year series of runoff-generating events with the two-parameter exponential distribution by using statistics for the average volume, duration, and time between event midpoints (known as delta). The medians of statistics for runoff-generating events in Table 1 are about 52 events per year, 36.37 in. per year of precipitation, and a median storm-event volume, duration, and delta equal to 0.69 in., 8.86 h, and 154 h, respectively.
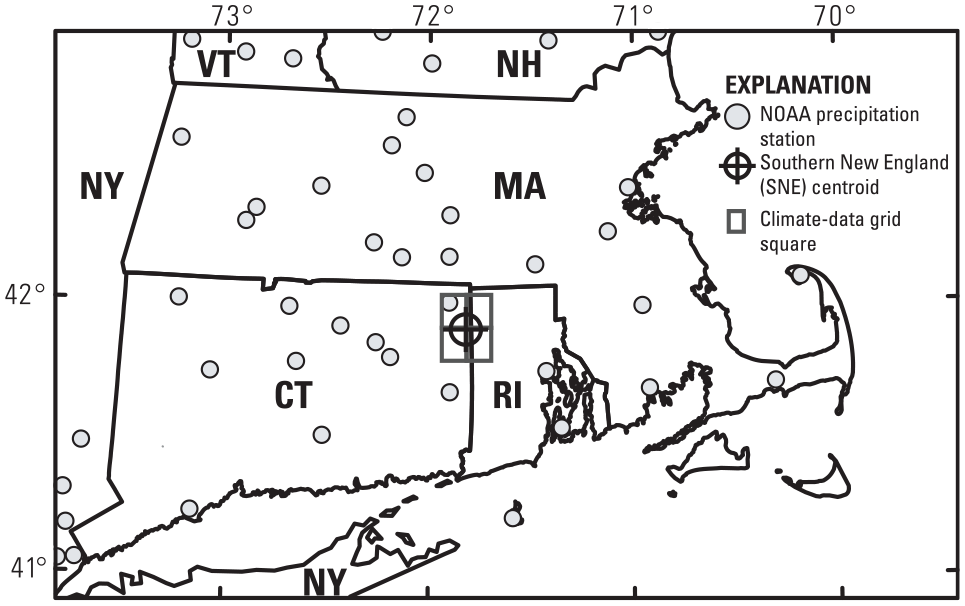
Index map showing approximate locations of National Oceanic and Atmospheric Administration (NOAA) hourly precipitation data stations, climate-data grid squares, and the geographic centroid of southern New England (SNE).
Long-Term Average Synoptic Precipitation Statistics (1965–2006) for National Oceanic and Atmospheric Administration (NOAA) Hourly Precipitation Data Stations Used for Hydrologic Analyses With the Stochastic Empirical Loading and Dilution Model (SELDM) that are Within and Adjacent to Southern New England (SNE) States
Climate Change Analysis
The FHWA CMIP tool ( 3 ) was used to perform the climate analysis used in this paper. First, current and future temperature and precipitation variables were downloaded from the U.S. Bureau of Reclamation website ( 20 ), which contains data from all 32 approved global circulation models. From these data, the specific subset of Localized Constructed Analogs Downscaled Data ( 21 ) was used. Because the focus of this paper is on the centroid of SNE (with a geographic centroid of about 41.9334 and −71.8201), four adjacent downscaled grid squares, each covering 0.06 degrees latitude and longitude with a centroid of 41.94 and −71.81 were used to calculate the precipitation and temperature statistics (Figure 1). Climate change values were calculated for the centroid area rather than for the entire SNE area because a complete coverage would not be equivalent to the space-for-time approach. The data were analyzed under two different scenarios for atmospheric greenhouse gas concentrations known as representative concentration pathways (RCPs). Two scenarios representing radiative forcing of 4.5 and 8.5 watts per square meter (RCP 4.5 and RCP 8.5) were selected to represent the most probable baseline scenario and a worst-case scenario (which represents no change in carbon emission practices), respectively. These models contain daily precipitation, and minimum and maximum temperatures from the years 1950 through 2099. The model-derived data were synthesized by using the FHWA CMIP tool to determine statistical changes from the period 1990–2019 to the period 2070–2099. Mean-monthly precipitation values from all 32 models were calculated by averaging daily precipitation for each month of each 30-year period. The monthly mean precipitation values were calculated for each month and averaged from the four adjacent grid squares. Monthly average temperature values were estimated in four steps. Maximum and minimum daily temperatures were averaged to estimate mean daily temperatures; estimated mean daily temperatures were averaged to calculate mean-monthly temperatures; monthly mean temperatures were calculated for each grid square, and the final values were calculated as the average of the four adjacent grid squares.
The CMIP analysis produced annual and monthly precipitation averages for assessing the potential magnitude of changes for comparison with variation in historical precipitation statistics used in the SELDM analyses. The estimated monthly and annual temperature changes were substantial (Figure 2). Changes ranged from 2.1 to 2.7°C with a median of 2.4° Celsius (C) for the RCP 4.5 scenario. Changes ranged from 4.0 to 5.1°C with a median of 4.4°C for the RCP 8.5 scenario. The estimated monthly and annual precipitation changes were not large, however, and were not unidirectional from period to period (Figure 2). Monthly precipitation volume changes ranged from −1 to 14% with a median of 7% for the RCP 4.5 scenario and from −1 to 21% with a median of 8% for the RCP 8.5 scenario. Annual changes were about 7% and 9% for the RCP 4.5 and RCP 8.5 scenarios, respectively. Monthly and annual changes do not capture the variability of individual events. However, the climate change variation is well within the magnitude of differences in current-period precipitation statistics from individual NOAA stations shown in Table 1. Among the statistics for the current period the number of runoff-generating events per year, annual runoff-generating precipitation, mean event volumes, mean event durations, and mean delta values vary by about 48%, 53%, 34%, 55%, and 39%, respectively. Therefore, climate variations are expected to be well within current spatial variations in SNE and a space-for-time approach should encompass the magnitude of projected changes in regional climate statistics.
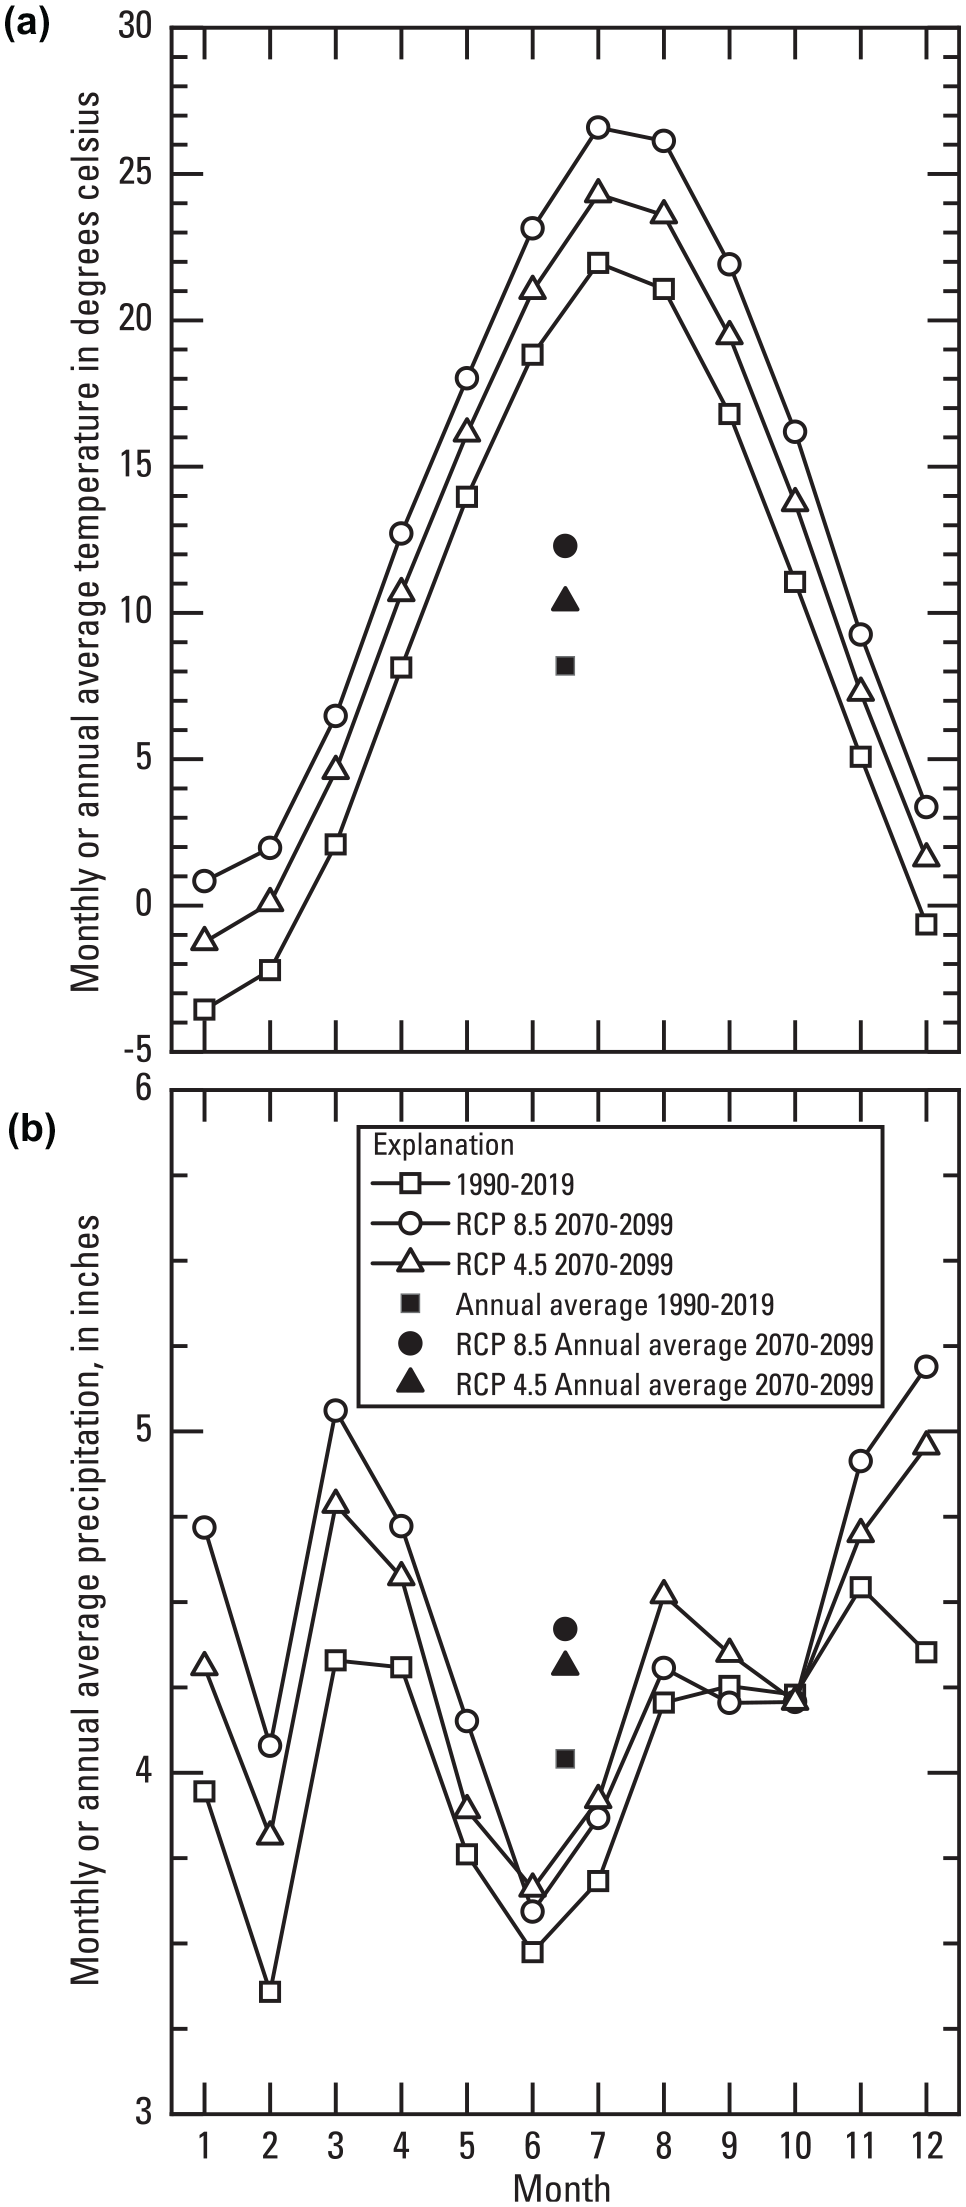
Climate projections for (a) temperature and (b) precipitation showing current values and the representative concentration pathways (RCP) 4.5 and 8.5 projections.
Space-for-Time Highway-Runoff Loading Analysis
The space-for-time climate change loading analysis was comprised of three parts: a dilution-factor analysis, an annual-yield analysis, and a stormwater treatment analysis. The dilution factor and annual-yield analyses depend on the current SNE precipitation statistics (Table 1). These results are derived from 147 highway-runoff yield analyses conducted by using SELDM for a highway-runoff study in SNE ( 19 ). The stormwater treatment analysis is based on current and future temperature analyses produced using the CMIP tool (Figure 2) and applied to an empirical sediment settling equation ( 17 ). SELDM simulations for this study include an analysis to estimate highway-runoff yields (loads per acre) using highway-runoff statistics with local SNE precipitation statistics from 45 individual precipitation gages ( 19 ). The 147 highway-runoff simulations include three sets of water quality statistics for low, high, and median geometric-mean concentrations (15th, 50th, and 85th percentiles). These three water quality percentiles were selected to evaluate a representative range of geometric-mean concentrations without including the potential for extreme outliers for multiple water quality constituents ( 19 ). Among the 19 highway-runoff sites with TP data, the maximum geometric mean was about 19 times the minimum geometric mean and the 85th percentile geometric mean was about 9.5 times the 15th percentile geometric mean concentration ( 19 ).
Dilution-Factor Analysis
Dilution-factor (DF) analysis is useful for assessing the potential effects of runoff on receiving waters ( 17 , 19 ). The DF is defined as the ratio of the discharge into a stream divided by the concurrent downstream stormflow, which is comprised of the sum of the stormwater discharge and the concurrent upstream stormflow. A DF of one indicates that the downstream flow is 100% highway-runoff during the period of discharge and a value near zero indicates that the runoff discharged from the site of interest is a negligible portion of the concurrent downstream flow. Although the DF is nominally a flow statistic, it is in practice a surrogate water quality statistic. Because there are many constituents of concern in highway and urban runoff, the DF may be used to estimate the total effect of runoff on receiving waters. SELDM calculates DF values for each storm event as it generates runoff, stormwater-control measure best management practice (BMP) discharge, and upstream stormflow volumes. The DF value associated with a risk of exceedance of one event in three years was selected for the analysis in this paper because it is a commonly used exposure risk in water quality regulation ( 17 , 19 , 22 ). Also, the three-year exceedance risk is of concern, but it is not an extreme risk percentile representing the worst, but difficult to quantify, effects of climate change on precipitation and stormflow. Based on the number of simulated events, which ranged from 1,426 to 1,880, and number of annual-load accounting years, which ranged from 27 to 30, the Cunnane percentile exceedance risk associated with a three-year return period ranged from about 0.458 to 0.674 with an average of 0.557% among the 45 NOAA stations (Table 1). The DF values shown in Figure 3 were simulated by using representative basin properties for a one-acre 100% impervious highway site with a 10 square-mile 0% impervious upstream basin ( 19 ). Upstream prestorm streamflows were simulated by using median stream flow statistics for SNE. Each symbol in Figure 3 represents the results for one NOAA station. These three-year DF values range from about 0.037 to 0.051 with a median of about 0.044.
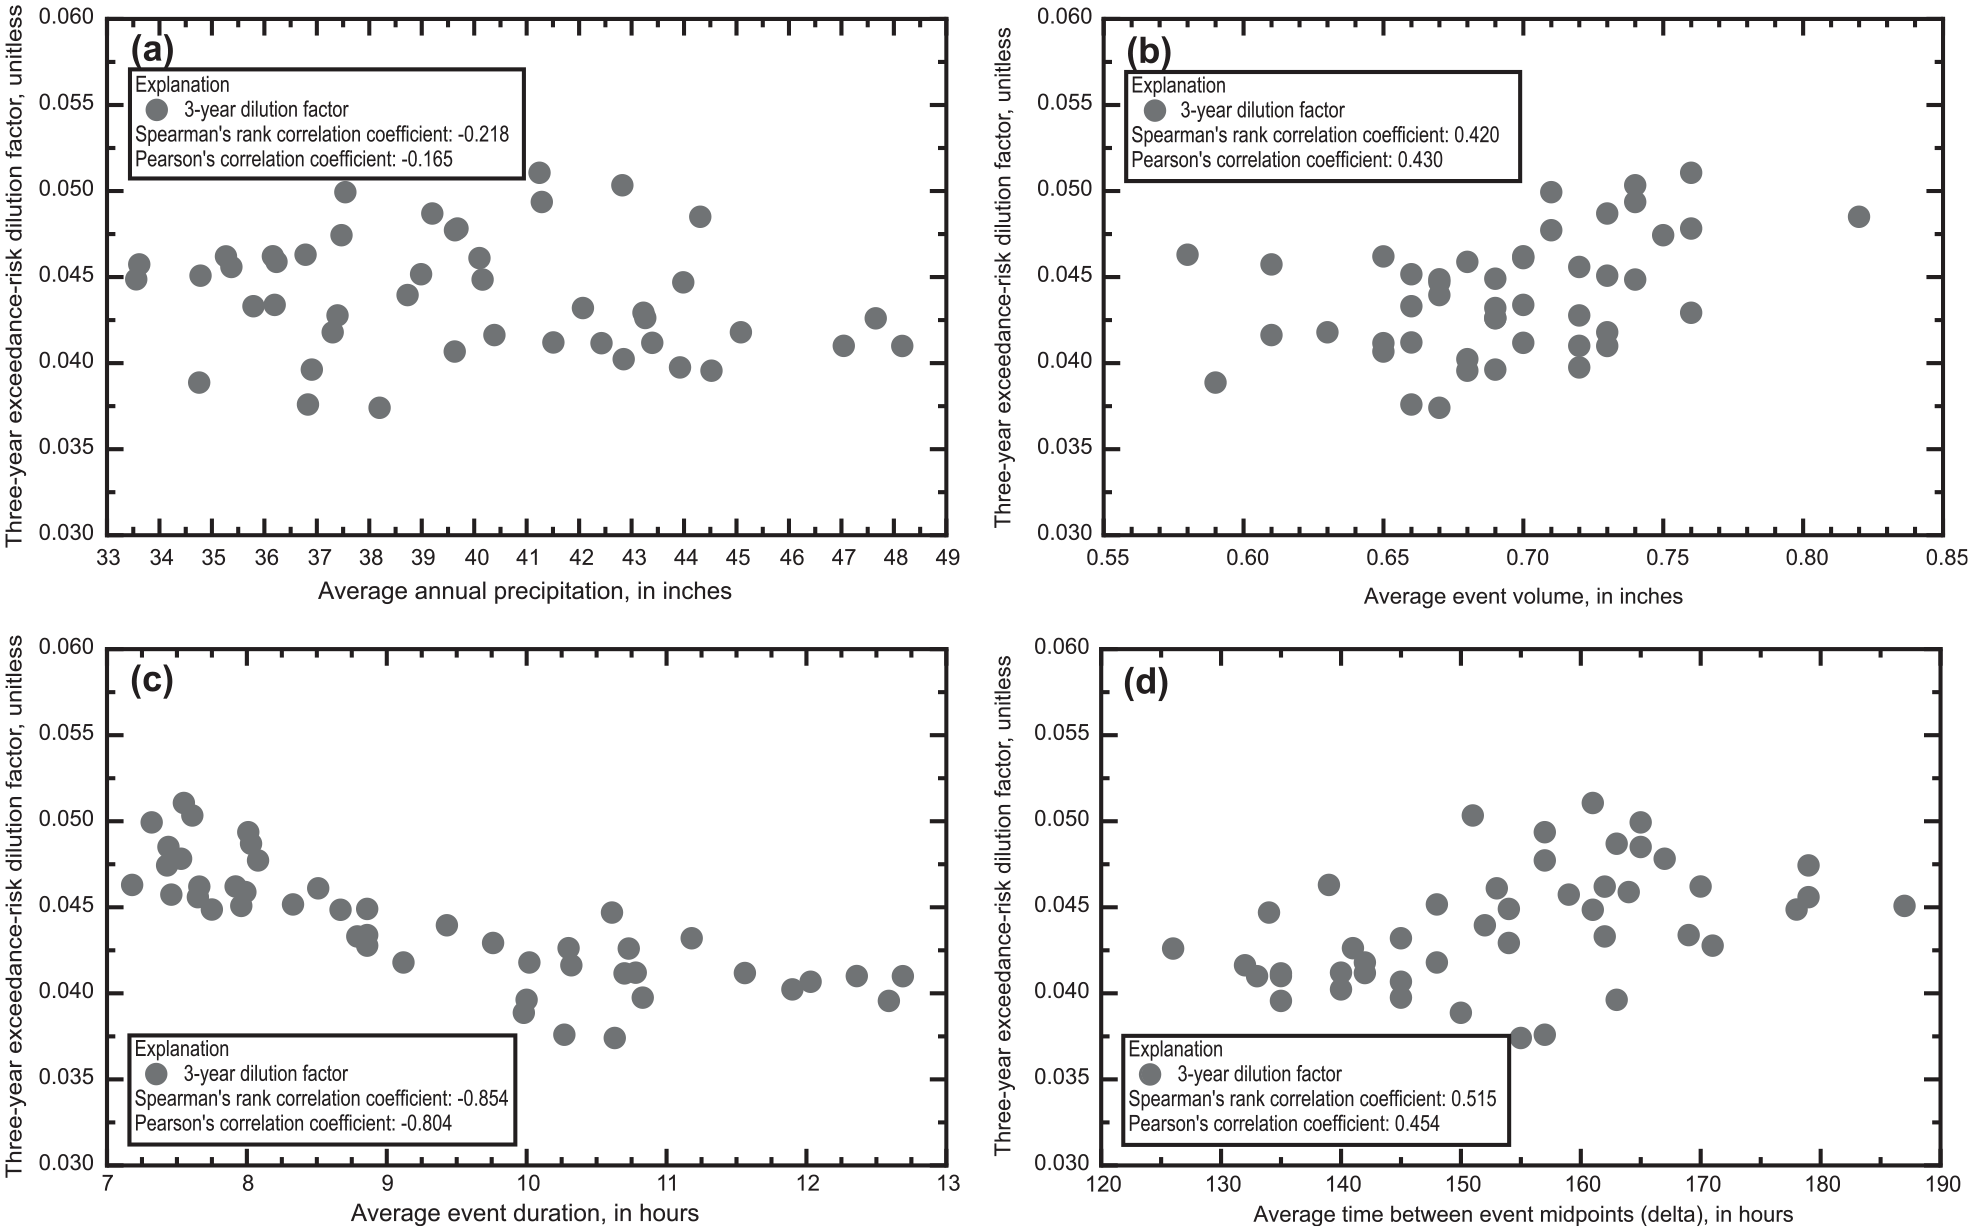
The simulated dilution factors (the ratio of highway runoff to downstream flow volume) associated with the three-year exceedance risk in relation to the simulated: (a) average annual precipitation volume, (b) average event volume, (c) average event duration, and (d) average time between event midpoints (delta).
Results of this analysis indicate the sensitivity of simulated DF values to the different precipitation statistics over a large range of values (Table 1, Figure 3). In this analysis DF values were most sensitive to the average storm-event durations with statistically significant (at the 95% confidence interval) correlation coefficients with an average of about −0.83 (Figure 3). The average storm-event durations are strongly and negatively correlated to the DF values because longer events capture a greater proportion of the upstream stormflow hydrographs than do the shorter runoff events. The simulated DF values have weak, but statistically significant, correlation coefficients with the average storm-event volumes (with an average of about 0.43) and the delta values (with an average of about 0.49). Larger average volumes are expected to disproportionately increase runoff from the paved highway surface. In theory, larger delta values would reduce the antecedent wetness of the upstream basin, thereby decreasing prestorm streamflow and runoff from the upstream basin. However, based on analysis of data from many sites, SELDM simulates antecedent wetness as a function of prestorm streamflow rather than precipitation statistics ( 17 ). Therefore, the positive correlation between delta and DF values is a consequence of the positive correlation between delta and volume and the negative correlation between delta and event duration (Table 1). Although spatial variation in precipitation is expected in large basins the NOAA station density in this region is about 784 square miles per station, which is much larger than most stream basins above road crossings in SNE ( 19 ).
Highway-Runoff Annual-Yield Analysis
Runoff yield analyses are useful for assessing loads of constituents of concern from different land-cover areas; long-term average annual yield values from SELDM are robust because they are the product of flows and concentrations from more than 1,000 individual events. In this analysis, individual event runoff flows, which are the product of the stochastic precipitation from each NOAA station (Table 1), and runoff coefficient values for the impervious pavement area were simulated by using SELDM ( 17 ). Runoff-quality statistics for the common logarithms of TP EMCs in milligrams per liter were calculated for 19 highway-runoff monitoring stations in Massachusetts by using version 1.1.0b of the Highway Runoff Database ( 19 ). To compare the potential effect of variations in precipitation with runoff-quality uncertainty, the median, 15th, and 85th percentiles of the average of the logarithms of concentrations from the 19 sites were used to simulate TP concentrations; these values were −0.944, −1.172, and −0.271 (the retransformed geometric means were about 0.114, 0.0673, and 0.536 milligrams per liter, respectively). The rank correlation between the average and standard deviation of the logarithms of TP concentrations was −0.386 and was not statistically different from zero at the 95% confidence limit. Therefore, the average and standard deviation of the logarithms of concentrations could be independently selected to simulate highway-runoff quality and the median logarithmic standard deviation of 0.3627 was used for all simulations. Analysis indicated that for 18 of the sites, the skews of the logarithms of concentration were not significantly different from zero, so concentrations were simulated as lognormal.
SELDM analyses produced long-term average annual TP yields (pounds per acre per year) from a one-acre highway site by using precipitation statistics from the 45 NOAA stations (Table 1). Figure 4 shows the response of yields for the 15th, 50th, and 85th percentile geometric-mean concentrations to the different precipitation statistics. Yields increase with increasing average annual precipitation, storm-event volume, and event duration and decrease with increasing delta. In this analysis yields were most sensitive to the average annual precipitation volume with strong and statistically significant correlation coefficients with an average of about 0.9 (Figure 4). Yields have moderate but statistically significant correlations to average event duration (with an average of about 0.57) and delta (with an average of about −0.67). Yields have weak but statistically significant correlation to average event volume (with an average of about 0.34). Average annual precipitation, storm-event volume, event duration, and delta vary by a factor of 1.43, 1.41, 1.76, and 1.48 respectively. In comparison, because all three geometric means were simulated using the same standard deviation and skew, the long-term average annual yields vary by a factor of 1.55. However, on average, the yields simulated by using the 85th percentile of geometric-mean concentrations are greater than yields simulated by using the 15th and 50th percentile geometric-mean concentrations by a factor of 7.96 and 4.71, respectively, and the yields simulated by using the 50th are greater than by using the 15th percentile geometric-mean concentrations by a factor of about 1.69.
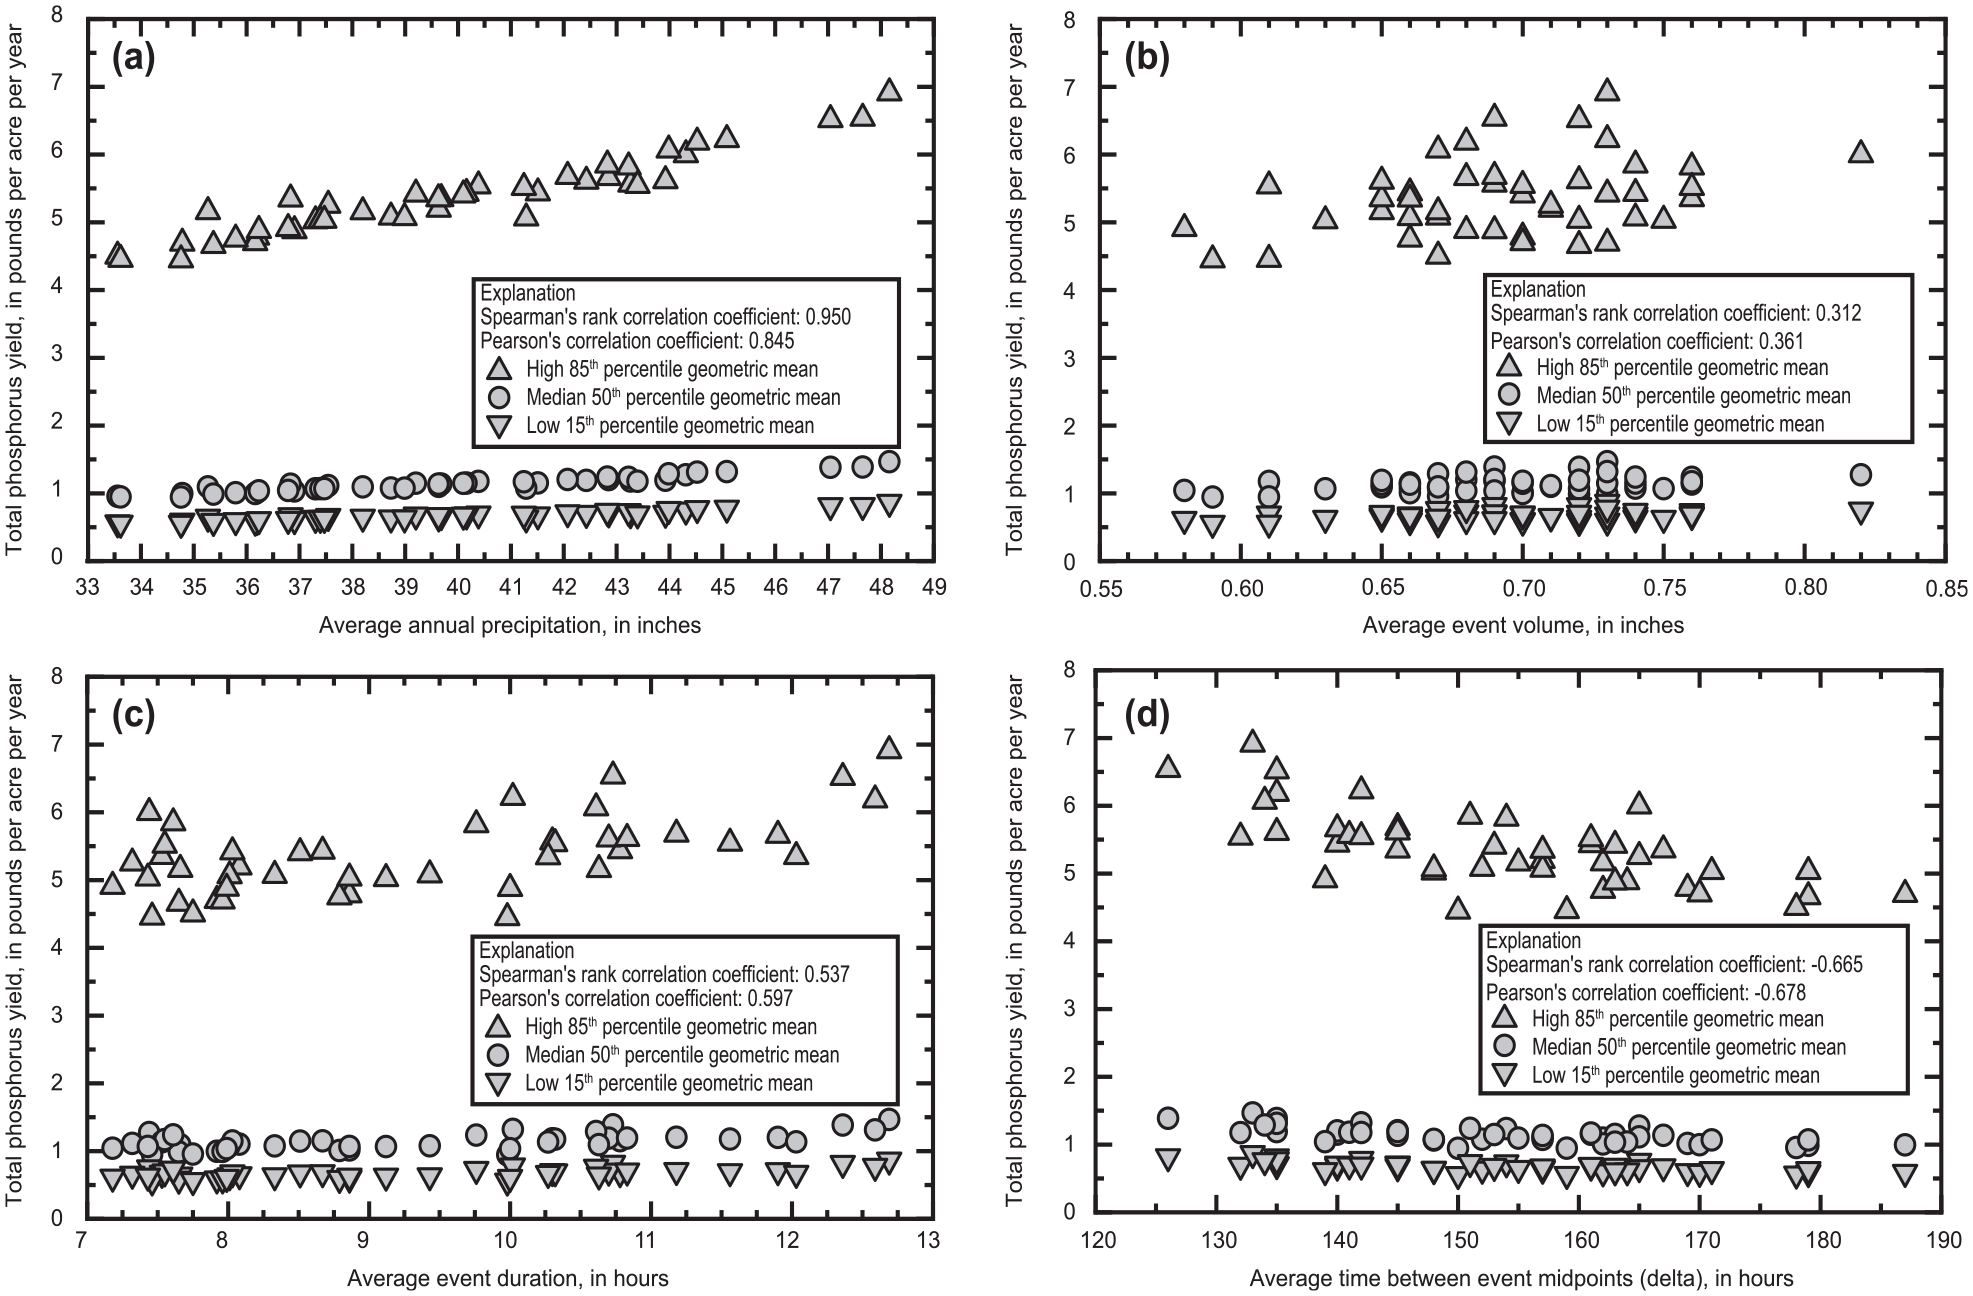
The simulated highway-runoff total phosphorus yields in relation to the simulated: (a) average annual precipitation volume, (b) average event volume, (c) average event duration, and (d) average time between event midpoints (delta).
Stormwater Treatment Analysis
SELDM simulates the effects of stormwater treatment stochastically by using statistics calculated from data in the International BMP database ( 17 , 23 ). Although, in theory, changes in precipitation and temperature would affect the hydrologic and physicochemical processes that BMPs use to modify the volume, timing, and quality of stormwater runoff, analyses indicate that BMP monitoring results are transferable across the different climatic zones represented in the BMP database ( 24 ). Performance may be similar across the country because BMPs are designed for local hydrologic conditions, storm-event conditions overlap from place to place, and available datasets are not sufficient to define performance measures as a function of location or design features ( 24 ). Therefore, the potential effects of long-term changes in temperatures on stormwater treatment were assessed by calculating the settling velocity of sediment as a function of water viscosity under current conditions, the RCP 4.5, and RCP 8.5 scenarios. The settling velocity of sediment was selected to represent BMP performance changes because it is a primary treatment process for most BMP categories. In this planning-level analysis, the annual and monthly temperatures calculated by using the CMIP analysis (Figure 2) were used to calculate the associated water viscosities and Gibbs’ equation was used to calculate the settling velocity ( 17 ). Representative grain sizes of 50 and 100 μm and representative specific gravities of 1.5 and 2.0 were selected to represent ranges of commonly reported properties of sediment in stormwater runoff ( 17 ).
Results of the stormwater treatment analyses are shown in Figure 5. These results indicate that variations in monthly- and annual-average temperatures between the current conditions and the climate change scenarios have a minor effect on settling velocities in comparison to differences in the assumed grain size and specific gravity of stormwater sediments. Increases in temperature of about 24% and 40% (annual average changes from about 8.2 to 10.4°C and from about 8.2 to 12.3°C, respectively, Figure 2) cause reductions in the viscosity of water of about 6% and 11%. Changes in the viscosity of water cause changes in settling velocity of about 5% and 10% for specific gravities of 1.5 and changes in settling velocity of about 6% and 11% for specific gravities of 2.0. In comparison, a change in specific gravity from 1.5 to 2.0 causes a change in settling velocity of about 65%. A change in grain size from 50 to 100 μm causes a change in settling velocity of about 117%.
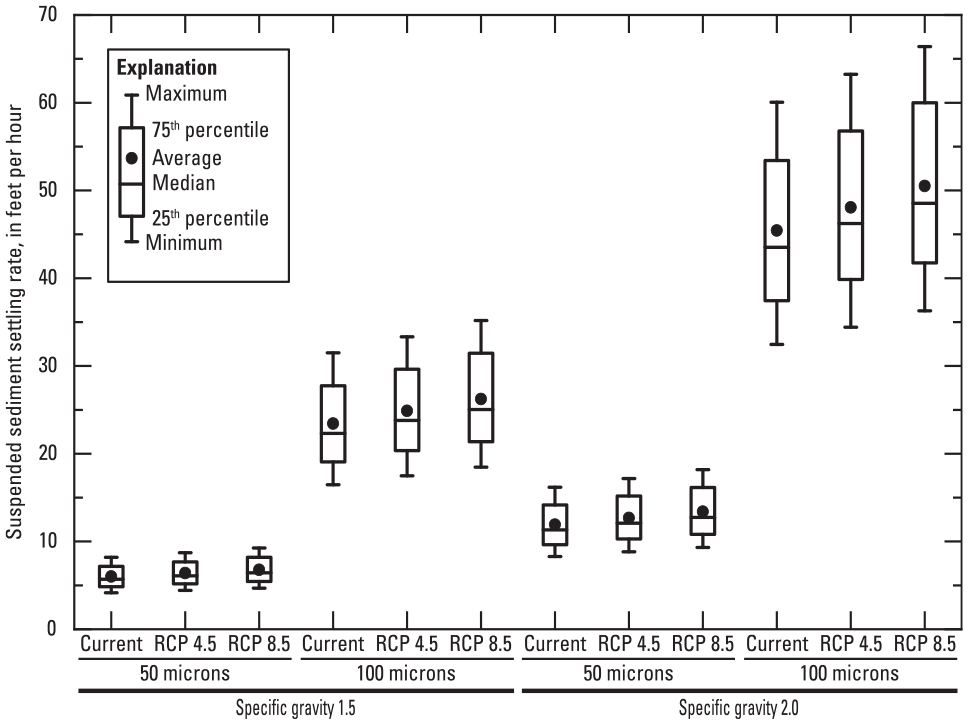
Boxplot showing sediment settling velocities calculated by using the Gibbs equation with temperatures representing current conditions, representative concentration pathway (RCP) 4.5, and RCP 8.5 conditions with grain sizes of 50 and 100 μm and specific gravities of 1.5 and 2.0.
Discussion
Simulation results indicate that uncertainties in existing datasets may be larger than differences between current conditions and climate change projections. For example, greater variations in simulated TP yields occur between the 15th percentile and 50th percentile geometric mean concentrations than variations in yields across differing precipitation statistics, even for the lowest precipitation values. The lowest TP yield simulated by using the median geometric TP concentration was 0.95 lb per acre per year and the highest yield simulated by using the 15th percentile geometric mean concentration was 0.87 lb per acre per year. The yields simulated by using the 85th percentile are about 4.71 times higher than the yields simulated using the median and about 7.96 times higher than the yields simulated with the 15th percentile geometric mean concentration. Therefore, uncertainty in the use of currently available runoff-quality data is greater than the uncertainty of climate change projections for the SNE region. If the minimum and maximum geometric mean concentrations for TP had been used for this analysis rather than the 15th and 85th percentiles, then the water quality uncertainty would be even larger than the simulated results ( 19 ). Similarly, uncertainties in runoff treatment variables also are larger than the magnitude of climate variations. Even a simple settling velocity analysis indicated that differences in settling velocities caused by variations in grain size and sediment density may be much greater than differences in settling velocities caused by temperature changes. The literature indicates that grain sizes within events can range by five or more orders of magnitude and the median grain size can vary by a factor of 40 from event to event at any given site ( 17 ). The specific gravity of particulates within an event can vary by a factor of 10 and the predominant specific gravity can vary by a factor of two or three ( 17 ). Additionally, the choice of water quality parameter may increase uncertainty in current estimates and future projections. TP was chosen for this study because of the robust number of measurements in the region compared with other water quality parameters. Other less frequently measured water quality parameters of interest, such as sediment, metals, and organic constituents, would have even greater uncertainty than TP.
Given the large differences among TP yields compared with the precipitation differences across SNE, future land use change may play a more important role in receiving-water quality than climate-induced runoff changes, which will further confound quantification of climate change effects. A study by Thompson et al. ( 25 ) estimated a loss of about 33 square miles of forest to development in the SNE area each year and concluded that proximity to developed areas is the greatest threat to these remaining forested areas. A simulation study by the USGS in cooperation with Oregon DOT indicated that untreated developed-area TP yields from stormwater were about 23 times the TP yields from forest and developed-area TP yields after BMP treatment still were about 11 times those from forest ( 26 ). Therefore, changes in yields within stream basins caused by land use changes are expected to be far larger than climate-related water quality changes.
The current study was designed to provide an initial planning-level assessment of the potential effect of climate change on the quantification and management of highway runoff within the limits of available data and methods. Even so, the current study has its limitations. SELDM uses synoptic statistics for the period 1965 to 2006 ( 17 ). Although comparisons to the previous synoptic data set for the 1949 to 1987 period did not show substantial differences, an updated data set is needed to explore more recent changes. The obsolete software (SYNOP) used for the precipitation analyses ( 27 ) needs to be redeveloped to process new NOAA data formats and produce statistics to better characterize the shifts in extreme values compared with the means. The CMIP tool provides valuable information but, as Niels Bohr is credited with saying, “It is difficult to make predictions especially about the future.” The CMIP tool, however, does not provide the synoptic statistics commonly used for stormwater quality analyses. Because SELDM is not a process-based daily-time series model the analyses may not characterize the interplay of weather extremes and within-season differences that may occur. However, because the focus of this paper is on pavement runoff rather than upstream water quality many of the processes of concern are not highly influential on these results. For example, Behrouz et al. ( 12 ) found that precipitation, duration, and antecedent dry periods did not affect TP EMCs from highly developed land uses, such as freeways. The DF analysis in this paper is for a one-acre highway downstream of a 10 square-mile basin. Although preliminary analysis of other combinations of drainage areas indicates similar results, a more comprehensive comparison is needed. The standard deviation and skew were not correlated to the geometric mean of TP concentrations in the available dataset but changing processes may alter this finding. Simulations did not include variations in runoff coefficients that may occur with increases in temperature and changes in precipitation. Analyses of potential effects of climate change on stormwater treatment were limited to comparisons between temperature effects on the settling velocity of sediment and on variations in grain size and specific gravity by using an empirical relation from the literature. We limited the analysis to sediment settling velocities because available data do not support a quantitative assessment of the biological, chemical, hydrologic, and physical processes needed to quantify changes in BMP performance. The stormwater treatment analysis in this paper was limited to changes in monthly and annual temperature and may not capture the effects of changes in extreme temperatures. Actual BMP performance will vary on hourly, daily, weekly, and seasonal timescales. Finally, this study focused on conditions within SNE, conclusions made from these results may not be applicable in areas that experience much larger climate variations.
Summary and Conclusion
Transportation agencies need practice-ready information about the potential effects of climate change on the volume, quality, and treatment of stormwater to mitigate potential effects of runoff on receiving waters. Currently, the FHWA and state DOTs are developing the information and analytical techniques needed to assess and mitigate the hydrologic and hydraulic vulnerability of transportation systems to the adverse effects of climate change, but information about stormwater quality changes is lacking. To address these concerns, the U.S. Geological Survey and the FHWA used the Coupled Model Intercomparison Project (CMIP) tool and the Stochastic Empirical Loading and Dilution Model (SELDM) to perform planning-level space-for-time stormwater quality analyses. In this analysis synoptic precipitation statistics from 45 NOAA weather stations within and adjacent to SNE, which includes Connecticut, Massachusetts, and Rhode Island, were used to evaluate potential effects of future climate change. These analyses included a current period precipitation analysis, a climate change analysis using the CMIP tool, a DF and highway yield analysis using SELDM, and a stormwater treatment analysis using temperature change projections with an empirical sediment settling velocity equation.
Comparison of the magnitude of variations in current-period precipitation statistics with the variation in monthly and annual climate change projections indicates that geographic variation in SNE (space) exceeds projected climate-related variations for the geographic centroid of the SNE area (time). On average, climate-related precipitation volume changes were about 7% for the most likely scenario and 9% for the worst-case scenario. Monthly and annual precipitation changes do not capture the variability of individual events. However, the climate change variation is within the magnitude of variations in current-period precipitation statistics, which averaged about 46% for the different synoptic statistics. Therefore, a space-for-time approach should encompass the magnitude of projected changes in regional climate statistics.
The highway-runoff DF, yield, and stormwater treatment analyses indicated the sensitivity of results to different precipitation variables. The DFs, which are the ratios of highway runoff to downstream flow, were most sensitive to changes in average storm-event durations because longer events would allow for greater dilution into concurrent upstream flows. The DFs were weakly correlated to event volumes, which would disproportionally increase runoff from paved areas, and the time between storm-event midpoints (delta). Yield analyses for total phosphorus indicated increasing yields with increasing average annual precipitation, storm-event volume, and event duration and decreasing yields with increasing delta values. The stormwater treatment analyses indicate that sediment settling velocities would increase with increasing temperatures and the literature indicates that other treatment processes also may improve with increasing temperatures.
However, comparison of changes in runoff yields and sediment settling velocities with expected future conditions indicate that current data uncertainties far surpassed climate-related changes. Analyses indicate that variations in TP concentrations result in variations in long-term average yields that are 1.69 to 7.96 times the lowest yields simulated. In comparison, variations in precipitation statistics cause yield variations that ranged from 1.41 to 1.76 times the associated yields for each concentration value simulated. Similarly, variations in the grain size distributions and specific gravity of stormwater sediments produce changes in settling velocities on the order of 65 to 117%, whereas the temperature-related changes are expected to produce settling-velocity changes on the order of 5 to 10%.
This study does not question the potentially large climate-related changes in hydrologic and hydraulic variables expected to occur in the foreseeable future. Potential changes in the magnitude and frequency of infrastructure-damaging flood events are expected to be large without widespread mitigation measures. This study, however, does indicate that uncertainties in the current data and potential effects of land use change on stormwater quality and treatment variables are larger than the projected effects of climate changes on these variables, highlighting the importance of stormwater runoff data collection efforts. Efforts to better define variability in highway-runoff quality will reduce current uncertainty and efforts to redevelop the SYNOP software will facilitate analysis of synoptic precipitation trends with newer data.
Footnotes
Acknowledgements
The authors thank Robert W. Dudley, Kirk P. Smith, Paul M. Barlow, and Adria A. Elskus of the USGS and the three anonymous reviewers from the TRB standing committee on Hydrology, Hydraulics and Stormwater (AKD 50) for reviews that improved the quality of this paper.
Author Contributions
The authors confirm contribution to the paper as follows: study conception and design: G. E. Granato, L. C. Jeznach, and S. C. Jones; data collection: G. E. Granato, and D. Sharar-Salgado; analysis and interpretation of results: G. E. Granato, L. C. Jeznach, D. Sharar-Salgado, and S. C. Jones; draft manuscript preparation: L. C. Jeznach, G. E. Granato, D. Sharar-Salgado, S. C. Jones, and D. Imig. All authors reviewed the results and approved the final version of the manuscript.
Declaration of Conflicting Interests
The author(s) declared no potential conflicts of interest with respect to the research, authorship, and/or publication of this article.
Funding
The author(s) disclosed receipt of the following financial support for the research, authorship, and/or publication of this article: This research was funded by the FHWA Office of Project Development and Environmental Review.
Data Accessibility Statement
• The climate projection data are available on-line and may be retrieved from the Coupled Model Intercomparison Project (CMIP) Data Processing Tool by using information in this paper from the FHWA site ![]() , reference (
3
) in the paper;
, reference (
3
) in the paper;
• All the hydrologic and water quality data and the SELDM file used to do the stormwater simulations are available on the U.S. Geological Survey Science Base repository at ![]() , reference (
19
) in the paper; and
, reference (
19
) in the paper; and
• The settling velocity results can be reproduced by using the information in the paper and the equations available in Granato (
17
), which is available at U.S. Geological Survey Publication Warehouse repository at ![]()