
Abstract
In this paper we study the impact of having used an automated taxi (AT) or simply living in a city where ATs are operating on users’ preferences for and attitudes toward ATs. This paper aims then to contribute to the research on ATs and on the impact of experiencing innovations. Data were collected in three major cities in China where ATs were in operation (AT cities), and other major cities where only normal taxis (NTs) were operating (NT cities). A stated choice (SC) experiment was built that included level-of-services attributes, specific AT in-vehicle features, levels of AT adoption and customers’ reviews. In addition, a set of attitudinal statements was included to measure injunctive norms, hedonic motivation and trust. Hybrid choice models were estimated accounting for intra-individual correlation. Results show that living in a city where AT are operating does not affect the willingness to pay for travel and waiting time, which is an expected result. But those living in AT cities compared with those living in NT cities are willing to pay just half the amount to have the in-vehicle feature “change destination during the trip” and around three times as much for good reviews about ATs for trips less than 30 min. Interestingly, trust has a positive and significant impact on the choice of AT only for those living in NT cities, while hedonic motivation is significant only for those living in AT cities. Finally, we did not find differences between those who had used an AT and those who had never used it.
Keywords
With the rapid development of driving technologies (wireless communications, sensors, vehicle-to-infrastructure and vehicle-to-vehicle recognition systems communication, mapping and navigational technology), autonomous vehicles (also known as self-driving vehicles, driverless vehicles, automated vehicles, or robotic vehicles) are leading to a revolutionary change of the current transport system ( 1 – 3 ). In general, autonomous vehicle (AV) means a highly or fully automated vehicle which requires no manual steering. That is, it meets SAE Level 4, where the vehicle is capable of controlling all functions, but the driver can choose whether to switch the vehicle into this mode, or Level 5, where the automated driving requires absolutely no human attention and a steering wheel is optional ( 4 ). The application of AVs may become a reality in the future and, as stressed by many researchers ( 1 , 5 – 7 ), in particular automated taxis (ATs) have the potential to become a market player in the transport system. Compared with normal taxi (NT) services, AT services are on-demand mobility services with the potential to improve growing externalities of road traffic in modern cities ( 8 , 9 ): substantially enhancing environments, reducing requirements for parking space and increasing road capacity.
Nevertheless, if ATs are not adopted in the way that simulation studies assume they will be (all possible impacts are based on different assumptions on the levels of penetration rates), it will be less likely that all the estimated benefits that ATs would bring to current transport systems would occur. For example, according to Mena-Oreja et al. ( 7 ), the impact of ATs on road capacity turns to positive only when the penetration rate reaches an appropriate threshold value. The potential benefits of ATs on current transport systems crucially depend on how successful ATs will be in attracting customers.
Even though ATs have been tested and deployed in a relatively small scale around the world, as an emerging and highly innovative new mode of local passenger transport, they are still in the trial stage and AT services are not available for most of the public at the current stage. Consumers do not have much knowledge of ATs (or AVs in general) and have never (or very rarely in some trials) experienced them personally. As such, they have no preferences yet for this technology and this poses the question about the role of knowledge and experience (direct and indirect) in shaping consumers’ preferences and how to measure preferences for new products.
The literature on this topic is however very limited. The impact of direct and indirect experience on the preferences for innovations has been studied for the case of electric vehicles (EVs). Jensen et al. ( 10 ) collected stated choice (SC) data and psychological statements before and after respondents had tried an EV for three months and found that after the direct experience users showed higher preference for range, for example, but less skepticism, among other effects. Cherchi ( 11 ) still using data collected with an SC experiment showed that indirect experience (i.e., the experience reported by others who have used the EV) also affected customers’ preferences for EVs and their characteristics. Among the AV-related literature, some have focused on the change in psychological factors. After a field experience of a Level 3 AV by 300 students, Xu et al. ( 12 ) tested the changes of the students’ psychological factors toward using Level 5 AVs and re-ride Level 3 AVs, finding that this experience increased students’ trust and their perceptions of usefulness and ease of use of AVs. With regard to ATs, although no comparative results were reported, Dai et al. ( 13 ) measured the psychological determinants of continuous use intention among users who had experienced ATs and the results showed that perceived usefulness, perceived ease of use and service satisfaction, which were mediated by positive attitude toward use, played vital roles in intention to use ATs among experienced AT users.
In China, AT systems are commercially operating in Guangzhou and under trial operation in Changsha and Shanghai. To the best of our knowledge, however, no research has studied customers’ preferences for ATs in these contexts. Other than the direct and indirect experience, we envisage that also simply living in a city where ATs are operating could have an impact on customers’ preferences, even if they have not tried the ATs and have not received information from those who tried them. Just living in the city could represent a cue to respondents. In this paper we study the impact of having used an AT or simply living in a city where ATs are operating on users’ preferences for and attitudes toward ATs. This paper aims then to contribute to the research on ATs and the impact of experiencing innovations. Extensive research has been conducted to analyze the impact of attitudes on the intention to purchase and/or use AVs, but much less research has been done on using ATs. However, in general the constructs tested are those included in theoretical models such as the Technology Acceptance Model (TAM), the Theory of Planned Behavior (TPB) and their extensions. Within these theories, in this paper we focus in particular on injunctive norms, trust and hedonic motivation. According to Ribeiro et al. ( 14 ), these three latent constructs in particular play a role in the primary appraisal stage in the acceptance of AVs, that is, when individuals are analyzing the relevance and significance of using AVs for travel.
Finally, it is worth mentioning that while there is a relatively vast literature that reports willingness to pay (WTP) for owning AVs, few papers have instead discussed WTP for AVs used as shared vehicles. Among these studies, Yap et al. ( 15 ) computed the WTP for saving egress travel time when using AVs after multimodal train trips in the Netherlands. Also in the Netherlands, Correia et al. ( 16 ) analyzed and compared WTPs for saving travel time using two types of in-vehicle interiors: office-interior and leisure-interior. Kolarova and Cherchi ( 17 ) investigated the heterogeneous role of two psychological factors in calculating WTP for travel time saving when using AVs for commuting trips in Germany. In China, some scholars have investigated factors affecting preferences for AVs or shared autonomous vehicles (SAVs) ( 18 , 19 ) but these studies did not compute WTP.
The remainder of this paper is structured as follows. The next two sections present the survey instrument and a detailed analysis of the data collected. The fourth section describes the structure of the mathematical model used and the fifth section reports a discussion of the results of the model estimation and the computed WTP values. The final section summarizes the major conclusions.
Survey Instrument
The survey instrument consists of a questionnaire built to collect information that would allow identifying what affects consumers’ choice between a fully automated taxi (AT) and a normal taxi (NT). The questionnaire was organized in the following five major sections:
The survey was intended for taxi users, the screen-out questions in Section 1 were set up to include only respondents who have used a taxi in the last year and are more than 18 years old. A set of questions was included in Section 2 to measure the level of familiarity with AVs in general and in particular with the AT system operating in China. In this section, respondents were also given a description of what an automated vehicle is and the different levels of automation. On knowledge of automated vehicles, the questions included aimed to measure not only the level of knowledge but also from whom or where respondents gained the knowledge. In particular, respondents were asked the following four questions: (i) if they have heard of AVs, (ii) how familiar they were with the five levels of automation, (iii) if they heard of ATs being tested or operating in China and (iv) from whom/where they heard of ATs being tested or operating in China.
The SC experiment in Section 3 represents the core of the questionnaire. To customize the design, respondents were asked first to describe the last trip they made by taxi. This includes: origin and destination of the trip, purpose, what time and where they took a taxi, travel time, how they booked the trip, and so forth. The SC experiment consists of a binary choice between an AT and a NT, and it includes seven attributes. These are three level-of-service attributes (waiting time, travel time and fixed journey fare); two specific AT in-vehicle features attributes (namely the opportunity to talk with an operator and the opportunity to change the destination after having started the trip); and two attributes to measure the impact of social influence (number of customers and customer rating). Figure 1 reports an example of the task presented. More information on the attributes can be found in Yin and Cherchi ( 20 ).
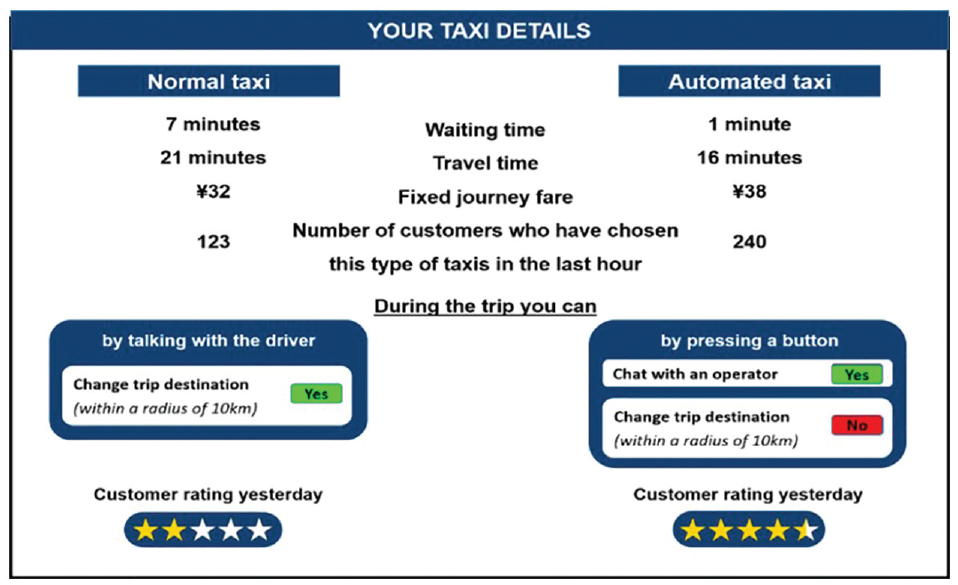
Example of choice task presented to survey participants (translated from Chinese).
To customize the SC design based on the last trip by taxi described by the respondent, a heterogeneous Bayesian efficient design was built for the following three segments: 5 km trips (for short trips between 2.5 km and 7.5 km), 10 km trips (for medium trips between 7.5 km and 12.5 km) and 15 km trips (for long trips between 12.5 km and 17.5 km). Each respondent was then presented with the scenarios of the segment that corresponded to the length of the last trip by taxi described.
For the heterogeneous Bayesian efficient design, each segment was weighted by a factor equal to 0.75 (for the 5 km segment), 0.2 (for the 10 km segment) and 0.05 (for the 15 km segment). These factors were computed based on the real travel distance distribution of the trips by taxi in China. To obtain the Bayesian priors, three fractional factorial orthogonal designs (one for each segment) were built and tested with a sample of 48 taxi users in China. A uniform distribution was used for all parameters to avoid extreme parameter values. Ngene ( 21 ) was used to generate the experimental design. This consisted of 12 scenarios for each segment randomly divided into two blocks of six scenarios each.
Section 4 focused on respondents’ socio-demographic and travel characteristics. These include gender, age, level of education, employment status and personal monthly disposable income, as well as frequency of using taxis, frequency of talking with the driver, if they like driver’s help with luggage, if they can use the taxi without help and whether they enjoy talking with the taxi driver. Finally, Section 5 was dedicated to the psychological statements identified to measure the three psychological constructs of interest: injunctive norms, trust and hedonic motivation. The following three statements, taken from Cherchi ( 11 ), were used for the injunctive norm (the second item was reversely scaled):
IN1: People who are important to me (friends, family) would approve of me using a fully automated taxi.
IN2: People who are important to me (friends, family) would think that using a fully automated taxi is not appropriate.
IN3: People who are important to me (friends, family) would think that more people should use fully automated taxis.
The following three statements were adapted from Venkatesh et al. ( 22 ) to measure the impact of hedonic motivation (the third item was reversely scaled):
HM1: I believe using a fully automated taxi will be fun.
HM2: I believe using a fully automated taxi will be pleasant.
HM3: I believe using a fully automated taxi without driver will be boring.
The following four statements were instead adapted from Choi and Ji ( 23 ) and Liu et al. ( 24 ) to measure the impact of trust (the first three items were reverse scaled):
T1: Overall, I do not trust fully automated taxis.
T2: I do not trust that fully automated taxis will be adequately supervised.
T3: I do not trust that a computer can drive a vehicle without assistance from the driver.
T4: I trust that I can relax while riding in a fully automated taxi without driver.
All statements were presented in a random order and some statements were reversely scaled. For all these statements, a seven-point Likert response scale was used, ranging from “strongly disagree” to “strongly agree.” The sample was implemented in SurveyEngine ( 25 ).
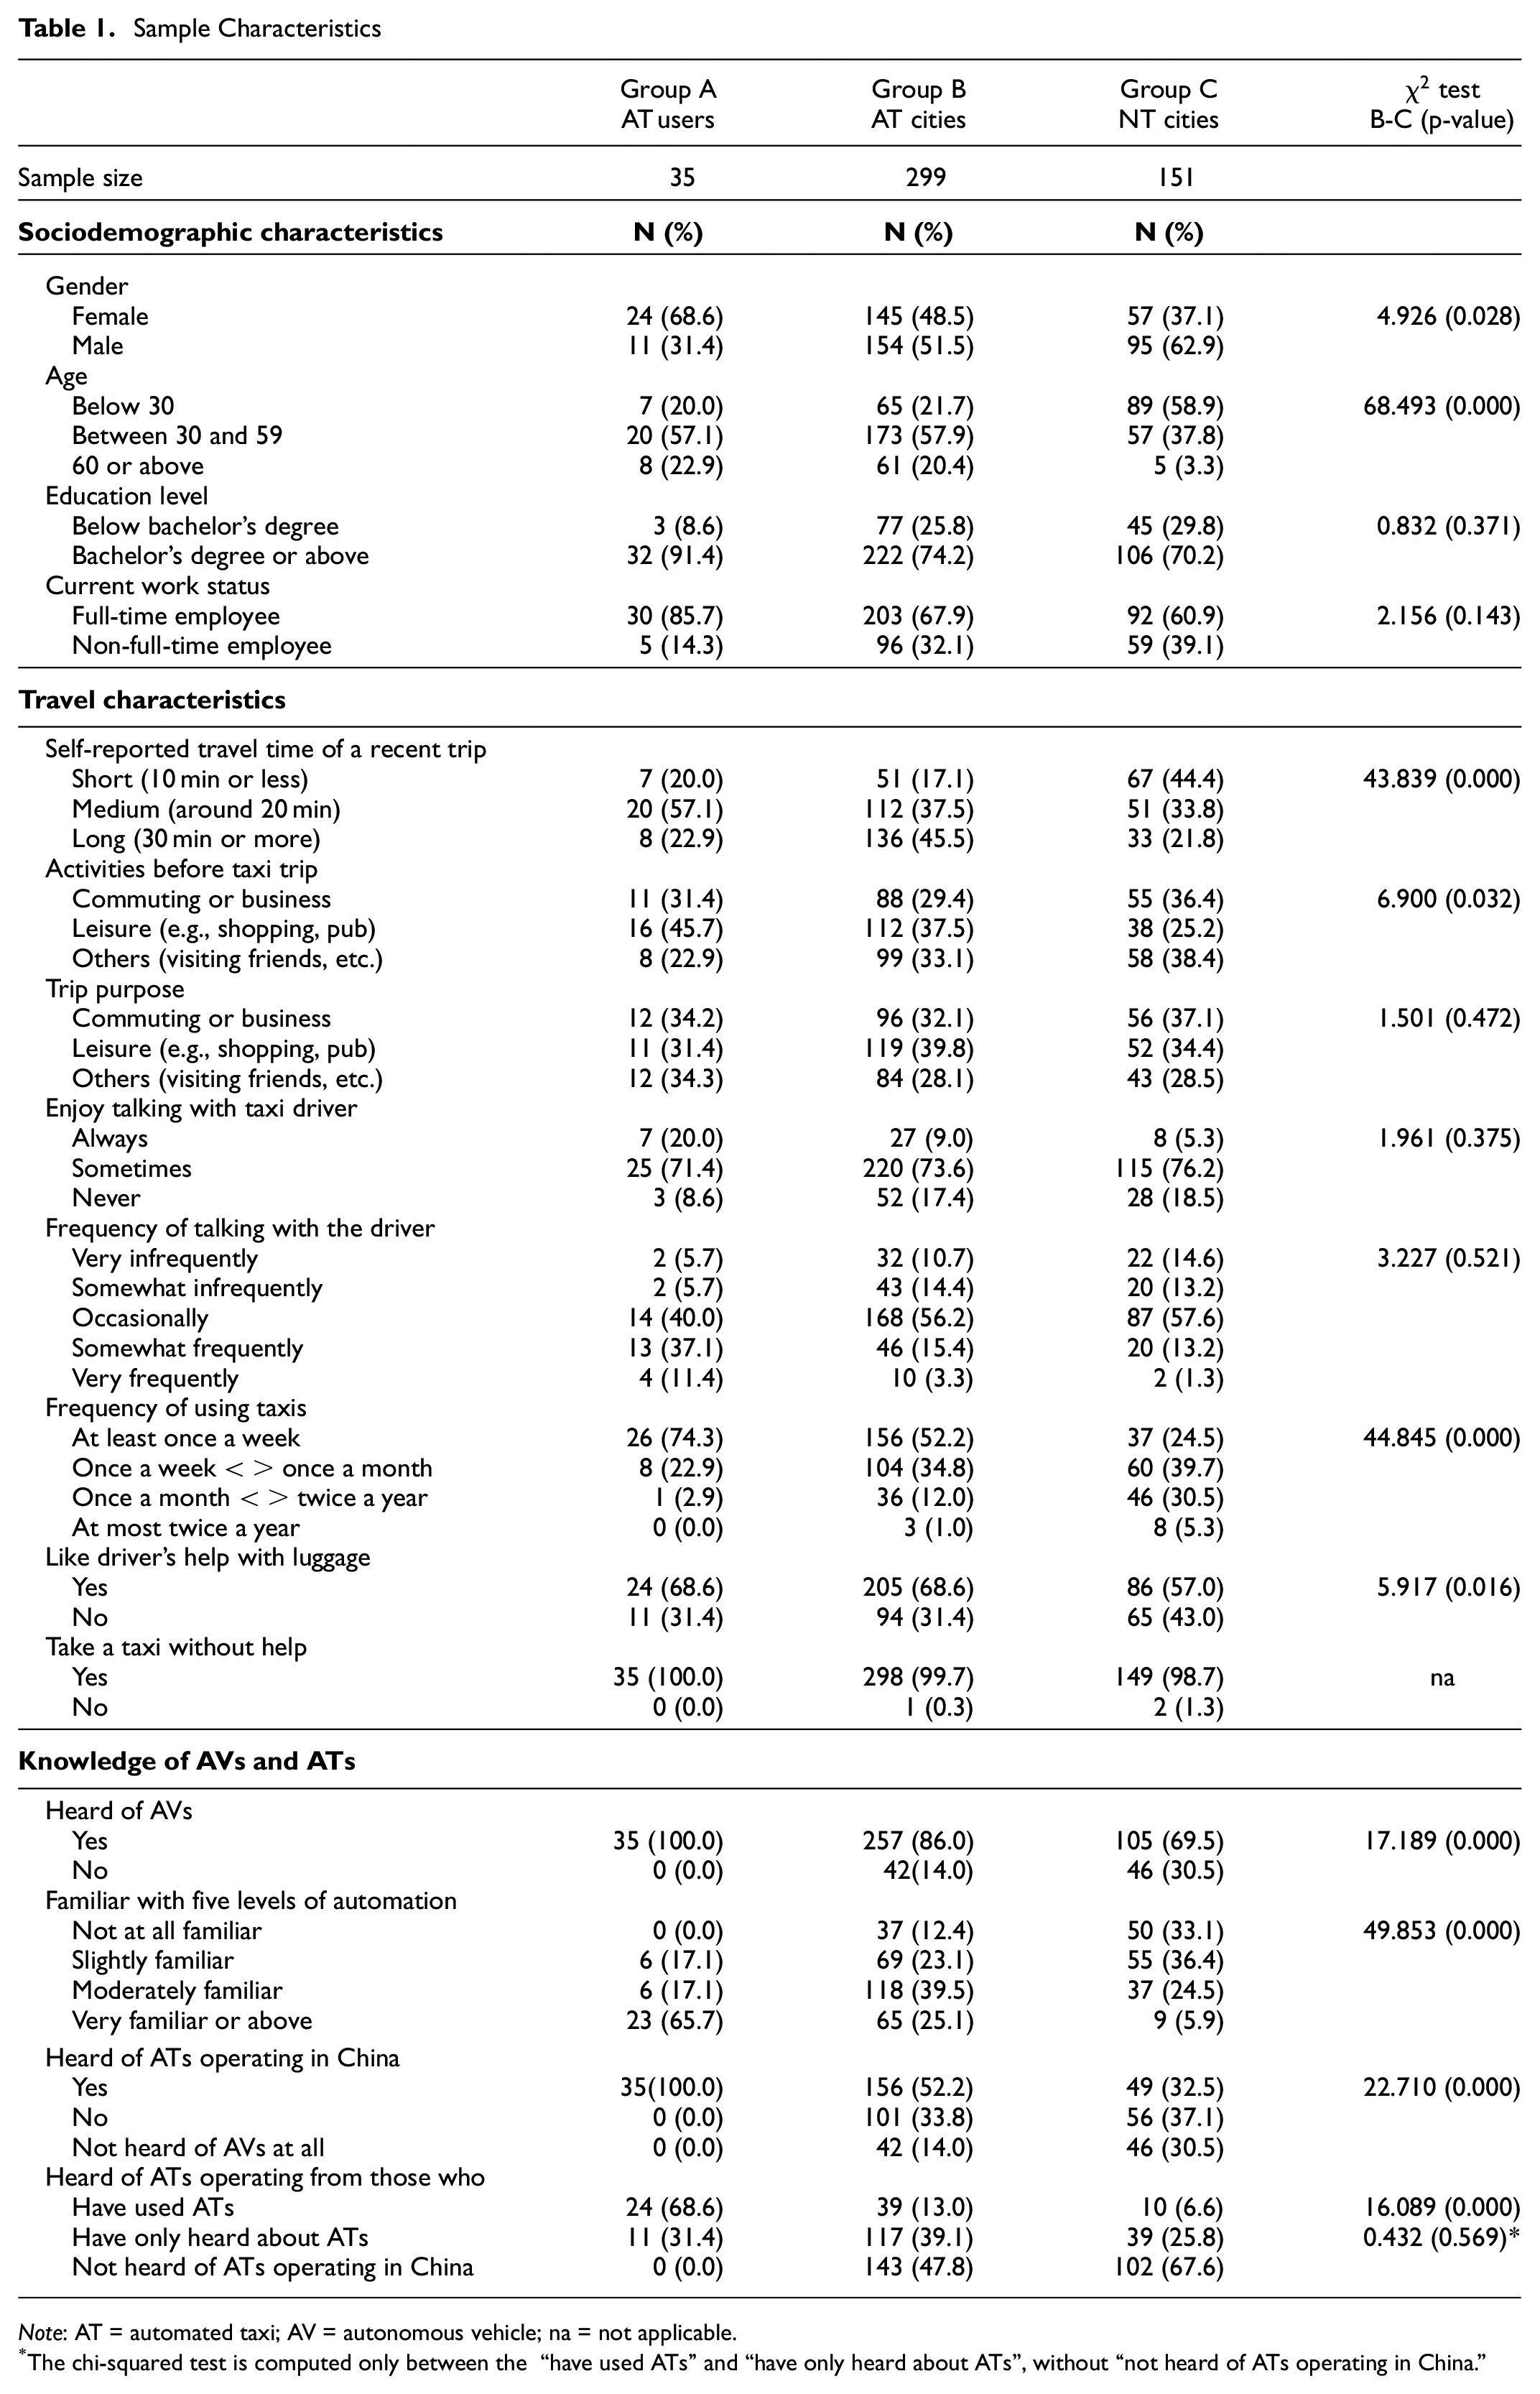
The sample was collected between March and April 2021 in China. A total of 633 participants joined the survey; 89 participants were screened out as they did not satisfy the requirements: (i) more than 18 years old and (ii) have used a normal taxi (NT) in the last year. A further 59 participants were excluded as they did not reply to the entire questionnaire. The final valid sample consists of 485 respondents. The completion rate for the survey is 76.6%. The final sample includes 151 respondents who lived in cities where ATs did not operate (defined as NT cities) and 334 respondents who lived in the cities of Guangzhou, Changsha and Shanghai where AT services were in operation. Among these latter, 299 respondents had not used ATs (this group of respondents is defined as AT cities) and 35 had used ATs (this group is defined as AT users). The final sample was largely recruited using the panel provided by SurveyEngine (about 70% of the participants) and a small proportion self-recruited participants (about 30%). The sample was initially selected randomly, and later the researchers tried to reach out specifically to those who had tried an AT, but this is still a niche group, and it was very difficult to contact them. A total sample of 2,910 pseudo-observations were available for modeling purposes.
Data Collection and Sample Characteristics
Table 1 illustrates a summary of the sample characteristics and the information collected. The sample has a high representation of young and educated people (the majority of participants are below 30 years old, have a bachelor’s degree and are full-time employed), but in the cities where AT is operating, the proportion of 30 years or older is twice (80%) that in the cities where AT is not operating (41%). Among those who tried an AT, two-thirds are female, compared with half of those who had never tried an AT even though they live in a city where ATs is operating and one-third of those who had never tried an AT and live in a city where AT is not operating. Finally, taxis in our sample are used more by university-educated people, and this effect is even more pronounced for AT users (more than 91% of AT users have a university degree compared with around 70% of non-AT users). The level of education is instead not significantly different among non-AT users whether they live in a city where AT is operating or not (p-value 0.371 > 0.05).
Sample Characteristics
Note: AT = automated taxi; AV = autonomous vehicle; na = not applicable.
The chi-squared test is computed only between the “have used ATs” and “have only heard about ATs”, without “not heard of ATs operating in China.”
With regard to travel characteristics, there is a significant difference between respondents depending on whether they live in cities where ATs operate or not. In particular, the proportion of respondents who use taxis frequently (at least once a week) and make long trips (30 min or longer) is higher in cities where ATs are operating than in the other cities. This effect is probably caused by the size of the cities. All the cities selected for recruitment of the sample in this study are large cities, but those where ATs are operating are even larger.
As expected, respondents living in AT cities have much more knowledge of AVs and ATs than those living in NT cities, and this difference is significant at 99%. Very few respondents (14%) have not heard of AVs at all (against 30% of the respondents living in cities where ATs are not operating). However, surprisingly, almost 48% of those living in cities where ATs do operate are not aware that the system is operating in their city.
Model Specification
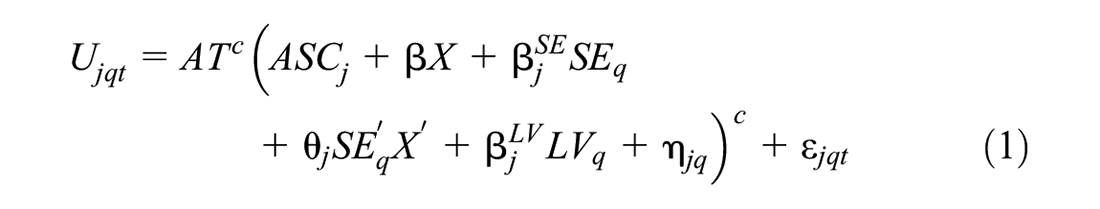
The proposed model framework is illustrated in Figure 2. A hybrid choice model (HCM) was used, where the discrete choice part is a mixed logit (ML) that allows us to account for the trade-off between attributes and includes panel effects, while the latent variable (LV) part allows us to account for the impact of the three latent constructs. Let
where
and

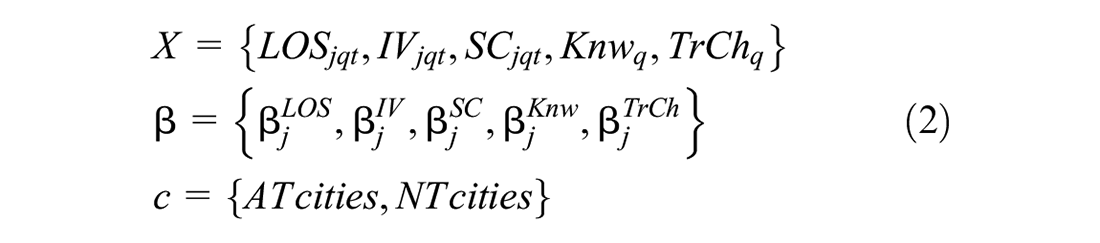
where LOS is a vector including the level-of-service attributes (travel cost, travel time and waiting time); IV is a vector including the in-vehicle features (change the destination, and chat with an operator, dummy variables whether the feature is active or not in the AT); SC is a vector including the normative conformity attributes (descriptive norm and customer reviews); SE is a vector of socioeconomic characteristics (e.g., age, gender, etc.); Knw is a vector including the attributes related to the level of knowledge of AVs and ATs (e.g., familiarity with the five levels of automation, etc.); TrCh is a vector including travel characteristics (e.g., frequency of taxi usage, etc.).
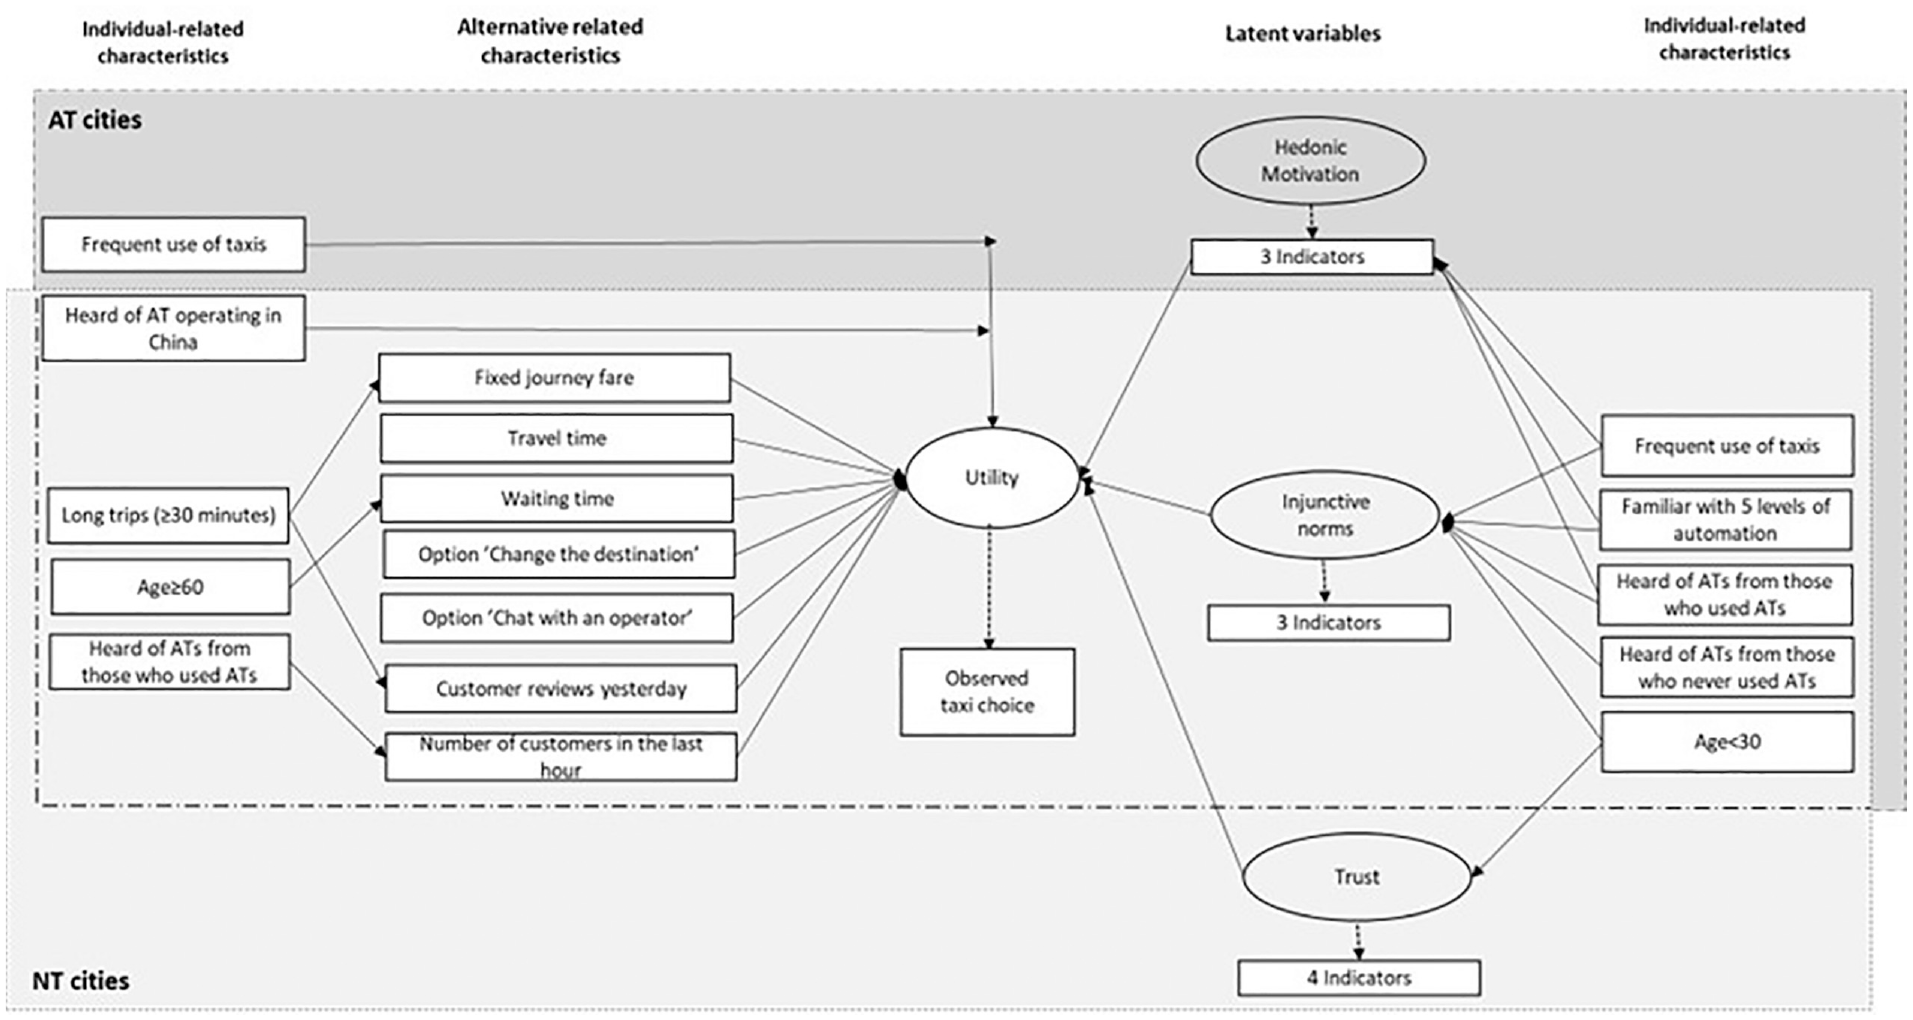
Conceptual framework for taxi choice decision accounting for presence of automated taxis (ATs).
ATc is an indicator to make the coefficients specific between AT cities and NT cities. ASCj are the alternative specific constants.
The structural equation of the latent variables is defined as:
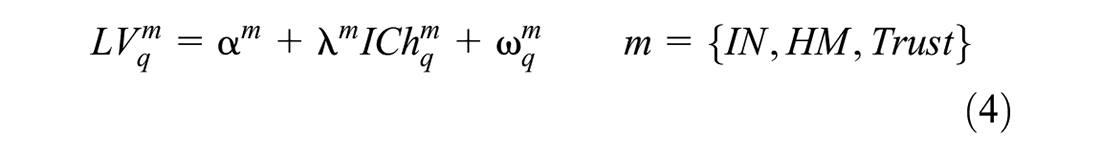
where

where
The distributions of the mth latent variable and of its indicators are:
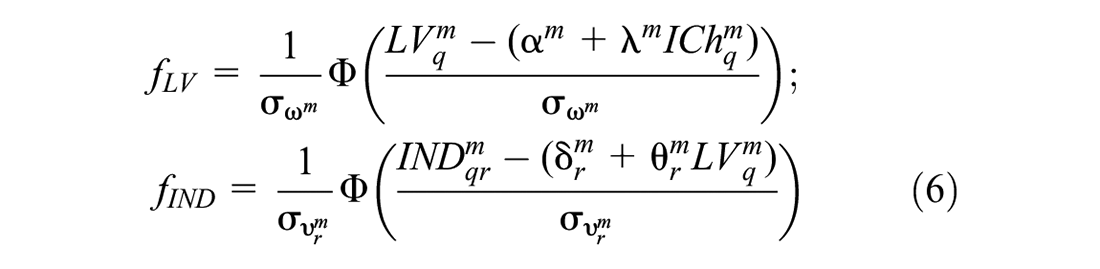
where
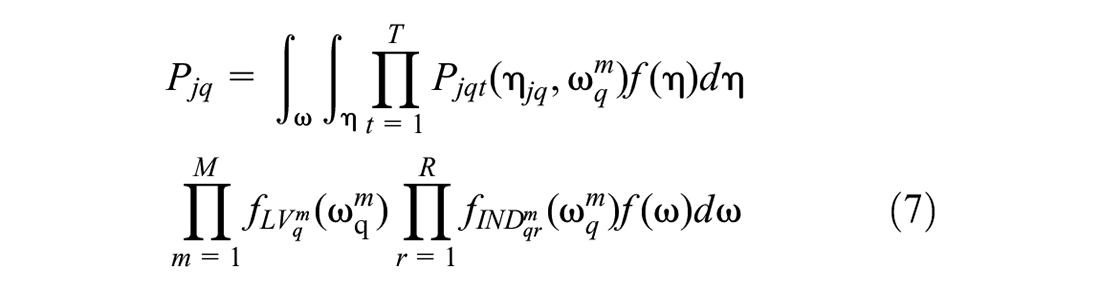
Models are estimated by maximum simulated likelihood estimation, using PythonBiogeme ( 26 ).
Model Results
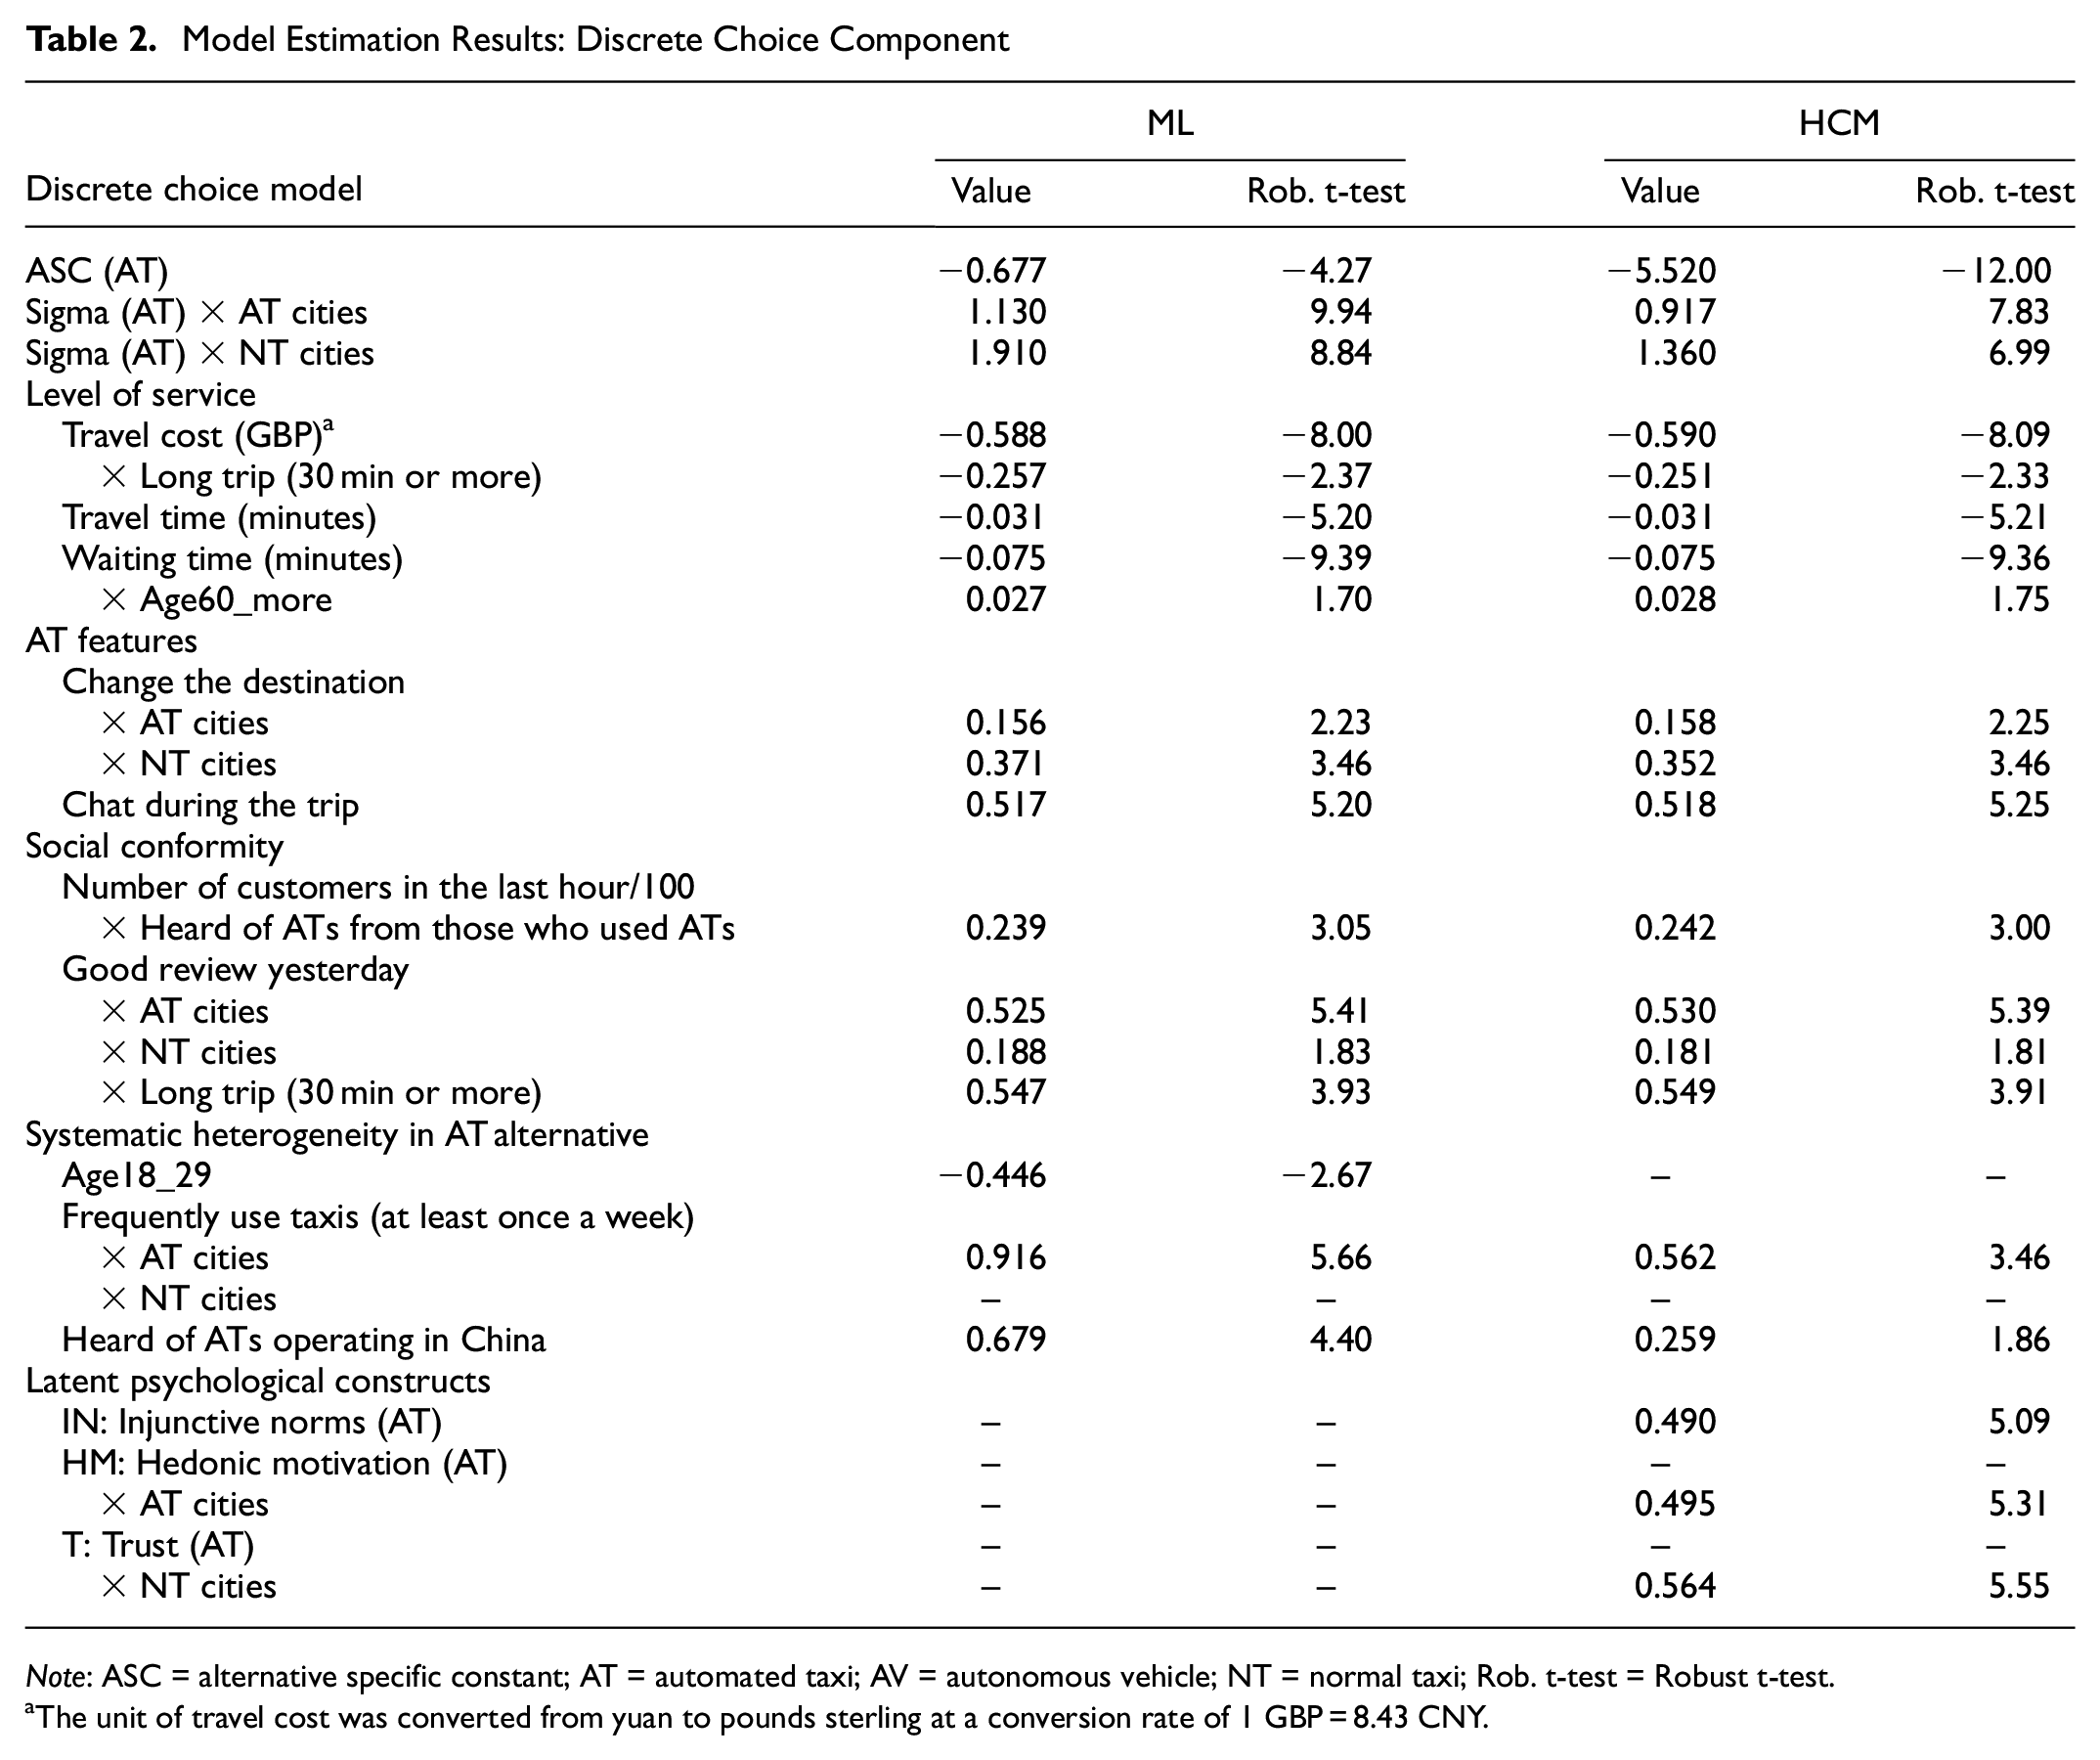
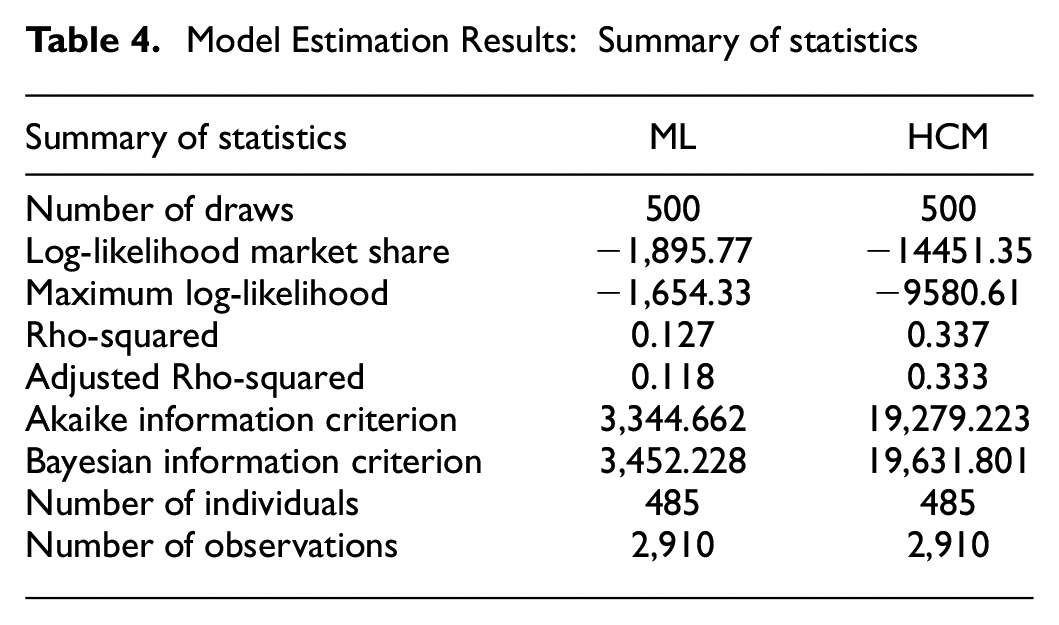
The final dataset used for the model estimation consists of 2,910 pseudo-observations. Table 2, Table 3 and Table 4 report the model results for a ML model with panel effects, estimated as a reference model, and a HCM estimated using the specification presented in the previous section. All coefficients were tested specifically between AT cities (i.e., for respondents living in cities where ATs are operating) and NT cities (i.e., for respondents living in cities where ATs are not operating). Table 2 and Table 3 report only those coefficients that are significantly different at more than 80%. The other coefficients were defined as generic between the two groups.
Model Estimation Results: Discrete Choice Component
Note: ASC = alternative specific constant; AT = automated taxi; AV = autonomous vehicle; NT = normal taxi; Rob. t-test = Robust t-test.
The unit of travel cost was converted from yuan to pounds sterling at a conversion rate of 1 GBP = 8.43 CNY.
Model Estimation Results: Latent Variable Component
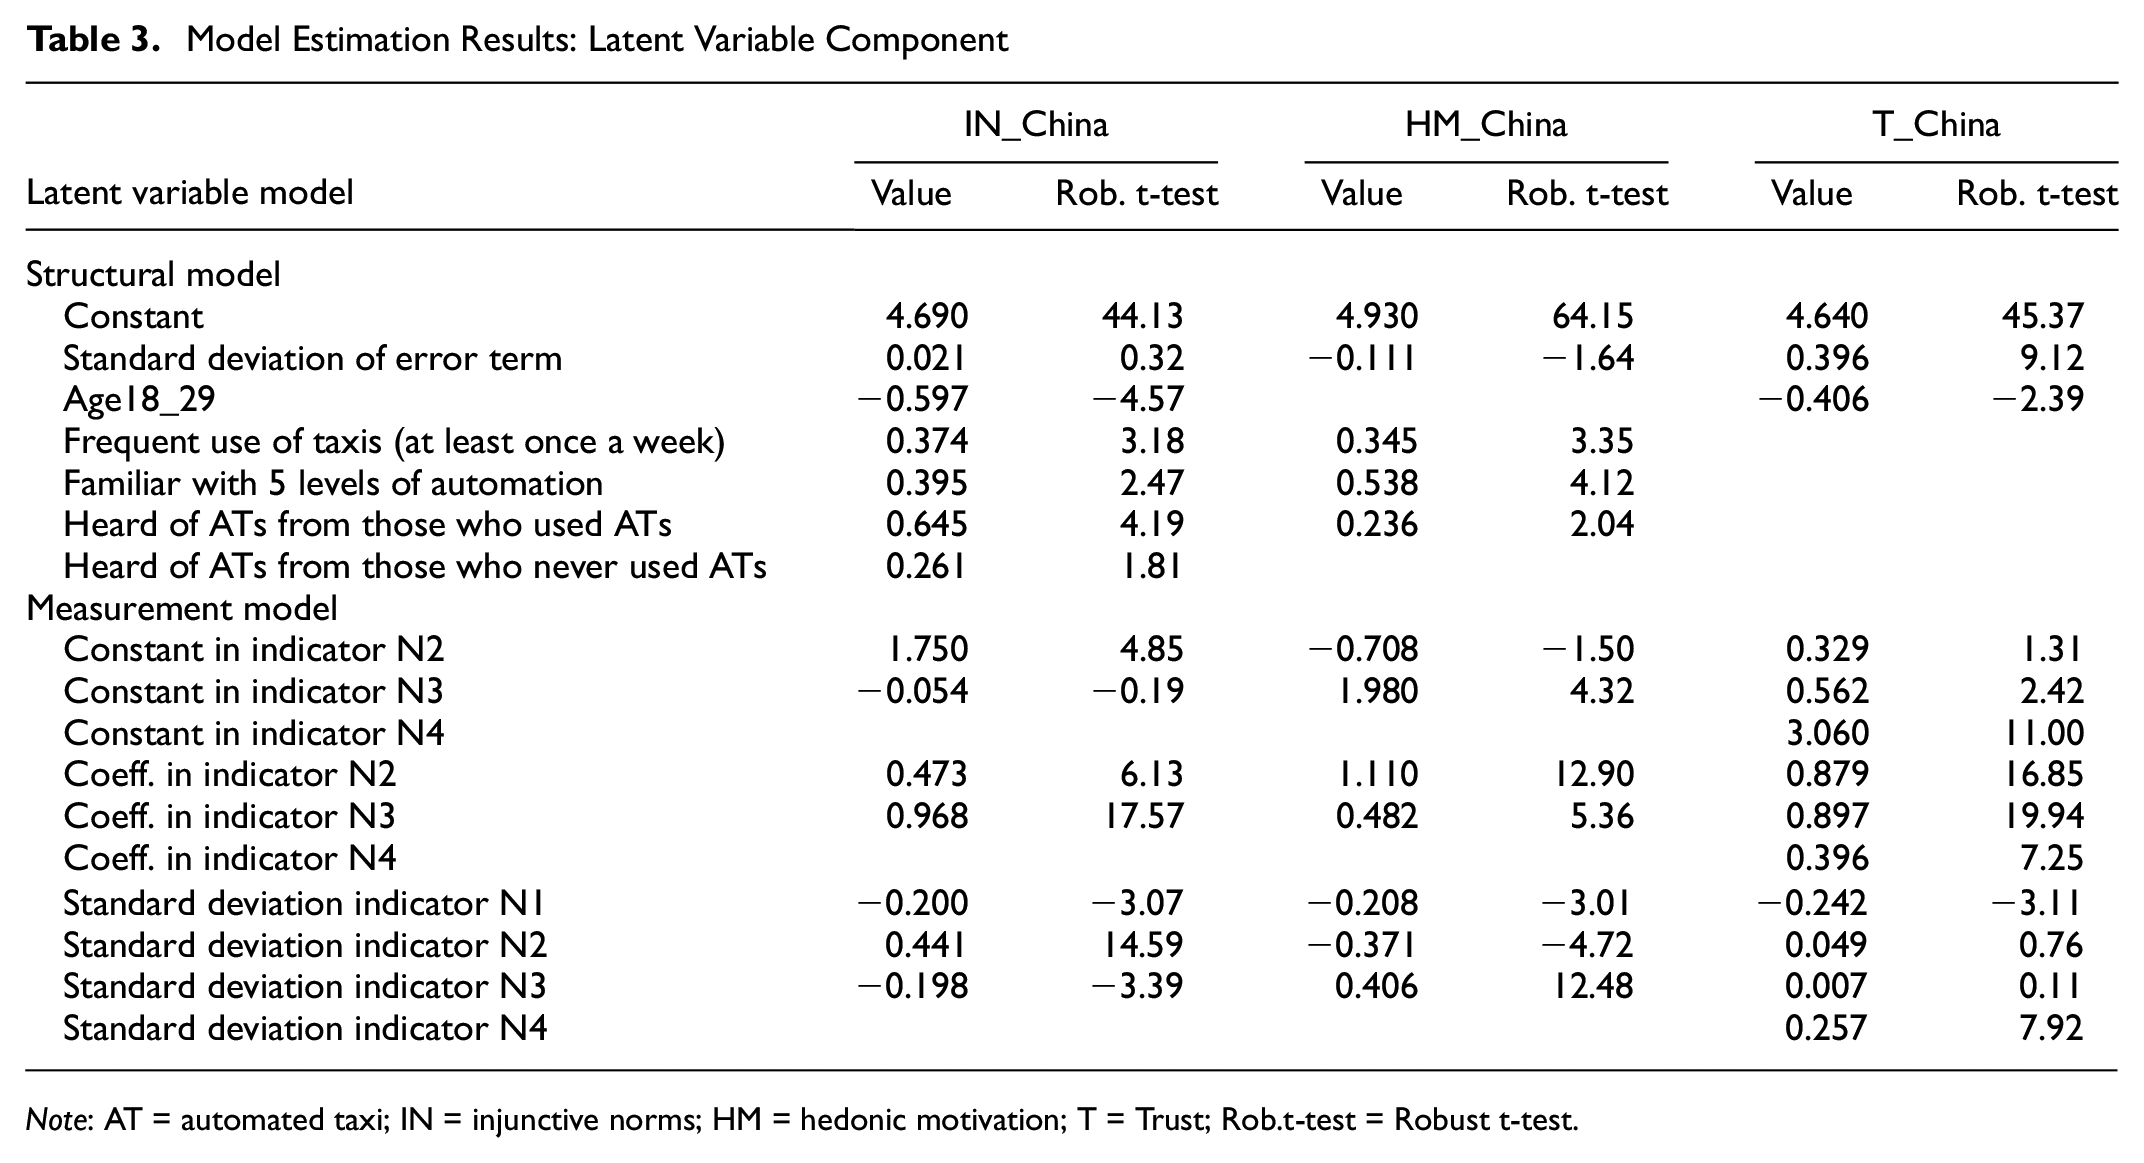
Note: AT = automated taxi; IN = injunctive norms; HM = hedonic motivation; T = Trust; Rob.t-test = Robust t-test.
Model Estimation Results: Summary of statistics
We first note that the model only includes the effect of AT cities and NT cities. This is because we could not find any significant differences between AT users and AT cities, that is, between those living in cities where the AT is operating, whether they have used AT or not. This result was not expected, but since the subsample of AT users is small, it is not possible to conclude with certainty that having used an AT does not affect customers’ preference. Looking at the models in Table 2, we note that the mixed logit and the HCM return the same estimates except for the ASC and the category of respondents who had heard of ATs operating in China. This makes sense because the latent variables in the HCM are summed into the utility of AT, which of course directly affects the ASC and any category that has a direct impact on the preference for one alternative over the other. Apart from that, all other results are identical. Comments will then be reported only for the HCM.
As expected, the existence of AT services in the city where respondents live does not have any impact on the marginal utility (MU) of the level-of-service attributes (travel cost, travel time and waiting time). Interestingly, but not expected, living in a city where ATs operate does not have an impact either on the preference for the in-vehicle feature “chat with an operator” (the H0 is rejected at 28% in a two-tailed test). This may be because the ATs currently operating in China still have a safety driver, so there is a physical person in the car even though they are not actually driving. On the other hand, respondents living in NT cities have much lower (around half) MU for the option “change the destination” than those living in AT cities (the MU is different at 88% in a two-tailed test, t-test = 1.56). Those living in AT cities are more familiar with both AVs in general and ATs specifically than those living in NT cities. They use also taxis more frequently. They might also be familiar with traditional taxis and may be less likely to have the need/interest to change the destination selected during the trip.
Interestingly, the descriptive norm “number of customers in the last hour” was significant only for the respondents who had heard about AT from someone who has tried it. We expected a different impact between AT and NT cities, but we did not find any statistically significant difference. It seems that the intention of current adoption depends on word of mouth but not on having the AT services operating in the city where a participant lives.
Interestingly, “AT cities” (i.e., living in a city where ATs are operating) was found to have a significant impact on the MU of “good review yesterday.” The assumption that the MU of good review between AT cities and NT cities is equal is rejected at 99% (t-test = −2.56), and the MU of good review yesterday in AT cities is about 2.5 times that of NT cities. This result makes sense because respondents from AT cities have of course a higher possibility to access and use ATs, as an alternative travel mode. Even if they have not used an AT personally, customer reviews provide them with stronger hints or cues to assess and compare the quality of these two types of taxi services, because they know that this review comes from real customers in their cities.
Finally, the results in Table 2 show that the impact of having heard of AT operating on the preference for AT is not different whether respondents live in AT cities or NT cities (H0 is rejected at 23%). This result is not in line with the assumption that living in a city where ATs are operating provides stronger cues, as discussed for customer reviews. However, the difference is that a review implies an evaluation (positive or negative) while having only heard of it from others is a piece of “neutral” information. The other three variables measuring knowledge of AVs and ATs (heard of AVs, familiarity with five levels of AVs and from whom they heard about ATs) were no significant in the entire Chinese sample, nor among respondents living in AT cities or NT cities. Additionally, the direct impact of presence of AT service on the preference for AT use was tested but it was not significant at 95%.
As shown in Table 2, we found that those who used taxis at least once a week had a higher preference for ATs than for NTs. However, after including the impact of AT presence, results show that only those respondents from AT cities who frequently use taxis have a significantly (99%) positive preference for ATs. This is in line with the results from the crosstab descriptive analyses which report that 65% of those who used taxis at least once a week in AT cities choose ATs while less than 50% of those who live in NT cities would choose ATs.
Finally, for the three latent psychological constructs, we note that injunctive norms are highly significant for respondents living in both AT and NT cities, but not significantly different between them (t-test for generic injunctive norms coefficients between AT cities and NT cities is rejected at 9%). On the other hand, the other two latent constructs are significantly different from zero only for one category: hedonic motivation is significant only for respondents living in AT cities, while trust is significant only for those living in NT cities. It is plausible that those who live in NT cities do not have the possibility to see ATs operating, and then perceived trust as important. On the contrary, those living in AT cities have probably seen ATs circulating, though they have not used them in person, and could directly see that ATs can be trusted.
Table 5 reports the mean value of WTP computed for all the attributes estimated with the HCM reported in Table 2. It also reports t-tests and confidence intervals. These are computed using Monte Carlo simulations with 5,000 draws from a multivariate truncated normal distribution. We note that all WTPs are highly significant at more than 95% with the exception of “good review” in NT cities.
Willingness to Pay: Mean Values, T-Tests and Confidence Levels
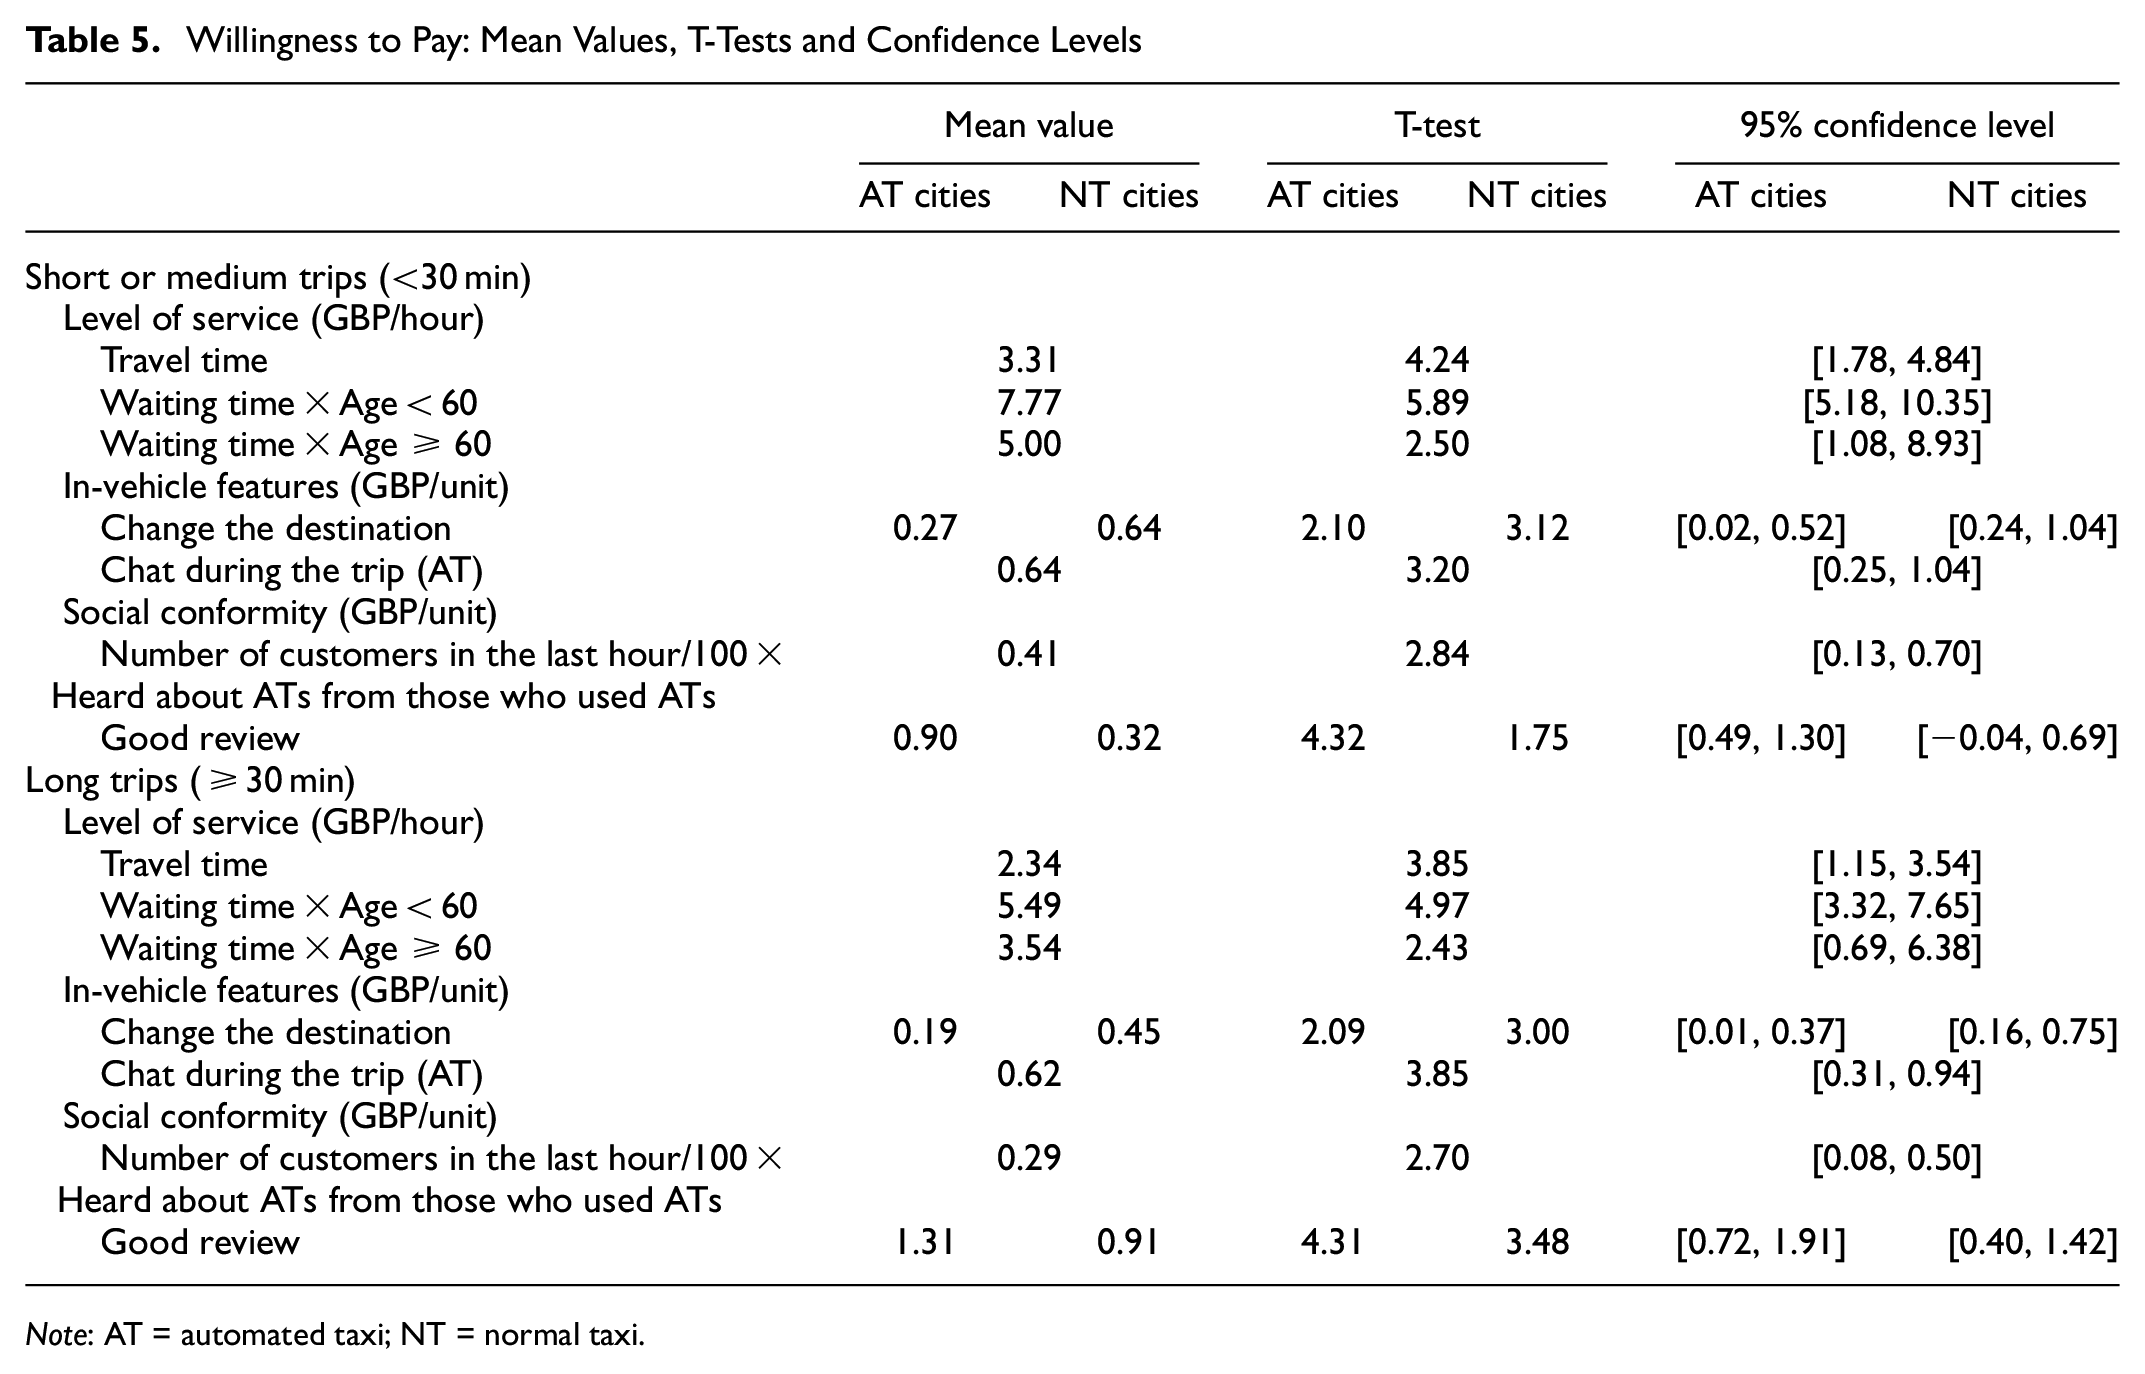
Note: AT = automated taxi; NT = normal taxi.
Looking at the WTPs that are different between AT cities and NT cities, we note that respondents from NT cities, compared with respondents from AT cities, are willing to pay more than twice the amount to have in the taxi the option to “change the destination,” which is equivalent to saving about 11.5 min of travel time. For “good review yesterday,” we can see that for short or medium trips, respondents from AT cities are willing to pay almost three times (£0.90/unit) more than respondents from NT cities. This is equivalent to the amount of money they are willing to pay to save about 16 min of travel time. For long trips, respondents from AT cities are willing to pay £1.31 to use taxis with good reviews, this value is equivalent to save 33 to 34 min of travel time, which is about 44% higher than the amount that respondents from NT cities are willing to pay to use taxis with good customer reviews.
Looking at the WTP for travel time, we note that this is not different between AT and NT, but it decreases with the distance traveled. This is because we found that the MU of travel cost (fixed journey fare) is higher (in absolute value) for long trips (30 min or longer) than for short trips (less than 30 min).
The WTP computed in our Chinese sample (£2.34 for saving one hour of travel time in long trips and £3.31 in shorter trips) is lower than the values found in the literature ( 15 , 27 ), but we note also that these do not refer to Chinese contexts. It is interesting to note that WTP for saving travel time in AVs or SAVs varies considerably among studies probably because of different contexts and different definitions of AVs (some studies focus on AT, others on SAVs, etc.). Kolarova and Cherchi ( 17 ) compared WTP for using privately-owned AVs and SAVs in Germany, finding that the computed average value of travel time savings for privately-owned AV is slightly higher (about 18% or 28% depending on whether the two psychological constructs are considered) than for SAVs. Another reason can also be the designs; studies use different alternatives and different levels and these affect the WTP estimated ( 28 ). Finally, differences in the WTP also probably occur because AVs are new alternatives, unknown by the respondents, and this might carry some bias in the estimation. More discussion on the value of travel time savings and the value of waiting time savings can be found in Yin and Cherchi ( 20 ).
Conclusion
This paper has addressed the important research question whether having used an AT or simply living in a city where ATs are operating and available to the public has impacts on the preference for ATs and their characteristics, as well as users’ attitudes toward ATs. Indirect experience refers to the experience made by others and communicated to the respondents either via word of mouth, or official information channels or other forms. In this research, we extended this analysis by considering the impact of simply living in a city where ATs operate. We hypothesize that, even if nobody provides participants with the necessary information, just living in the city could represent a cue or hint to respondents.
Results confirm that there is an impact, though not as pronounced as we would originally expect. First of all, we note that having used an AT does not seem to change consumers’ preferences for ATs and their characteristics. This might be attributable to the small sample of AT users available or the current ATs operating in China having a safety driver which probably makes the experience of driving in an AT similar to driving in a NT. On the other hand, AT users are early adopters, it is expected their preferences will be different from non-AT users, in particular those who live in a city where ATs are operating but choose not to use an AT. Further research in this area is needed to test if our initial results are confirmed, after controlling for the various aspects (early adopters, safety driver, etc.) that might have an impact on the users’ preferences.
Results confirm, however, that even simply living in a city where ATs are operating does have an impact on the preference for some specific features of the ATs, like having the option to change the destination after having started the trip (if the AT trip is pre-booked changing the destination might not be an option) and if the AT services have good reviews. Results show that those who live in cities where ATs are operating value the option “change destination during the trip” only half as much as those living in cities where ATs are not operating. This specific result is probably not from the cue provided by having ATs in the city, but more that those who live in AT cities use NTs more often than those who live in NT cities and probably do feel more confident in the destinations they select. These results confirm the role of indirect experience in the adoption of innovation, and open up a new area of research, showing initial evidence that even without providing them with specific information, the simple existence of the innovation in the city has an impact on users’ preferences. In the same line of the research carried out in this paper, other characteristics of the AT service that would be interesting to test are, for example, safety within the AT and between ATs and pedestrians or normal cars.
The impact on the preference of good reviews is instead attributable to the cue provided by simply living in a city where ATs are operating. If reviews are good, respondents from AT cities are willing to pay almost three times as much as respondents in NT cities to use ATs if the trip is less than 30 min and approximately 1.5 times if the trip is 30 min or longer. Respondents from AT cities have of course a higher possibility to access and use ATs. Even if they have not used ATs personally, customer reviews provide them with a stronger hint or cue to evaluate and compare the quality of these two types of taxi services, because they know that the reviews come from real customers in their city.
Finally, it is interesting to note that having ATs operating in the city where participants live seems also to have an effect on users’ trust in ATs and their hedonic motivations. Results clearly show that trust has a positive and significant impact on the choice of AT only for those who live in NT cities, while hedonic motivation is significant only for those living in AT cities. In this paper, we speculated that trust could increase by simply being close to the innovation even without having directly or indirectly experienced it. This effect could be linked to the level of knowledge of ATs, or to other apparently unrelated factors, such as previous experience with accidents. Further research should be conducted to investigate better the reasons behind the different impact of trust and hedonic motivation in AT and NT cities.
Finally, on the three latent psychological constructs, we note that injunctive norms is highly significant for respondents living in both AT and NT cities, but not significantly different between them (t-test for generic injunctive norms coefficients between AT cities and NT cities is rejected at 9%). On the other hand, the other two latent constructs are significantly different from zero for only one category: hedonic motivation is significant only for respondents living in AT cities, while trust is significant only for those living in NT cities. It is plausible that those who live in NT cities do not have the possibility to see the ATs operating, and then perceived trust as important. On the contrary, those living in AT cities have probably seen AT circulating, though they have not used them in person, and could directly see that AT can be trusted.
Footnotes
Author Contributions
The authors confirm contribution to the paper as follows: study conception and design: H. Yin, E. Cherchi, D. Nettle; data collection: H. Yin; analysis and interpretation of results: H. Yin, E. Cherchi; draft manuscript preparation: H. Yin, E. Cherchi, D. Nettle. All authors reviewed the results and approved the final version of the manuscript.
Declaration of Conflicting Interests
The author(s) declared no potential conflicts of interest with respect to the research, authorship, and/or publication of this article.
Funding
The author(s) received no financial support for the research, authorship, and/or publication of this article.