
Abstract
The effects of pavement characteristics on rolling resistance of heavy vehicles have gained more interest in recent years. Rolling resistance is the result of the combination of independent (but sometimes correlated) physical phenomena that dissipate energy, which can be regrouped under three different main themes. Road roughness (wavelengths between 0.5 and 50 m) causes movements in vehicle suspensions, which dissipate energy. Pavement macrotexture (wavelengths between 0.5 and 50 mm) creates additional viscoelastic deformations on tire treads. The viscoelastic behavior of the flexible pavement structure, which is referred to as structure-induced rolling resistance, is responsible for a perpetual upward slope perceived by heavy vehicle tires. Secondary aspects can also affect rolling resistance, such as road wetness and snow. This paper addresses each of these three main phenomena from three angles of analysis: (1) theoretical modeling, (2) laboratory experiments, and (3) in situ measurements. The literature on road roughness and structure-induced rolling resistance modeling is extensive compared to macrotexture-effect modeling, as the underlying physical mechanisms are still not well understood. There is, however, strong experimental evidence that the pavement macrotexture can significantly affect rolling resistance, but these studies are mostly related to cars. There are many in situ approaches, but the results are usually based on an indirect method and the different studies are difficult to compare and sometimes inconsistent. It appears that the bottleneck of scientific research on this topic is the fundamental inability to measure the rolling resistance of heavy vehicles with a direct in situ approach under real driving conditions.
Keywords
The transport sector accounts for a large part of greenhouse gas (GHG) emissions worldwide ( 1 – 3 ). For example, 24% of the GHG emissions in Canada were caused by the transport sector in 2020 ( 2 ), representing 159 megatons of carbon dioxide equivalent emitted. This quantity includes the temporary diminishing effect of the pandemic on the economy. In Canada between 1990 and 2020, GHG emissions from heavy vehicles more than tripled ( 2 ).
One of the main sources of energy loss in a heavy vehicle is rolling resistance (RR). It is estimated that more than 50% of the dissipated mechanical power of a 44-ton heavy vehicle traveling at 90 km/h on a flat highway is caused by RR forces ( 4 ). The majority of this energy loss is caused by the viscoelastic behavior of tires ( 5 ). It is believed that this effect represents 85%–90% ( 6 ) or 80%–95% ( 7 ) of total RR. As optimizing tire design and reducing RR (specifically for heavy vehicle tires) represents a competitive advantage for tire manufacturers and heavy vehicle operators, this topic is already widely investigated in the scientific literature and in the industry ( 8 – 16 ). A less known aspect of the question concerns the influence of pavement properties on the RR of heavy vehicles. Although this influence on RR is less important than the tire effect when a heavy vehicle is analyzed individually, the roadway systematically affects all heavy vehicles in circulation. This means that a small difference in RR caused by the pavement can produce a significant variation in fuel consumption and GHG emissions at the scale of the road network ( 17 ).
Also, the lack of competitive advantage hinders the industry interest in researching this topic, as it requires a strategic public intervention. Indeed, choosing a low RR heavy vehicle tire is an individual choice, but road network management optimization requires a more collective and organized approach.
In this context, policymakers need to establish laws and practices to optimize road network management. For instance, this can take the form of scenario simulations of road network management with respect to GHG emissions ( 18 , 19 ). Indeed, many government agencies have conducted studies in recent years to investigate the effects of pavement characteristics on the RR of heavy vehicles, vehicles in general, or both ( 20 – 24 ). This includes the potential difference between flexible (e.g., asphalt concrete [AC]) and rigid (e.g., cement concrete) pavements in regards to RR ( 25 ). Moreover, some authors have begun to analyze the life cycle of pavements, taking into account the effect of pavement characteristics on vehicle fuel consumption ( 19 , 26 , 27 ).
The purpose of this literature review is to present a detailed and precise overview of pavement contribution to heavy vehicle RR by referring explicitly to the main physical phenomena involved: road roughness, macrotexture, and structure-induced rolling resistance (SRR). The literature about each of these phenomena is presented in three angles of analysis: theoretical modeling, laboratory experiments, and in situ measurements.
Theoretical Modeling
Road Roughness
Road roughness refers to the unevenness of the pavement, which can dynamically interact with vehicle suspensions (wavelengths between 0.5 and 50 m) ( 28 ). In the 1970s, road roughness was theorized as realizations of homogeneous and isotropic two-dimensional Gaussian random processes. The assumption of a stationary random process allows expressing longitudinal road profiles with their corresponding power-spectrum density (PSD) ( 29 ). From this, the idea to classify road profile quality with PSD characteristics emerged ( 30 ). There are now many PSD equations of various complexity to represent longitudinal profiles for road roughness approximations ( 31 ). PSD representations of road roughness are now commonly used to classify road roughness quality, such as in the ISO 8608 standard ( 32 ).
RR force associated with suspension motion and tire RR force exclusively caused by road roughness were quantified by Lu ( 33 ) with road roughness PSD representation and a quarter-car model. It was shown that the former is always much larger than the latter. Moreover, tire RR force exclusively caused by road roughness was found to be negligible, except for “very poor” roads ( 33 ).
Smith and Swift ( 34 ) investigated the importance of vehicle characteristics on suspension power dissipation (RR force multiplied by vehicle speed) using a quarter-car model and a road disturbance whose velocity profile was white noise. It was demonstrated that power dissipation is proportional to tire vertical stiffness and noise intensity, but is independent of all masses and other suspension parameters ( 34 ). The extension of this result to a half-car model for both the pitch and the roll planes was also considered. It was found from numerical examples that the broad conclusion remains. A more generalized formulation was later presented that is also valid for suspension systems equipped with nonlinear dampers ( 35 ). However, the assumption of linear stiffness within the tire and true Brownian motion is necessary for the exact result to hold.
PSD representation has been frequently used by the Massachusetts Institute of Technology (MIT) Concrete Sustainability Hub to develop a mechanistic model to calculate the power dissipation from vehicle suspension in relation with well-known road-roughness parameters ( 36 – 38 ). More specifically, the PSD of road roughness was expressed as a function of the International Roughness Index (IRI) and the waviness number, the latter being the slope of the PSD in a log-log scale ( 36 ). The transfer function between road roughness and suspension motion was determined from a quarter-car model with parameters related to different vehicle types. PSD representation allowed the use of random vibration theory to link the mean square of suspension motion with both the dynamic properties of the vehicle and road roughness PSD parameters. The sensitivity analysis of the model showed that the IRI is the main engineering parameter driving roughness-induced excess fuel consumption (EFC) ( 36 ). However, at least a second road roughness parameter (the waviness number) is needed to characterize this effect ( 36 ). It should be mentioned that this mechanistic model predicts a quadratic relationship with the IRI in contrast with the HDM-4 empirical linear model ( 39 , 40 ). The latter is obtained from in situ measurements and draws a linear relationship between the IRI and the EFC ( 41 ). The MIT group showed the importance of considering the non-Gaussian distribution of the road roughness profile to represent bumps and valleys ( 37 ). Indeed, translation process theory was used to represent road roughness as a non-Gaussian stochastic process. It was found that this addition to the method had no effect on the scaling relationships of energy dissipation, which are related to road surface parameters and vehicle dynamic properties. The consideration of non-Gaussian distribution had only an effect on the multiplicative factors relating energy dissipation and the various parameters of the model. A few years later, a closed-form solution of MIT’s mechanistic model was proposed where only two free parameters need to be calibrated to match the HDM-4 empirical linear model: the waviness number and stiffness ratio, the latter representing the ratio between the tire and suspension stiffness ( 38 ). It was found that the stiffness ratio of a heavy vehicle must be 18.2 for the mechanistic model to match the HDM-4 empirical linear model. However, it should be noted that these dynamic properties do not seem to be representative of typical heavy vehicle suspensions, which should have a stiffness ratio of around 1.75 ( 42 ).
Kim et al. ( 43 ) have reused the above approach by developing a new formulation and solution procedure to increase its overall efficiency and flexibility. A white noise road roughness model was combined with a quarter-car model to yield an augmented state-space representation and the energy dissipation was calculated with the Lyapunov equation ( 43 ). It should be mentioned that this new formulation is also suitable for nonstationary, non-Gaussian road roughness input. One of the key conclusions of the authors was that the IRI may not be the best index for predicting the pavement roughness contribution to fuel consumption ( 43 ). This mathematical formulation was also used with a half-car model by using the Padé approximation of the pure time delay between the front and rear axle ( 44 ). The model sensitivity analysis was conducted to understand the effect of the following parameters: tire damping, tire stiffness, vehicle speed, and waviness number of the road profile. Tire damping made little change in total dissipated energy but had an effect on the comparison between the front and rear suspension. Dissipated energy increased considerably with tire stiffness and increased linearly with speed, since the latter is related directly with pavement roughness PSD (in Hz). Finally, waviness numbers of 2 and 2.45 were tested, which represent respectively the value for the ISO 8608 standard and the average value in the U.S.A. ( 44 ). It was found that a waviness number of 2.00 predicts 36% more dissipated energy compared to the 2.45 value ( 44 ).
Some authors have emphasized that road roughness is not a true stationary random process and, therefore, PSD would not correctly describe the real road profile. For instance, Lépine ( 45 ) developed a machine-learning-based algorithm to simulate road–vehicle vibrations by considering different excitation modes, such as the nonstationary vibrations induced by road roughness, vehicle-speed variations, shocks caused by pavement aberrations, and discontinuities and sinusoidal (harmonic) vibrations caused by unbalanced wheels and engine-borne vibrations. The limitations of PSD representation were shown more explicitly by Loprencipe and Zoccali ( 46 ). A two-parameter fitted PSD was used to represent road roughness of a 200 km segment of real road profile from which a corresponding artificial profile was generated ( 46 , 47 ). Three indexes (the IRI, frequency-weighted vertical acceleration, and dynamic load index) were calculated on both artificial and real profiles for comparison purposes ( 46 ). It was found that the use of artificial profiles may lead to different indexes than the use of real road profiles, even if they have the same classification parameters ( 46 ). Besides the nonstationary character of road roughness, which can explain these discrepancies, Loprencipe and Zoccali ( 46 ) mentioned that the linear approximation of the PSD (in a log-log scale) does not always provide a good representation of the PSD of real road profiles. In the opinion of Loprencipe and Zoccali ( 46 ), to correctly assess road pavement roughness and mainly its effects on users (e.g., ride quality), it is necessary to perform appropriate in situ measurements.
More recent studies considered the nonstationary nature of vehicle excitation caused by road roughness. Using evolutionary spectral theory, Zhang et al. ( 48 , 49 ) studied the nonstationary response of an accelerating vehicle suspension under random road excitation. A quarter-car model was simulated on Class-B and Class-C roads with various constant accelerations and it was found that the energy dissipation does not vary linearly with acceleration ( 48 ). Liu and Al-Qadi ( 50 ) showed, using a 21-degree-of-freedom heavy vehicle model circulating at constant speed on two correlated nonstationary road profiles, that overlooking local roughness variance can underestimate energy dissipation by 42%. Moreover, they showed that power dissipation more than doubled when the heavy vehicle speed increased from 48 to 113 km/h (from 30 to 70 mph). Therefore, the energy dissipation normalized with the distance traveled was roughly constant for different speeds ( 50 ). From the 21-degree-of-freedom heavy vehicle model representing a three-axle tractor hauling a two-axle semi-trailer, it was established that the tractor’s suspensions tend to dissipate 25% more energy than the semi-trailer’s suspensions ( 50 ). A parametric sensitivity analysis was performed to investigate the effect of the following heavy vehicle parameters on energy dissipation exclusively caused by road roughness: tire stiffness/damping, suspension stiffness/damping, cargo loading, and axle mass ( 50 ). The most important heavy vehicle parameter was tire stiffness, with a direct linear relationship to energy dissipation. On the other hand, the tire damping parameter had an insignificant effect on the energy dissipation. Also, energy dissipation was found to increase with suspension damping and decrease with suspension stiffness. Finally, energy dissipation was unaffected by the mass of the axle assembly and decreased with cargo loading, since a higher trailer sprung mass implies a smaller vibration intensity level in the vehicle chassis ( 50 ).
Macrotexture
Macrotexture is the uneven distribution of the pavement top layer mixture for wavelengths between 0.5 and 50 mm. Macrotexture, which is essential for skid resistance in wet pavement conditions, is also known to produce small-scale tire-tread deformations that dissipate energy ( 51 ). There is a consensus in the literature that a “rougher” pavement macrotexture implies higher RR, but there is still some confusion on “how much” RR increases with macrotexture and “how to quantify” macrotexture with respect to RR ( 52 ). The question of “how to quantify” is challenging because pavement-macrotexture evaluation is a science by itself that can be analyzed from various aspects, such as statistical geometric characteristics, spectral characteristics, and fractal/multifractal characteristics ( 53 ). These questions are relevant from a pavement engineering standpoint, since some authors believe there is a trade-off between grip performance and the RR caused by pavement macrotexture ( 54 ).
Wavelengths longer than macrotexture but shorter than road roughness (between 50 and 500 mm) can be referred to as megatexture ( 28 ). This range of wavelengths, too short to dynamically interact with vehicle suspensions and too long to deform vehicle tires, appears to have no effect on RR ( 55 ). No scientific literature specifically on this range of wavelengths has been found.
Two simple and commonly used metrics for pavement-macrotexture evaluation are the mean profile depth (MPD) and the root mean square (RMS) values of road elevation from the ISO 13473-1 and ISO 13473-2 standards, respectively ( 51 , 52 ). The former is basically the vertical distance between the average and the peak values. The latter is simply the RMS elevation value compared to the average elevation ( 52 ).
Hoever and Kropp ( 51 ) developed a waveguide finite-element tire model combined with a tire/road interaction model based on a convolution approach to simulate the small-scale tread deformations that contribute to RR. Hoever and Kropp considered in their simulations the tread pattern of the tire, since its influence is twofold: it defines which areas of the tire are in contact with the ground and it influences the dynamic tire response. Simulations were performed with real road profiles and the resulting RR was correlated linearly with the MPD and RMS.
The general trend is that MPD is a more accurate descriptor of macrotexture for RR predictions than the RMS ( 51 ). Hoever and Kropp showed that simulated RR and MPD have linear correlations, with R-squared values greater than 0.9. However, the slopes of the linear correlations obtained with simulated RR and experimental RR are significantly different. In the study of Hoever and Kropp, RR was separated in two distinct mechanisms: the global deformation of the tire structure (which is independent of the road surface) and the small-scale tread deformations. According to Hoever and Kropp ( 51 ), the latter mechanism could represent between 0% and 25% of the total RR and up to 50% for rough surface dressing (which is a bituminous surface treatment).
Andersen ( 52 ) argued that MPD is not an appropriate metric for RR prediction because it only considers one peak value and does not consider that the tire material will not go through every deep crack of the macrotexture. For this reason, a new metric called texture penetration depth was developed by considering the real tire deformation under the effect of a macrotexture profile ( 52 ). The main idea is to calculate the area of the peaks in the profile, instead of only considering the elevation of the maximum peak. Experimental validation showed that texture penetration depth is a better index than MPD in most cases ( 52 ).
Conceptually more sophisticated approaches, such as fractal representation, were considered by Rajaei et al. ( 54 ). It was proposed that a statistical parameter such as MPD is not an accurate metric because it is scale dependent and changes with sample length ( 54 ). It was shown that it is not always possible to define pavement surfaces with only one fractal dimension. The polishing effect of vehicle wheels in the driving direction, which results in a lower fractal dimension in that specific direction, could explain this conclusion ( 54 ).
Structure-Induced Rolling Resistance
SRR is the contribution of the pavement structure viscoelastic behavior to the RR of heavy vehicles. This phenomenon can be visualized and quantified as the energy dissipated in the hysteresis loop of the stress–strain history in a certain volume of pavement, or as the perpetual upward slope perceived by the wheels ( 56 ). These two reference frames are strictly equivalent from a thermodynamic point of view and are two physical manifestations of the same phenomenon ( 57 ). SRR is negligible for cars because of their small loads ( 58 ).
The steady-state response of different mathematical objects of infinite size under the effect of a moving load is a topic that has been studied for more than 50 years ( 59 – 62 ). More recently, this mechanistic modeling approach has been used to develop analytical models to quantify SRR ( 63 – 66 ). Specifically, top layers of a pavement (e.g., AC) can be represented as an Euler–Bernoulli beam ( 63 , 64 ), which is a mathematical object in one dimension that can, among other assumptions, deflect but not compress. A good summary of Euler–Bernoulli beam theory for SRR modeling can be found in the work of Nielsen ( 65 ). Pavement foundation can be “liquid” (Winkler foundation) with springs and dashpots in parallel ( 64 ) or “solid” (Pasternak foundation) with additional springs to simulate shear stress in the granular material of the foundation ( 65 ).
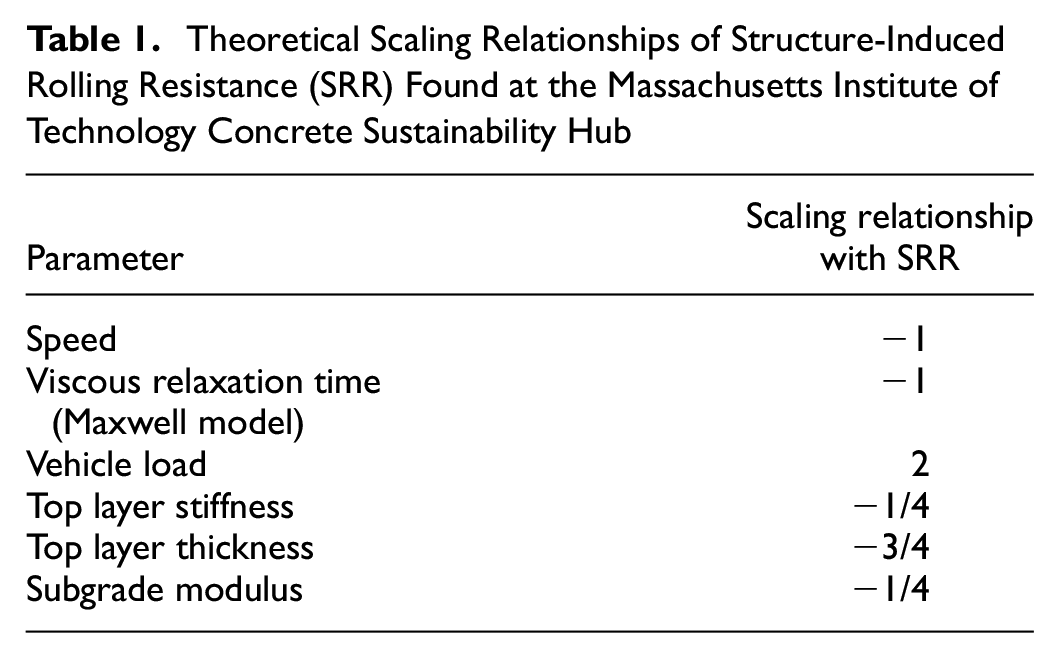
The mechanistic modeling approach has been used by the MIT Concrete Sustainability Hub to find the first-order “scaling relationships” of SRR ( 66 ). These “scaling relationships” define the proportionality between SRR and each of the relevant parameters. In short, the differential equation of an infinite elastic beam on an elastic foundation ( 67 ) was resolved in the Fourier domain ( 66 ). In accordance with the elastic-viscoelastic principle ( 68 ), the elastic modulus of the Euler–Bernoulli beam was substituted by the complex modulus equation, the latter being defined by the Maxwell equation. While it is true that the Maxwell model is much simpler ( 69 ) compared to accurate AC viscoelastic models ( 70 , 71 ), this MIT modeling choice was justified as only a small range of solicitation frequency is required ( 65 ). The MIT model was then used to calculate the SRR from the slope of the pavement at the application point of the load. Louhghalam et al. ( 66 ) defined as a “first order back-of-the-envelope engineering estimate” the scaling relationships of SRR indicated in Table 1, valid for a wide range of relevant velocities.
Theoretical Scaling Relationships of Structure-Induced Rolling Resistance (SRR) Found at the Massachusetts Institute of Technology Concrete Sustainability Hub
This mechanistic approach developed at the MIT Concrete Sustainability Hub was harshly criticized by Willis et al. ( 72 ) in a literature review made on the commission of the National Center for Asphalt Technology. The limitations identified by Willis et al. ( 72 ) cover many aspects, such as the vague definition of base layer stiffness, the missing distinction between a granular base and subgrade, failure to include base layer properties, questionable accuracy of the model, and infinite tire stiffness hypothesis.
Kim et al. ( 73 ) simulated a quarter-car model on a Euler–Bernoulli beam resting on a Winkler foundation using an augmented state-space representation, where the pavement model was representative of a rigid pavement. This general model can help to investigate if pavement deflection (at the origin of SRR) could somehow interact with RR caused by road roughness. More specifically, the energy dissipation (exclusively caused by road roughness) in both the suspension and the tire was investigated in the presence or the absence of pavement deflection. It was found that pavement deflection can be neglected for the calculation of energy dissipation caused by road roughness. It should be mentioned that the results of Kim et al. cannot necessarily be transposed to a flexible pavement.
Mechanistic models of SRR can be calibrated with in situ measurements. More precisely, equipment such as a falling weight deflectometer (FWD) or traffic speed deflectometer (TSD) that are typically used for pavement structural evaluation ( 74 – 78 ) can also be incorporated in backcalculation procedures to calibrate pavement-deflection models ( 79 ) that can be used for SRR calculation. A comparative study of three different modeling approaches to compute SRR was jointly presented by Oregon State University (OSU), Michigan State University (MSU), and MIT ( 80 ). FWD time series data were used to determine the unbound layer stiffness of 17 field test sections in California (flexible, composite, and semi-rigid pavements) and to develop relaxation modulus master curves to use for viscoelastic behavior modeling. The OSU model is a viscoelastic finite-element model (FEM) based on the implementation procedure of Pouget et al. ( 80 , 81 ). The MSU model allows calculating the deflection basin with a time domain viscoelastic dynamic solution (ViscoWave II – M) ( 82 ). As previously presented, the MIT model is a mechanistic model made of a viscoelastic beam on an elastic foundation ( 66 ). It was found that all models compute a significantly different SRR ( 80 ). The OSU and MSU models are more or less close, compared to the MIT model. The latter generally, but not systematically, predicted a lower SRR. None of these three models considered any damping contribution from the granular base or the sublayers.
Khazanovich and Booshehrian ( 79 ) raised concerns about the ability of the MIT model to properly describe pavement surface deflection, especially for a flexible pavement, because of its simplicity. Khazanovich and Booshehrian ( 79 ) developed a generalized Westergaard model consisting of a viscoelastic plate on a viscoelastic Winkler foundation that can describe the deflections of both rigid and flexible pavements under dynamic loading. FWD data and a backcalculation procedure involving a semi analytical solution based on Hankel transform in space and the finite difference method in time were used to calibrate the Westergaard model. It was shown that the viscoelastic behavior and inertial effect of the base and subgrade layers must be accounted for to correctly simulate pavement deflection ( 79 ).
This general conclusion was corroborated by the work of Nielsen, where a model consisting of a viscoelastic beam on a damped Pasternak foundation was developed for SRR calculation ( 65 ). This model was calibrated from TSD data of a 10 km AC road segment ( 65 ). It was established that the main damping contribution originated from the foundation ( 65 ). In addition, the foundation damping coefficient was correlated with vehicle speed, which indicates that the Kelvin–Voigt model (spring and dashpot in parallel) was not appropriate to fully describe it ( 65 ). It should be mentioned that the inertial effects in the foundation were neglected ( 65 ) based on the idea that these effects are much faster than the movement of the load ( 83 ).
SRR can also be quantified by simulating the pavement deflection under a moving load with numerical models ( 58 , 81 , 82 , 84–91). This approach was pioneered by Pouget et al. ( 81 ), where laboratory measurements of a complex modulus and Poisson’s ratio on a bituminous mix were used to mathematically define the behavior of the AC layers of a pavement structure FEM. The first studies that used a numerical approach used many simplifications and assumptions, such as a linearly elastic and isotropic foundation, constant normal pressure for tire/pavement contact, uniform temperature distribution in the pavement structure, a perfect bond between the different layers, and no inertial effects ( 58 , 81 ). These numerical models progressively increased in complexity over the years ( 56 , 82 , 84–90, 92 ) and the state of the art is now to use a FEM for pavement-deflection simulation by considering the following aspects: inertial effects, nonlinear granular material, three-dimensional (3D) dynamic contact stress at the tire/pavement interface, nonuniform temperature distribution in the AC layers, and interaction between pavement layers ( 91 ).
Numerical models show a clear distinction between flexible (e.g., asphalt) and rigid (e.g., cement) pavements in regards to SRR. It has been shown that SRR for a rigid pavement is almost negligible, because Portland cement concrete (PCC) is much stiffer than AC ( 86 , 89 ).
It is unanimous in the literature that the SRR of AC pavements increases exponentially with pavement temperature. Indeed, pavement deflection under a moving load varies with temperature because the AC complex modulus is highly thermosensitive ( 58 , 70 ). This exponential relationship was first underlined by Pouget et al. ( 81 ), where the maximum computed SRR was at 63°C. Beyond that temperature, the SRR actually starts to decrease since the AC layers behave more elastically. For a practical range of temperature, one could assume that the relationship between SRR and temperature is always exponential. The importance of considering the actual temperature gradient within the pavement for SRR calculation rather than the average temperature was investigated ( 87 ). Coleri and Harvey ( 87 ) found that the temperature gradient within the pavement is important for SRR calculation, as AC has nonlinear temperature-dependent properties. If the use of an average temperature is needed/wanted, it is better to use the temperature at one-third depth of the AC layers.
With respect to vehicle speed, it influences SRR because the solicitation frequency of the AC material is proportional to the speed of the applied load ( 70 , 71 ). Even if the first numerical study about SRR stated that the importance of speed is low ( 81 ), numerical models from more recent literature indicated that SRR decreases with vehicle speed ( 58 , 82 , 84 , 85 , 88 , 91 ). This result is expected, since a higher solicitation frequency implies a higher damping force, which reduces the pavement-deflection amplitude. However, the numerical study of Bazi et al. ( 89 ) seems to indicate that SRR generally increases with speed.
Chupin et al. ( 58 ) plotted SRR as a function of AC thickness. It has been demonstrated that SRR decreases exponentially with AC thickness and the former converges toward the case of homogeneous viscoelastic half-space at an AC thickness of 1 m ( 58 ). In a practical range of applications, AC thickness is always a relevant parameter for SRR calculation because this value never reaches 1 m ( 58 , 81 , 82 , 89 ). Balzarini et al. ( 82 ) calculated that a 50% increase in AC thickness caused an SRR decrease of 43.5% from its original value. However, Dhakal and Elseifi ( 88 ) claimed that SRR increases with AC thickness. They argued that a thicker AC layer would imply a larger volume of integration for energy dissipation, which results in a higher SRR ( 88 ). The latest studies use the concept of maximum pavement deflection (at certain baseline conditions) for SRR analysis, which is implicitly related to AC thickness, but also to all pavement structure stiffnesses ( 84 , 91 ).
The strong relationship between SRR and load characteristics was demonstrated by Chupin et al. ( 58 ), where the SRR of a car was found to be approximately 1/220 of the SRR of a heavy vehicle. The effect of load proximity from the different heavy vehicle tires has been investigated numerically in the literature and it was found that SRR can be accurately calculated by simulating one tire and multiplying the output by the number of tires on the vehicle ( 58 , 87 ). Recently, the effect of dynamic load on SRR was investigated numerically by Liu and Al-Qadi ( 91 ) and it was shown that ignoring dynamic loading effect could result in 12% error in SRR prediction. The latter result seems to indicate that road roughness can interact with SRR.
The effect of the four parameters mentioned above (temperature, speed, layer thicknesses/stiffnesses, and load characteristics) can be summarized in a straightforward regression equation ( 84 , 90 , 91 ). Estaji et al. ( 90 ) calculated the SRR from 720 FEM simulations with various input values to develop different versions of a regression model. One of the regression models predicted a higher SRR with a thicker top layer, which is contrary to what the literature usually indicates ( 58 , 82 ), and no validation tests were performed on the model ( 90 ). Another similar approach was developed by the Illinois Center for Transportation (ICT) with an exponential regression model ( 84 , 91 ). This nonlinear regression model showed good agreement with the FEM ( 84 ) and considered the dynamic load caused by road roughness ( 91 ). Overall, SRR depends strongly on the experimental conditions, and FEM simulations showed that EFC of a heavy vehicle caused by SRR is between 0.03% and 6.5% ( 84 ).
Laboratory Experiments
Road Roughness
Laboratory experiments on road roughness and heavy vehicle suspension energy dissipation are very limited since they are not practical experiments to carry out. Popov et al. ( 8 ) measured the RR of two heavy vehicle tires on a drum with a dynamically varying vertical load. It was found that the dynamic vertical load had no effect on the mean RR of the two tires tested ( 8 ). This is consistent with the various models developed ( 33 , 43 ).
Macrotexture
Testing the macrotexture effect on RR in the context of laboratory experiments requires use of a replica pavement surface. Tire manufacturers utilize roadwheel facilities as a standard measurement according to ISO standards, which must be carried out on steel drums ( 93 ). It is possible to modify those steel surfaces with a replica of a pavement surface and measure the corresponding RR ( 94 ). For instance, Larsen et al. ( 95 ) used a series of sandpapers of different grit sizes representing different pavement macrotextures on a drum and a clear correlation between measured RR and macrotexture was found. However, making more realistic pavement surface replicas for drums is a time- and money-consuming procedure and the correlation of results with results from in situ measurements is not perfect ( 93 ).
Another type of laboratory RR experiment with road surface replicas is to roll tires in a circular trajectory on a flat surface that replicates the macrotexture ( 96 ). Araújo et al. ( 96 ) developed an experimental setup made of two symmetrical arms equipped with car wheels at the outer ends that turn around a vertical shaft and the wheels were driven by an electric motor. This experimental setup allowed correlation between the surface texture characteristics and the energy consumed by the electric motor, which is directly related to RR. Different artificial neural networks based on the experimental data were developed to model energy consumption ( 96 ). It was found that the best model required only three inputs: speed, load, and mean texture depth (MTD) ( 96 ), the latter being defined by the ISO 13036-1 standard. The extent of the results from this study is somewhat limited because the maximum speed was limited to 20 km/h. Moreover, the load was varied only from 700 to 1000 N and it is unclear if the circular trajectory of the tires can affect their interaction with the pavement macrotexture.
A conceptually similar approach was developed with a modified version of a Wehner/Schulze machine originally used to simulate the polishing effect induced by traffic on road surfaces ( 97 ). Three rubber cones were mounted on a rotary head and rolled over a 225 mm diameter disc that reproduced the macrotexture of a pavement ( 98 ). The coefficient of RR was found by measuring the torque necessary to maintain a constant angular speed ( 98 ). The values were normalized and showed a good level of correlation with the experimental values. Results indicated that an MPD of 1.5 mm can increase the RR coefficient by 22.8% compared with a perfectly smooth surface with an MPD of 0 mm.
Ejsmont and Sommer ( 99 ) conducted a pilot study on the impact of the pavement texture on the RR of passenger car tires. A special method was developed based on casting an imprint of the tire/pavement contact in self-vulcanizing rubber. With this experiment, Ejsmont and Sommer ( 99 ) visually compared the pavement/tire interaction for different macrotextures. This experiment supports the idea that appropriate macrotexture metrics must consider the “enveloping” of the surface, which is the macrotexture perceived by the tire tread. Ejsmont and Sommer ( 99 ) argued that the increase of RR on pavements with high MPD is not caused by the cavities being deeper and more specious, but rather because the summits are sharper and less congested.
Structure-Induced Rolling Resistance
In 2015, Akbarian designed a small-scale experiment to investigate the effects of vertical load, wheel speed, and top layer thickness on SRR. To reproduce MIT’s pavement mechanistic model, Mack et al. ( 100 ) recreated the deflection of a viscoelastic beam on an elastic subgrade using a two-layered silicone elastomer under the effect of a small moving wheel. By using photoelasticity techniques, the asymmetric deflection distribution inside the material revealed the perpetual upward slope perceived by the wheel. From the 200 experimental configurations that were performed, the laboratory scaling relationships of SRR were in good agreements with the theoretical values in Table 1.
In Situ Measurements
RR laboratory test methods, designed for tires and standardized by the ISO and SAE, lack consideration of realistic roads ( 101 ). Measuring the influence of pavement characteristics on RR is a difficult technical challenge because its contribution to the overall RR is relatively small compared to other factors, such as aerodynamic drag and tire hysteresis ( 4 ). Many disturbing factors can affect the measurements, such as road grade, acceleration/deceleration, load misalignment, temperature variations, and tire inflation pressure variation ( 93 , 102 , 103 ). Moreover, the operating conditions,, such as road wetness and the presence of ice and snow, can significantly affect RR, with cooling effects of the tire and hydrodynamic effects ( 104 , 105 ).
There are many approaches in the literature to measure with an in situ approach the pavement contribution to RR or overall RR under real driving conditions, such as coast-down tests ( 106 ), driving torque measurements ( 107 ), instantaneous fuel consumption measurements ( 39 ), accelerometers on vehicle suspensions ( 22 ), the TSD ( 108 ), and an instrumented/modified trailer ( 109 ). The latter method is typically used for car tires ( 110 ), but the general trends obtained from this method are likely similar for heavy vehicle tires. Instrumented trailers/semi-trailers designed for skid resistance measurements are sometimes presented as devices that can also measure RR ( 111 ), but no scientific literature in that regard has been found.
Coast-down tests, driving torque measurements, and instantaneous fuel consumption measurements include implicitly the effects of many driving resistance forces that are not related to RR. To isolate the effect of RR, an appropriate vehicle model that includes every parameter affecting energy consumption (e.g., aerodynamic drag, engine efficiency) must be used ( 112 , 113 ). Since pavement contribution to RR is relatively small, the precision of these methods is therefore limited ( 106 ).
RR is sometimes presented in the literature as a so-called RR torque on a free rolling vehicle wheel ( 9 ). However, this is a theoretical definition since the sum of the moments applied on the axle of the wheel is zero. Indeed, the energy dissipation from the viscoelastic behavior of the tire material creates an asymmetric pressure distribution at the contact patch ( 114 ). Therefore, the vertical force vector is shifted in front of the wheel axle ( 114 ), which balances the so-called RR torque. For this reason, torque measurements on a non-driven wheel are not suitable for RR measurements.
Road Roughness
In 2006, a study was prepared for the Missouri Department of Transportation to investigate the effect of road roughness on fuel efficiency ( 115 ). Fuel consumption measurements were performed on four “dump trucks” (13.3 tons each) before and after pavement resurfacing. Changing the IRI from 2.06 to 0.96 m/km was found to improve the average fuel economy from 2.54 to 2.60 km per liter (km/L), representing a 2.4% improvement in fuel consumption.
Chatti and Zaabar ( 39 ) used instantaneous fuel consumption measurements on a heavy vehicle (36.3 tons) from engine control unit (ECU) data to establish a linear correlation between the IRI and the EFC. In accordance with the HDM-4 model ( 40 ), EFC is zero when the IRI has a value of 1 m/km. They concluded that EFC would increase by 1.45% for every 1 m/km increase in the IRI ( 39 ).
A more sophisticated approach was used by Paterlini et al. ( 22 ) at the MnROAD facility in a study for the Minnesota Department of Transportation with measurements on two highway sections made of AC and PCC pavements. The RR coefficient of a heavy vehicle (36.2 tons) was calculated with experimental fuel consumption measurements from ECU data and accelerometers mounted on axles and frame rails ( 22 ). The average suspension energy dissipation was computed in the spectral domain with the integral of the PSD and constant theoretical damping coefficients. It was found that the average total RR coefficients were 0.0072 and 0.0061 for AC and PCC, respectively ( 22 ). However, RR caused by road roughness was higher for PCC pavements compared to AC pavements. Looking at the accelerometer’s spectral density for PCC pavements, it was suggested by Paterlini et al. ( 22 ) that the joints between PCC panels may be responsible for this higher energy loss. According to Paterlini et al. ( 22 ), road roughness contributes 10% or less to total RR.
Macrotexture
A linear relationship between the MPD and EFC of a heavy vehicle (36.3 tons) was established from ECU instantaneous fuel consumption measurements ( 39 ). Chatti and Zaabar ( 39 ) have reported that EFC was almost 4% when the MPD went from 0.5 to 3 mm. According to Chatti and Zaabar ( 39 ), the macrotexture effect on RR of a heavy vehicle decreases when the vehicle speed increases, which contradicts the observations reported by Sandberg ( 55 ).
Karlsson et al. ( 116 ) performed a study ordered by the Swedish Road Administration where coast-down tests were performed on a car and a heavy vehicle in an attempt to obtain reliable estimates of how macrotexture (MPD) and unevenness (IRI) affect RR. They reported that the MPD’s influence on a heavy vehicle RR seems lower than for a car ( 116 ). However, Karlsson et al. mentioned that coast-down test results of the heavy vehicle were “unstable” and it was difficult to draw any definitive conclusions. In the opinion of Karlsson et al. ( 116 ), the precision in results was disappointing considering the very large amount of coast-down measurements that were performed.
Coast-down tests and driving torque measurements are the two oldest methods to assess the RR of cars under real driving conditions ( 117 ). To rigorously compare coast-down tests with driving torque measurements, differences in powertrain loss from the use of neutral gear ( 118 ) and driving torque effect on tire RR should be considered ( 9 ). Cenek ( 107 ) performed an experimental campaign in New Zealand on a typical “tire/car combination” and showed that driving torque measurements are more suitable than coast-down tests for RR evaluation on public roads. Cenek ( 107 ) compared a wide variety of macrotextures and the largest difference in RR coefficient between the coarsest-textured surface and the smoothest was found to be 55%.
It is possible to measure the RR force of a car tire under real driving conditions with an in situ approach using an instrumented trailer ( 94 , 119–121). One of the world’s few examples of this type of instrumentation is the R2 Mk2 trailer developed at the Technical University of Gdańsk ( 109 ). Ejsmont et al. ( 119 , 120 ) used the R2 Mk.2 trailer during a study for the Minnesota Department of Transportation to measure RR at the MnROAD facility, which included a wide variety of pavement types and surface textures. It was found that the relative difference between surfaces with the lowest and highest RR coefficients was 33% (outlier data excluded) ( 119 ). Also, a correlation between MPD and RR measurements from AC pavements was found, but this correlation was statistically not significant with RR measurements from PCC pavements ( 119 ). Overall, pavement surfaces with the lowest RR tend to be AC with dense graded aggregates and PCC with broom and turf drag surfaces ( 120 ). Ejsmont et al. ( 119 ) concluded that MPD may not be the best parameter to represent pavement macrotexture.
The R2 Mk.2 trailer was used to investigate the effect of pavement (AC) wetness on RR ( 104 ). It was found that the thickness of the water film (on the pavement) can increase RR by up to 50% because of the cooling of the tire and hydrodynamic effects ( 104 ). Ejsmont et al. ( 104 ) concluded that pavement surfaces with larger aggregate size, which typically involve a higher macrotexture, can drain water more easily, resulting in lower RR increase during “very-wet” conditions.
Structure-Induced Rolling Resistance
TSD is primarily capable of evaluating the pavement conditions at the network level in regard to structural capacities ( 76 ). Also, TSD can be used for direct measurement of SRR on a heavy vehicle axle ( 108 ). Indeed, the deflection slope measured by the Doppler lasers can be used to estimate the upward slope perceived by the wheel by doing an interpolation between the two nearest sensors of the tire ( 108 ). With this method, the experimental SRR coefficient was found to be in the range of 0.005%–0.05% ( 108 ). TSD measurements on a fully loaded 10-ton axle at a speed between 50 and 60 km/h were made on a 10 km AC road section and it was found that the SRR coefficient increased on average by 59% when the temperature increased from 18°C to 35°C ( 122 ). This increase was variable with a maximum value of 400% ( 122 ).
Pavement Type
Taylor and Patten ( 25 ) used fuel consumption measurements of a heavy vehicle from ECU data on PCC, AC, and composite pavements to detect if any fuel consumption change could be attributed to any of these pavement types. The tests were conducted during different seasons in Canada with three different loads at speeds of 60 and 100 km/h. Only pavements with an IRI under 1.6 m/km were considered ( 25 ). It was found that, at a speed of 100 km/h, average fuel consumption reductions were realized on every PCC pavement compared to AC pavement. The average fuel savings (PCC versus AC) ranged from 0.4 to 0.7 L/100 km (0.8%–1.8%). During summer day conditions, composite pavements consumed on average 0.5 L/100 km (1.5%) less fuel than PCC (composite versus PCC). However, PCC had a better performance than the composite in every other conditions with average fuel savings (PCC versus composite) ranging from 0.2 to 1.5 L/100 km (0.8%–3.1%) ( 25 ).
Sumitsawan et al. ( 123 ) used fuel flow meters as measuring devices to investigate the effect of pavement surface type on the fuel consumption of a van (weight and model unspecified). Two new PCC and AC pavement sections with an IRI difference of only 3% were used for this experiment ( 123 ). The average fuel consumption was found to be 9.57 and 10.0 L/100 km for the PCC and AC, respectively. The physical mechanisms explaining this fuel consumption difference probably originate from pavement macrotexture, since SRR is negligible for a car load ( 58 ).
Butt et al. ( 20 ) performed a study intended for the California Department of Transportation and investigated the effect of pavement deflection on the fuel consumption of various types of vehicles by comparing the results obtained from different pavement types. It was found that only the tractor semi-trailer vehicle type showed any meaningful difference between tested pavement sections, but that variability was not tied to pavement type and was only present under certain conditions of speed, tailwind, and air temperature ( 20 ). No clear correlation between pavement type and fuel consumption was measured experimentally ( 20 ). In the opinion of Butt et al. ( 20 ), missing variables need to be reduced in further experiments to isolate the effect of pavement type on fuel consumption.
Conclusion
This literature review presents the effects of pavement properties on heavy vehicle RR with respect to the three main phenomena involved: road roughness, macrotexture, and SRR. Each phenomenon was separated under three angles of analysis: theoretical modeling, laboratory experiments, and in situ measurements. Overall, modeling of the SRR and road roughness effect is quite advanced, but macrotexture modeling is still at the point of understanding the underlying physical mechanisms. Direct measurements of the road roughness effect and SRR at a heavy vehicle scale are difficult to perform in the context of laboratory experiments. However, there is strong evidence from laboratory experiments and in situ measurements that pavement macrotexture has the potential to significantly affect RR. This assertion is supported by direct in situ RR measurements of car tires.
Many approaches exist in the literature to measure heavy vehicle RR and the influence of pavement properties, but the results obtained between the different authors are difficult to compare and are sometimes inconsistent. Indeed, some authors present a clear correlation between heavy vehicle RR and pavement properties and others claimed that no significant differences have been observed. The majority of the in situ RR measurements of heavy vehicles are based on an indirect approach and are not subjected to any standardization. It appears that the current bottleneck of the scientific research on this topic is the fundamental inability to measure heavy vehicle RR with a direct in situ approach under real driving conditions. To change the status quo of road network management with respect to RR optimization of heavy vehicle traffic, modeling only will not be sufficient and clear experimental evidence is needed.
Footnotes
Author Contributions
The authors confirm contribution to the paper as follows: study conception and design: W. Levesque, A. Bégin-Drolet, J. Lépine; data collection: W. Levesque, A. Bégin-Drolet, J. Lépine; analysis and interpretation of results: W. Levesque, A. Bégin-Drolet, J. Lépine; draft manuscript preparation: W. Levesque, A. Bégin-Drolet, J. Lépine. All authors reviewed the results and approved the final version of the manuscript.
Declaration of Conflicting Interests
The author(s) declared no potential conflicts of interest with respect to the research, authorship, and/or publication of this article.
Funding
The author(s) received no financial support for the research, authorship, and/or publication of this article.